

Projected Wind Energy Maximum Potential in Lithuania

Abstract
1. Introduction
2. Methodology
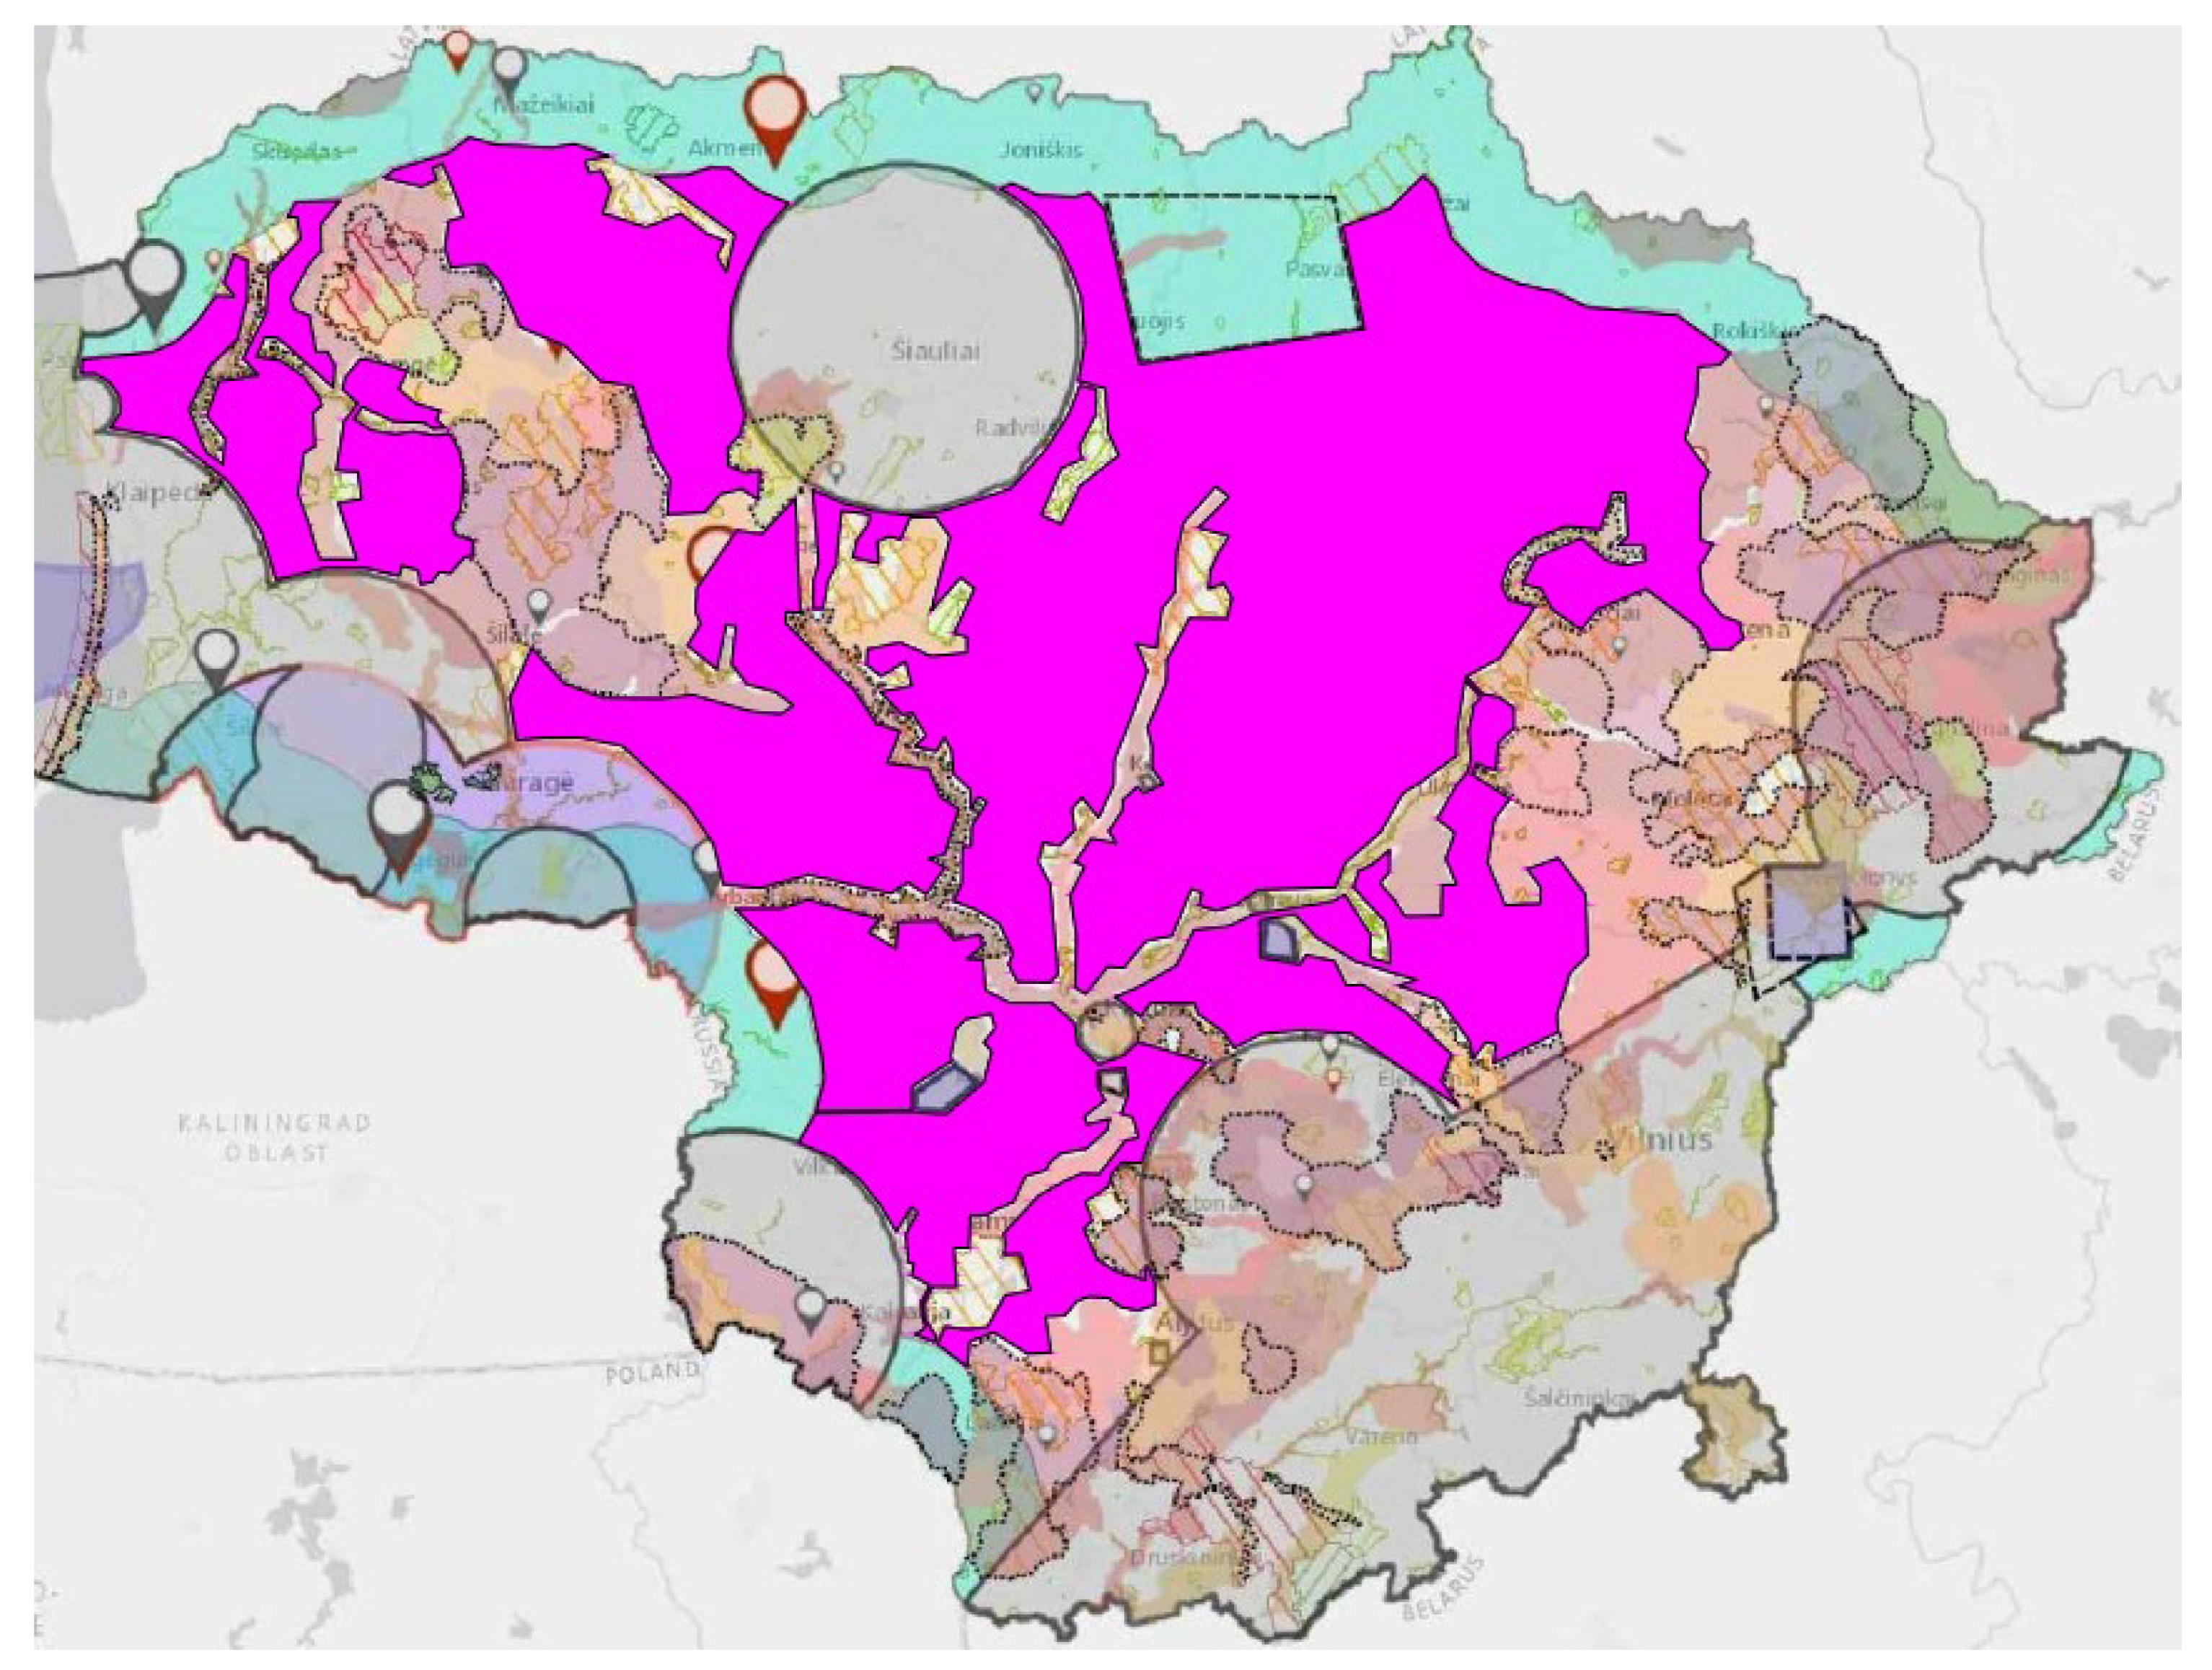
2.1. Area Identification and Turbine Description
2.2. Climate Data Sources
2.3. Energy Analysis
2.4. Software
3. Results
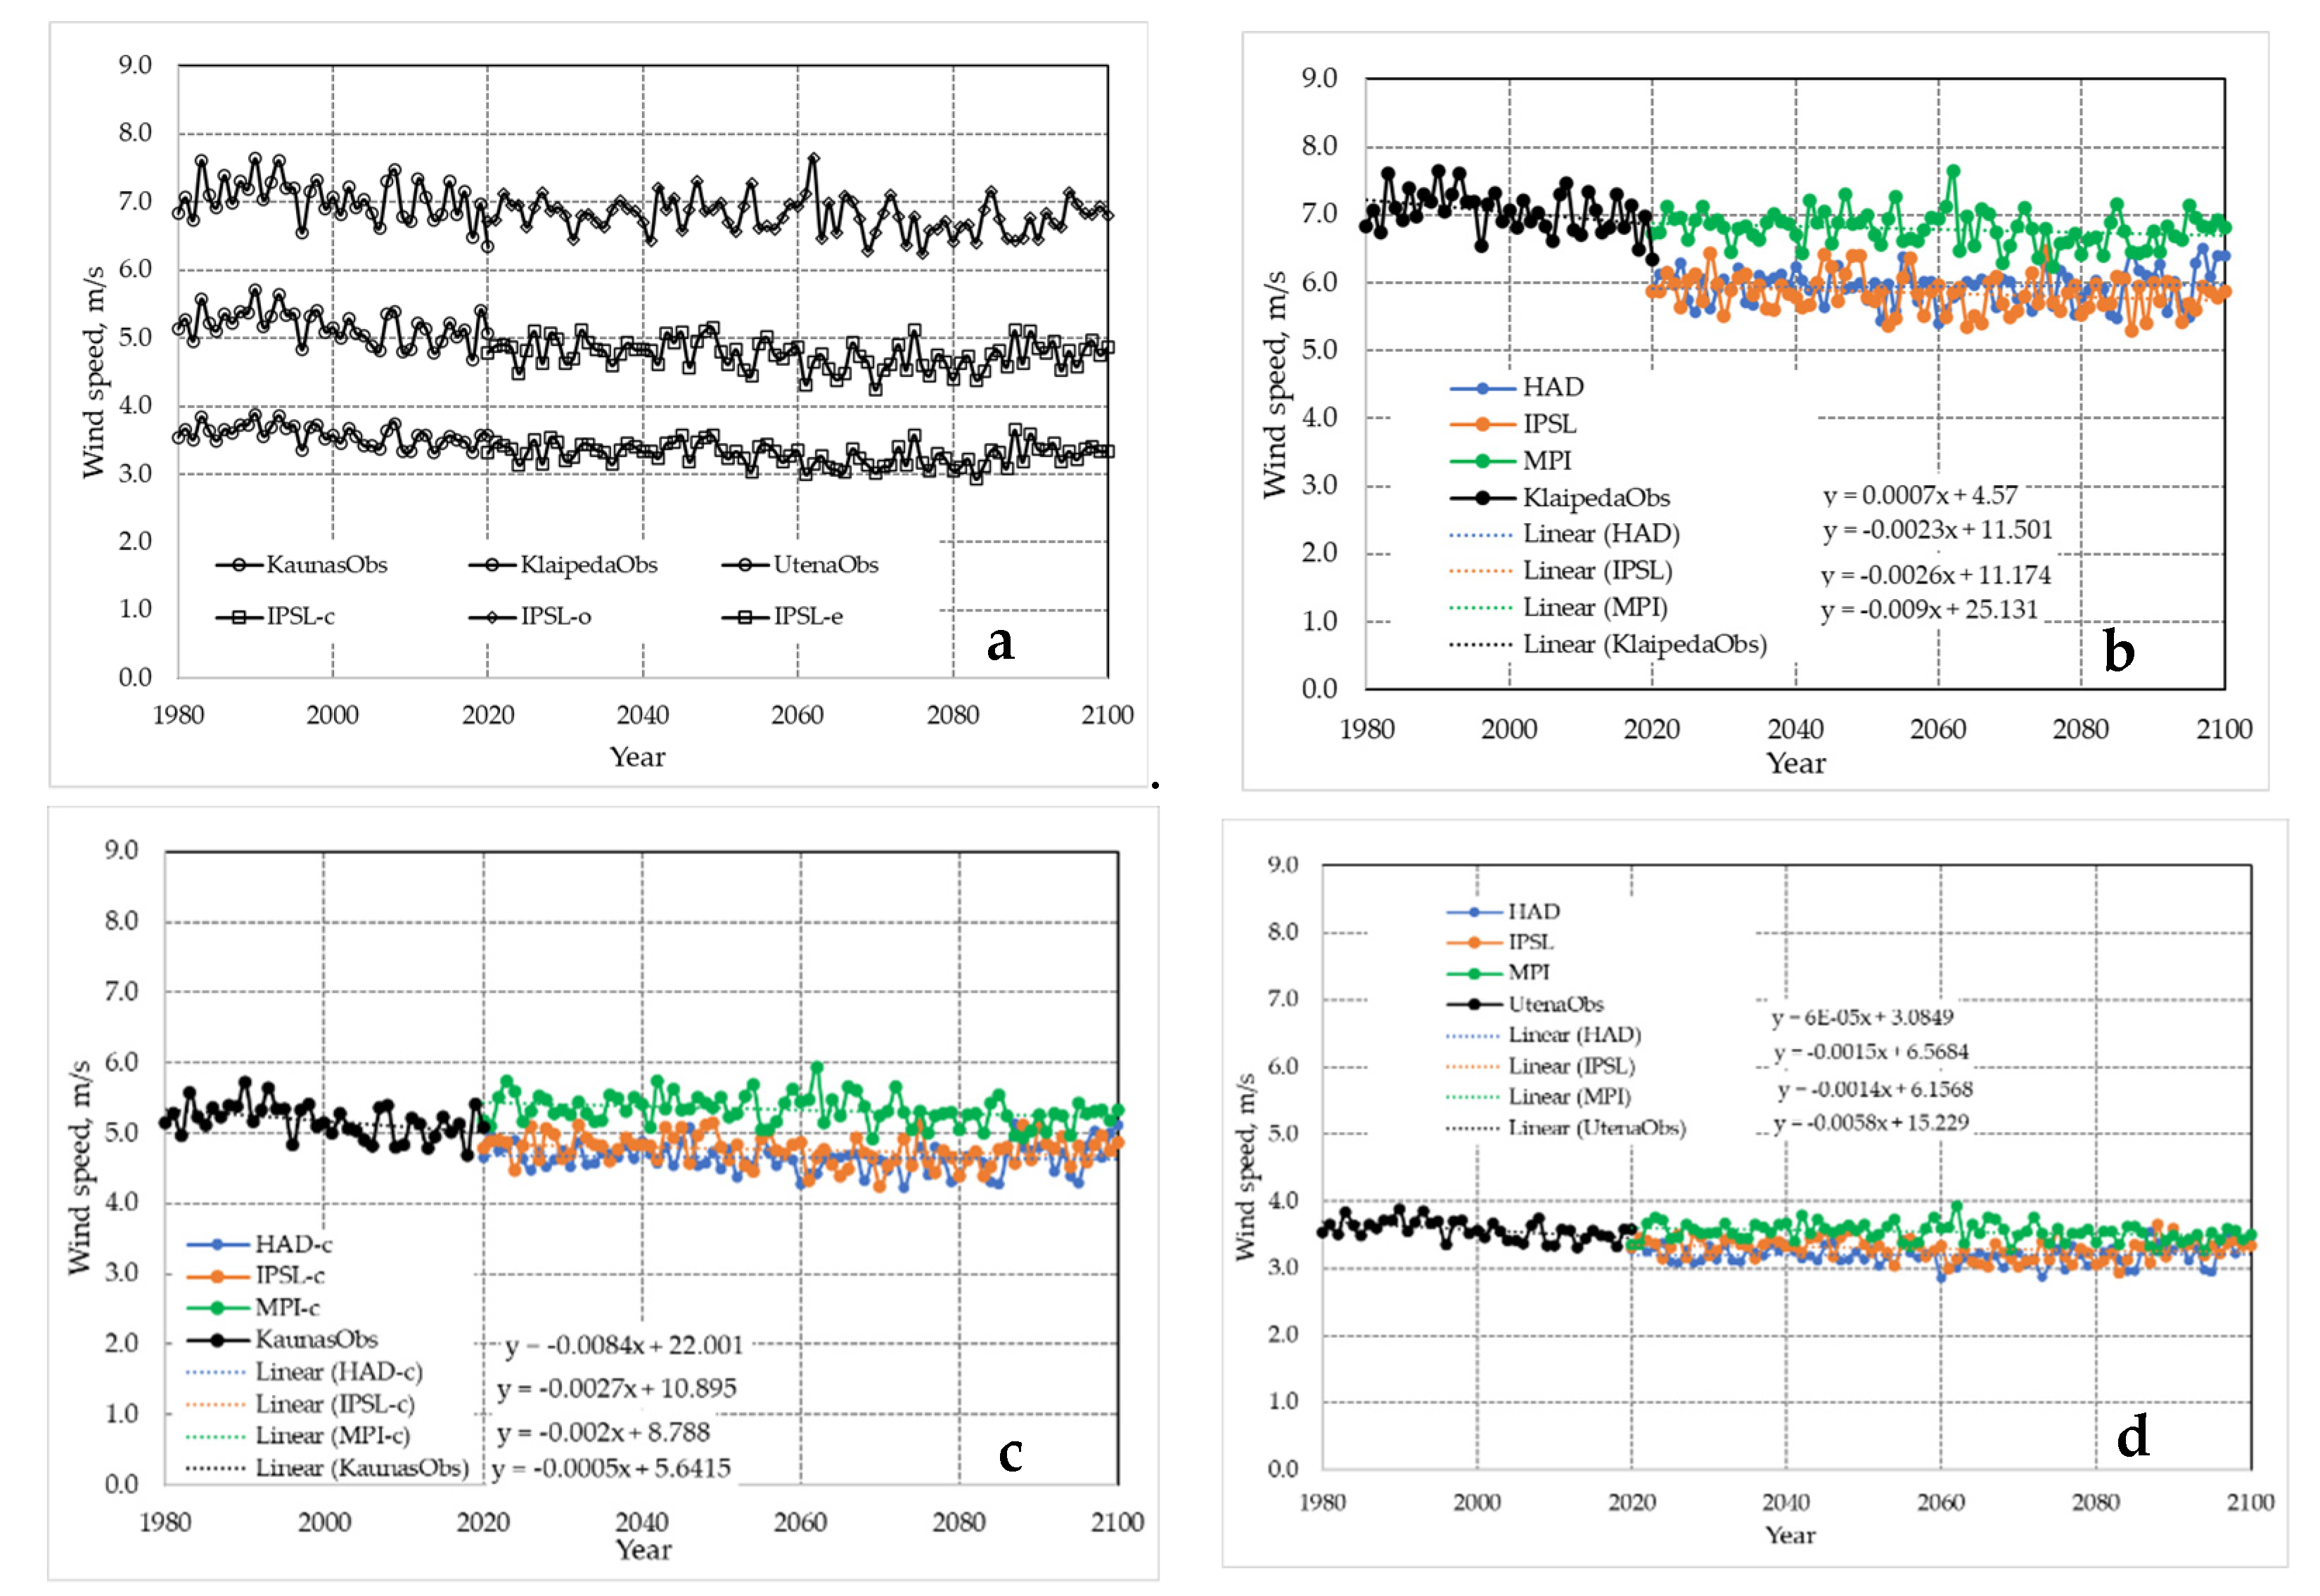
3.1. Wind Speed
3.2. Energy Potential
3.3. Energy Potential with Alternative Wind Turbines
4. Discussion
5. Conclusions
Author Contributions
Funding
Conflicts of Interest
References
- Intergovernmental Panel on climate change, working group I. Technical Summary. In Climate Change 2013-The Physical Science Basis; Cambridge University Press: Cambridge, UK, 2014; pp. 31–116. [Google Scholar]
- Unfccc. ADOPTION OF THE PARIS AGREEMENT-Paris Agreement Text English; UNFCCC: Bonn, Germany, 2015. [Google Scholar]
- Arantegui, R.L.; Jäger-waldau, A. Photovoltaics and wind status in the European Union after the Paris Agreement. Renew. Sustain. Energy Rev. 2018, 81, 2460–2471. [Google Scholar] [CrossRef]
- DIRECTIVES DIRECTIVE (EU) 2018/2001 OF THE EUROPEAN PARLIAMENT AND OF THE COUNCIL of 11 December 2018 on the promotion of the use of energy from renewable sources (recast) (Text with EEA relevance). Available online: https://eur-lex.europa.eu/legal-content/EN/TXT/?uri=uriserv:OJ.L_.2018.328.01.0082.01.ENG (accessed on 22 December 2022).
- Zappa, W.; van den Broek, M. Analysing the potential of integrating wind and solar power in Europe using spatial optimisation under various scenarios. Renew. Sustain. Energy Rev. 2018, 94, 1192–1216. [Google Scholar] [CrossRef]
- Davy, R.; Gnatiuk, N.; Pettersson, L.; Bobylev, L. Climate change impacts on wind energy potential in the European domain with a focus on the Black Sea. Renew. Sustain. Energy Rev. 2018, 81, 1652–1659. [Google Scholar] [CrossRef]
- Renewable Energy Statistics 2019. Available online: https://www.irena.org/publications/2019/Jul/Renewable-energy-statistics-2019 (accessed on 17 June 2021).
- Hueging, H.; Haas, R.; Born, K.; Jacob, D.; Pinto, J.G. Regional changes in wind energy potential over Europe using regional climate model ensemble projections. J. Appl. Meteorol. Climatol. 2013, 52, 903–917. [Google Scholar] [CrossRef]
- Solaun, K.; Cerdá, E. Impacts of climate change on wind energy power–Four wind farms in Spain. Renew. Energy 2020, 145, 1306–1316. [Google Scholar] [CrossRef]
- Schaeffer, R.; Szklo, A.S.; Lucena, A.F.P.; Borba, B.S.M.C.; Nogueira, L.P.P.; Fleming, F.P.; Troccoli, A.; Harrison, M.; Boulahya, M.S. Energy sector vulnerability to climate change: A review. Energy 2012, 38, 1–12. [Google Scholar] [CrossRef]
- Drücke, J.; Borsche, M.; James, P.; Kaspar, F.; Pfeifroth, U.; Ahrens, B.; Trentmann, J. Climatological analysis of solar and wind energy in Germany using the Grosswetterlagen classification. Renew. Energy 2021, 164, 1254–1266. [Google Scholar] [CrossRef]
- Statistika|Lietuvos Respublikos Energetikos Ministerija. Available online: https://enmin.lrv.lt/lt/veiklos-sritys-3/atsinaujinantys-energijos-istekliai/statistika (accessed on 2 January 2022).
- Harvey, L.D.D. The potential of wind energy to largely displace existing Canadian fossil fuel and nuclear electricity generation. Energy 2013, 50, 93–102. [Google Scholar] [CrossRef]
- Sadorsky, P. Wind energy for sustainable development: Driving factors and future outlook. J. Clean. Prod. 2021, 289, 125779. [Google Scholar] [CrossRef]
- Bórawski, P.; Bełdycka-Bórawska, A.; Jankowski, K.J.; Dubis, B.; Dunn, J.W. Development of wind energy market in the European Union. Renew. Energy 2020, 161, 691–700. [Google Scholar] [CrossRef]
- Kariniotakis, G.; Mayer, D.; Moussafir, J.; Chevallaz-Perrier, R.; Usaola, J.; Sanchez, I.; Marti, I.; Madsen, H.; Nielsen, T.S.; Lac, C.; et al. HAL Id: Hal-00530475 Anemos: Development of a Next Generation Wind Power Forecasting System for the Large-Scale Integration of Onshore & Offshore Wind Farms ANEMOS: Development of a Next Generation Wind Power Forecasting System for the Large-Scale Integration of Onshore & Offshore Wind Farms. 2003. Available online: https://hal-mines-paristech.archives-ouvertes.fr/hal-00530475 (accessed on 22 June 2021).
- Müller, D.K.; Morton, P.T. The space, the time, and the money. Wind energy politics in East Germany. Environ. Innov. Soc. Transit. 2021, 40, 62–72. [Google Scholar] [CrossRef]
- Masson-Delmotte, V.; Zhai, P.; Pörtner, H.; Roberts, D.; Skea, J.; Shukla, P.R.; Pirani, A.; Moufouma-Okia, W.; Péan, C.; Pidcock, R.; et al. Global Warming of 1.5 °C An IPCC Special Report on the Impacts of Global Warming of 1.5 °C above Pre-Industrial Levels and Related Global Greenhouse Gas Emission Pathways, in the Context of Strengthening the Global Response to the Threat of Climate Change, Sustainable Development, and Efforts to Eradicate Poverty Edited by Science Officer Science Assistant Graphics Officer Working Group I Technical Support Unit. 2019. Available online: https://www.environmentalgraphiti.org (accessed on 22 June 2021).
- Tobin, I.; Jerez, S.; Vautard, R.; Thais, F.; Van Meijgaard, E.; Prein, A.; Déqué, M.; Kotlarski, S.; Maule, C.F.; Nikulin, G.; et al. Climate change impacts on the power generation potential of a European mid-century wind farms scenario. Environ. Res. Lett. 2016, 11, 034013. [Google Scholar] [CrossRef]
- Hosking, J.S.; MacLeod, D.; Phillips, T.; Holmes, C.R.; Watson, P.; Shuckburgh, E.F.; Mitchell, D. Changes in European wind energy generation potential within a 1.5 °C warmer world. Environ. Res. Lett. 2018, 13, 054032. [Google Scholar] [CrossRef]
- Carvalho, D.; Rocha, A.; Gómez-Gesteira, M.; Santos, C.S. Potential impacts of climate change on European wind energy resource under the CMIP5 future climate projections. Renew. Energy 2017, 101, 29–40. [Google Scholar] [CrossRef]
- Solaun, K.; Cerdá, E. Climate change impacts on renewable energy generation. A review of quantitative projections. Renew. Sustain. Energy Rev. 2019, 116, 109415. [Google Scholar] [CrossRef]
- Van Vuuren, D.P.; Edmonds, J.; Kainuma, M.; Riahi, K.; Thomson, A.; Hibbard, K.; Hurtt, G.C.; Kram, T.; Krey, V.; Lamarque, J.-F.; et al. The representative concentration pathways: An overview. Clim. Change 2011, 109, 5–31. [Google Scholar] [CrossRef]
- Dessens, O.; Anandarajah, G.; Gambhir, A. Limiting global warming to 2 °C: What do the latest mitigation studies tell us about costs, technologies and other impacts? Energy Strateg. Rev. 2016, 13–14, 67–76. [Google Scholar] [CrossRef]
- Meinshausen, M.; Nicholls, Z.R.J.; Lewis, J.; Gidden, M.J.; Vogel, E.; Freund, M.; Beyerle, U.; Gessner, C.; Nauels, A.; Bauer, N.; et al. The shared socio-economic pathway (SSP) greenhouse gas concentrations and their extensions to 2500. Geosci. Model Dev. 2020, 13, 3571–3605. [Google Scholar] [CrossRef]
- SSP Scenario Database-SSPs-IIASA. Available online: https://iiasa.ac.at/web/home/research/researchPrograms/Energy/SSP_Scenario_Database.html (accessed on 1 January 2022).
- Noël, T.; Loukos, H.; Defrance, D.; Vrac, M.; Levavasseur, G. A high-resolution downscaled CMIP5 projections dataset of essential surface climate variables over the globe coherent with the ERA5 reanalysis for climate change impact assessments. Data Br. 2021, 35, 106900. [Google Scholar] [CrossRef]
- Gonzalez, P.L.M.; Brayshaw, D.J.; Zappa, G. The contribution of North Atlantic atmospheric circulation shifts to future wind speed projections for wind power over Europe. Clim. Dyn. 2019, 53, 4095–4113. [Google Scholar] [CrossRef]
- Enevoldsen, P.; Permien, F.-H.; Bakhtaoui, I.; von Krauland, A.-K.; Jacobson, M.Z.; Xydis, G.; Sovacool, B.K.; Valentine, S.V.; Luecht, D.; Oxley, G. How much wind power potential does europe have? Examining european wind power potential with an enhanced socio-technical atlas. Energy Policy 2019, 132, 1092–1100. [Google Scholar] [CrossRef]
- VĖJO JĖGAINIŲ REGLAMENTAVIMO ŽEMĖLAPIS. Available online: https://www.arcgis.com/apps/webappviewer/index.html?id=454b061279f841239edd90389f5ff6b9 (accessed on 27 December 2021).
- Enevoldsen, P.; Permien, F.-H. Mapping the Wind Energy Potential of Sweden: A Sociotechnical Wind Atlas. J. Renew. Energy 2018, 2018, 1650794. [Google Scholar] [CrossRef]
- Sliz-Szkliniarz, B.; Vogt, J. GIS-based approach for the evaluation of wind energy potential: A case study for the Kujawsko-Pomorskie Voivodeship. Renew. Sustain. Energy Rev. 2011, 15, 1696–1707. [Google Scholar] [CrossRef]
- Noorollahi, Y.; Jokar, M.A.; Kalhor, A. Using artificial neural networks for temporal and spatial wind speed forecasting in Iran. Energy Convers. Manag. 2016, 115, 17–25. [Google Scholar] [CrossRef]
- Europe’s Green Deal Plan Unveiled–POLITICO. Available online: https://www.politico.eu/article/the-commissions-green-deal-plan-unveiled/ (accessed on 29 January 2022).
- Talpur, S.; Wallnerström, C.J.; Flood, C.; Hilber, P. Dynamic line rating for wind power. J. Renew. Sustain. Energy 2016, 8. [Google Scholar] [CrossRef]
- Wilcke, R.A.I.; Mendlik, T.; Gobiet, A. Multi-variable error correction of regional climate models. Clim. Chang. 2013, 120, 871–887. [Google Scholar] [CrossRef]
- Navarro-Racines, C.; Tarapues, J.; Thornton, P.; Jarvis, A.; Ramirez-Villegas, J. High-resolution and bias-corrected CMIP5 projections for climate change impact assessments. Sci. Data 2020, 7, 7. [Google Scholar] [CrossRef]
- Jankevičienė, J.; Kanapickas, A. Projected Near-Surface Wind Speed Trends in Lithuania. Energies 2021, 14, 5425. [Google Scholar] [CrossRef]
- Duffy, A.; Hand, M.; Wiser, R.; Lantz, E.; Riva, A.D.; Berkhout, V.; Stenkvist, M.; Weir, D.; Lacal-Arántegui, R. Land-based wind energy cost trends in Germany, Denmark, Ireland, Norway, Sweden and the United States. Appl. Energy 2020, 277, 114777. [Google Scholar] [CrossRef]
- Gao, Y.; Ma, S.; Wang, T. The impact of climate change on wind power abundance and variability in China. Energy 2019, 189, 116215. [Google Scholar] [CrossRef]
- Emejeamara, F.C.; Tomlin, A.S. A method for estimating the potential power available to building mounted wind turbines within turbulent urban air flows. Renew. Energy 2020, 153, 787–800. [Google Scholar] [CrossRef]
- Map Projection in Detail Coordinate Reference System (CRS) in Detail Universal Transverse Mercator (UTM) CRS in Detail On-The-Fly Projection. 2020, p. 2020. Available online: https://docs.qgis.org/3.16/en/docs/gentle_gis_introduction/spatial_analysis_interpolation.html (accessed on 29 January 2022).
- Jankevičienė, J.; Kanapickas, A. Impact of Climate Change on Wind Potential in Lithuania Territory. Environ. Clim. Technol. 2022, 26, 1–11. [Google Scholar] [CrossRef]
- Martinez, A.; Iglesias, G. Wind resource evolution in Europe under different scenarios of climate change characterised by the novel Shared Socioeconomic Pathways. Energy Convers. Manag. 2021, 234, 113961. [Google Scholar] [CrossRef]
- Chen, L. Impacts of climate change on wind resources over North America based on NA-CORDEX. Renew. Energy 2020, 153, 1428–1438. [Google Scholar] [CrossRef]
- Moemken, J.; Reyers, M.; Feldmann, H.; Pinto, J.G. Future Changes of Wind Speed and Wind Energy Potentials in EURO-CORDEX Ensemble Simulations. J. Geophys. Res. Atmos. 2018, 123, 6373–6389. [Google Scholar] [CrossRef]
- Europe: Electricity Consumption Per Capita|Statista. Available online: https://www.statista.com/statistics/1262471/per-capita-electricity-consumption-europe/ (accessed on 16 December 2022).
- Electricity Consumption 2021|Countryeconomy.com. Available online: https://countryeconomy.com/energy-and-environment/electricity-consumption (accessed on 16 December 2022).
- Electricity in Europe-Statistics & Facts|Statista. Available online: https://www.statista.com/topics/8491/electricity-in-europe/#topicHeader__wrapper (accessed on 16 December 2022).
- Global Wind Atlas. Available online: https://globalwindatlas.info/area/Lithuania (accessed on 19 June 2021).


| Model | Institution | Country | Horizontal Resolution |
|---|---|---|---|
| MPI-ESM-LR | Max Planck Institute for Meteorology Earth System | Germany | 1.875° × 1.875° |
| HadGem2-ES | Hadley Centre Global Environmental Model | United Kingdom | 1.25° × 1.875° |
| IPSL-CM5A-MR | Institute Pierre Simon Laplace | France | 1.9° × 3.75° |
| HAD | IPSL | MPI | ||||
|---|---|---|---|---|---|---|
| Min | Max | Min | Max | Min | Max | |
| 2021–2030 | 468 | 1673 | 560 | 1716 | 176 | 766 |
| 2031–2040 | 454 | 1637 | 626 | 1762 | 192 | 750 |
| 2041–2050 | 469 | 1684 | 596 | 1623 | 195 | 755 |
| 2051–2060 | 503 | 1777 | 654 | 1797 | 163 | 750 |
| 2061–2070 | 495 | 1795 | 684 | 1835 | 159 | 714 |
| 2071–2080 | 495 | 1804 | 703 | 1865 | 170 | 760 |
| 2081–2090 | 454 | 1593 | 662 | 1844 | 180 | 792 |
| 2091–2100 | 427 | 1621 | 576 | 1660 | 195 | 771 |
| HAD | IPSL | MPI | |
|---|---|---|---|
| 2021–2040 | 13.92–31.96 | 39.74–57.78 | 78.46–96.50 |
| 2041–2060 | 38.32–56.35 | 21.04–59.08 | 44.06–62.09 |
| 2061–2080 | 28.50–46.54 | 24.22–42.26 | 40.03–58.06 |
| 2081–2100 | 24.14–42.18 | 19.33–37.37 | 28.63–46.67 |
| Limits are set according to Figure 4. | |||
| Turbine | E-82 | E-115 | E-101 | E-126 EP4 | E-126 |
|---|---|---|---|---|---|
| Rated power, kW | 3020 | 3000 | 3050 | 4200 | 7580 |
| Energy production (coastal), kWh | 321 | 627 | 479 | 745 | 760 |
| Energy production (central), kWh | 144 | 281 | 214 | 332 | 340 |
| Energy production (eastern), kWh | 26 | 50 | 39 | 60 | 57 |
| Coastal | Central | Eastern | |
|---|---|---|---|
| E-82 | 1 926 | 864 | 156 |
| E-115 | 3 762 | 1 686 | 300 |
| E-101 | 2 874 | 1 284 | 234 |
| E-126 | 4 470 | 1 992 | 360 |
| E-126 EP4 | 4 560 | 2 040 | 342 |
Disclaimer/Publisher’s Note: The statements, opinions and data contained in all publications are solely those of the individual author(s) and contributor(s) and not of MDPI and/or the editor(s). MDPI and/or the editor(s) disclaim responsibility for any injury to people or property resulting from any ideas, methods, instructions or products referred to in the content. |
© 2022 by the authors. Licensee MDPI, Basel, Switzerland. This article is an open access article distributed under the terms and conditions of the Creative Commons Attribution (CC BY) license (https://creativecommons.org/licenses/by/4.0/).
Share and Cite
Jankevičienė, J.; Kanapickas, A. Projected Wind Energy Maximum Potential in Lithuania. Appl. Sci. 2023, 13, 364. https://doi.org/10.3390/app13010364
Jankevičienė J, Kanapickas A. Projected Wind Energy Maximum Potential in Lithuania. Applied Sciences. 2023; 13(1):364. https://doi.org/10.3390/app13010364
Chicago/Turabian StyleJankevičienė, Justė, and Arvydas Kanapickas. 2023. "Projected Wind Energy Maximum Potential in Lithuania" Applied Sciences 13, no. 1: 364. https://doi.org/10.3390/app13010364
APA StyleJankevičienė, J., & Kanapickas, A. (2023). Projected Wind Energy Maximum Potential in Lithuania. Applied Sciences, 13(1), 364. https://doi.org/10.3390/app13010364