Experimentally Validated Analytical Solutions to Homogeneous Problems of Electrical Impedance Tomography (EIT) on Rectangular Cement-Based Materials
Abstract
1. Introduction
2. Theoretical Solutions
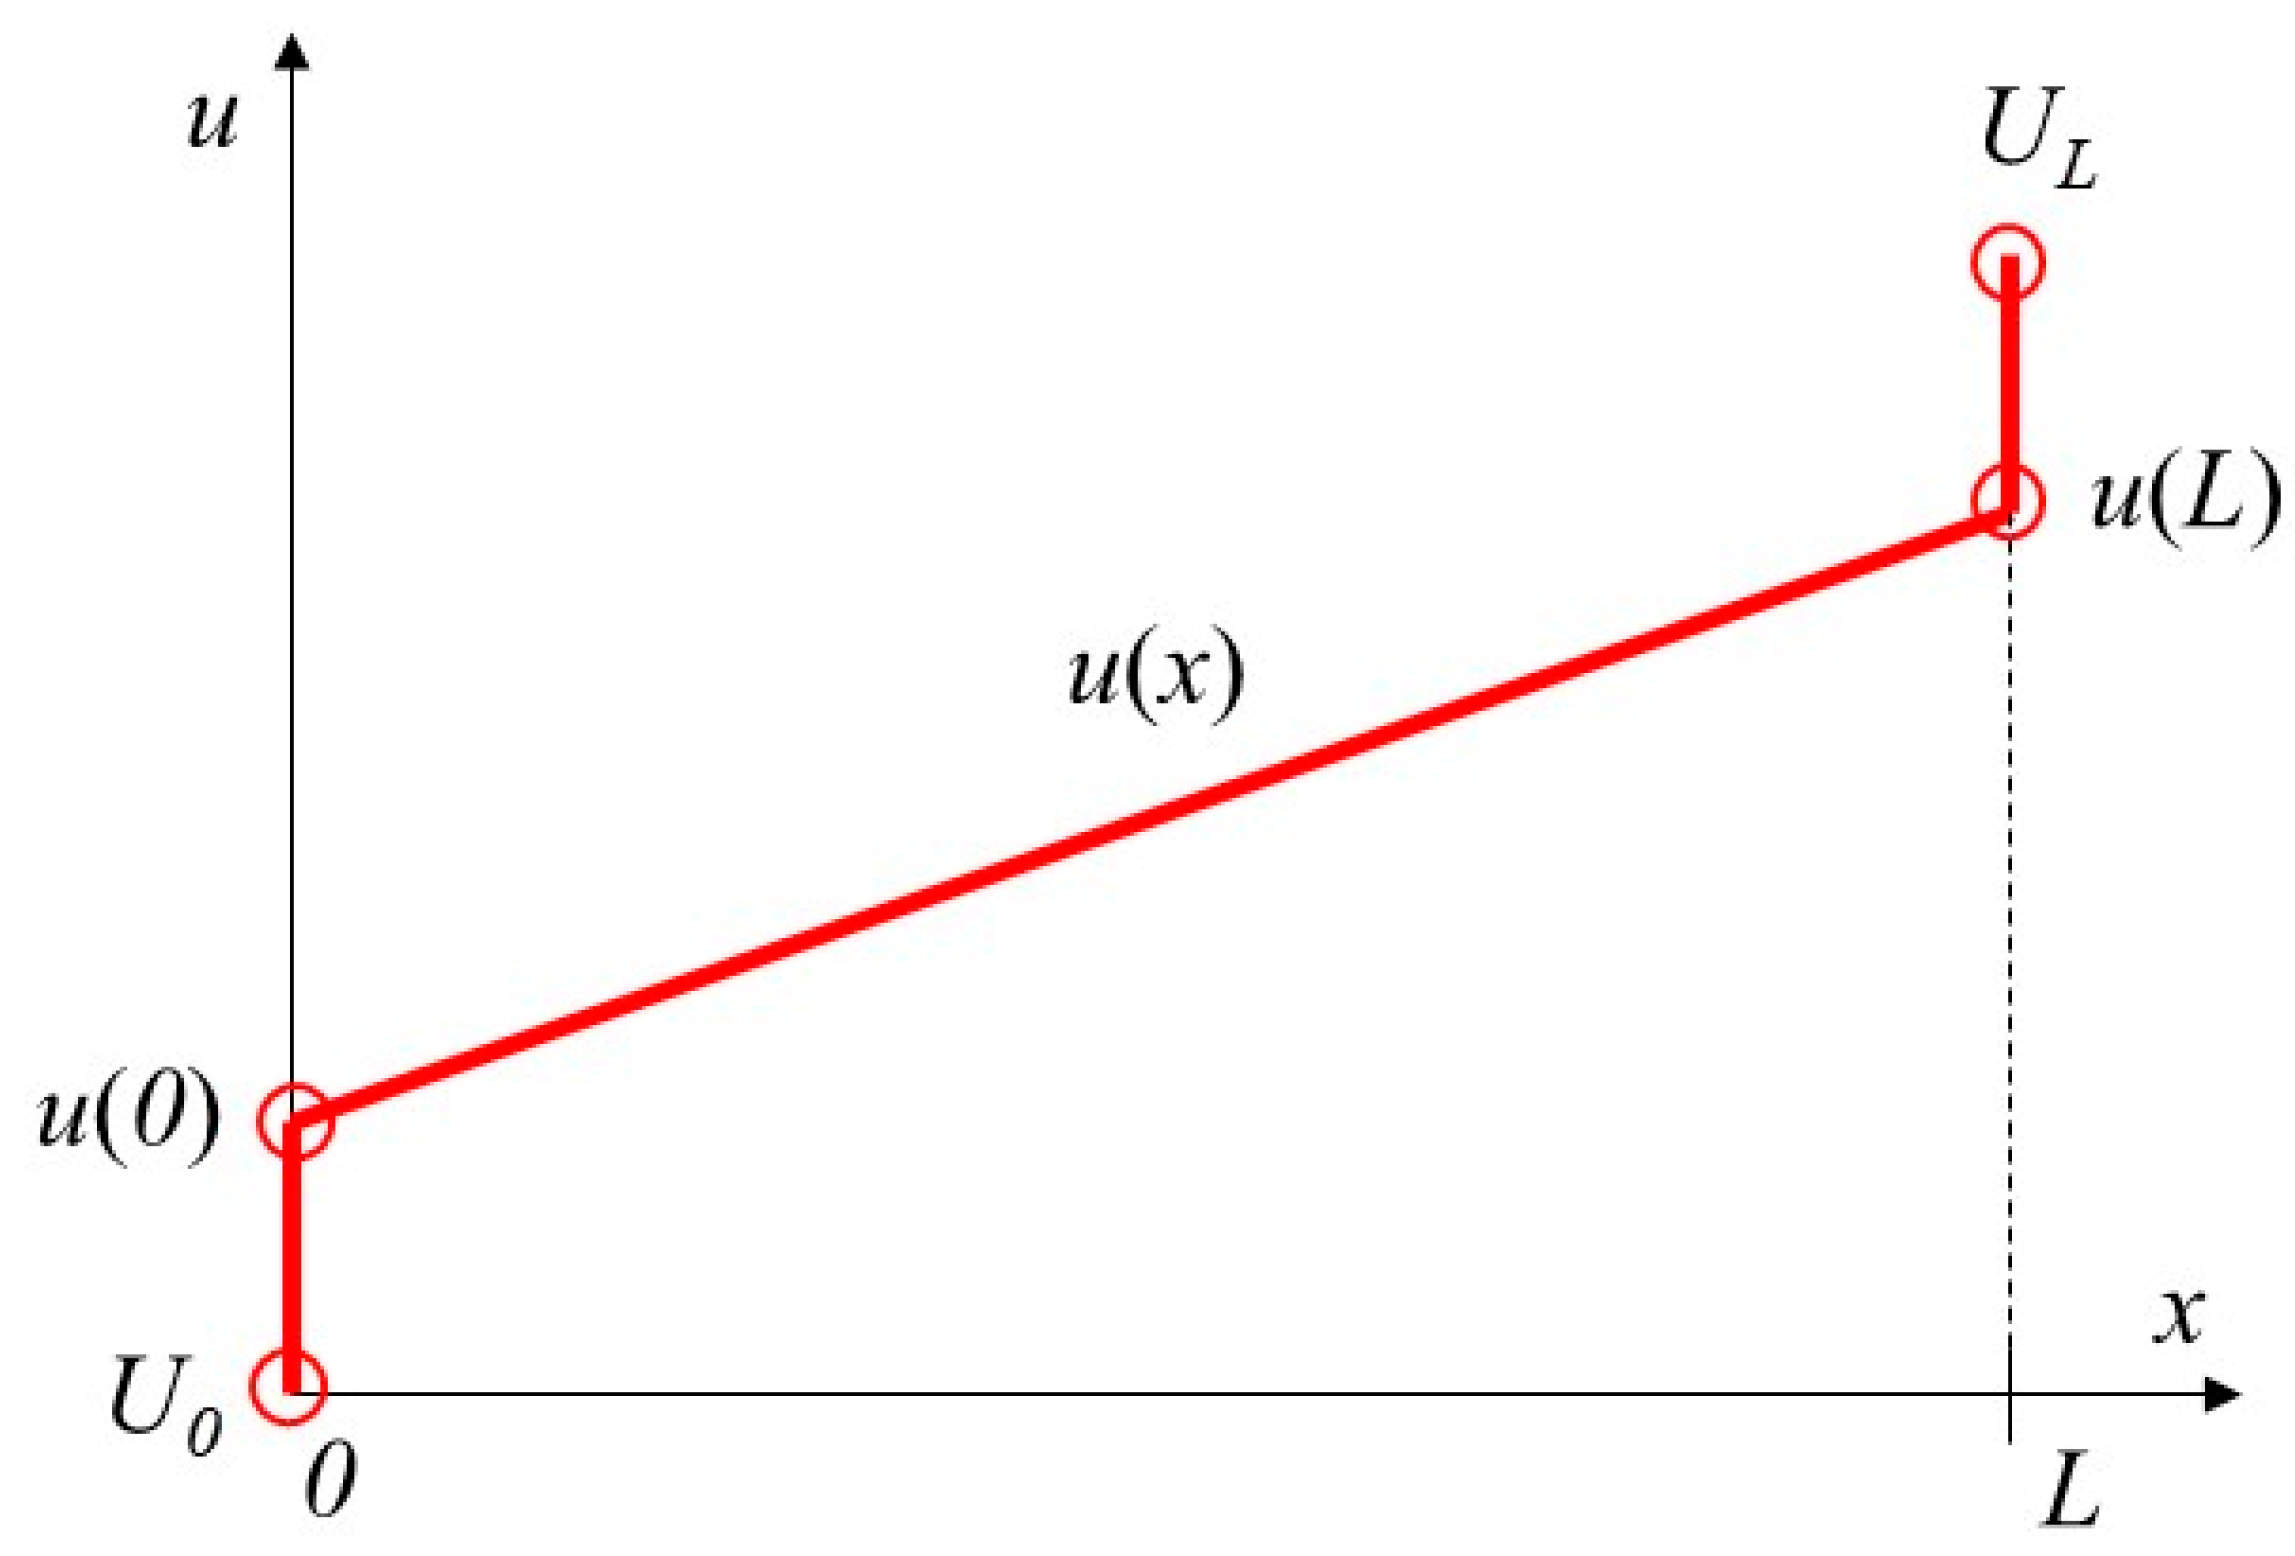
2.1. Shunt Model for the Boundary Conditions of Cement-Based Samples
2.2. Derivation of Analytical Solutions
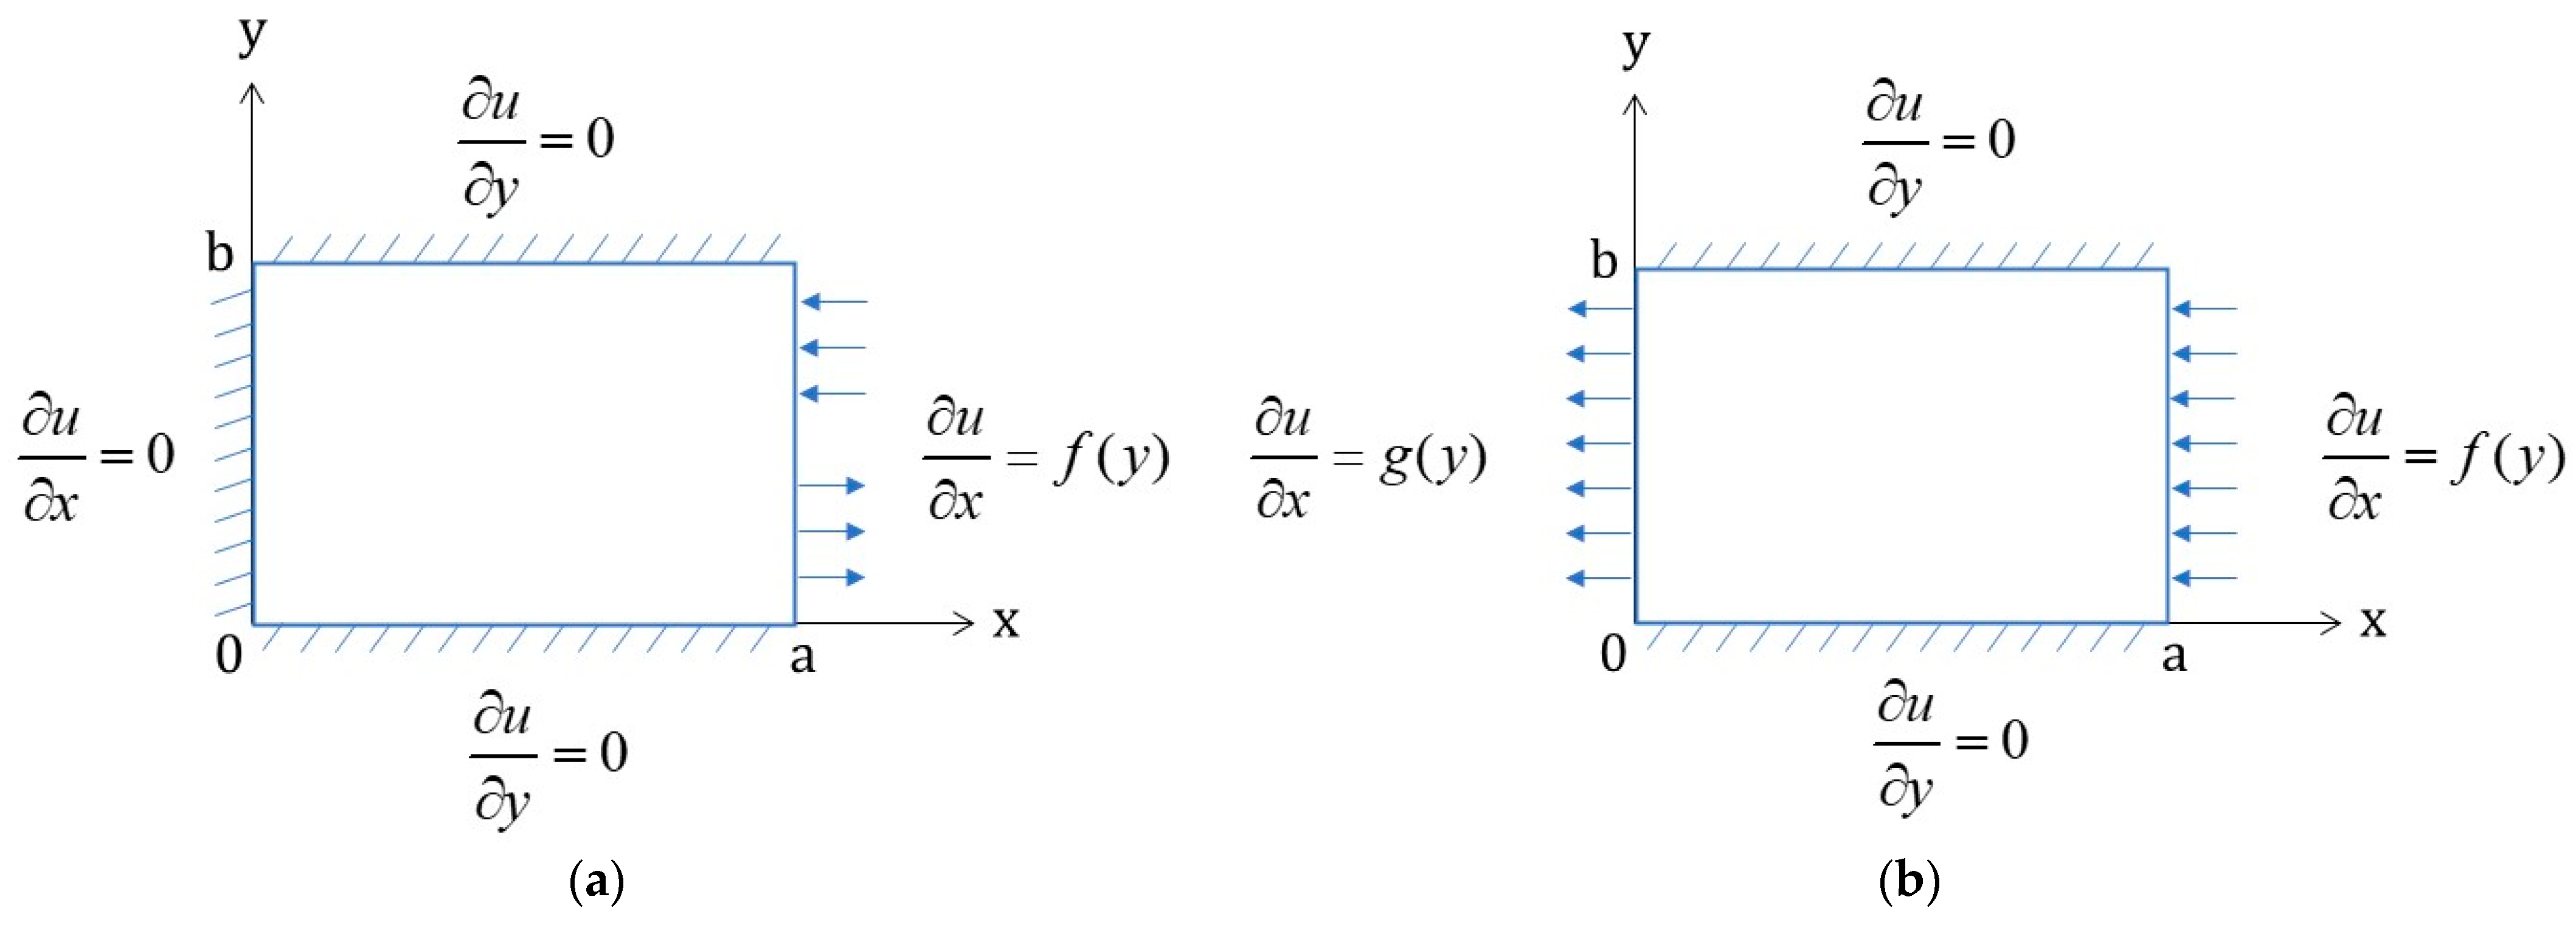
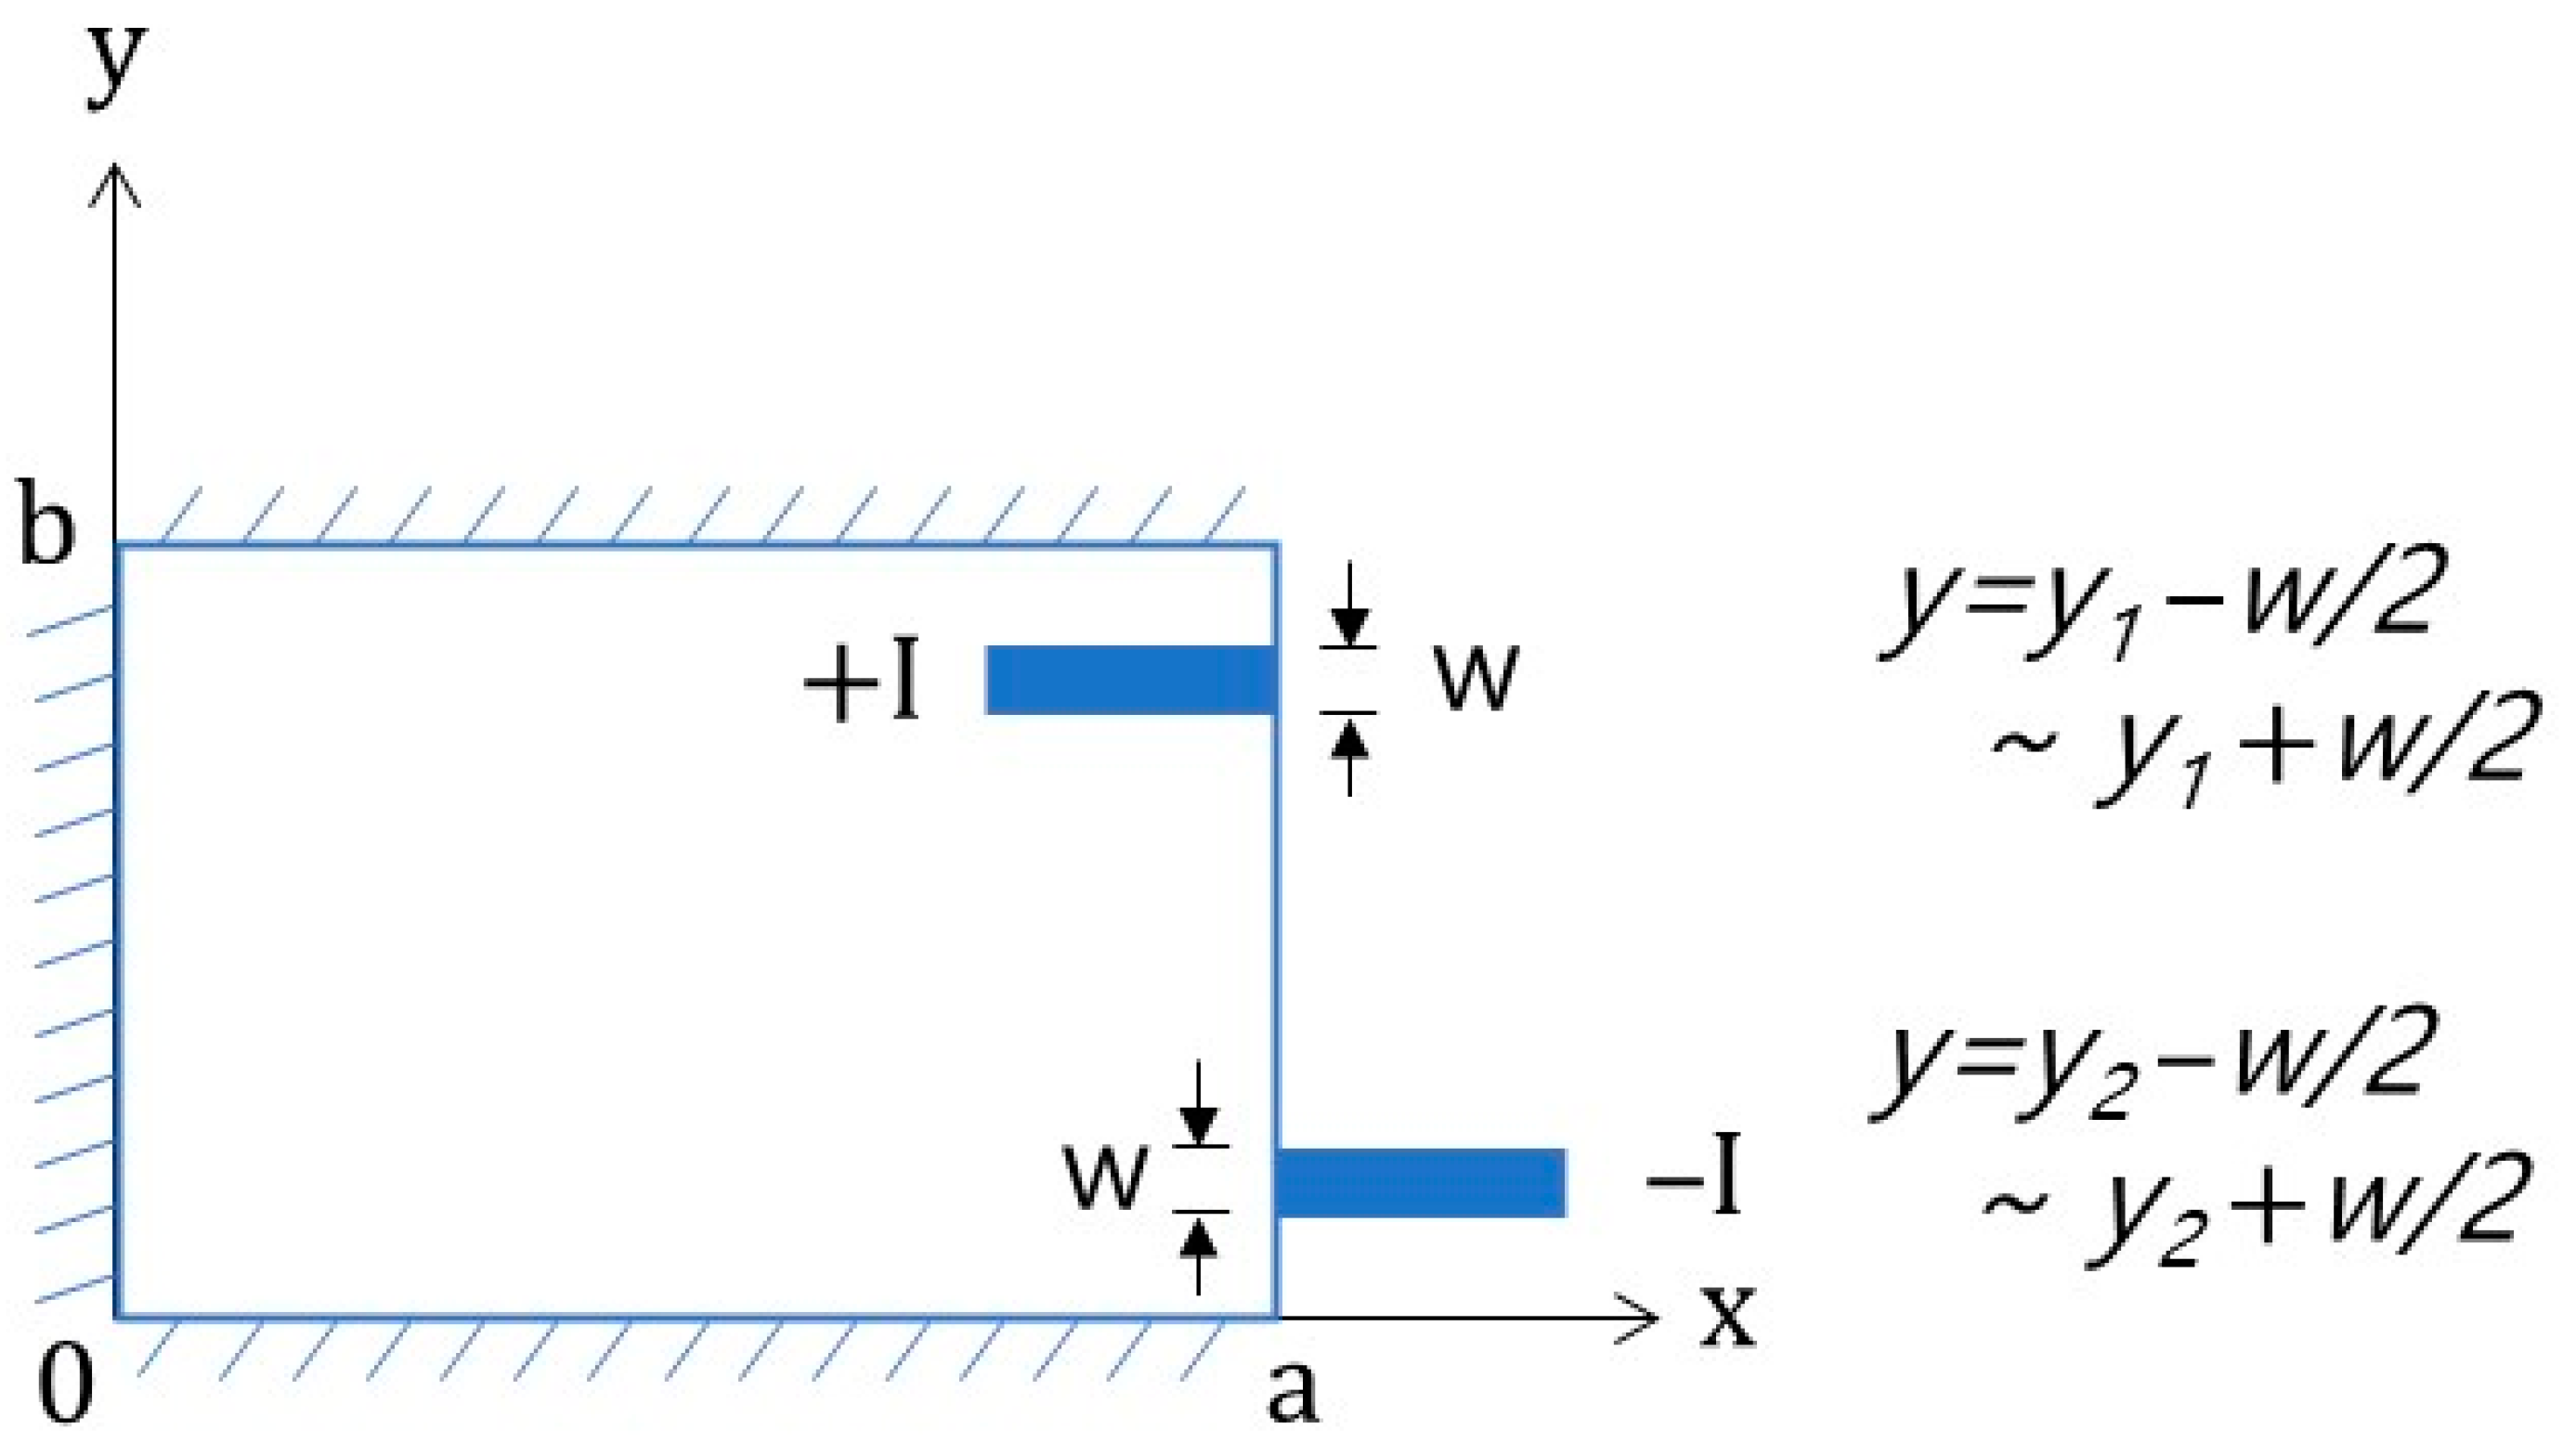
2.2.1. Case 1: Current Flows in and out of the Same Boundary
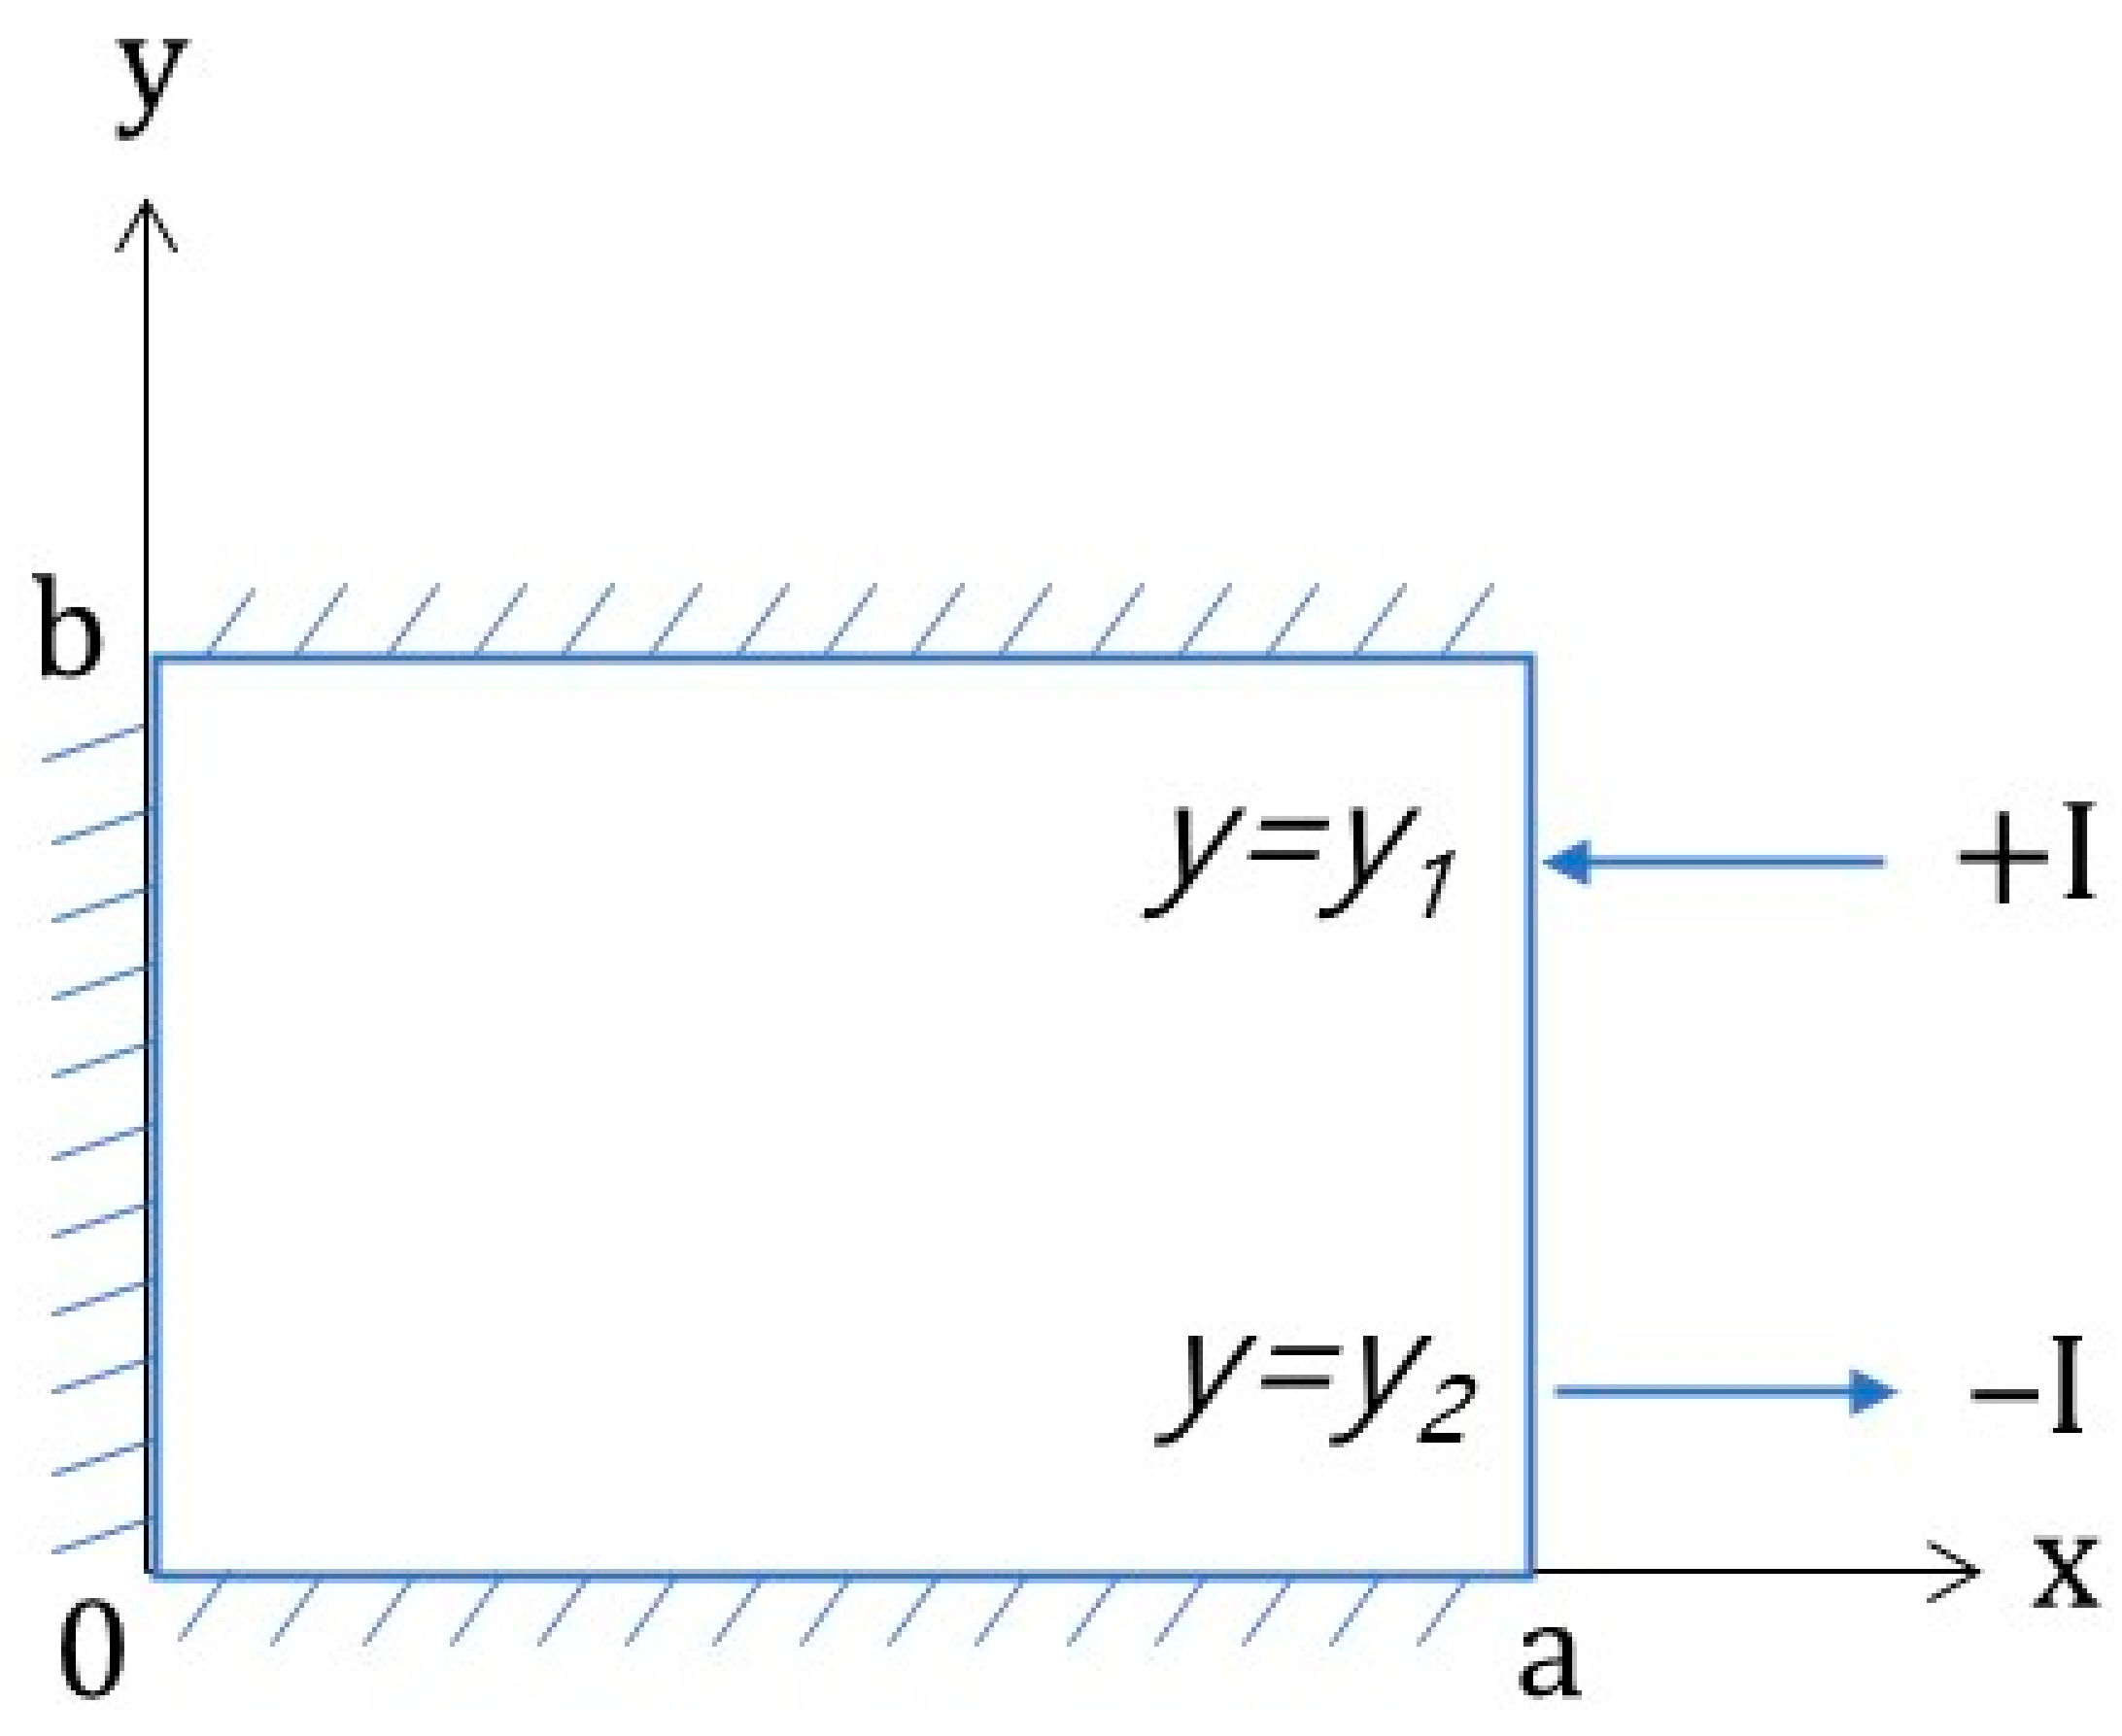
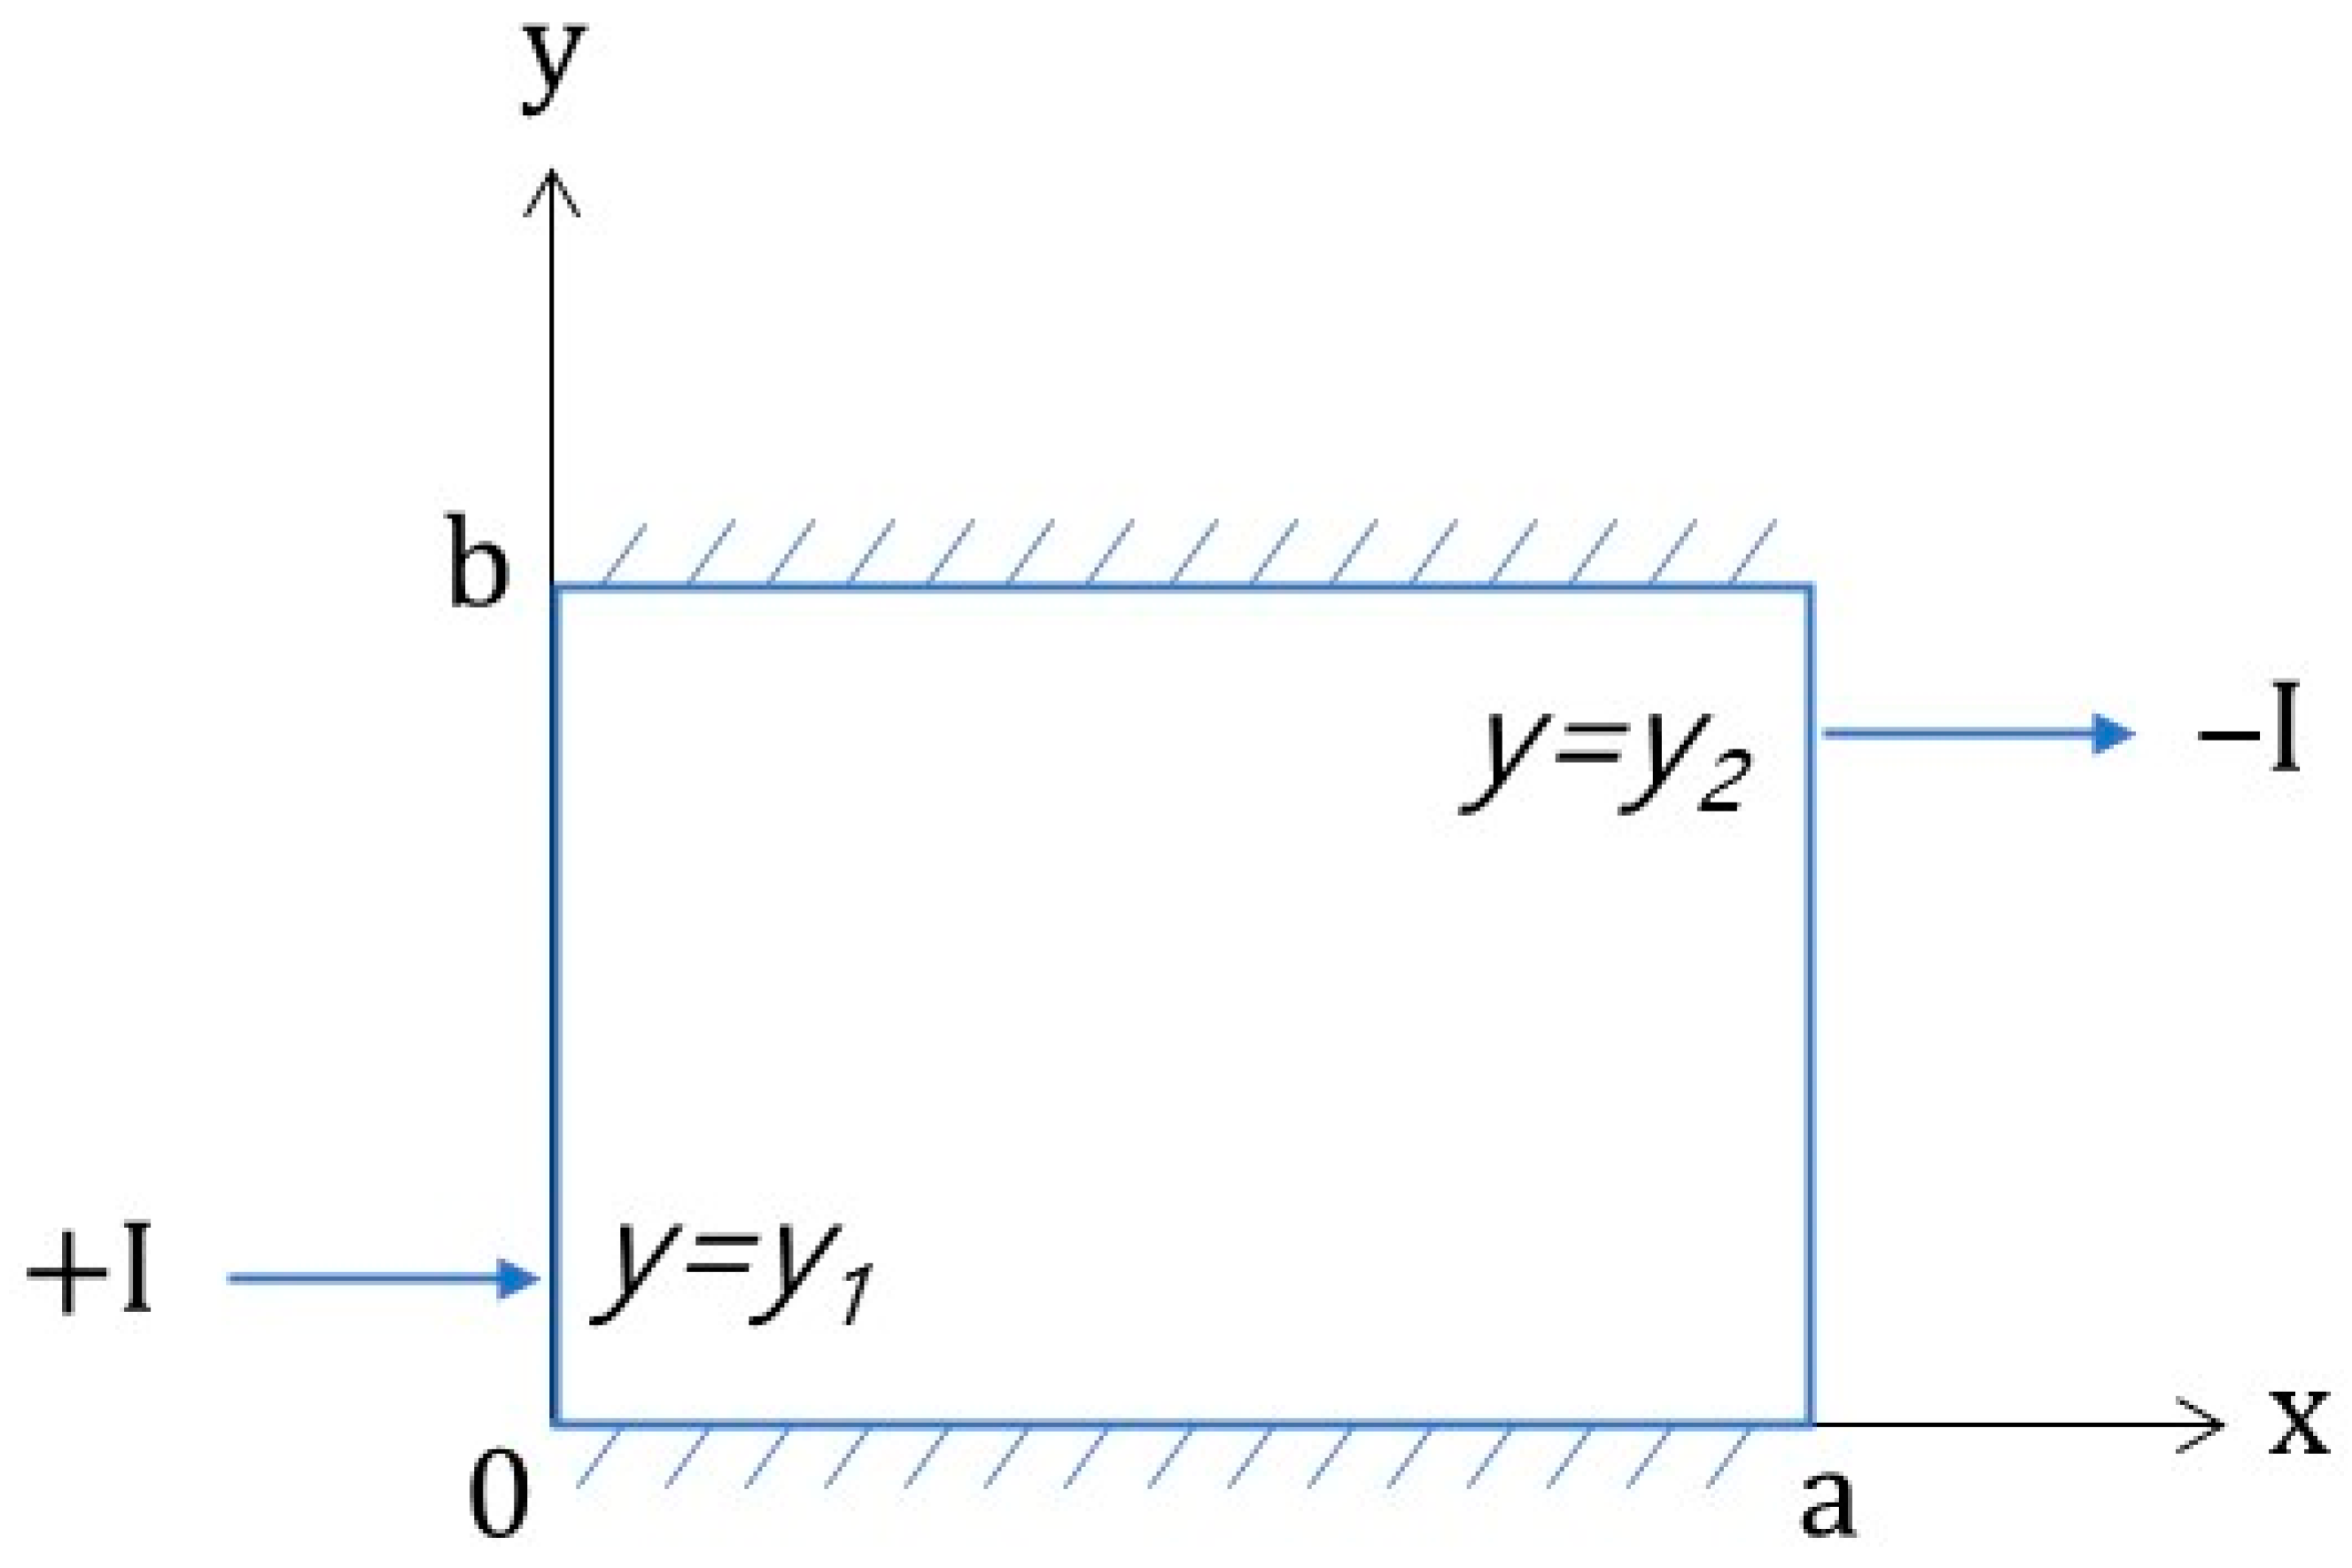
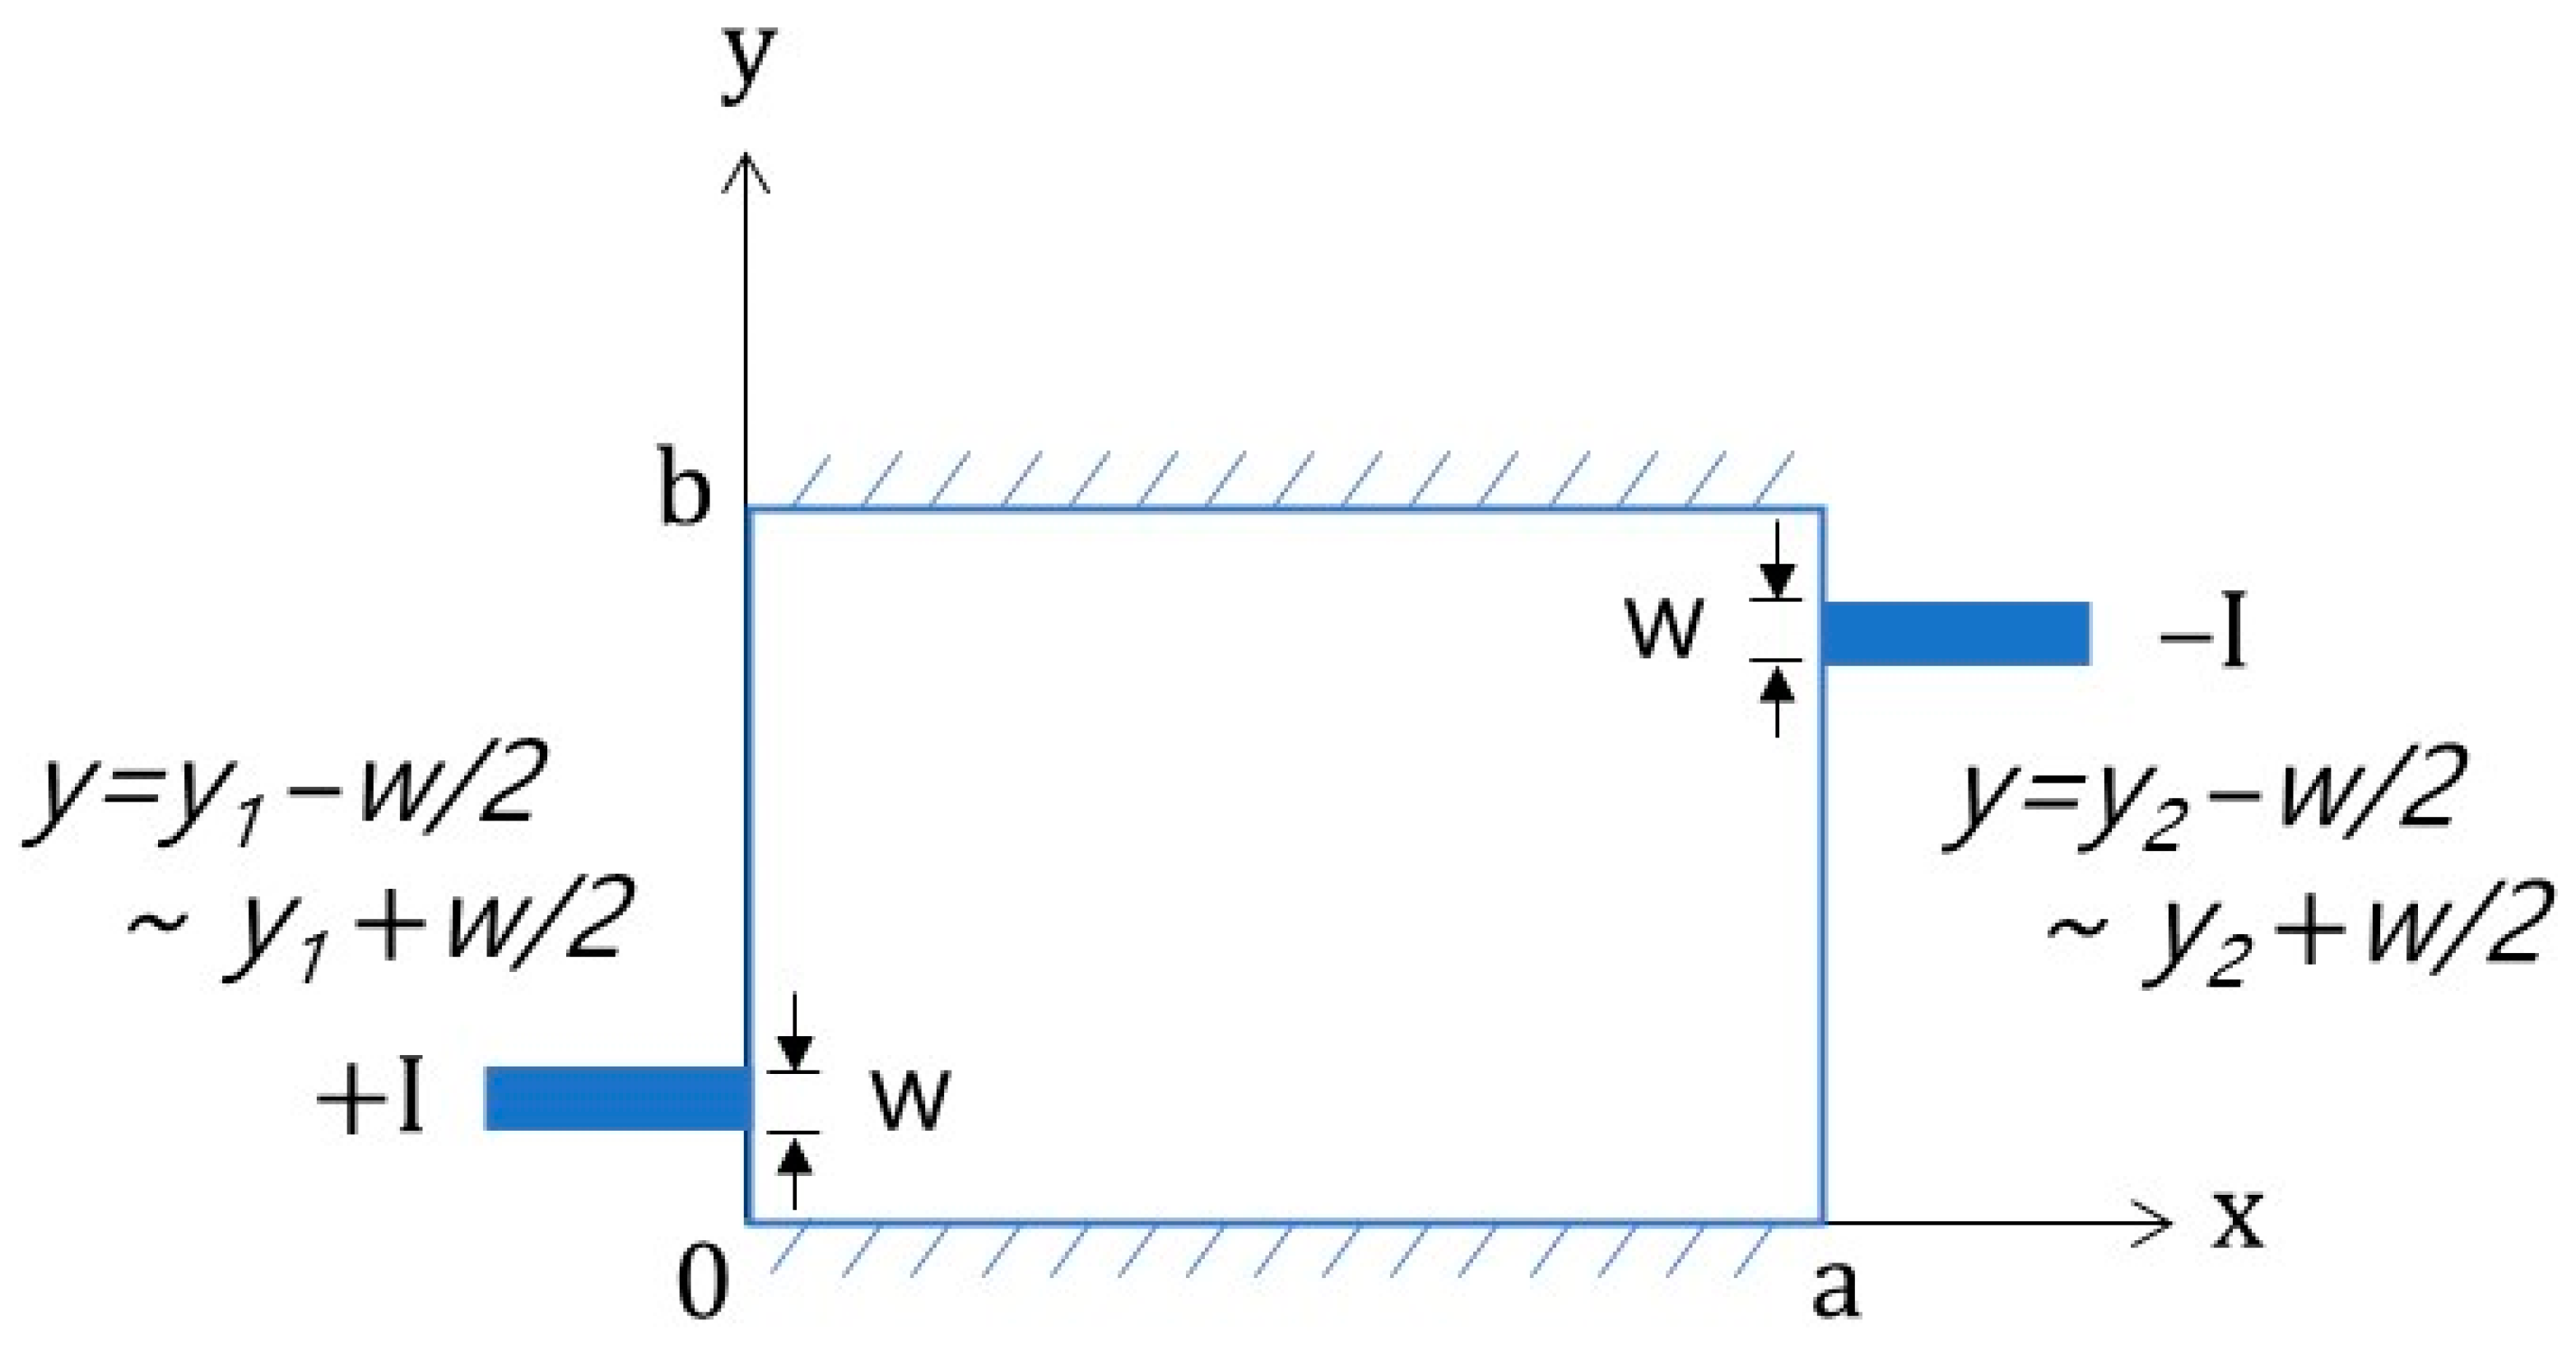
2.2.2. Case 2: Current Flows in from one Boundary and out from the Opposite Boundary
3. Experiments
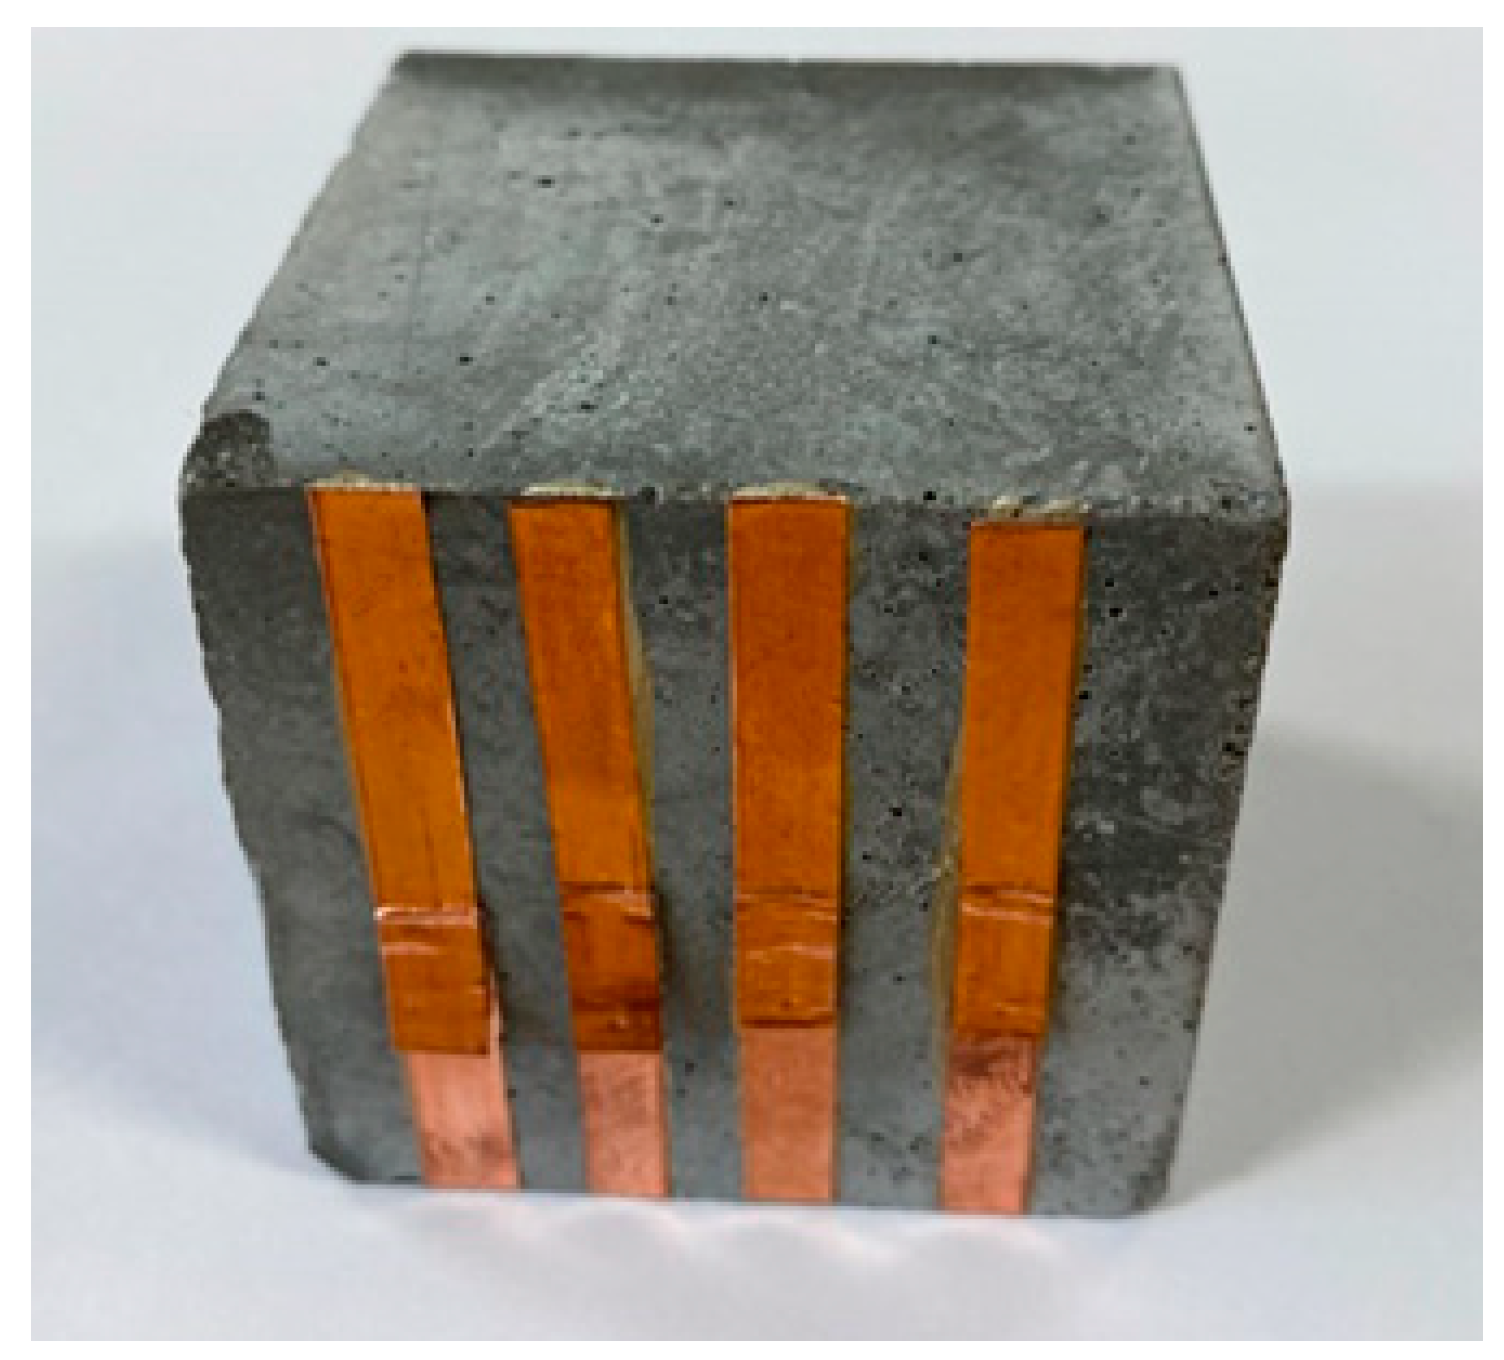
3.1. Materials and Sample Preparation
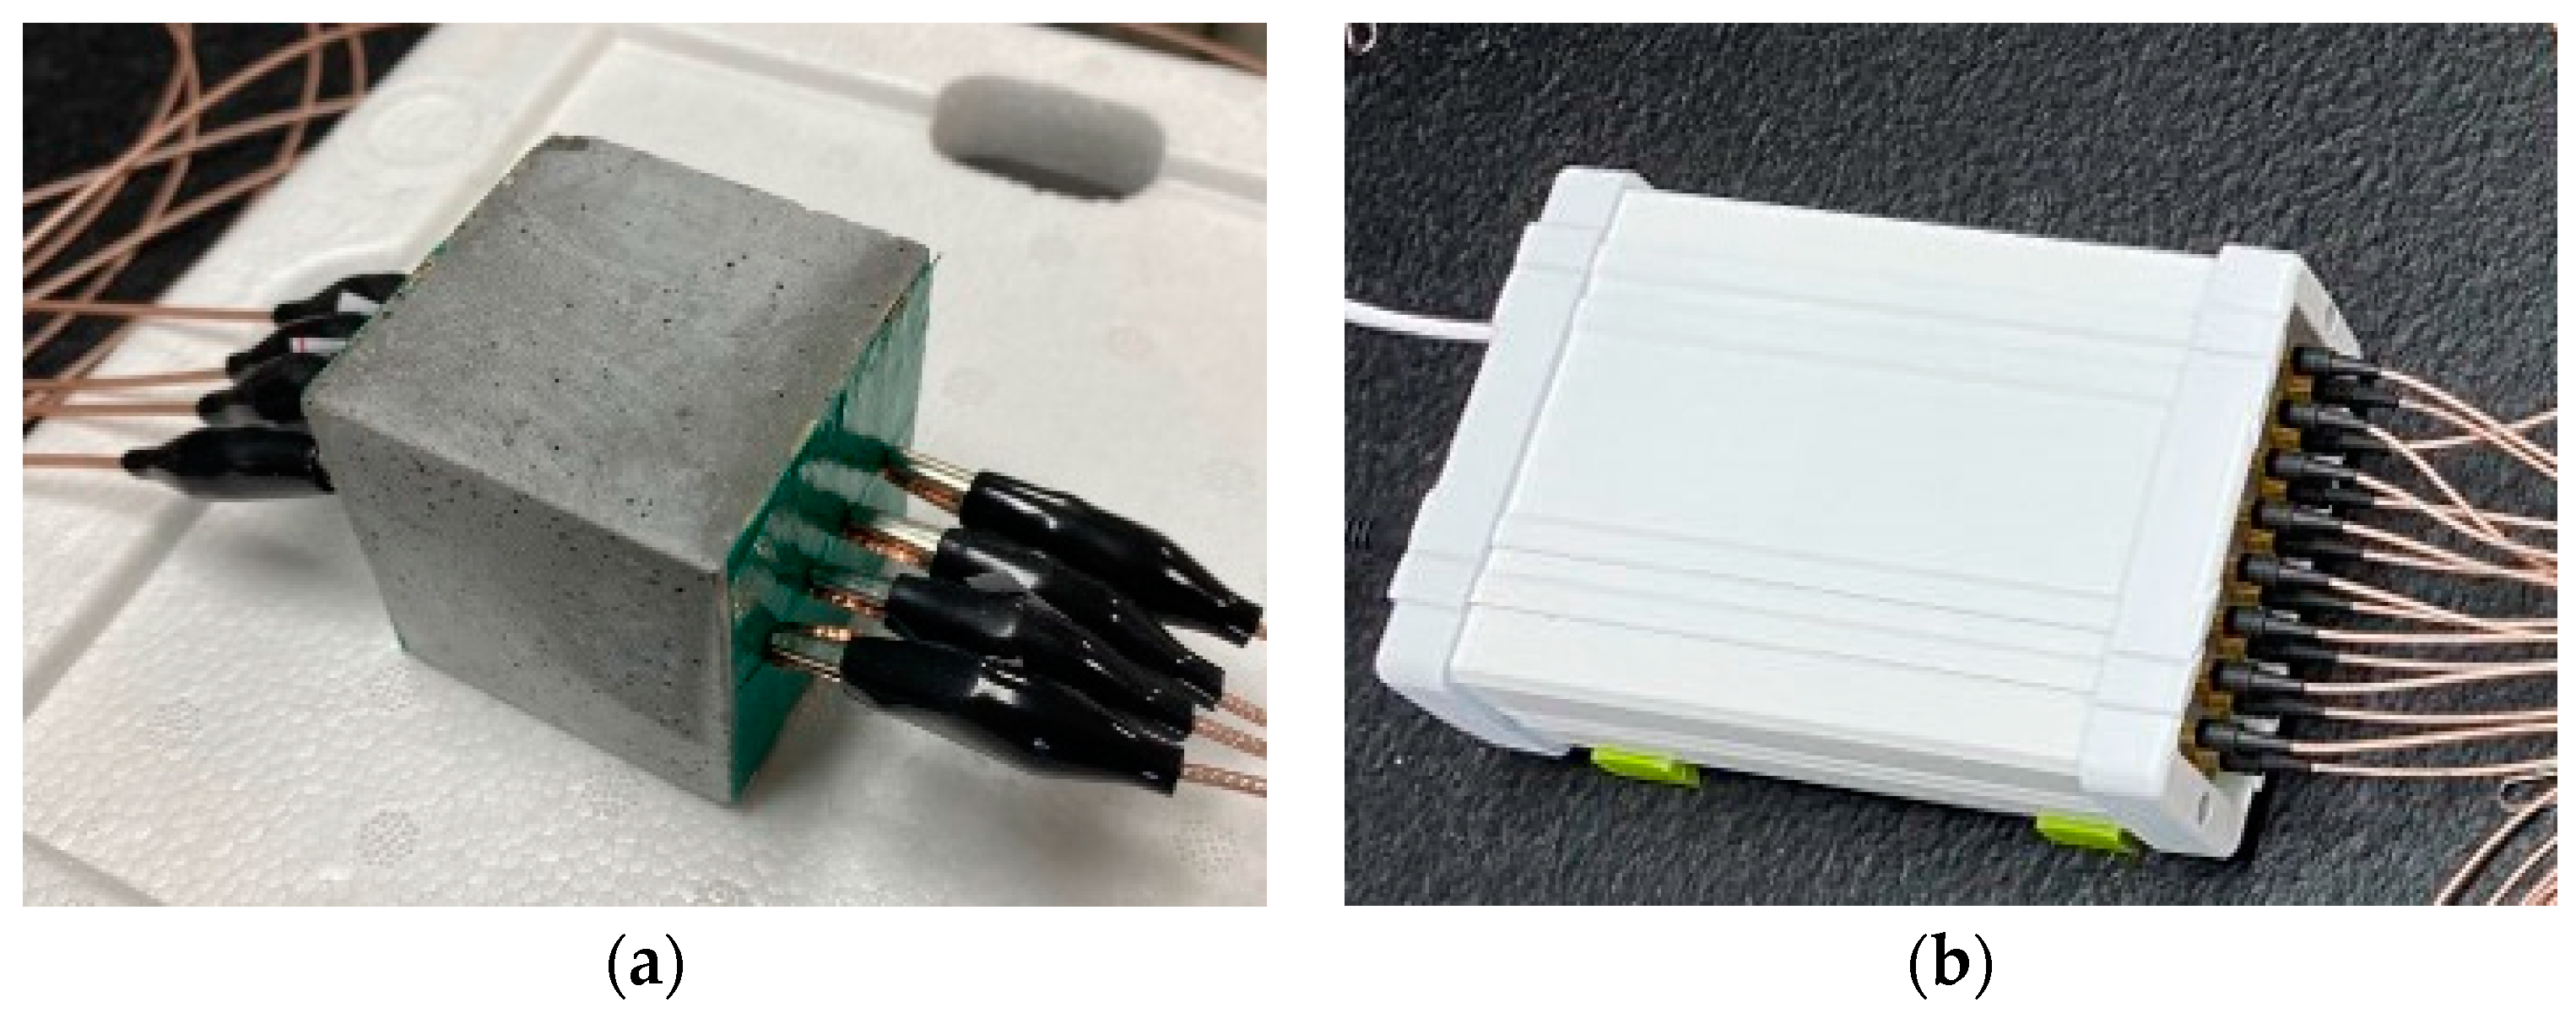
3.2. EIT Measurements
4. Results and Discussion
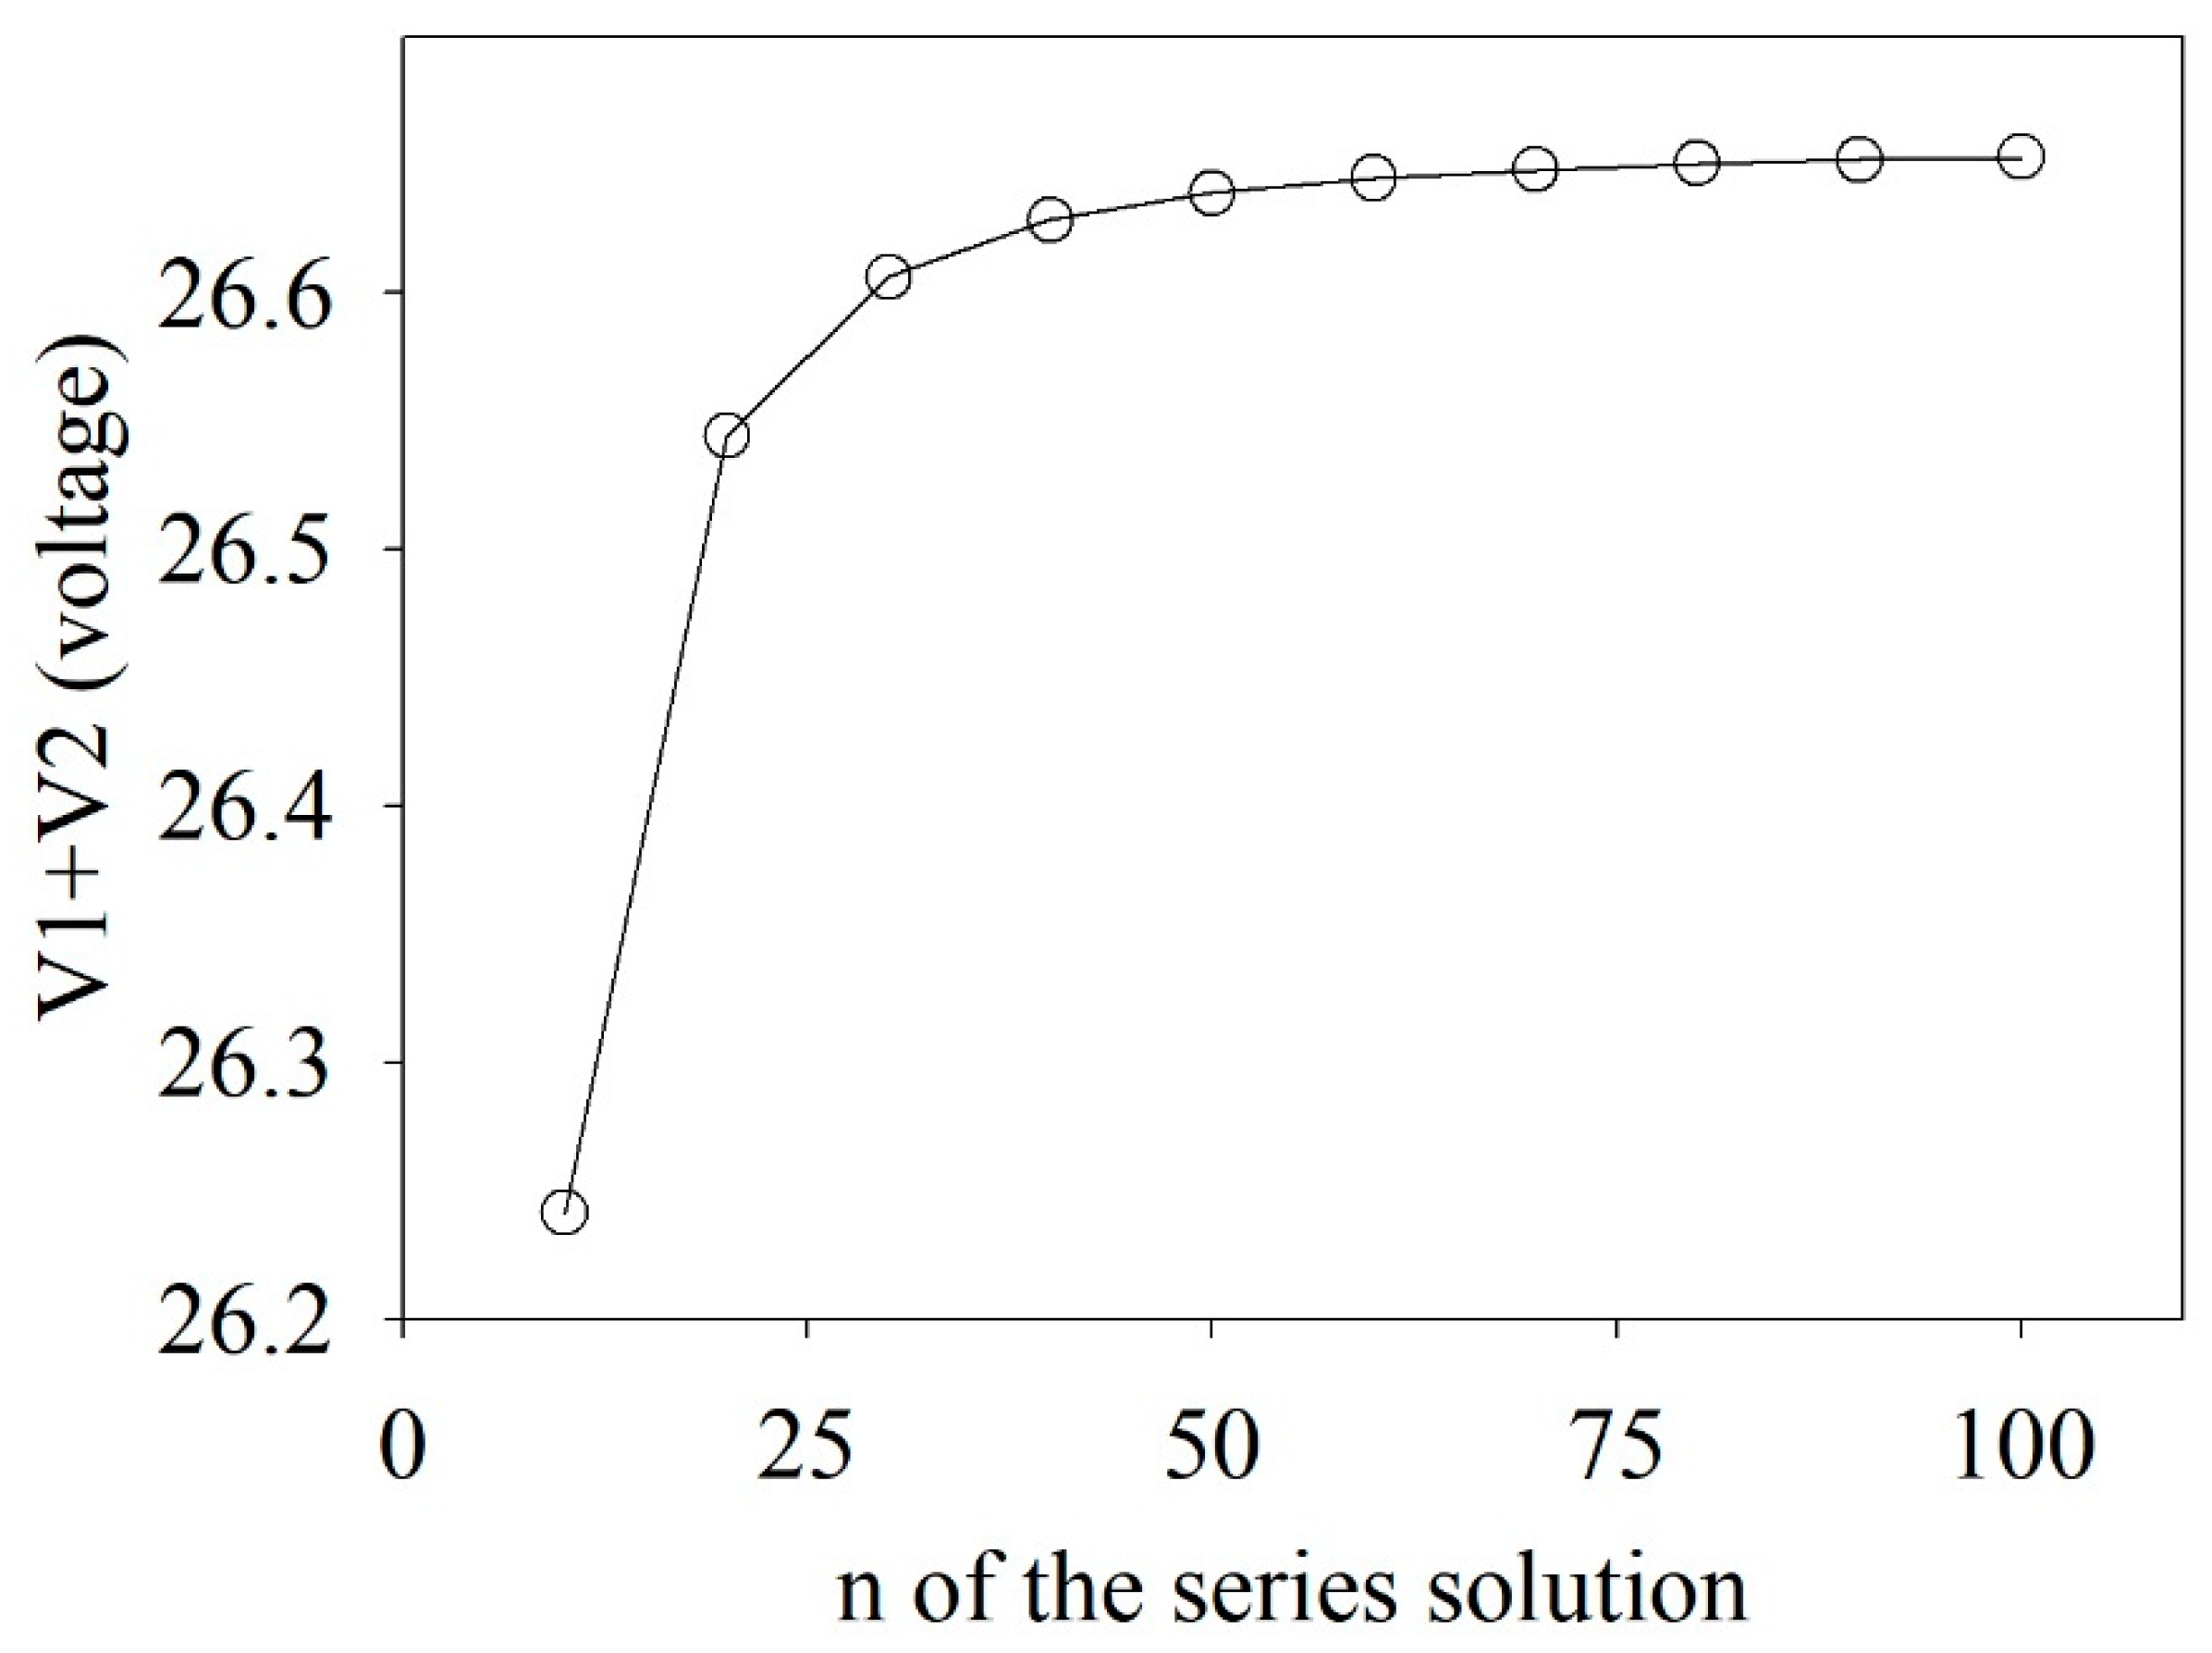
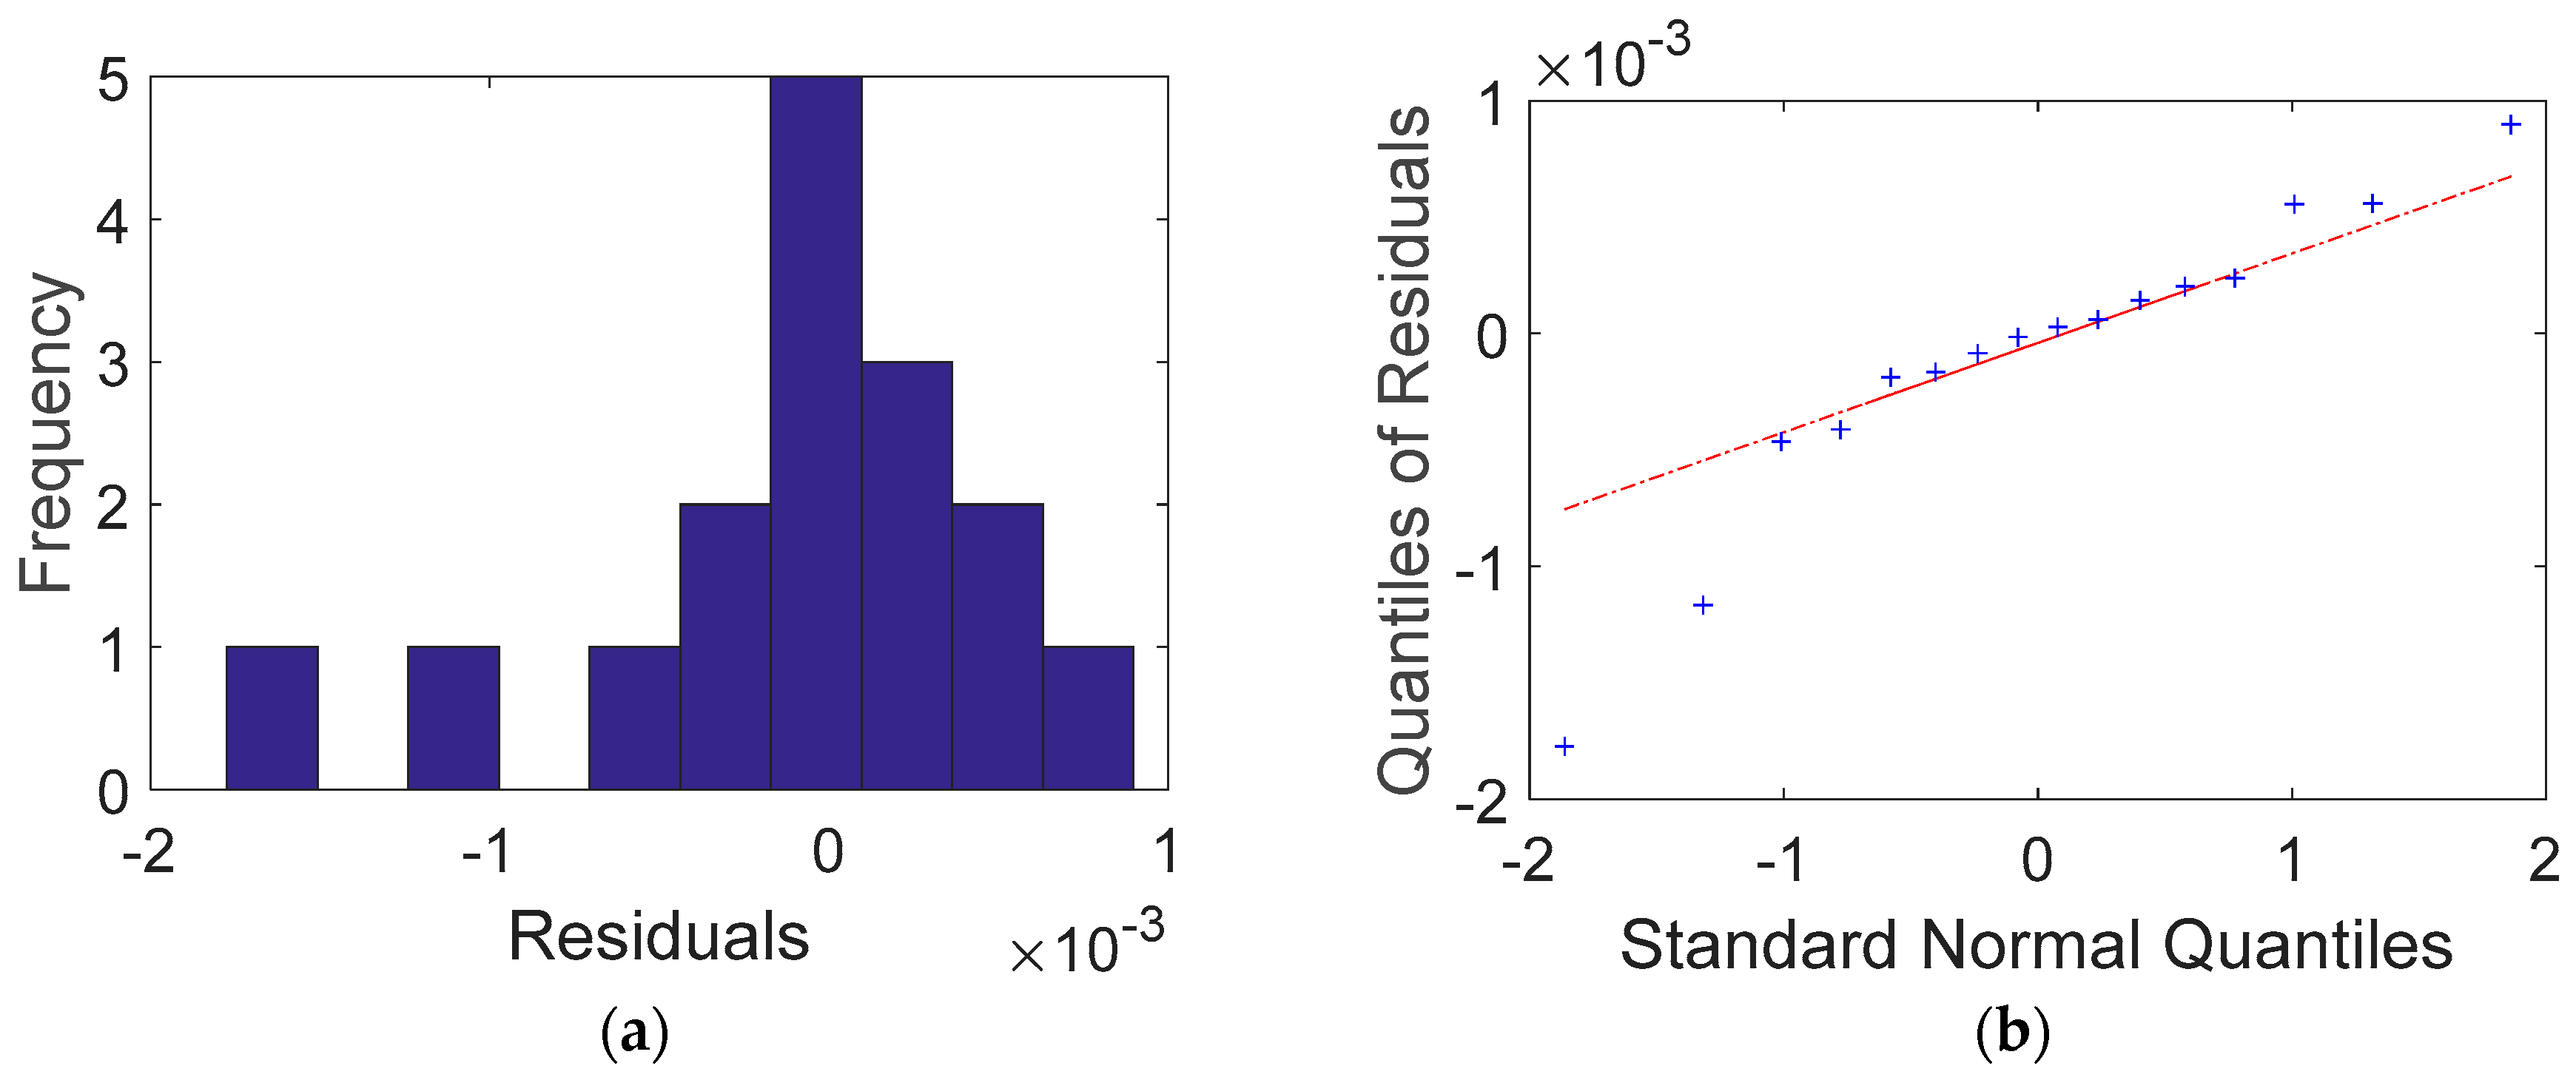
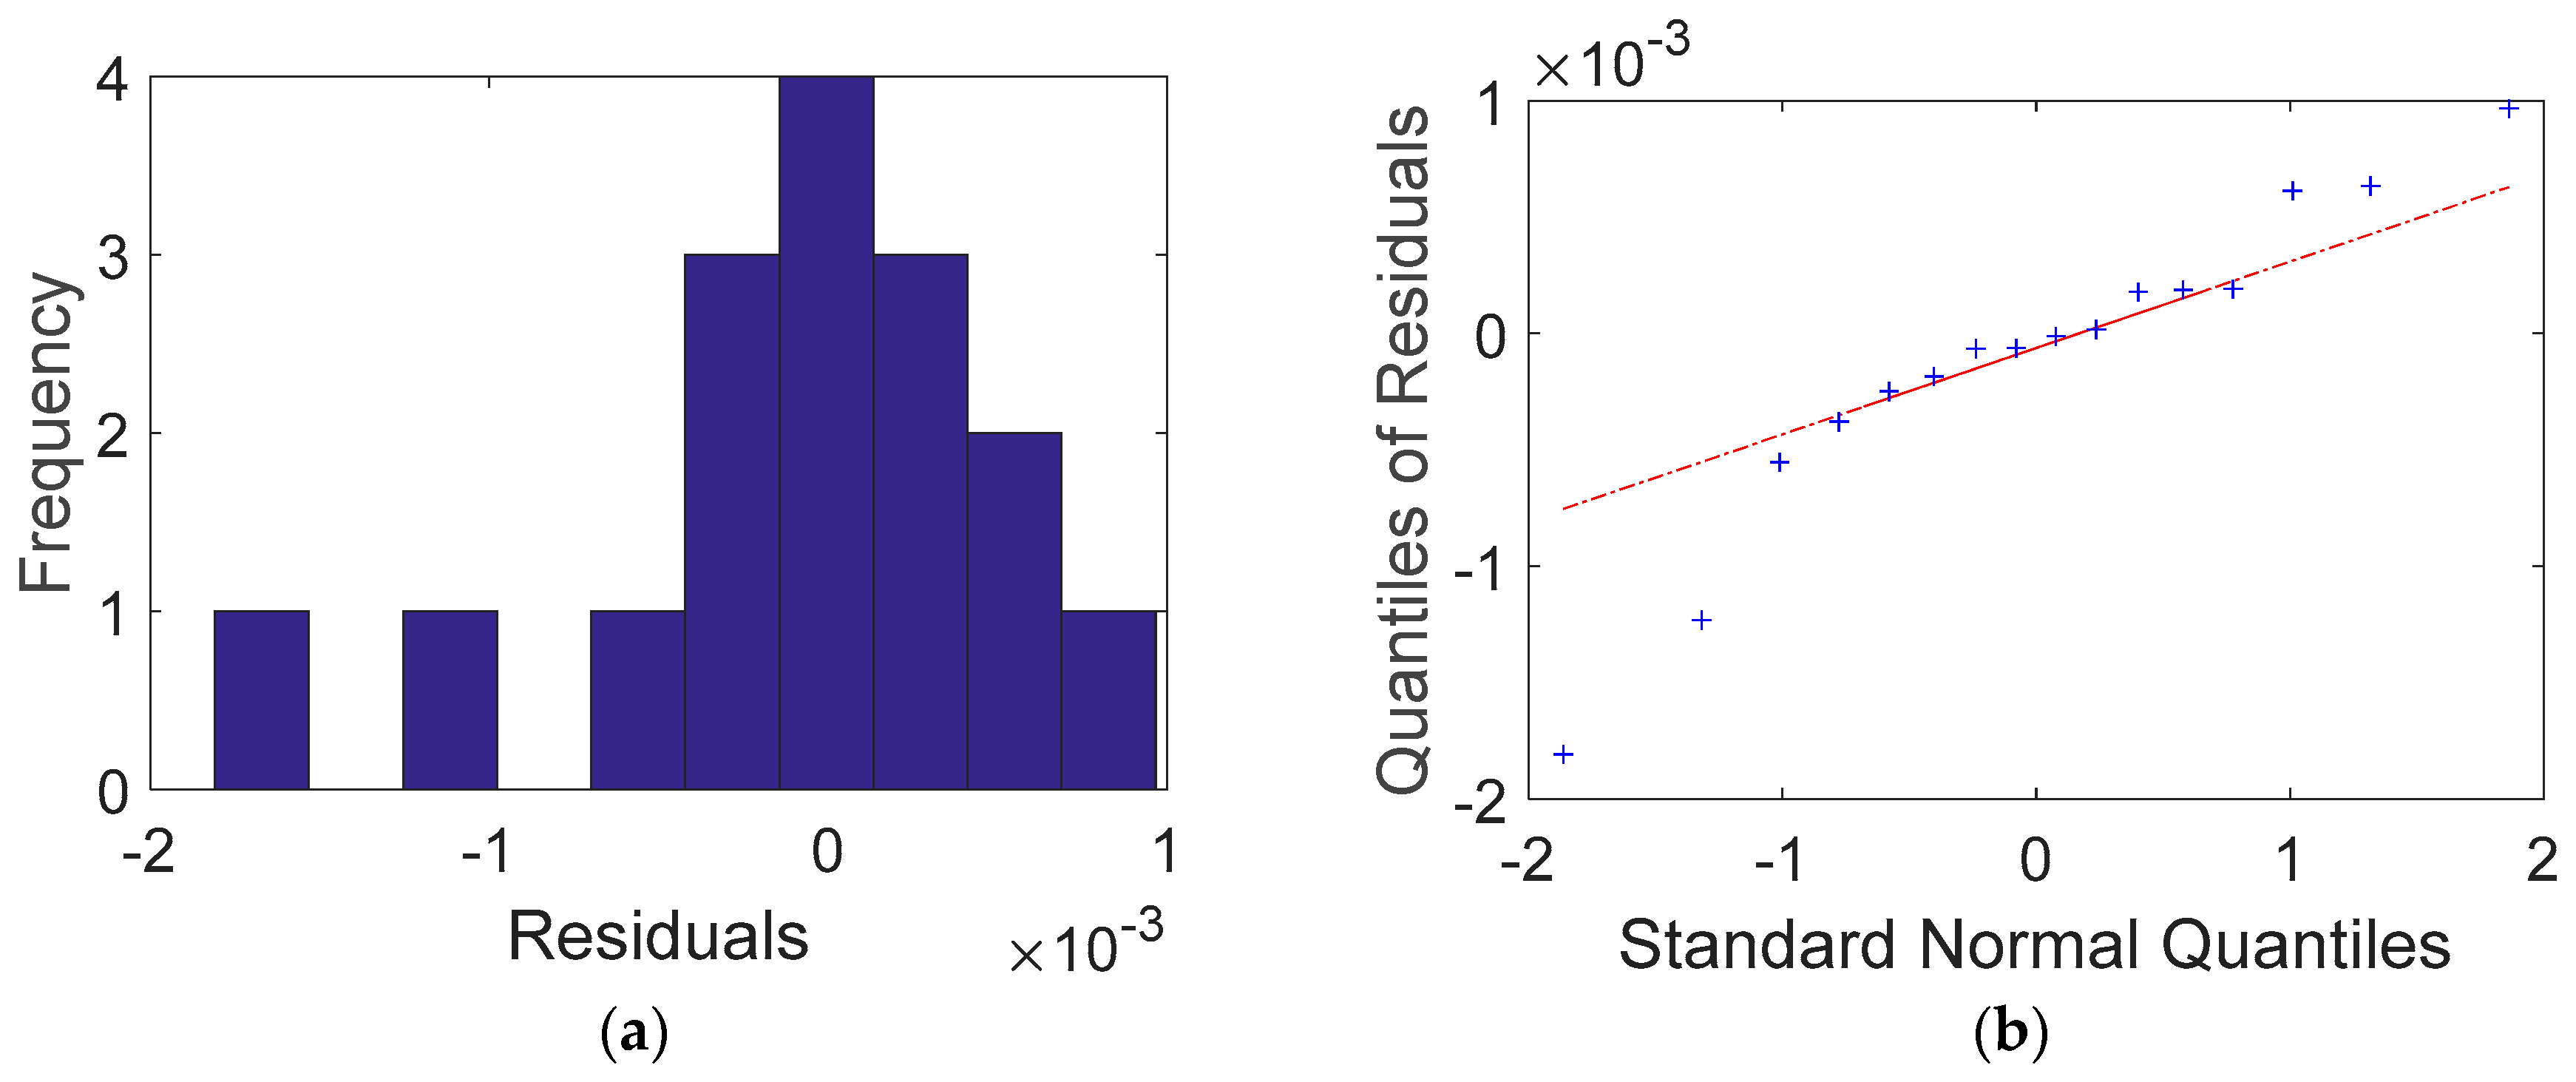
4.1. Cutoff of Infinite Series Solutions
4.2. Experimental Validation of Current Injection Models
4.2.1. Dirac Delta Function
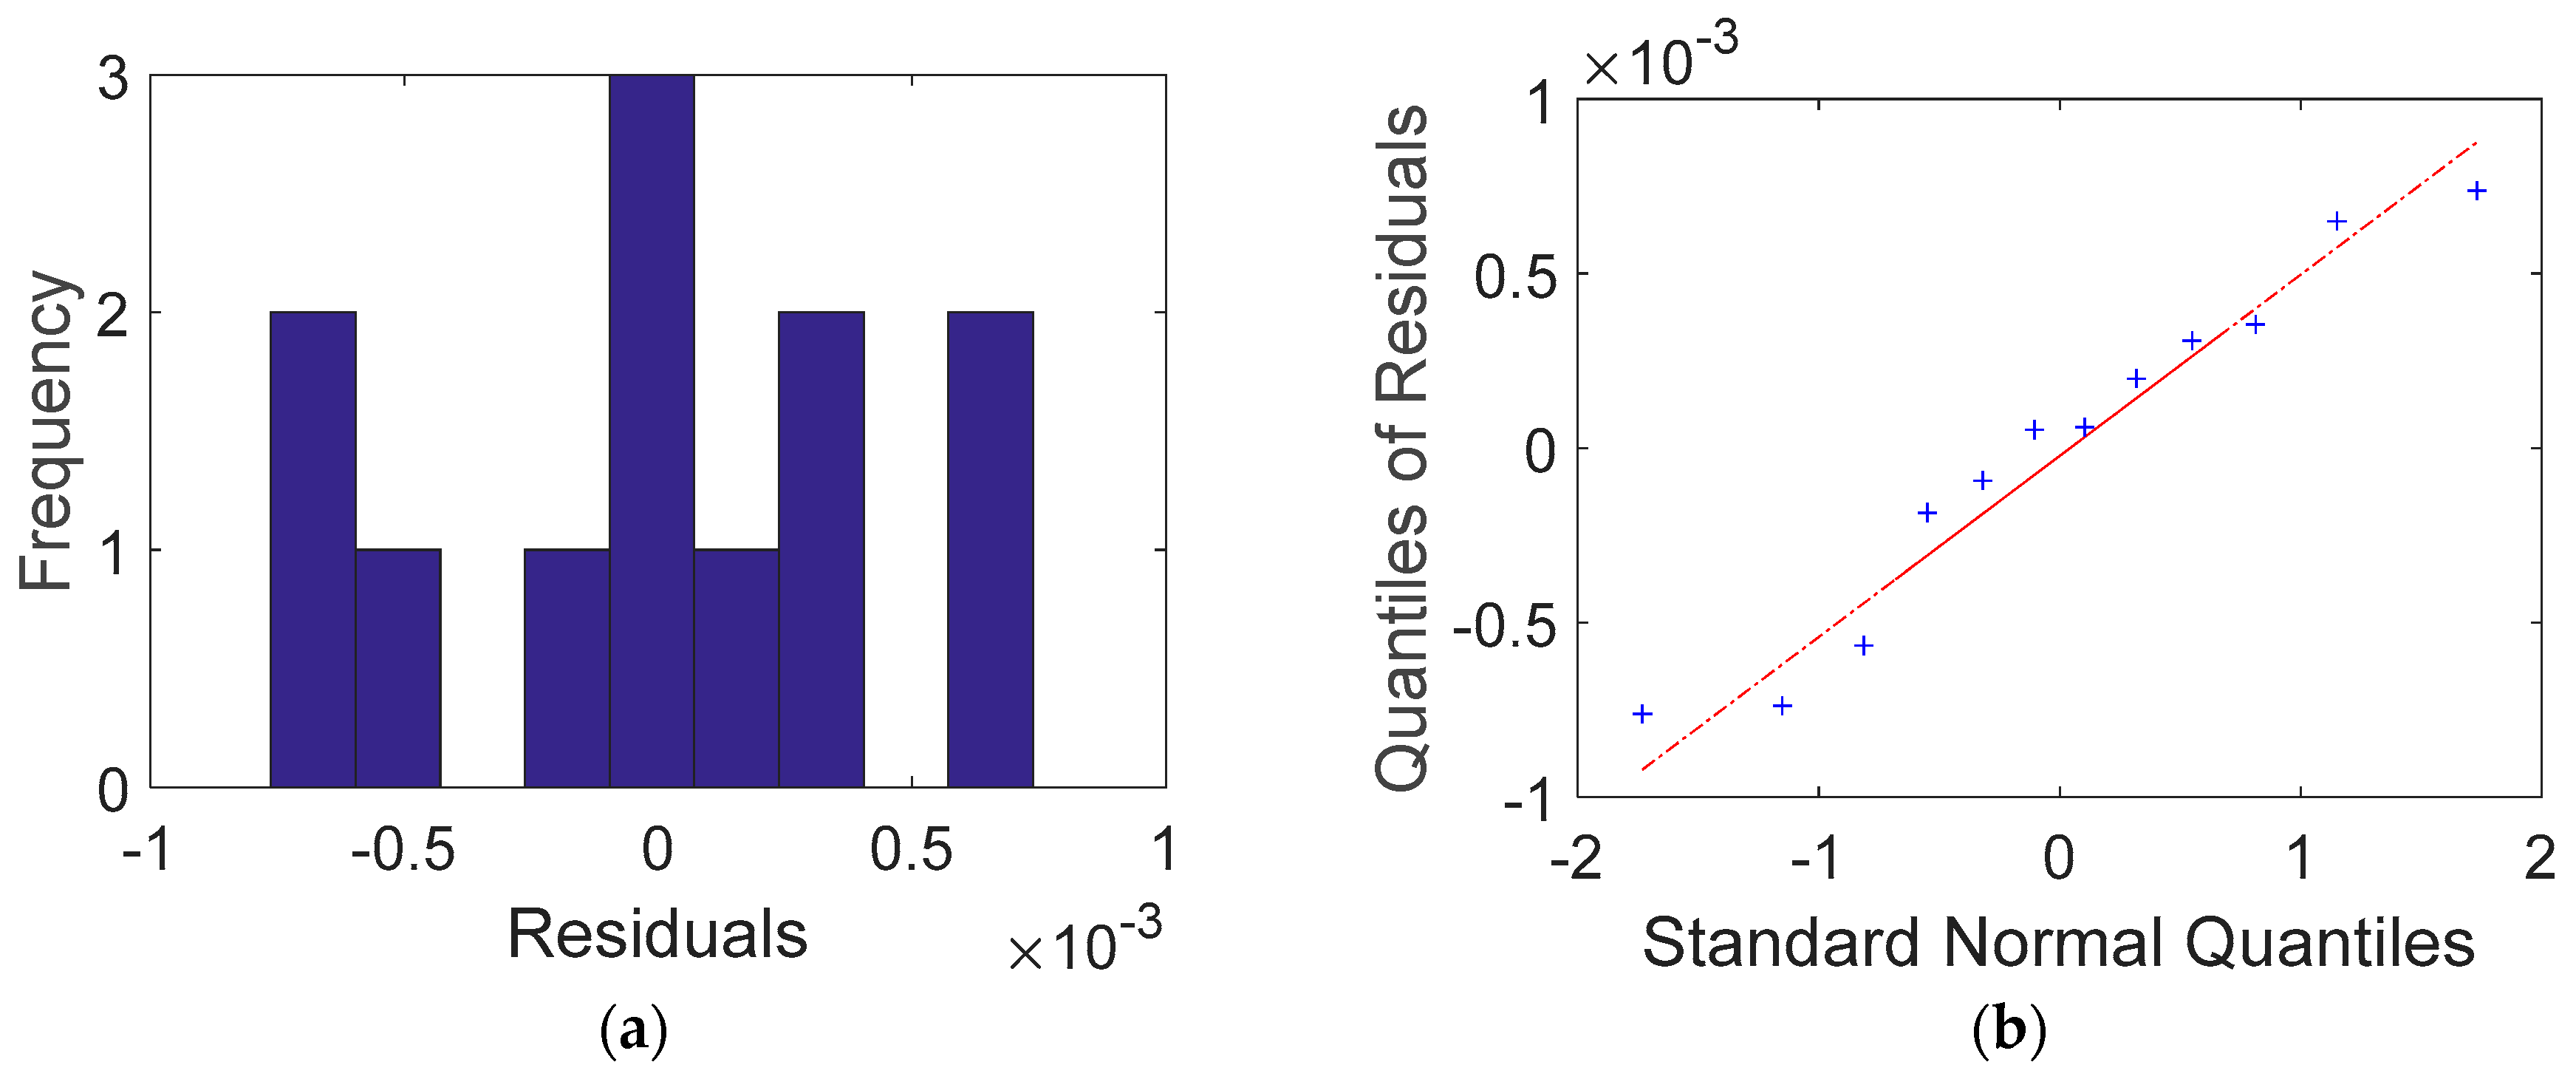
Case 1: Current Flows in and out of the Same Boundary
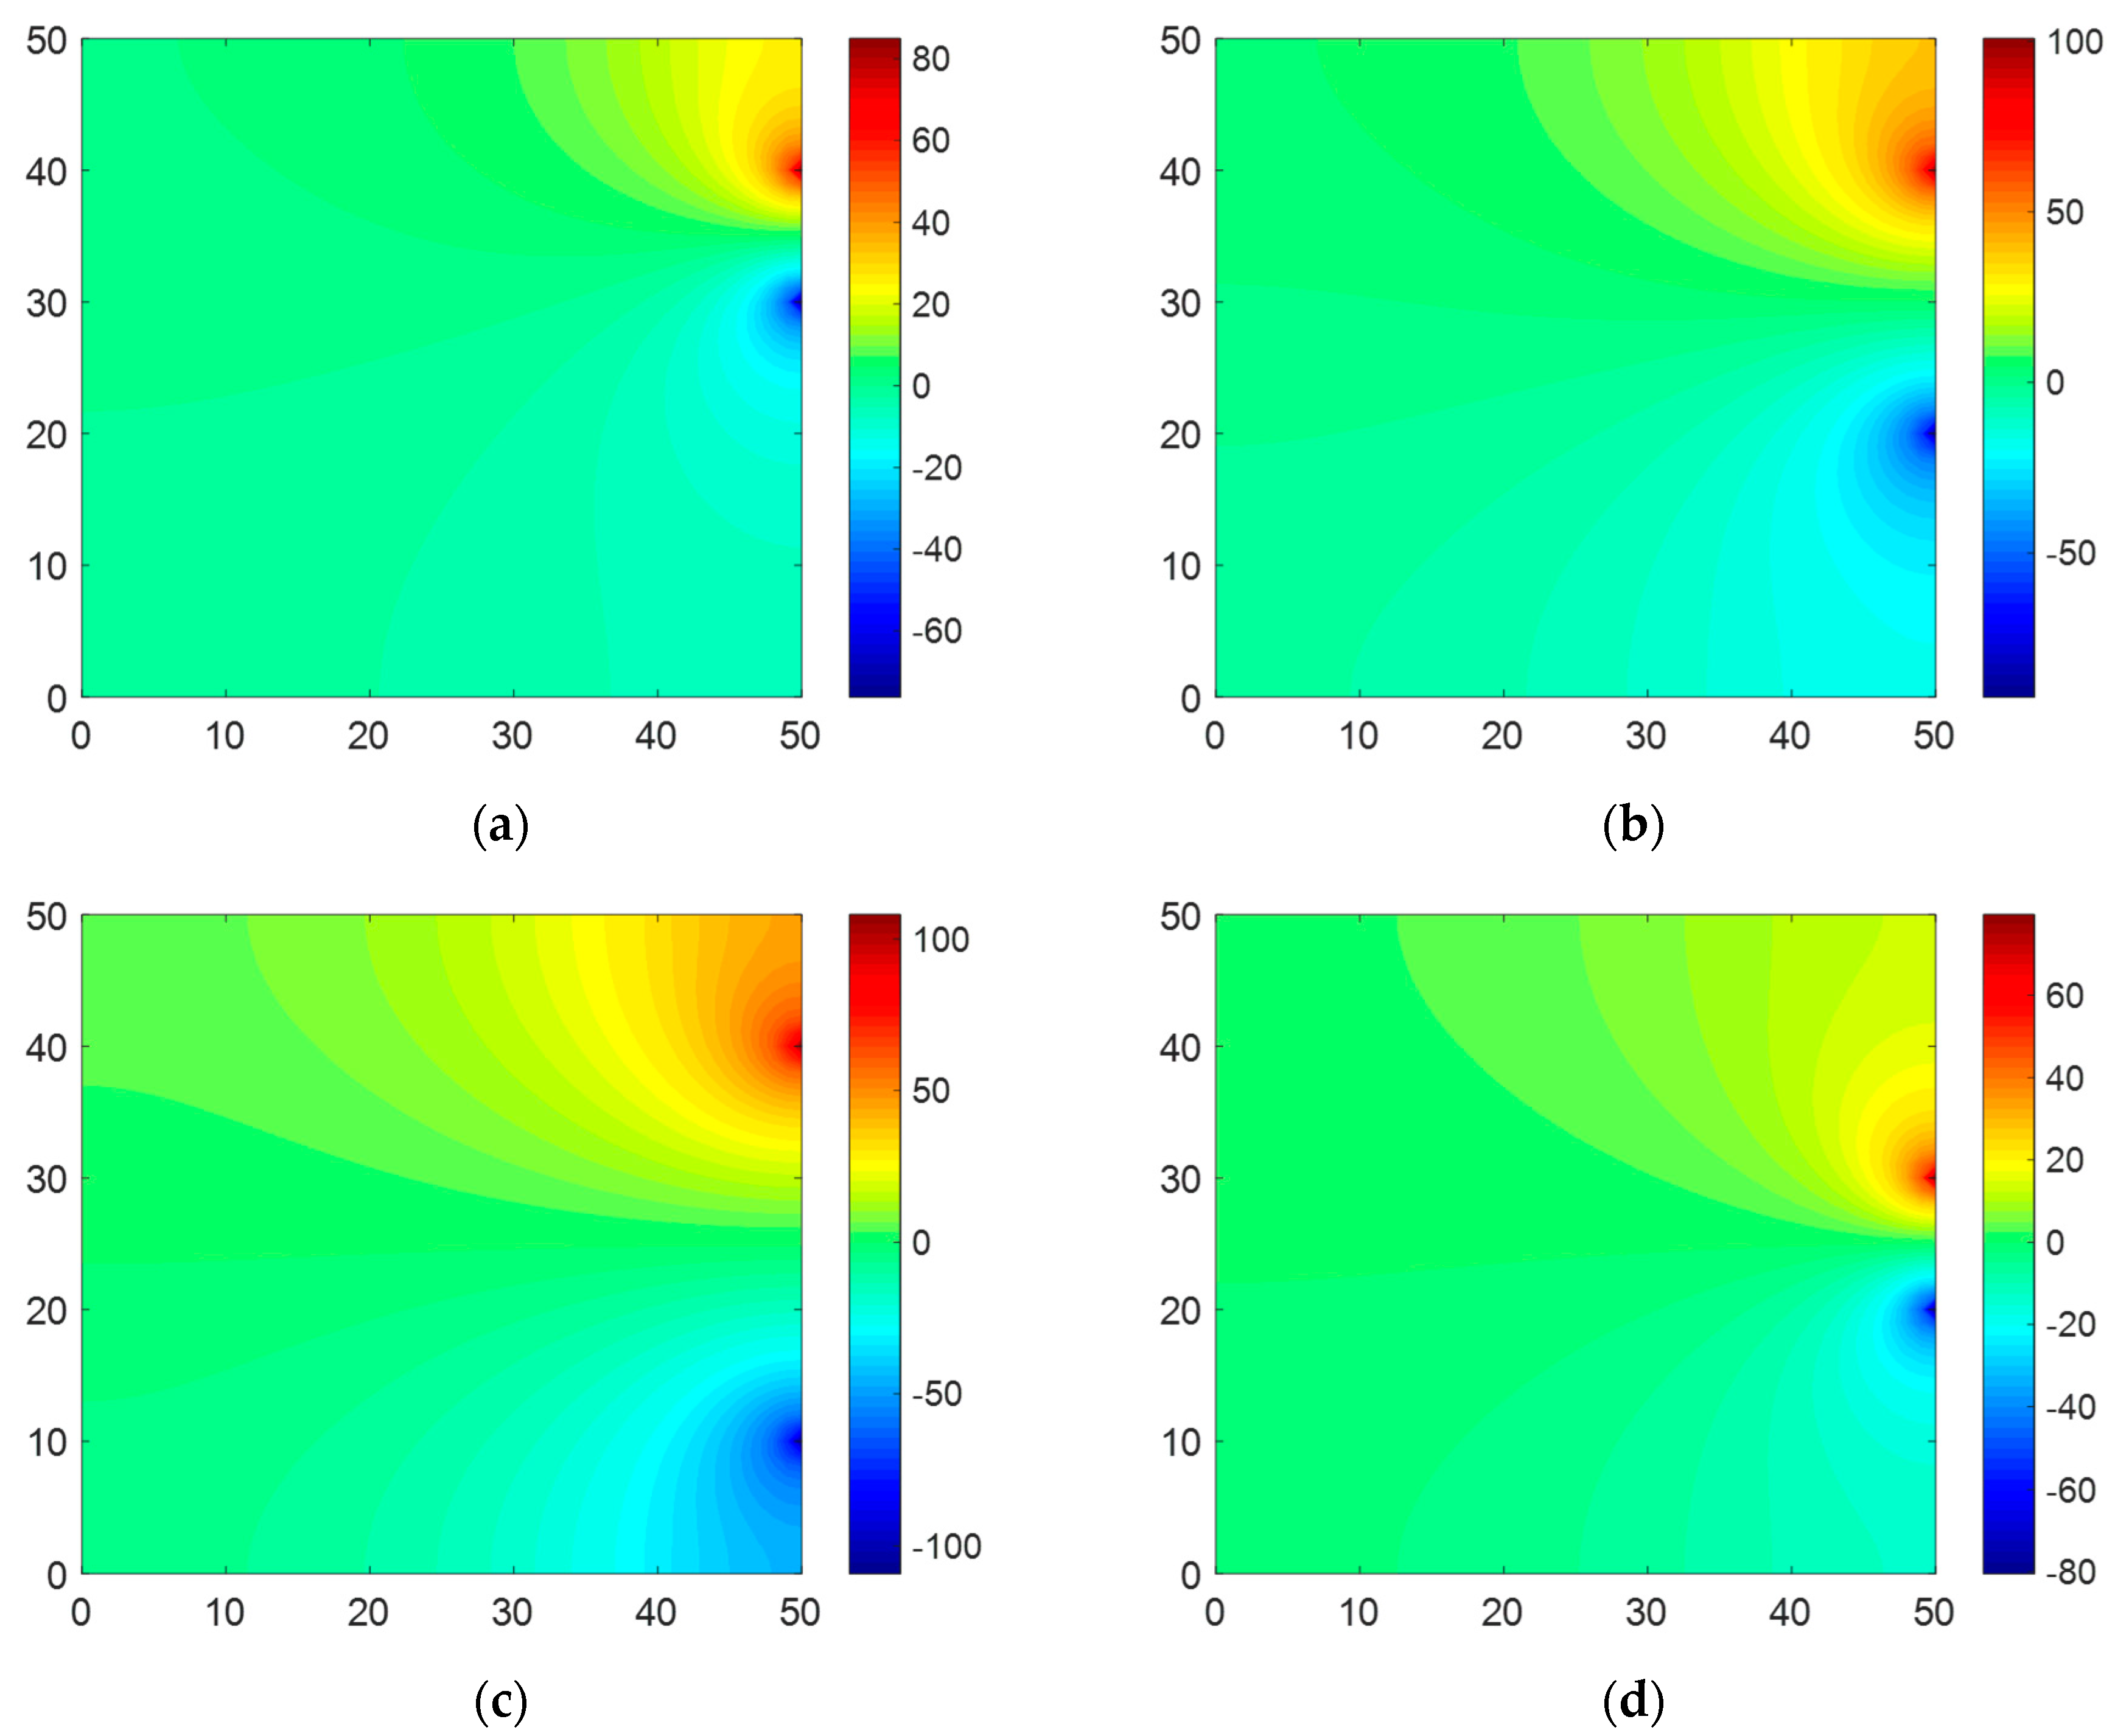
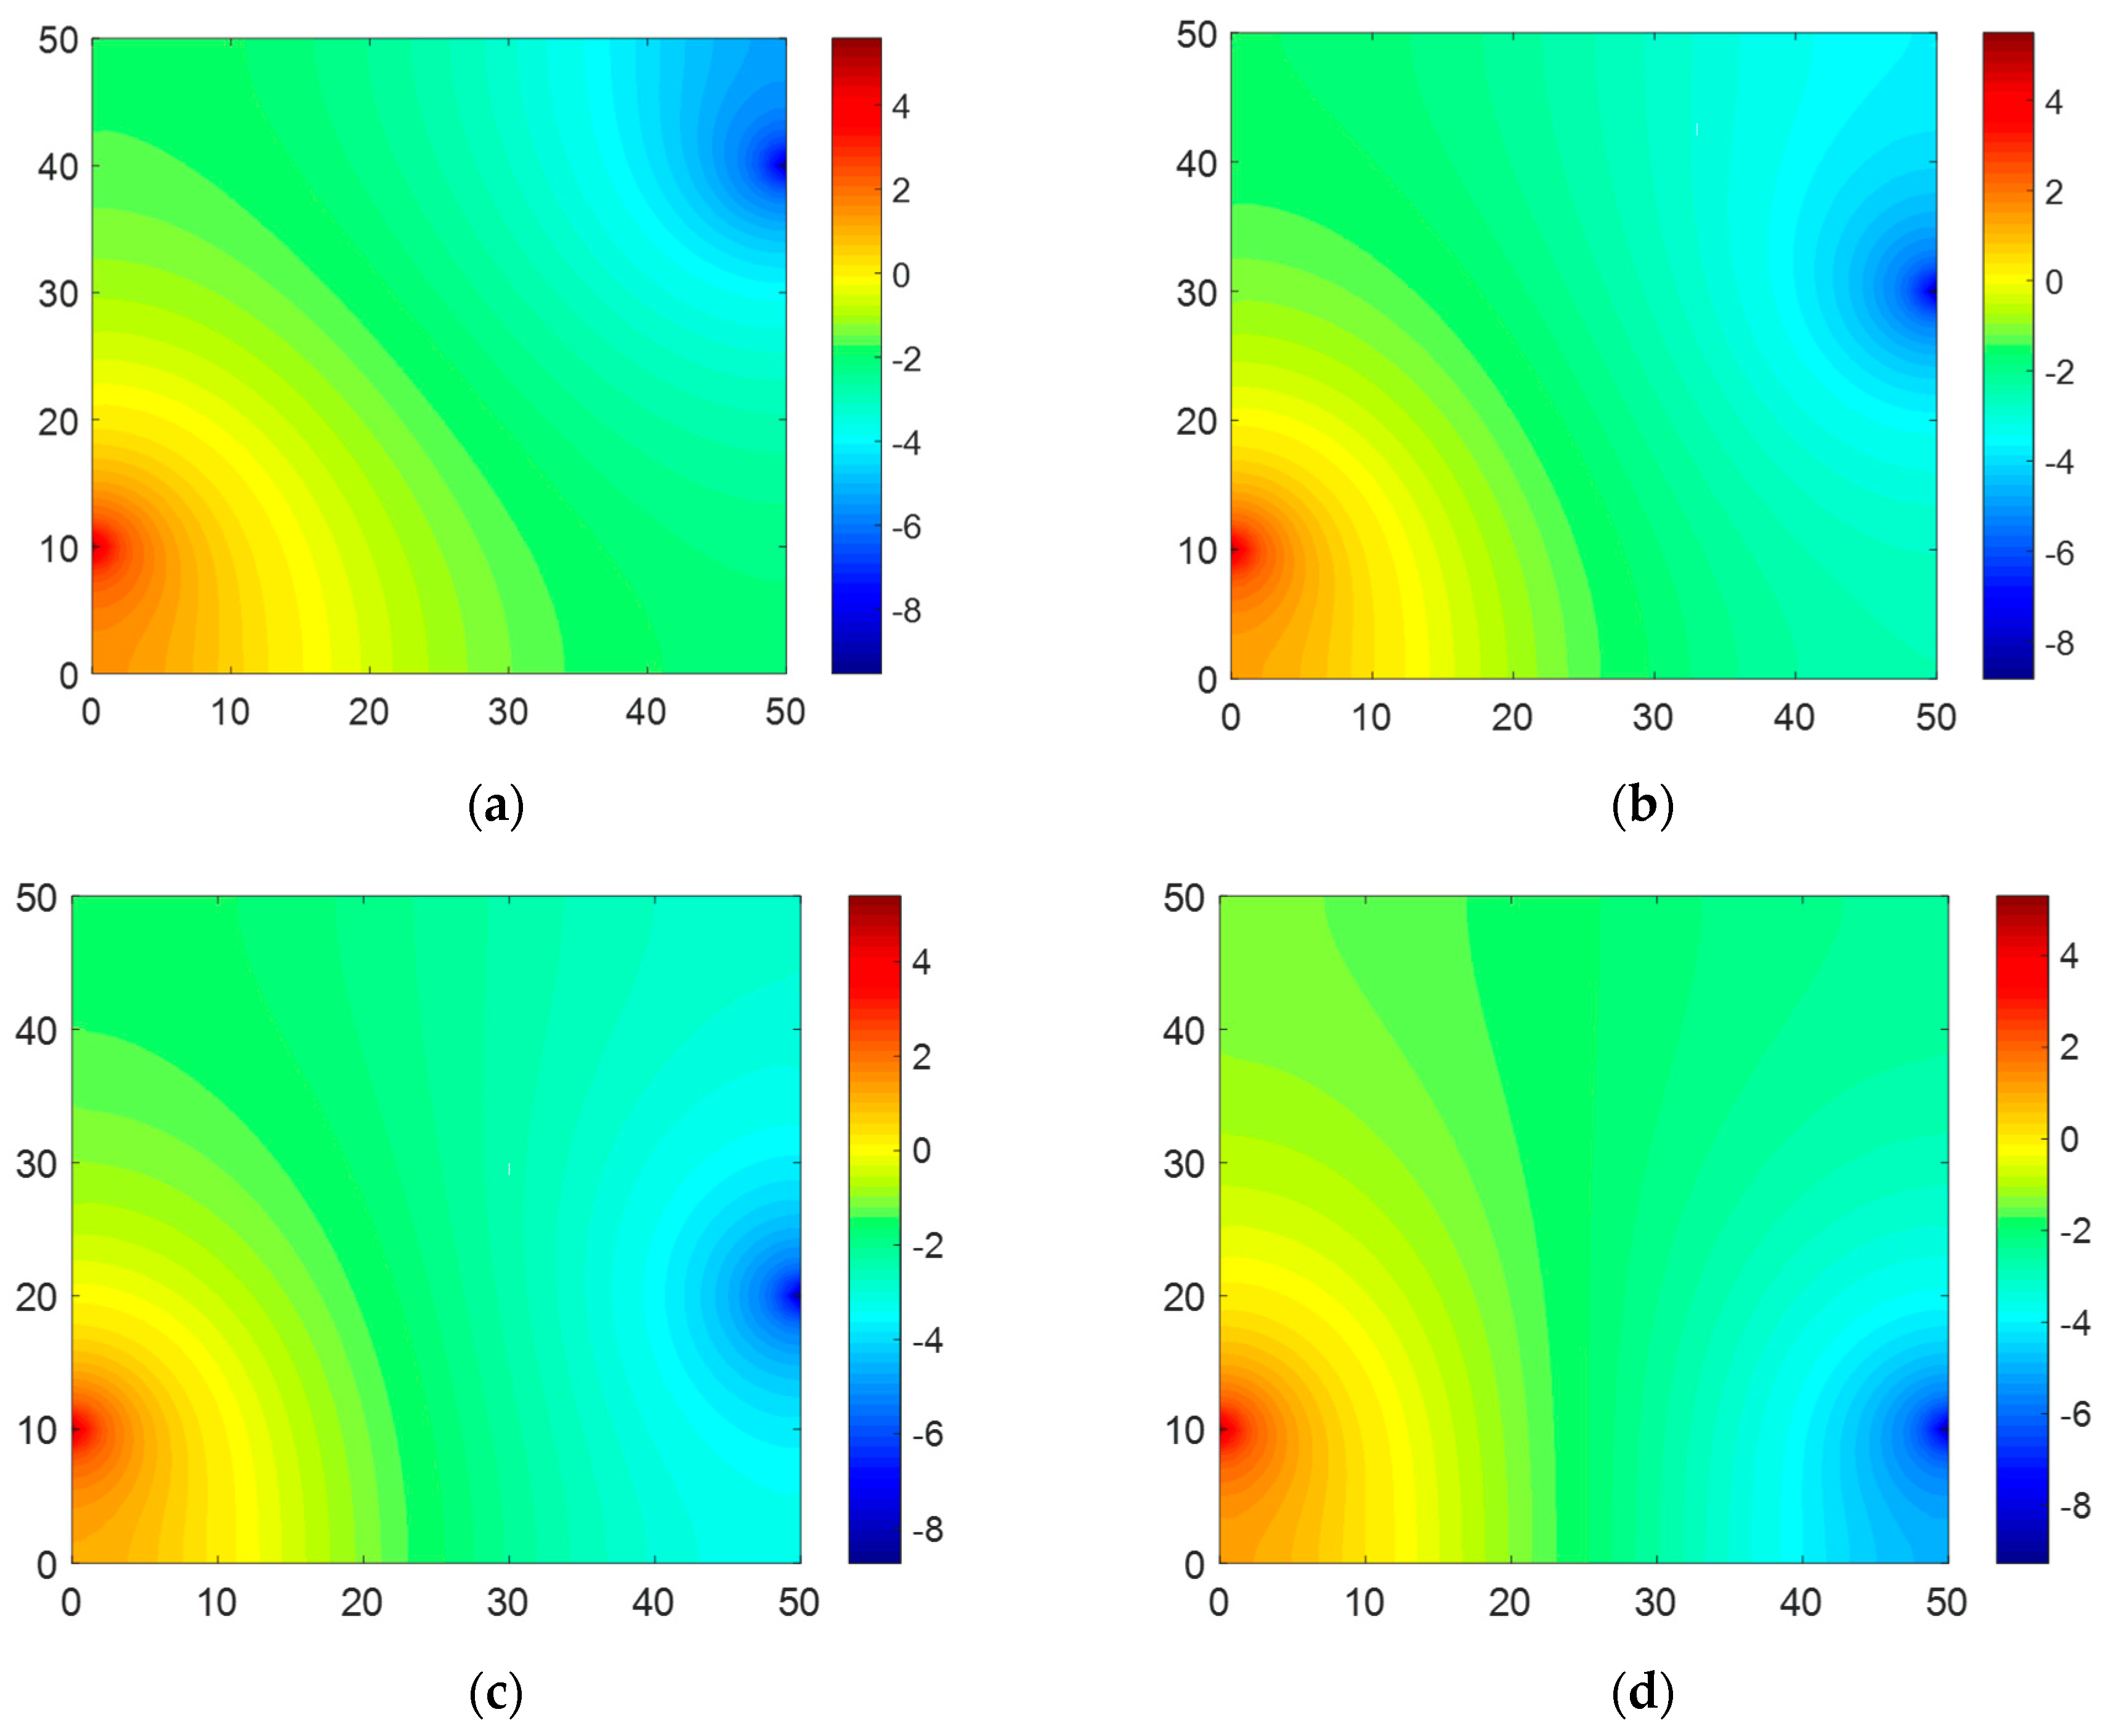
Case 2: Current Flows in from one Boundary and out from the Opposite Boundary
4.2.2. Heaviside Step Function
Case 1: Current Flows in and out of the Same Boundary Surface
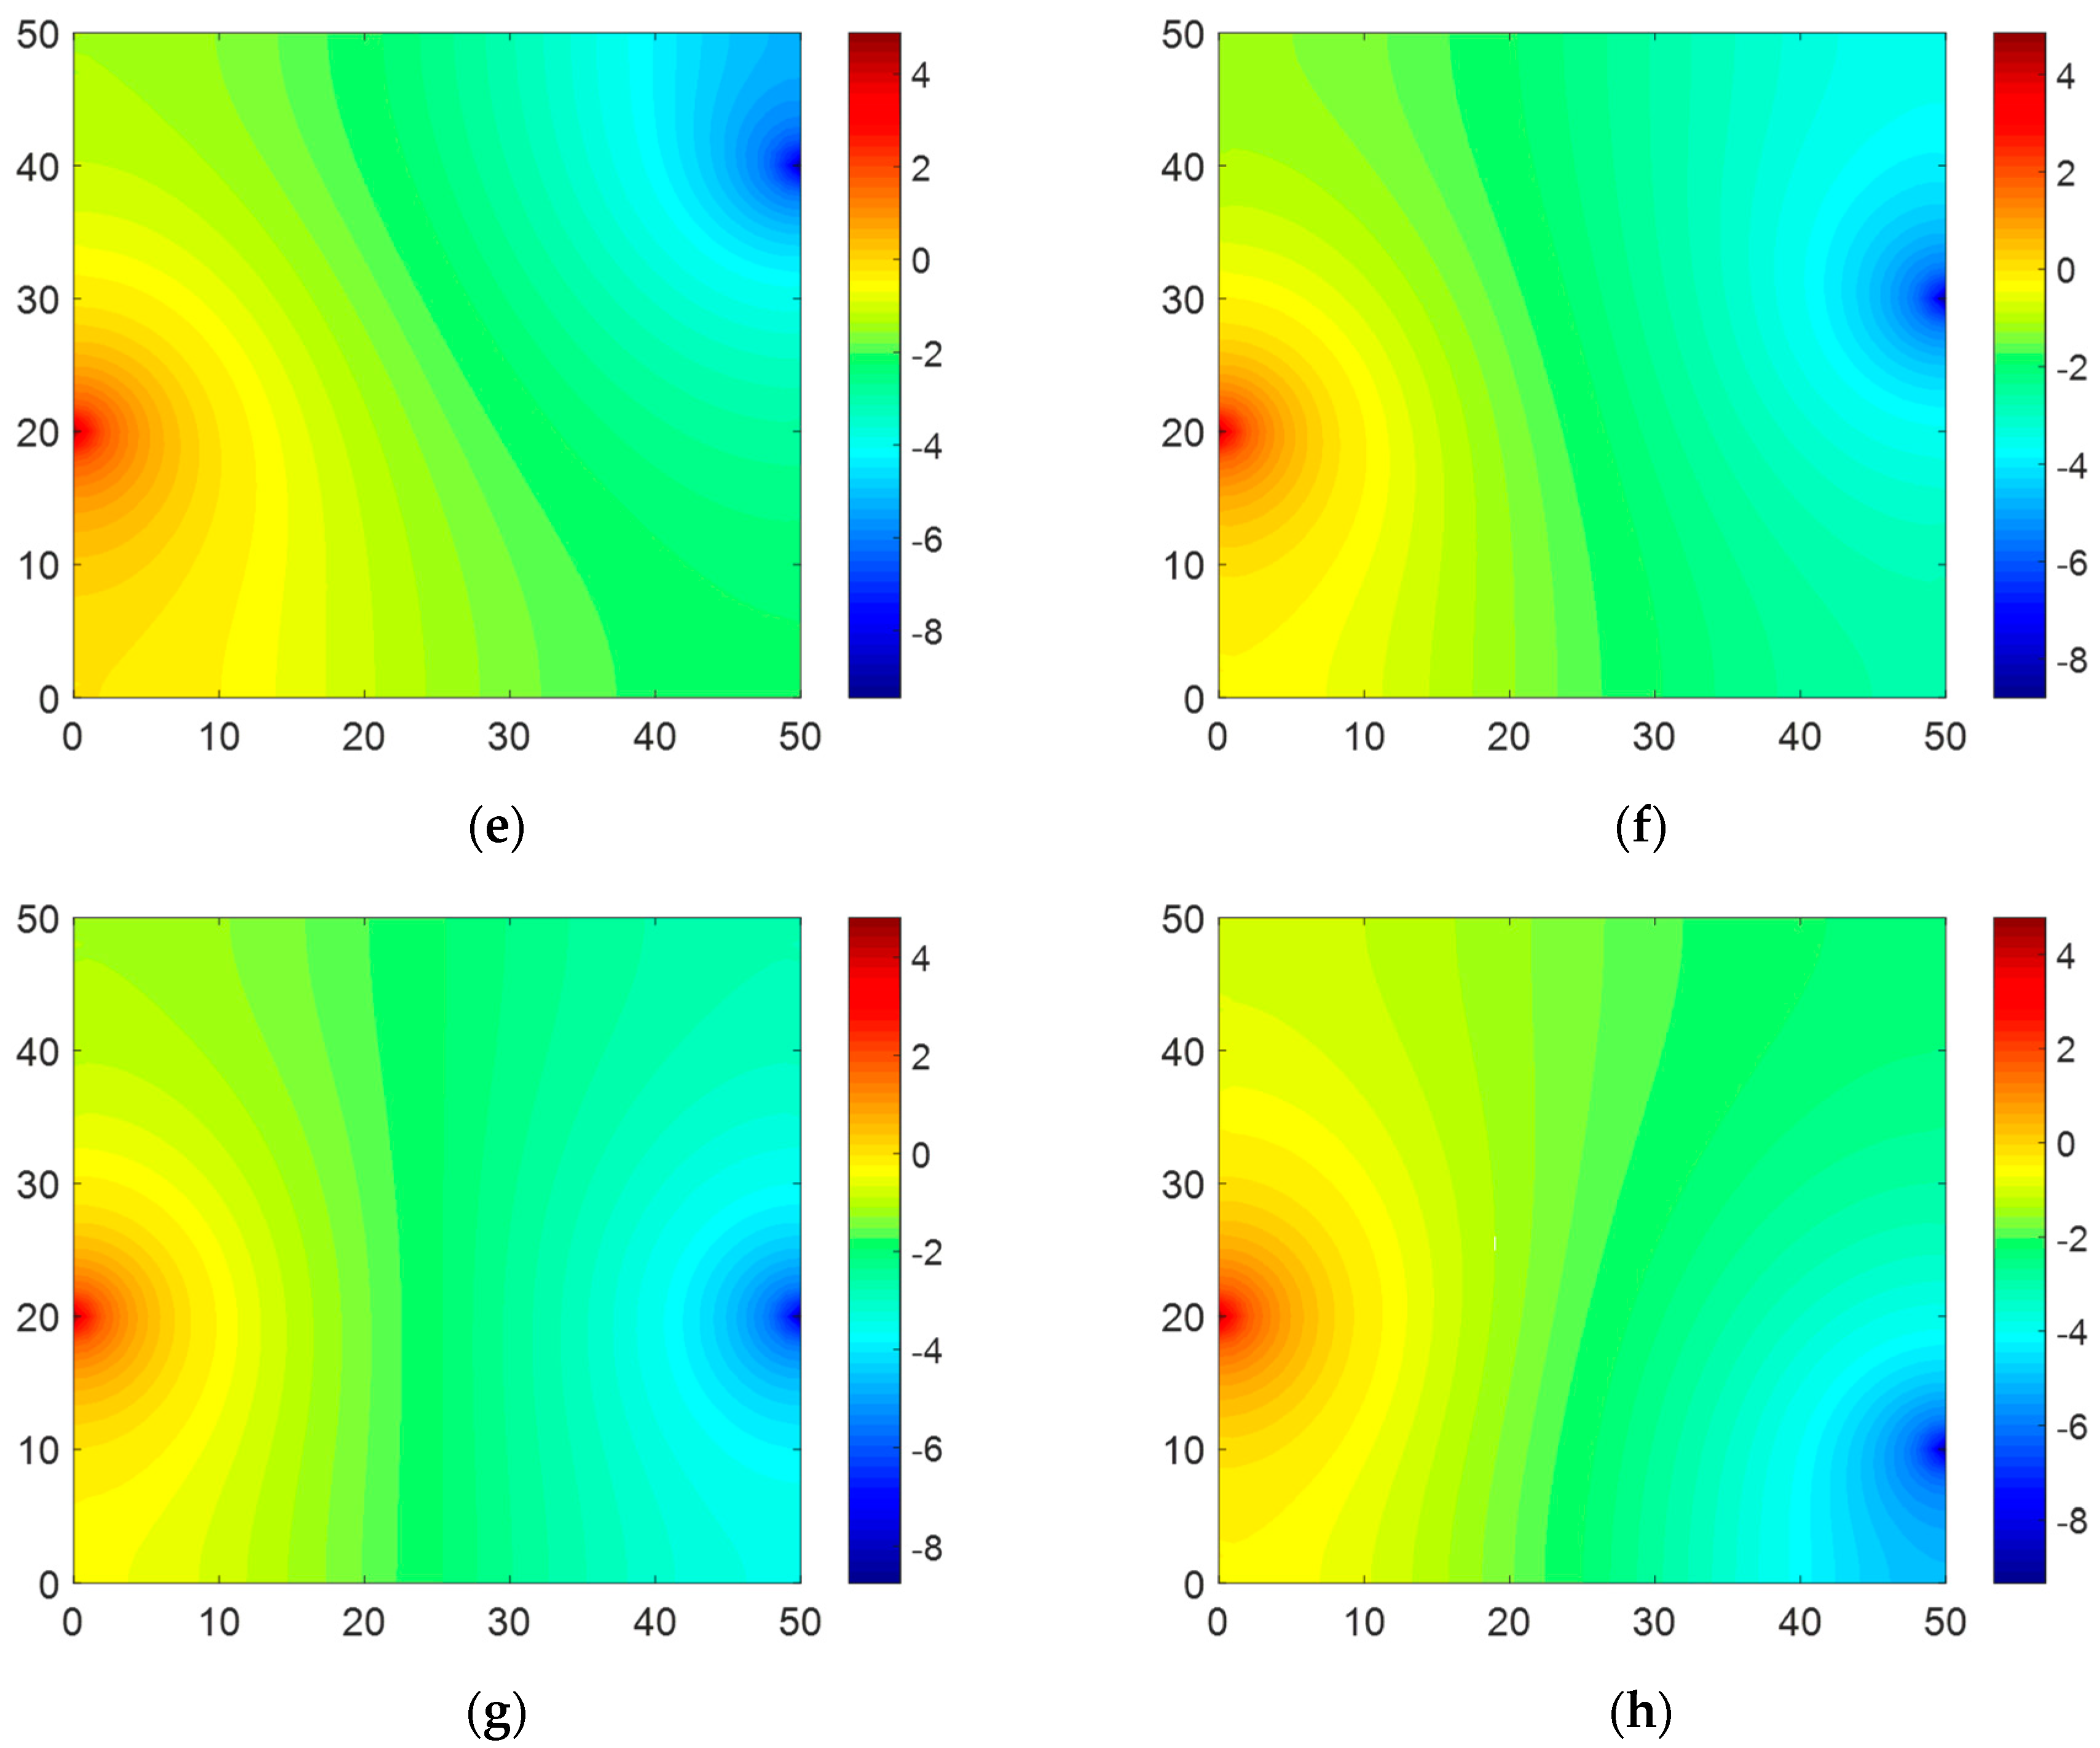
Case 2: Current Flows in from one Boundary and out from the Opposite Boundary
4.2.3. Gaussian Function
Case 1: Current Flows in and out of the Same Boundary Surface
Case 2: Current Flows in from one Boundary and out from the Opposite Boundary
5. Conclusions
- The Shunt model can generally describe the boundary conditions of cement-based materials, which have low electrical conductivity. This was shown by both theoretical and experimental approaches. However, there are a few data having a significant discrepancy between some the calculated and measured voltages. Therefore, it is necessary to consider uncertainties such as the inhomogeneity of the sample and the humidity of the surface electrode.
- The analytical solutions were derived in the form of infinite series. A cutoff up to the 50th was effective in comparing the theoretical to the measured voltages.
- For cement-based elements, the convergence between theoretical and experimental voltages is higher when the current flows from one boundary to the opposite boundary of a sample than in and out of the same boundary.
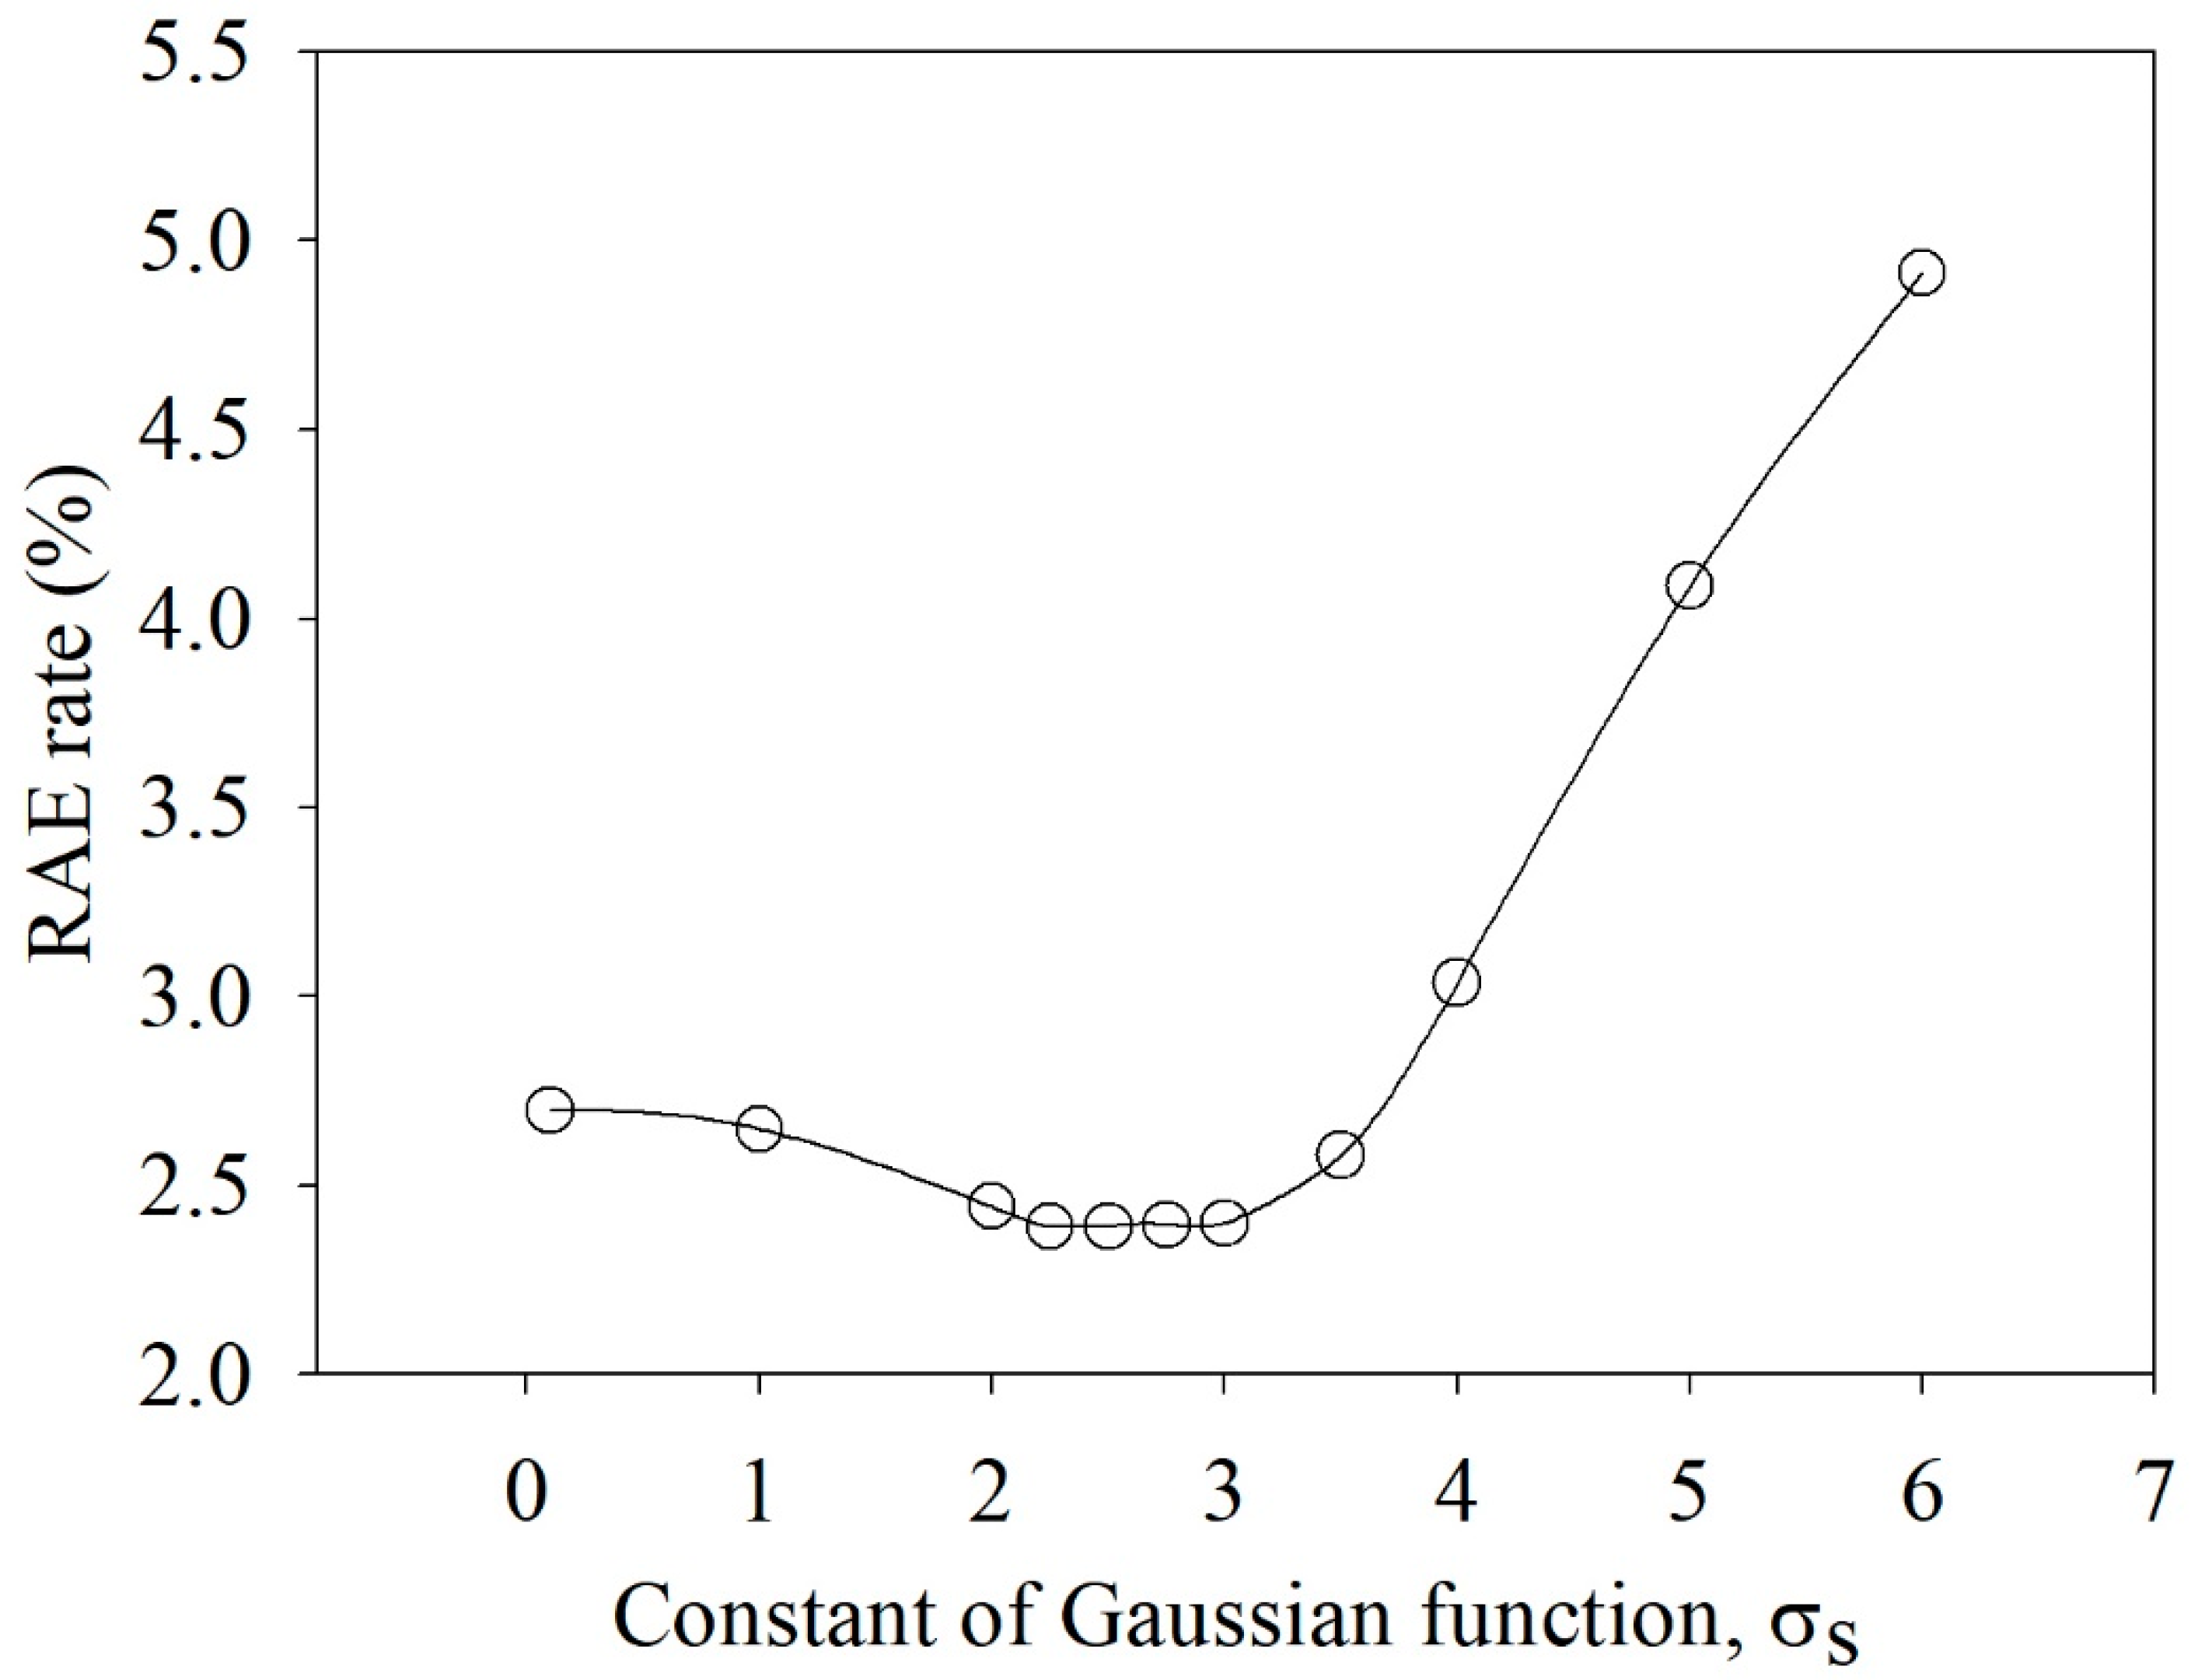
- In comparisons between theoretical and experimental voltages, the Gaussian function shows the lowest RAE, which suggests that it describes current injection more accurately than the Dirac delta and Heaviside step functions. Especially, when σs corresponding to the necessary constant of the Gaussian function is approximately half of the electrode width, the Gaussian function provides the lowest RAE.
Author Contributions
Funding
Institutional Review Board Statement
Informed Consent Statement
Data Availability Statement
Conflicts of Interest
References
- Erdoǧdu, Ş.; Kondratova, I.L.; Bremner, T.W. Determination of chloride diffusion coefficient of concrete using open-circuit potential measurements. Cem. Concr. Res. 2004, 34, 603–609. [Google Scholar] [CrossRef]
- Michel, A.; Pease, B.J.; Geiker, M.R.; Stang, H.; Olesen, J.F. Monitoring reinforcement corrosion and corrosion-induced cracking using non-destructive x-ray attenuation measurements. Cem. Concr. Res. 2011, 41, 1085–1094. [Google Scholar] [CrossRef]
- Collins, D.J. Damage Detection in Composite Materials Using Acoustic Emission and Self-Sensing Fibres. Ph.D. Thesis, University of Birmingham, Birmingham, UK, 2010. [Google Scholar]
- Chang, F.-K. Structural Health Monitoring 2000; CRC Press: Boca Raton, FL, USA, 1999. [Google Scholar]
- Wicaksono, A.M. Design of Electrical Impedance Tomography (EIT) for Medical Imaging Application. In Proceedings of the 2019 IEEE International Conference of Smart Instrumentation, Measurement and Application, Kuala Lumpur, Malaysia, 27–29 August 2019; IEEE: Piscataway, NJ, USA, 2019; pp. 1–4. [Google Scholar] [CrossRef]
- Li, Z.; Zhang, J.; Liu, D.; Du, J. CT image-guided electrical impedance tomography for medical imaging. IEEE Trans. Med. Imaging 2019, 39, 1822–1832. [Google Scholar] [CrossRef] [PubMed]
- Karhunen, K.; Seppänen, A.; Lehikoinen, A.; Monteiro, P.J.M.; Kaipio, J.P. Electrical resistance tomography imaging of concrete. Cem. Concr. Res. 2010, 40, 137–145. [Google Scholar] [CrossRef]
- Gupta, S.; Gonzalez, J.G.; Loh, K.J. Self-sensing concrete enabled by nano-engineered cement-aggregate interfaces. Struct. Health Monit. 2017, 16, 309–323. [Google Scholar] [CrossRef]
- Hou, T.-C.; Lynch, J.P. Electrical impedance tomographic methods for sensing strain fields and crack damage in cementitious structures. J. Intell. Mater. Syst. Struct. 2009, 20, 1363–1379. [Google Scholar] [CrossRef]
- Hallaji, M.; Seppänen, A.; Pour-Ghaz, M. Electrical resistance tomography to monitor unsaturated moisture flow in cementitious materials. Cem. Concr. Res. 2015, 69, 10–18. [Google Scholar] [CrossRef]
- Du Plooy, R.; Villain, G.; Lopes, S.P.; Ihamouten, A.; Derobert, X.; Thauvin, B. Electromagnetic non-destructive evaluation techniques for the monitoring of water and chloride ingress into concrete: A comparative study. Mater. Struct. 2015, 48, 369–386. [Google Scholar] [CrossRef]
- Demidenko, E. An analytic solution to the homogeneous EIT problem on the 2D disk and its application to estimation of electrode contact impedances. Physiol. Meas. 2011, 32, 1453. [Google Scholar] [CrossRef] [PubMed]
- Pidcock, M.K.; Kuzuoglu, M.; Leblebicioglu, K. Analytic and semi-analytic solutions in electrical impedance tomography: I. Two-dimensional problems. Physiol. Meas. 1995, 16, 77–90. [Google Scholar] [CrossRef] [PubMed]
- Jeon, D.; Kim, M.K.; Woo, H.; Jeong, Y.; Oh, J.E.; Kim, D.J.; Yoon, S. Detecting embedded rebar in cement mortar by frequency-difference electrical resistance tomography. Automation in Construction. Autom. Constr. 2021, 132, 103974. [Google Scholar] [CrossRef]
- Layssi, H.; Ghods, P.; Alizadeh, A.R.; Salehi, M. Electrical resistivity of concrete. Concr. Int. 2015, 37, 41–46. [Google Scholar]
- Rymarczyk, T.; Kłosowski, G.; Kozłowski, E. A non-destructive system based on electrical tomography and machine learning to analyze the moisture of buildings. Sensors 2018, 18, 2285. [Google Scholar] [CrossRef] [PubMed]
- Yoon, S.; Macphee, D.E.; Imbabi, M.S. Estimation of the thermal properties of hardened cement paste on the basis of guarded heat flow meter measurements. Thermochim. Acta 2014, 588, 1–10. [Google Scholar] [CrossRef]


| Cement (Type I) | Silica Sand | FSSAs | Silica Fume | Silica Power | Water | Super-Plasticizer |
|---|---|---|---|---|---|---|
| 1.0 | 0.50 | 0.50 | 0.15 | 0.25 | 0.20 | 0.042 |
| Diameter (μm) | Density (g/cm3) | Electrical Conductivity (106 Sm−1) |
|---|---|---|
| <390 | 3.56 | 11.2 |
| Experimental Configuration | Measured | Calculated | Residual (Mea.-Cal.) | |Res.|/Cal. (%) | ||
|---|---|---|---|---|---|---|
| Set #1 | V1 | 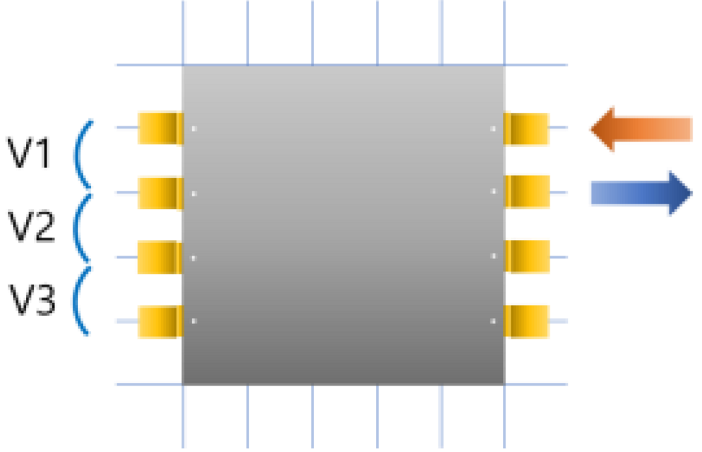 | 0.384 | 0.950 | −0.566 | 59.579 |
| V2 | 0.964 | 1.058 | −0.094 | 8.885 | ||
| V3 | 0.964 | 0.765 | 0.199 | 26.013 | ||
| Set #2 | V1 | 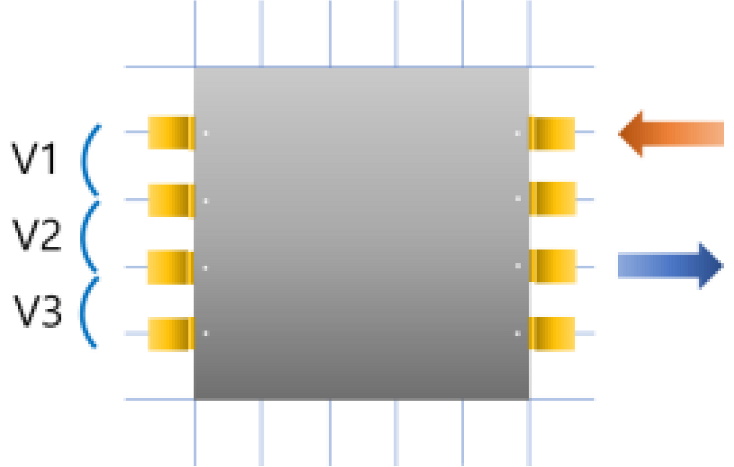 | 1.269 | 2.008 | −0.739 | 36.803 |
| V2 | 2.433 | 2.373 | 0.059 | 2.486 | ||
| V3 | 2.561 | 1.823 | 0.738 | 40.483 | ||
| Set #3 | V1 | 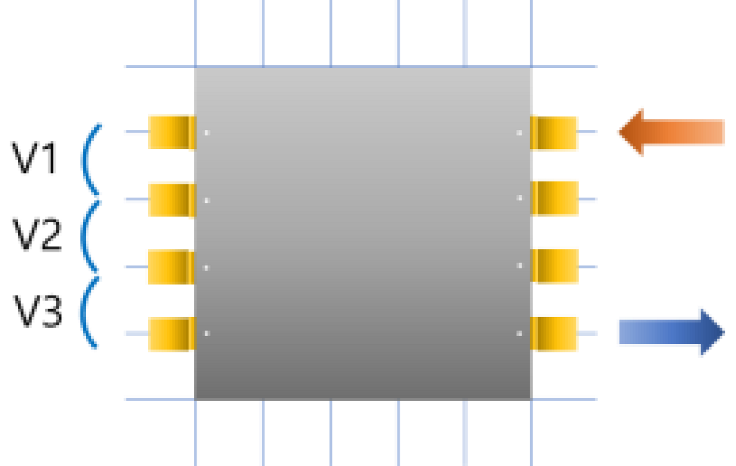 | 2.011 | 2.773 | −0.762 | 27.479 |
| V2 | 3.738 | 3.431 | 0.307 | 8.948 | ||
| V3 | 3.127 | 2.773 | 0.354 | 12.766 | ||
| Set #4 | V1 | 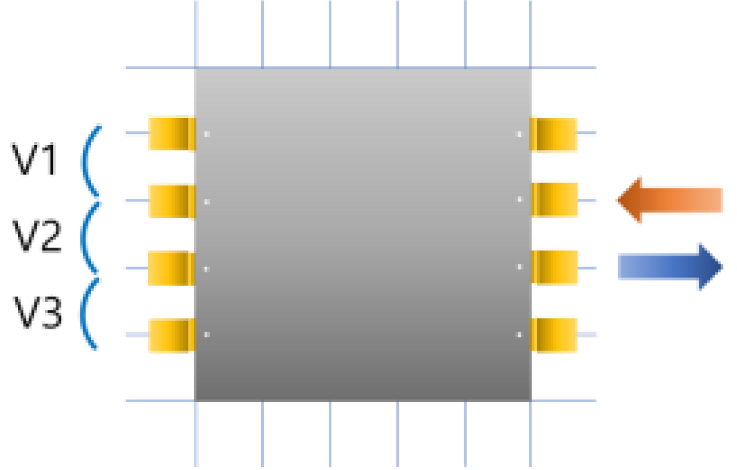 | 0.872 | 1.058 | −0.186 | 17.580 |
| V2 | 1.367 | 1.315 | 0.052 | 3.954 | ||
| V3 | 1.708 | 1.058 | 0.650 | 61.437 | ||
| Experimental Configuration | Measured | Calculated | Residual (Mea.−Cal.) | |Res.|/Cal. (%) | |
|---|---|---|---|---|---|
| Set #1 | V1 | 17.923 | 17.896 | 0.027 | 0.151 |
| V2 | 8.716 | 8.882 | −0.166 | 1.869 | |
| Set #2 | V1 | 16.638 | 16.826 | −0.188 | 1.117 |
| V2 | 7.981 | 7.921 | 0.060 | 0.757 | |
| Set #3 | V1 | 15.412 | 15.497 | −0.085 | 0.548 |
| V2 | 7.090 | 6.852 | 0.238 | 3.473 | |
| Set #4 | V1 | 14.015 | 14.428 | −0.413 | 2.862 |
| V2 | 6.064 | 6.079 | −0.015 | 0.247 | |
| Set #5 | V1 | 6.936 | 7.401 | −0.464 | 6.269 |
| V2 | 13.440 | 13.298 | 0.143 | 1.075 | |
| Set #6 | V1 | 4.392 | 5.558 | −1.167 | 20.997 |
| V2 | 12.895 | 12.337 | 0.558 | 4.523 | |
| Set #7 | V1 | 1.386 | 3.160 | −1.774 | 56.139 |
| V2 | 12.166 | 11.268 | 0.898 | 7.969 | |
| Set #8 | V1 | 1.332 | 1.130 | 0.202 | 17.876 |
| V2 | 11.050 | 10.495 | 0.555 | 5.288 | |
| Experimental Configuration | Measured | Calculated | Residuals (Mea.−Cal.) | |Res.|/Cal. (%) | |
|---|---|---|---|---|---|
| Set #1 | V1 | 0.384 | 0.949 | −0.565 | 59.536 |
| V2 | 0.964 | 1.058 | −0.094 | 8.885 | |
| V3 | 0.964 | 0.766 | 0.198 | 25.849 | |
| Set #2 | V1 | 1.269 | 2.007 | −0.738 | 36.771 |
| V2 | 2.433 | 2.373 | 0.059 | 2.486 | |
| V3 | 2.561 | 1.824 | 0.737 | 40.406 | |
| Set #3 | V1 | 2.011 | 2.773 | −0.762 | 27.479 |
| V2 | 3.738 | 3.431 | 0.307 | 8.948 | |
| V3 | 3.127 | 2.773 | 0.354 | 12.766 | |
| Set #4 | V1 | 0.872 | 1.058 | −0.186 | 17.580 |
| V2 | 1.367 | 1.315 | 0.052 | 3.954 | |
| V3 | 1.708 | 1.058 | 0.650 | 61.437 | |
| Experimental Configuration | Measured | Calculated | Residual (Mea.−Cal.) | |Res.|/Cal. (%) | |
|---|---|---|---|---|---|
| Set #1 | V1 | 17.923 | 17.881 | 0.041 | 0.229 |
| V2 | 8.716 | 8.816 | −0.101 | 1.146 | |
| Set #2 | V1 | 16.638 | 16.828 | −0.189 | 1.123 |
| V2 | 7.981 | 7.871 | 0.110 | 1.398 | |
| Set #3 | V1 | 15.412 | 15.518 | −0.106 | 0.683 |
| V2 | 7.090 | 6.817 | 0.273 | 4.005 | |
| Set #4 | V1 | 14.015 | 14.464 | −0.449 | 3.104 |
| V2 | 6.064 | 6.053 | 0.010 | 0.165 | |
| Set #5 | V1 | 6.936 | 7.324 | −0.387 | 5.284 |
| V2 | 13.440 | 13.320 | 0.120 | 0.901 | |
| Set #6 | V1 | 4.392 | 5.506 | −1.115 | 20.251 |
| V2 | 12.895 | 12.375 | 0.520 | 4.202 | |
| Set #7 | V1 | 1.386 | 3.143 | −1.757 | 55.902 |
| V2 | 12.166 | 11.321 | 0.845 | 7.464 | |
| Set #8 | V1 | 1.332 | 1.143 | 0.189 | 16.535 |
| V2 | 11.050 | 10.558 | 0.492 | 4.660 | |
| Experimental Configuration | Measured | Calculated | Residual (Mea.−Cal.) | |Res.|/Cal. (%) | |
|---|---|---|---|---|---|
| Set #1 | V1 | 0.384 | 0.948 | −0.564 | 59.494 |
| V2 | 0.964 | 1.058 | −0.094 | 8.885 | |
| V3 | 0.964 | 0.768 | 0.196 | 25.521 | |
| Set #2 | V1 | 1.269 | 2.006 | −0.737 | 36.740 |
| V2 | 2.433 | 2.373 | 0.059 | 2.486 | |
| V3 | 2.561 | 1.826 | 0.735 | 40.252 | |
| Set #3 | V1 | 2.011 | 2.774 | −0.763 | 27.505 |
| V2 | 3.738 | 3.431 | 0.307 | 8.948 | |
| V3 | 3.127 | 2.774 | 0.353 | 12.725 | |
| Set #4 | V1 | 0.872 | 1.058 | −0.186 | 17.580 |
| V2 | 1.367 | 1.315 | 0.052 | 3.954 | |
| V3 | 1.708 | 1.058 | 0.650 | 61.437 | |
| Experimental Configuration | Measured | Calculated | Residual (Mea.−Cal.) | |Res.|/Cal. (%) | |
|---|---|---|---|---|---|
| Set #1 | V1 | 17.923 | 17.857 | 0.066 | 0.370 |
| V2 | 8.716 | 8.709 | 0.006 | 0.069 | |
| Set #2 | V1 | 16.638 | 16.826 | −0.188 | 1.117 |
| V2 | 7.981 | 7.786 | 0.195 | 2.504 | |
| Set #3 | V1 | 15.412 | 15.545 | −0.133 | 0.856 |
| V2 | 7.090 | 6.755 | 0.334 | 4.944 | |
| Set #4 | V1 | 14.015 | 14.514 | −0.499 | 3.438 |
| V2 | 6.064 | 6.007 | 0.056 | 0.932 | |
| Set #5 | V1 | 6.936 | 7.203 | −0.267 | 3.707 |
| V2 | 13.440 | 13.356 | 0.085 | 0.636 | |
| Set #6 | V1 | 4.392 | 5.424 | −1.033 | 19.045 |
| V2 | 12.895 | 12.432 | 0.463 | 3.724 | |
| Set #7 | V1 | 1.386 | 3.113 | −1.727 | 55.477 |
| V2 | 12.166 | 11.402 | 0.764 | 6.701 | |
| Set #8 | V1 | 1.332 | 1.159 | 0.173 | 14.927 |
| V2 | 11.050 | 10.653 | 0.396 | 3.717 | |
Disclaimer/Publisher’s Note: The statements, opinions and data contained in all publications are solely those of the individual author(s) and contributor(s) and not of MDPI and/or the editor(s). MDPI and/or the editor(s) disclaim responsibility for any injury to people or property resulting from any ideas, methods, instructions or products referred to in the content. |
© 2022 by the authors. Licensee MDPI, Basel, Switzerland. This article is an open access article distributed under the terms and conditions of the Creative Commons Attribution (CC BY) license (https://creativecommons.org/licenses/by/4.0/).
Share and Cite
Yoon, S.; Jeon, D.; Oh, J.-E.; Kim, M.-K.; Kim, D.-J. Experimentally Validated Analytical Solutions to Homogeneous Problems of Electrical Impedance Tomography (EIT) on Rectangular Cement-Based Materials. Appl. Sci. 2023, 13, 335. https://doi.org/10.3390/app13010335
Yoon S, Jeon D, Oh J-E, Kim M-K, Kim D-J. Experimentally Validated Analytical Solutions to Homogeneous Problems of Electrical Impedance Tomography (EIT) on Rectangular Cement-Based Materials. Applied Sciences. 2023; 13(1):335. https://doi.org/10.3390/app13010335
Chicago/Turabian StyleYoon, Seyoon, Dongho Jeon, Jae-Eun Oh, Min-Kyoung Kim, and Dong-Joo Kim. 2023. "Experimentally Validated Analytical Solutions to Homogeneous Problems of Electrical Impedance Tomography (EIT) on Rectangular Cement-Based Materials" Applied Sciences 13, no. 1: 335. https://doi.org/10.3390/app13010335
APA StyleYoon, S., Jeon, D., Oh, J.-E., Kim, M.-K., & Kim, D.-J. (2023). Experimentally Validated Analytical Solutions to Homogeneous Problems of Electrical Impedance Tomography (EIT) on Rectangular Cement-Based Materials. Applied Sciences, 13(1), 335. https://doi.org/10.3390/app13010335


