Abstract
Climate change may alter tree species’ distribution, which could impact on forest biodiversity. However, frequent and continuous surveys of forests need intense labor and are time-consuming. The current study utilized SENTINEL-2 images of Geomunoreum to solve this problem as a case study. Acquired images were converted into various indices, such as the normalized difference vegetation index (NDVI), which could be an efficient method to examine the diversity in forests over time. In the current study, the images were obtained in March and April from 2017 to 2021. As a result of analysis using NDVI images of the study area taken from the satellite, vegetation groups were classified into evergreen trees and deciduous trees. This implies that NDVI using extracted data from SENTINEL-2 images could be used for surveying large-scale examinations for tree classification in order to observe variations caused by climate change in an efficient and cost-effective manner.
1. Introduction
Global warming is threatening life on the earth, because it causes frequent and intense unanticipated environmental changes, such as drought, precipitation, and storms [1,2,3]. To mitigate global warming, the management of forests is an effective solutions [4,5]. The major factor of global warming is CO2, and reducing the gas concentration is essential to slow global warming [6,7]. Forests hold a significant amount of CO2 and offer a habitat for many species [8,9].
Forests can be broadly categorized into mixed forests and monocultural forests. A mixed forest is a forest in which at least two botanical genera trees occur. On the other hand, only one botanical genera tree occurs in a monocultural forest. A mixed forest is more efficient than a monocultural forest. Researchers have suggested that mixed forests could be a larger buffer than monocultural forests against environmental changes [10]. The effect of 20 tree species in subtropical forests in southeast China has been studied, showing that the total carbon stocks increase 6.4% by adding a tree species. Additionally, more diverse species live in mixed forests [11] because these environments offer a diverse environment for life. Additionally, they have strong resistance to various disasters, such as landslides and wildfire. Initially, mixed forests are strong in landslides. Usually, evergreen trees are shallow-rooted, whereas deciduous trees are relatively deep-rooted. Therefore, mixed forests are advantageous in their vast soil retention, which yields resistance to landslides [12]. Secondly, mixed forests have resistance to wildfire. Flammability and resistance to fire are different in each species that comprise the forest. Thus, increasing the species diversity in forests could reduce the possibility of wildfires [13]. For instance, admixing broad leaves with conifers increases the resistance to fire more than pure conifer forest [14]. Their findings are supported by the observation that diverse species complement ecological trait and allow to reduce fuel and food resources.
Therefore, constructing a mixed forest is an efficient solution to prepare for global warming threats. Naturally, the composition of the forest achieves a stable state by succession, where a relatively stable plant community dominates the plant population that suits each environment [15,16]. Nevertheless, the human management of a forest for climate change adaptation and mitigation strategies is effective [17]. Therefore, human forest management is needed.
The first step for creating mixed forests is seizing the vegetation of the target region. However, direct vegetation surveys are labor-intensive and time-consuming. Additionally, selecting sample regions for vegetation surveys could lead to erroneous results. Therefore, deciding the region for the survey has to carried out carefully. Using satellite images is a reasonable option which replaces direct vegetation surveys or helps select appropriate sample regions for vegetation surveys.
In this study, the target region was Goemunoreum on Jeju Island. Jeju Island is covered with 368 monogenetic volcanic cones, called ‘oreum’ in the Jeju dialect [18]. This region has important geological value, containing well-preserved volcanic landforms [19]. Additionally, its vegetation is reported as a forest composed of warm-temperate plant species and evergreen broad-leaved forests [18,20].
To confirm the vegetation of Geomunoreum, using the Sentinel-2 normalized difference vegetation index (NDVI) and RGB images, we distinguished two vegetation groups: evergreen and deciduous (including grassland). The NDVI is generally recognized as a good indicator for determining vegetation canopy biophysical properties [21,22]. Some recent studies have used deep-learning models to classify the region [23,24,25]. However, they did not consider specific vegetation groups as in our approach. We focused on the different biophysical properties between these two groups immediately after winter and successfully distinguished these groups’ vegetation regions by using NDVI on the sample region, Geomunoreum.
2. Materials and Methods
2.1. Study Area
The study area was Geomunoreum (33°45′62″ N, 126°72′03″ E; altitude 456.6 m), located in Seonheul-ri, Jocheon-eup, Jeju-si, Jeju-do, Republic of Korea, which is one of most visited places by tourists. The area has been actively surveyed by the government, and the actual survey data are available. We could compare the actual survey with our satellite-image-based approach. Figure 1 shows the study area which was obtained by OpenStreetMap, using QGIS (Quantum Geographic Information System). In this study, we used the UTM-52N (EPSG:32652) coordinate system. Similarly to other forest areas, the borders of Geomunoreum are not clear. We used the functionality of QGIS to find a region bounding points in green. The region was assumed to be the area of Geomunoreum, as indicated by the purple line in Figure 1. The left bottom region in green did not belong to Geomunoreum; therefore, we excluded this region. The line between two regions is a road, which means that it is easy to approach Geomunoreum by car using the road. The easiness to approach by tourists means that the ecosystems near Geomunoreum can be harmed, which will eventually affect global warming. It is urgent to monitor the changes of forests in Geomunoreum over time. Moreover, an automatic and accurate technique for monitoring the ecosystems of Geomunoreum is required, which will be a future study that can be performed with the government.
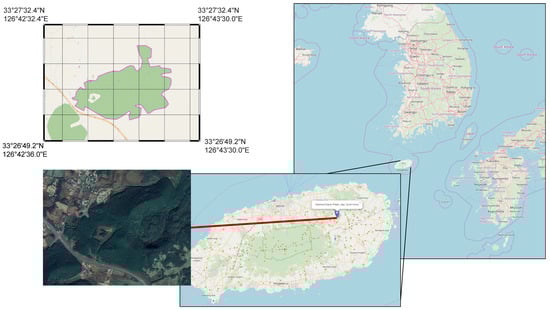
Figure 1.
The study area, Geomunoreum, is located on Jeju Island in South Korea. The width and height of the study area are 1450 m and 1342 m, respectively.
2.2. Data Collection
Images of Geomunoreum were obtained from the Sentinel hub EO browser, where Sentinel-2 satellite images are maintained and publicly available. Sentinel hub provides an Application Programming Interface (API) which enables a program to automatically download images that Sentinel-2 satellite has obtained, being operated as an Earth observation task from the Copernicus Program that collects optical images at 10 m to 60 m resolution over land and coastal seas. It revisits the same place every 10 days. Images from the Sentinel-2 satellite are processed in level-0, level-1, and level-2, and each level is classified further into specific categories such as A, B, and C. Different image corrections are applied to these levels. Only L1C (level-1C) and L2A (level-2A) images are publicly available. When a satellite captures images over land, it is not easy to handle these images in the presence of clouds. Thus, we used L2A type images because they were processed based on L1C images by applying atmospheric corrections. We excluded the days of cloudy weather where the satellite was unable to capture the land. The images were obtained from 2017 to 2022. Specific dates are as follow; 12 April 2017, 18 April 2018, 24 March 2019, 23 March 2020, and 24 March 2021.
2.3. Classification of the Vegetation Area by NDVI Value
The envelope of Sentinel-2 satellite images varies according to the resolution. We used the highest resolution (10 m) which contained spectral bands of 2, 3, 4, 8, TCI (True Colour Image), etc. We used band 4 (red light, RED) and band 8 (near-infrared light, NIR) images in order to calculate NDVI, as shown in Equation (1).
According to the equation, the NDVI value ranged from −1.0 to 1.0. For the study area, however, no image existed that had an NDVI value of less than 0. This can be understood by the fact that the study area was clipped based on OpenStreetMap, in which only the green region remained.
The study area had four distinct seasons. In this study, evergreen refers to the region where most tree species keep their leaves during all four seasons; deciduous is the region where leaves tend to fall off at maturity, usually in autumn; grassland is an area of land where vegetation is dominated by grasses. In order to examine the classification criteria, we collected images in winter and summer in the same year. Due to the unavailability of 2017, 2018, and 2022 in Sentinel hub, only 2020 and 2021 were successfully collected. Figure 2 shows the comparison of NDVI images in winter in the first column and summer in the second column for 2020 and 2021. For 2021, the image in August was not available; therefore, we used the image for September. The green area of the summer image was subtracted from the winter image to obtain the area of deciduous trees; and the green area of deciduous trees was calculated from the area of the summer image to determine the evergreen tree area based on NDVI with confirmation from experts who had screened this area. After subtraction, the NDVI threshold (0.6) was set based on the results. In this case, the green area of deciduous trees could contain the grass area. The manual survey map for Geomunoreum is publicly available from the Korea Forest Service (https://map.forest.go.kr/forest (accessed on 21 October 2022)). We confirmed the correctness of our criteria based on Figure S1 in the Supplementary Materials.
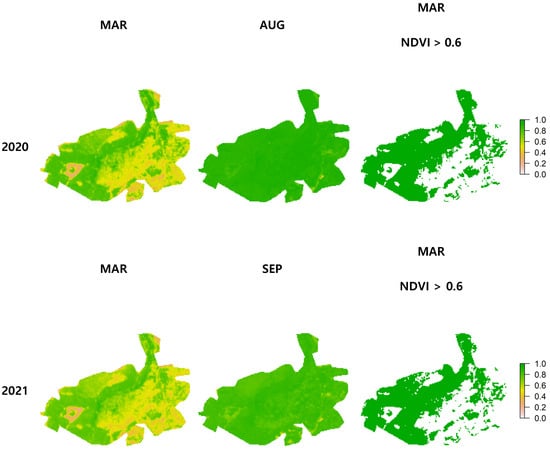
Figure 2.
NDVI images of Geomunoreum in winter (the first column) and summer (the second column) for 2020 and 2021. The third column represents only pixels with an NDVI value greater than 0.6 in the NDVI image for March.
3. Results and Discussion
Three types of information of Geomunoreum from 2017 to 2021 are depicted in Figure 3, Figure 4, Figure 5 and Figure 6; RGB images, corresponding NDVI images calculated from each RGB image, and NDVI histogram where the X-axis represents the NDVI values and the Y-axis represents the frequency of the values. It was hard to find significant differences over the years by observing these images. Additionally, in the NDVI value histogram, the distributions and means of NDVI values were similar for five years. However, the ratio of color pixels of the evergreen and deciduous areas of the region shows some difference. We counted these pixels based on the NDVI value threshold, as mentioned in the previous section. Table 1 indicates that the evergreen area slightly decreased from 61.54% to 59.85%, and the deciduous area increased from 38.46% to 40.15%. We did not include a map for 2022 because when we downloaded images from Sentinel hub, we found a mismatch between a downloaded image and a map displayed in Sentinel hub EO browser. In Table S1, each row corresponds to a date with the left column for an NDVI histogram calculated from the downloaded image and the right column for a screenshot of an NDVI histogram displayed in a web browser. As can be seen, the two NDVI histograms in the left and right columns are almost the same for the first and second row (23 December 2021 and 7 January 2022). However, from the third row (11 February 2022), we can observe mismatches between the two histograms. We are unable to ensure the correctness of the data for 2022. Due this issue, it is not meaningful to apply the proposed method to 2022 data.
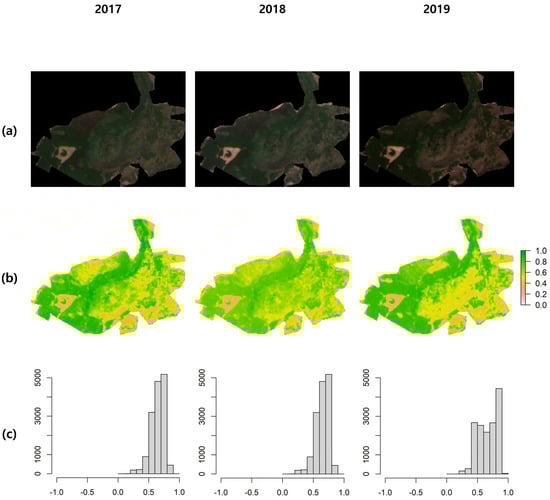
Figure 3.
RGB and NDVI image of Geomunoreum forest from 2017 to 2019. (a) RGB image; (b) NDVI image; (c) histogram of NDVI frequency distribution.
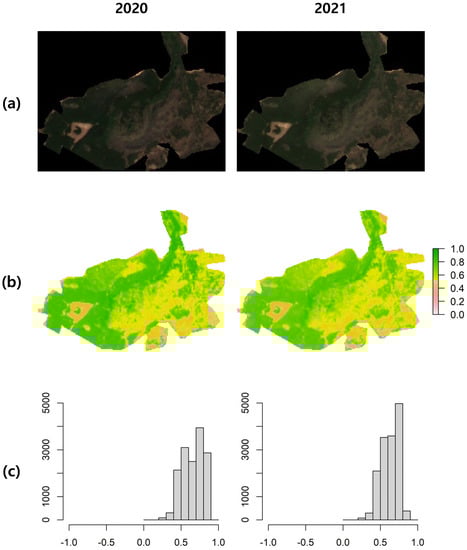
Figure 4.
RGB and NDVI image of Geomunoreum forest from 2020 to 2021. (a) RGB image; (b) NDVI image; (c) histogram of NDVI frequency distribution.
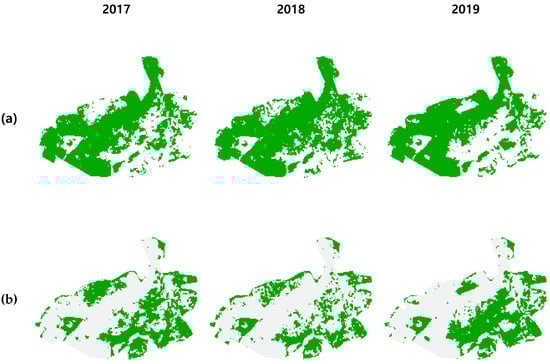
Figure 5.
Vegetation classification image on Geomunoreum forest from 2017 to 2019. (a) Evergreen (NDVI values > 0.6); (b) deciduous (0.6 ≥ NDVI values).
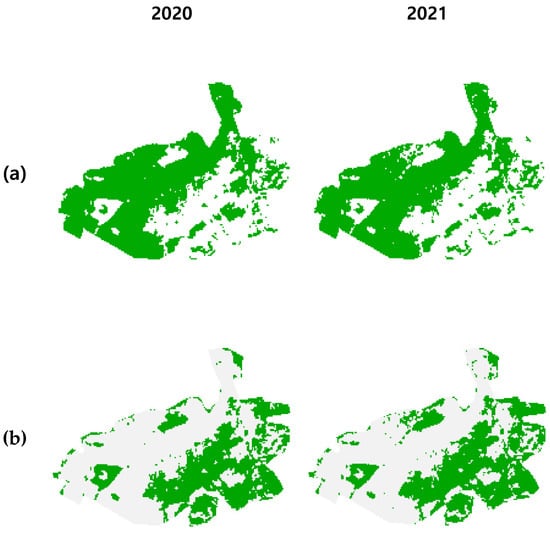
Figure 6.
Vegetation classification image on Geomunoreum forest from 2020 to 2021. (a) Evergreen (NDVI values > 0.6); (b) deciduous (0.6 ≥ NDVI values).

Table 1.
The number of pixels and ratio of the evergreen and deciduous area on Geomunoreum for 2017 to 2021.
Some internal problems might exist in Sentinel hub for recent data. We tried to examine the reason from another perspective, assuming that there was no problem in Sentinel hub. The reason can be understood by the fact that the temperature affects the NDVI value [26]. Figure 7 shows the average temperature of the study area. The temperate data were collected from Seonheul Automatic Weather Station (AWS) which is 3 km away from the study area (Figure 8). As shown in the highlighted months (January and February), 2022 was different from the other years in terms of temperature changes. From 2017 to 2021, February was warmer than January. On the other hand, in 2022, February was colder than January, which affected the NDVI values. The temperature was highly correlated with the NDVI value; therefore, the criteria should have reflected the temperature. Thus, the vegetation composition can be classified based not only on the NDVI value, but also on the lagged response of the temperature change. At this moment, no further investigation is possible since not enough data are available. This could be accomplished in future work when more data are accumulated for these exceptional cases.
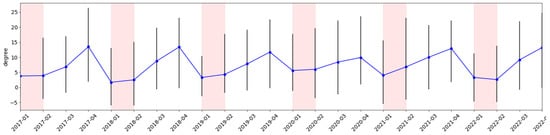
Figure 7.
The temperature in Celsius in the study area from 2017 to 2022. The vertical line in black represents the maximum and minimum temperature. We highlight the case of January and February, because the vegetation needs time to change.
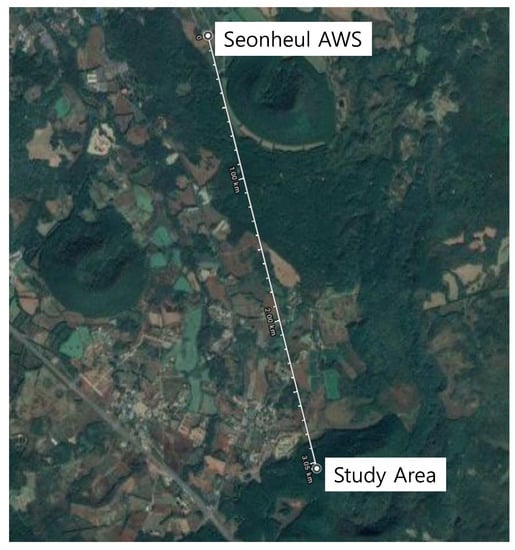
Figure 8.
The temperature data of the study area were obtained from Seonheul Automatic Weather Station (AWS), which is 3 km away from the study area.
Finding these differences from 2017 to 2021, the thing to importantly consider is the image acquisition date. If the image acquisition date is the summer, the evergreen and deciduous trees cannot be differentiated by the NDVI value. It is the same in winter. Additionally, the leaf color change by deciduous trees in fall could impact the goal of this study which differentiated evergreen and deciduous trees in the forest. Therefore, early spring, before a deciduous tree forms a bud or new leaf, is the appropriate date for image acquisition. Figure 3, Figure 4, Figure 5 and Figure 6 shows NDVI images representing the Geomunoreum’s evergreen and deciduous area. The evergreen tree occupied the north and west side of the oreum, in comparative highland, and the deciduous tree occupied the south and east side, the comparative lowland. Except for some mixed forests in the east region, the mixed forest had barely been found in the study area. Ko et al. (2011) [20] reported that the region comprises deciduous forest, evergreen broad-leaved forest, shrubbery, grassland, and artificial afforested regions through an actual vegetation survey. Especially in the artificial afforested region, the major tree species were Cryptomeria japonica, Pinus thunbergii, and Chamaecyparis obtusa. Additionally, the north and west sides of the oreum showed monocultural species by C. japonica. Compared with the current study, the region division by actual vegetation survey was very similar to the results of this study. In addition, comparing the results with the large-scale vegetation map by the Korea Forest Service [27], the compartment of each tree region is very similar to Figure 3, Figure 4, Figure 5 and Figure 6.
Assessing a region’s vegetation is essential to constructing an efficiently mixed forest. It helps to determine the composition of a mixed forest. For example, in this Geomunoreum forest, the vast northern region was occupied by evergreen trees, and the deciduous tree cover was minor (Figure 3, Figure 4, Figure 5 and Figure 6).
Therefore, deciduous trees might be needed in this region; some evergreen trees might be eliminated, and some tall deciduous trees would be implanted in the mixed forest. The southern region of the forest had the opposite situation (Figure 3, Figure 4, Figure 5 and Figure 6). Deciduous trees occupy this region; therefore, this region needs some evergreen trees. This region’s vegetation is complex. Styrax japonica, Cornus kousa, Carpinus laxiflora, Mallotus japonicus, Meliosma oldhamii, and Acer palmatum compose the deciduous forest [20]. Additionally, the grassland region, which was included in the deciduous area, needs direct investigation to confirm why this region has no tree vegetation. The reason the region remains grassland could come from the soil construction, environment, or other things.
Most traditional approaches for classifying types of vegetation regions are performed by manual human efforts, such as direct vegetation surveys; human experts visit a study area and then explore the area on foot with equipment such as a camera. It would not be easy to explore an area that cannot be reached by car or walking. Flying a drone could help monitor the forest that cannot be reached by human experts. However, it also requires human efforts to operate drones. There may be some areas that human experts miss if they explore by walking. Moreover, it would not be easy for them to visit the study area frequently to monitor environmental changes over time. The data-driven approach proposed in this paper can be a more efficient method than the traditional direct vegetation surveys. The novelty of the proposed method comes from the simplicity to see the trends without screening the given area every time, which can be time- consuming, labor-intensive, and expensive. Classifying types of forest by considering NDVI values may not be more accurate than the direct vegetation survey. Moreover, the criteria depend on the temperature changes. Accuracy can be increased by using more satellite image datasets for different areas. We do not insist to replace the direct vegetation survey with the proposed approach. Rather, the automatic method identifies dangerous regions that are further needed for in-depth investigations such as traditional direct vegetation surveys. The proposed method enables the monitoring of a large area; therefore, it also helps construct a plan for mixed forests to prepare for the threat of global warming by reducing the labor needed to perform direct vegetation surveys. Additionally, considering these data with geological information would support the successful afforestation and management of forests.
Supplementary Materials
The following supporting information can be downloaded at: https://www.mdpi.com/article/10.3390/app13010303/s1.
Author Contributions
Conceptualization, J.A. and G.D.H.; methodology, Y.S.C.; software, S.U.Y.; validation, S.H., Y.S.K. and J.A.; formal analysis, Y.-H.K.; investigation, Y.S.C.; resources, J.A.; data curation, S.U.Y.; writing—original draft preparation, S.U.Y. and Y.S.C.; writing—review and editing, G.D.H.; visualization, G.D.H.; supervision, J.A.; project administration, J.A.; funding acquisition, J.A. All authors have read and agreed to the published version of the manuscript.
Funding
This study was funded by the Agency for Defense Development of Korea (Project No. 915026201), and Basic Science Research Program supported this research through the National Research Foundation of Korea (NRF), funded by the Ministry of Education (2019R1A6A1A11052070).
Data Availability Statement
Not applicable.
Acknowledgments
This study was conducted with support from Agency for Defense Development of Korea (Project No. 915026201), and Basic Science Research Program supported this research through the National Research Foundation of Korea (NRF), funded by the Ministry of Education (2019R1A6A1A11052070).
Conflicts of Interest
The authors declare no conflict of interest.
References
- Dai, A. Increasing drought under global warming in observations and models. Nat. Clim. Change 2013, 3, 52–58. [Google Scholar] [CrossRef]
- Bintanja, R. The impact of Arctic warming on increased rainfall. Sci. Rep. 2018, 8, 16001. [Google Scholar] [CrossRef] [PubMed]
- González-Alemán, J.J.; Pascale, S.; Gutierrez-Fernandez, J.; Murakami, H.; Gaertner, M.A.; Vecchi, G.A. Potential increase in hazard from Mediterranean hurricane activity with global warming. Geophys. Res. Lett. 2019, 46, 1754–1764. [Google Scholar] [CrossRef]
- Malmsheimer, R.W.; Heffernan, P.; Brink, S.; Crandall, D.; Deneke, F.; Galik, C.; Gee, E.; Helms, J.A.; McClure, N.; Mortimer, M. Forest management solutions for mitigating climate change in the United States. J. For. 2008, 106, 115–173. [Google Scholar]
- Panja, P. Is the forest biomass a key regulator of global warming?: A mathematical modelling study. Geol. Ecol. Landsc. 2020, 6, 66–74. [Google Scholar] [CrossRef]
- Al-Ghussain, L. Global warming: Review on driving forces and mitigation. Environ. Prog. Sustain. Energy 2019, 38, 13–21. [Google Scholar] [CrossRef]
- Fawzy, S.; Osman, A.I.; Doran, J.; Rooney, D.W. Strategies for mitigation of climate change: A review. Environ. Chem. Lett. 2020, 18, 2069–2094. [Google Scholar] [CrossRef]
- Griscom, B.W.; Adams, J.; Ellis, P.W.; Houghton, R.A.; Lomax, G.; Miteva, D.A.; Schlesinger, W.H.; Shoch, D.; Siikamäki, J.V.; Smith, P. Natural climate solutions. Proc. Natl. Acad. Sci. USA 2017, 114, 11645–11650. [Google Scholar] [CrossRef]
- Bütler, R.; Lachat, T.; Larrieu, L.; Paillet, Y. Habitat trees: Key elements for forest biodiversity. Integr. Approaches Oppor. Conserv. For. Biodivers. 2013, 84, 84–91. [Google Scholar]
- Liu, X.; Trogisch, S.; He, J.-S.; Niklaus, P.A.; Bruelheide, H.; Tang, Z.; Erfmeier, A.; Scherer-Lorenzen, M.; Pietsch, K.A.; Yang, B. Tree species richness increases ecosystem carbon storage in subtropical forests. Proc. R. Soc. B 2018, 285, 20181240. [Google Scholar] [CrossRef]
- Felton, A.; Lindbladh, M.; Brunet, J.; Fritz, Ö. Replacing coniferous monocultures with mixed-species production stands: An assessment of the potential benefits for forest biodiversity in northern Europe. For. Ecol. Manag. 2010, 260, 939–947. [Google Scholar] [CrossRef]
- Zhang, Y.; Shen, C.; Zhou, S.; Luo, X. Analysis of the Influence of Forests on Landslides in the Bijie Area of Guizhou. Forests 2022, 13, 1136. [Google Scholar] [CrossRef]
- Hayward, M.W.; Ward-Fear, G.; L’Hotellier, F.; Herman, K.; Kabat, A.P.; Gibbons, J.P. Could biodiversity loss have increased Australia’s bushfire threat? Anim. Conserv. 2016, 19, 490–497. [Google Scholar] [CrossRef]
- Jactel, H.; Bauhus, J.; Boberg, J.; Bonal, D.; Castagneyrol, B.; Gardiner, B.; Gonzalez-Olabarria, J.R.; Koricheva, J.; Meurisse, N.; Brockerhoff, E.G. Tree diversity drives forest stand resistance to natural disturbances. Curr. For. Rep. 2017, 3, 223–243. [Google Scholar] [CrossRef]
- Horn, H.S. Forest succession. Sci. Am. 1975, 232, 90–101. [Google Scholar] [CrossRef]
- Martin, J.; Gower, T. Forest succession. For. Facts 1996, 78. [Google Scholar]
- Brnkalakova, S.; Světlík, J.; Brynleifsdóttir, S.J.; Snorrason, A.; Baštáková, V.; Kluvankova, T. Afforesting Icelandic land: A promising approach for climate-smart forestry? Can. J. For. Res. 2021, 51, 1781–1790. [Google Scholar] [CrossRef]
- Kim, S.-Y.; Cho, S.-H.; An, S.-L. Flora characteristics of vascular plants in the Geomun Oreum, UNESCO World Natural Heritage Site in Jeju Island, Korea. J. Asia-Pac. Biodivers. 2020, 13, 652–657. [Google Scholar] [CrossRef]
- Ki, J.S.; Jeon, Y.M.; Ryu, C.G.; Kim, S.S. A significantion and meaning of Geomunoreum as a representative geosite of global Geoparks. J. Geol. Soc. Korea. 2016, 52, 763–774. [Google Scholar] [CrossRef]
- Ko, S.H.; Ko, J.G.; Oh, J.G.; Kim, H.C.; Kang, I.B.; Kim, C.S.; Ko, J.H.; Hyun, H.N. Distribution of Woody Plant and Soil Characteristics by Vegetation of the Geomunoreum in Jeju Island. Korean Soc. Environ. Ecol. 2011, 21, 38–43. [Google Scholar]
- Jiang, Z.; Huete, A.R.; Chen, J.; Chen, Y.; Li, J.; Yan, G.; Zhang, X. Analysis of NDVI and scaled difference vegetation index retrievals of vegetation fraction. Remote Sens. Environ. 2006, 101, 366–378. [Google Scholar] [CrossRef]
- Wang, J.; Rich, P.M.; Price, K.P. Temporal responses of NDVI to precipitation and temperature in the central Great Plains, USA. Int. J. Remote Sens. 2003, 24, 2345–2364. [Google Scholar] [CrossRef]
- Yang, Y.; Wu, T.; Zeng, Y.; Wang, S. An Adaptive-Parameter Pixel Unmixing Method for Mapping Evergreen Forest Fractions Based on Time-Series NDVI: A Case Study of Southern China. Remote Sens. 2021, 13, 4678. [Google Scholar] [CrossRef]
- Zhao, J.; Wang, L.; Yang, H.; Wu, P.; Wang, B.; Pan, C.; Wu, Y. A Land Cover Classification Method for High-Resolution Remote Sensing Images Based on NDVI Deep Learning Fusion Network. Remote Sens. 2022, 14, 5455. [Google Scholar] [CrossRef]
- Jing, W.; Zhu, S.; Kang, P.; Wang, J.; Cui, S.; Chen, G.; Song, H. Remote Sensing Change Detection Based on Unsupervised Multi-Attention Slow Feature Analysis. Remote Sens. 2022, 14, 2834. [Google Scholar] [CrossRef]
- Yoon, S.U.; Ahn, J.; Kim, Y.S.; Han, G.D.; Chung, Y.S.; Lee, S.-J. Monitoring Temperature Variation in Rising Small Defunct Volcano on Jeju Island, Republic of Korea, Using High-Resolution Sentinel-2 Images. Atmosphere 2022, 13, 576. [Google Scholar] [CrossRef]
- Large Scale Vegetation Map. Available online: https://map.forest.go.kr/forest/?systype=mapSearch&searchOption=stock (accessed on 13 November 2022).
Disclaimer/Publisher’s Note: The statements, opinions and data contained in all publications are solely those of the individual author(s) and contributor(s) and not of MDPI and/or the editor(s). MDPI and/or the editor(s) disclaim responsibility for any injury to people or property resulting from any ideas, methods, instructions or products referred to in the content. |
© 2022 by the authors. Licensee MDPI, Basel, Switzerland. This article is an open access article distributed under the terms and conditions of the Creative Commons Attribution (CC BY) license (https://creativecommons.org/licenses/by/4.0/).