Abstract
With the increase in environmental pressure and rapid development of renewable energy technologies, an integrated energy system has been recognized as an effective approach to accommodate large-scale renewables and achieve environmental sustainability. While an integrated energy system significantly improves energy efficiency, the interaction between different energy systems may also bring multiple operational risks to its reliability, which necessitates an effective reliability assessment technique. In this paper, we proposed a multi-level fuzzy evaluation model based on combined empowerment for the reliability evaluation of an integrated energy system. The analytic hierarchy process method and entropy weight method were used to calculate the weight of each index in the evaluation model. Fuzzy evaluation matrix was constructed by the membership degree of a single factor, which was defined by the fuzzy comprehensive evaluation method. The multi-level fuzzy evaluation results were obtained based on single-level evaluation results. Finally, case studies were carried out based on a practical integrated energy system; we proposed 5 first-level indicators such as reliability and economy and 12 second-level indicators such as mean time of incapacity. The simulation results (85.15) showed the effectiveness and advantages of the proposed model.
1. Introduction
Energy is the basis for human survival and development and is the lifeblood of the economy and society [1]. Since traditional fossil energy sources such as coal and oil are not renewable, improving energy utilization efficiency, developing new energy sources and strengthening the comprehensive utilization of renewable energy sources become the inevitable choice, to solve the contradiction between the growth of energy demand and energy shortage, energy utilization and environmental protection [2,3]. An integrated energy system (IES) provides an effective solution for optimizing energy supply and improving energy efficiency [4] and the ecological environment [5]. An IES can efficiently integrate and utilize various energy units such as renewable energy sources (RES) units, combined heat and power (CHP) units, energy storage (ES) units and several others [6].
However, safety, reliability and economy are the most basic requirements for an integrated energy system, which is similar to the existing power supply, gas supply and cooling/heat supply [7]. While an IES improves energy efficiency, the interaction between different energy systems creates multiple operational risks [8,9]. A reliability assessment can reflect the risk level of an energy supply interruption of the system with qualitative or quantitative indicators and, thus, guide the planning, operation and other production practice activities of integrated energy systems [10]. Due to economic and societal development, people have higher and higher requirements for the reliability of energy supply, and the integrated energy system is directly connected with various loads such as electricity, gas, cooling and heat physically. Thus, it is especially important to ensure the reliability of the integrated energy system, and it is very important to carry out its reliability assessment research [11].
Relevant studies on integrated energy systems have achieved preliminary results in the concept and framework of an IES, multi-energy flow analysis and calculation, modeling and simulation, planning and operation control and economic analysis and optimization. As shown in Table 1.

Table 1.
Relevant studies on integrated energy systems.
However, the uncertainties in the “source–grid–load–storage” links within IES seriously affect the coordinated operation of the system, and the relevant research for the reliability assessment of integrated energy systems is still in the initial stage [22]. Achieving an accurate quantitative assessment of an IES’s operational reliability helps to realize the collaborative planning and optimal regulation of smart energy. In recent years, with the introduction of a series of assessment methodologies, assessment methods have realized a transitional development process from single-indicator evaluation to multi-indicator evaluation. Zhao [23] proposed a reliability assessment method of an electricity–gas integrated system under attack. Chi [24] used a Monte Carlo simulation combined with order statistics to assess the reliability of supply. Zhu [25] proposed a reliability assessment method of an IES considering gas–thermal inertia. Zhao [26] proposed a reliability evaluation method for CIESs based on a fault incidence matrix (FIM). An energy supply reliability assessment method based on a sequential Monte Carlo simulation was proposed in Li’s work [27].
As IES systems generally suffer from a lack of energy data, low model accuracy and their own force majeure, the combined evaluation method tends to overcome the shortcomings of the single evaluation method and has a superior performance in terms of applicability conditions and scalability. Therefore, this paper proposed an advanced multi-level fuzzy evaluation model based on combined empowerment for the reliability evaluation of an IES. The contributions of this paper were three-fold.
- (1)
- A weight analysis method combining analytic hierarchy process and entropy weight method as proposed. It made up for the defects of subjective judgment with objective data in the case of complex and incomplete data and defined the influence degree of different types of indicators on the reliability evaluation results.
- (2)
- A multi-level fuzzy evaluation model based on combined empowerment was proposed. The multi-level fuzzy evaluation results were calculated step-by-step based on the single-level evaluation results.
- (3)
- By considering the uncertainties in the “source–grid–load–storage” links, several novel reliability indicators were proposed for a practical IES.
The remainder of the paper is organized as follows. Section 1 introduces the energy flow model of an IES. Section 2 develops a basic model for the IES components. Section 3 proposes a multi-level fuzzy evaluation model based on combined empowerment. Section 4 implements the simulations and discusses the numerical results. Finally, Section 5 concludes this paper.
2. Problem Formulation
2.1. Integrated Energy System
Due to a series of advantages such as improving comprehensive energy utilization [28] and promoting renewable energy development [29], the development of an integrated energy system has received wide attention and has become an important research direction in the international energy field.
This paper conducts research on a basic model of an IES with the coupling of electric, gas, heating and cooling energy; the structure is shown in Figure 1. In an IES, energy sectors and systems (mainly including energy supply systems, energy conversion equipment, an energy transmission network and an energy load terminal) are integrated through components of energy conversion and energy transmission. The energy supply system mainly consists of primary energy sources, such as solar, wind, hydropower, coal, geotherms and natural gas. The energy conversion equipment mainly includes energy production, exchange and storage devices. The energy production part includes the cogeneration of heat and power (CHP), the energy conversion part comprises electricity to gas (EG) and a heat exchanger (HE) and the energy storage part consists of electricity storage (ES), gas storage (GS) and heat storage (HS). The energy transmission network is mainly composed of an electric network (EN), heating network (HN) and gas network (GN). The energy load terminals include the electrical load (EL), heating load (HL) and gas load (GL).
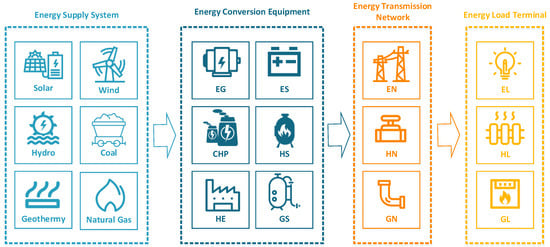
Figure 1.
Basic structure of IES.
2.2. Device Models and Constraints
- Photovoltaic (PV) model
The output power Ppv of PV array is strongly linear [30], and its mathematical model is as follows:
where PSTC is the maximum power under standard conditions (sunlight incident intensity GSTC is 1000 W/m2 and ambient temperature TSTC is 25 °C). GT is the amount of radiation the panel is exposed to; KC is the work coefficient; and KC is the operating temperature of the panel.
- 2.
- Wind Turbine (WT) Model
The output power of a WT Pwt is closely related to the wind speed v [31], and the following expression is given to describe the relationship between them.
- 3.
- Electricity to Gas (EG) Model
Electricity to gas mainly refers to the use of electricity to react water and carbon dioxide within natural gas equipment. The specific chemical reactions are as follows:
Step 1: Water splits into oxygen and hydrogen;
Step 2: Hydrogen reacts further with carbon dioxide to form methane (CH4, the main component of natural gas).
The relational expression is shown in Equation (3).
where GEG,t is the gas production, ηEG is the efficiency of transformation, PEG is the EG power consumption, and qhg is the high calorific value of natural gas.
- 4.
- Energy Storage (ES) Model
An integrated energy system usually contains a variety of energy storage technologies, as an energy storage system has the advantages of a fast response and high conversion efficiency. State of charge (SOC) is usually used to describe the state of the energy storage equipment.
SOC = ESB/ESB_r
When the device is charged, its state changes meet the following requirements:
When the device discharges, its status changes as follows:
where ESB is the amount of energy stored by the current energy storage device, ESB_r is the maximum amount of energy stored by the energy storage device, PSB_in,t is the amount of energy absorbed by the energy storage device, PSB_out,t is the amount of electricity provided by the energy storage device, and ηSB_ in is the conversion efficiency of the amount of energy absorbed by the energy storage device. ηSB_ out is the conversion efficiency of the power supplied by the energy storage device, and σSB is the power consumption rate of the energy storage device.
2.3. Factors of IES Reliability
- 1.
- Technical Factors
An IES can realize coordinated control of electricity, heat and cold and comprehensive energy efficiency management, apply clean energy on a large scale and integrate heat pump, heat storage and cold storage technologies [32]. Therefore, we need to evaluate its energy efficiency level, utilization degree of clean energy and contribution of peak cutting and valley filling. The technical factors include reliability, network loss, integrated energy efficiency, demand-side response and clean energy ratio. Reliability is used to evaluate the normal operating conditions of an integrated energy system and its emergency treatment ability after failure. The network loss index is used to evaluate the energy loss degree of each energy network in the process of energy transmission in an integrated energy system. Energy efficiency reflects the discretion of the energy utilization efficiency in an integrated energy system. Demand-side response is used to evaluate the construction of the demand side of an integrated energy system and its contribution to peak cutting and valley filling.
- 2.
- Economic Factors
In an actual project evaluation, economic factors are also indispensable [33]. In the process of an IES’s system evaluation, not only the overall economic benefit of the target system but also the economic benefit of the equipment should be considered. Therefore, the economic factors include the payback period of the system investment and the economy of the equipment. The system investment payback period is used to evaluate the overall investment recovery of an integrated energy system. The equipment economy is used to evaluate the economic benefits of the equipment in the target system, including equipment utilization and equipment operation cost savings.
- 3.
- Environmental Factors
The environmental factors mainly include gas pollutant emission reduction and carbon dioxide emission reduction [34], which are used to evaluate the contribution of a comprehensive energy system to pollutant emission reduction and carbon emission reduction. The evaluation results are closely related to our lives.
3. Methods
3.1. Combined Empowerment Based on AHP–EWM
A correct evaluation system is needed to determine a reasonable weight, including the subjective weight and objective weight. Subjective weight factors can reflect intentions of decision makers, but they are susceptible to subjective arbitrariness. Objective weight methods can reflect the characteristics of data without considering subjective opinions, though the calculated weights may become divorced from reality. Therefore, hybrid indicators should be used to obtain the advantages of the two methods, which can not only reflect the preference of decision makers but also reflect the influence of objective factors.
Several indicators such as network loss and response efficiency need to be considered when we evaluate the reliability of IES [35]. Firstly, the weight coefficient needs to be determined, since the importance of each indicator should be considered in the comprehensive evaluation. To make the weight coefficient more accurate, the analytic hierarchy process (AHP) proposed by Saaty is adopted to determine the weight [36,37]. AHP is a multi-criteria decision-making method, and its execution process is shown in Figure 2.
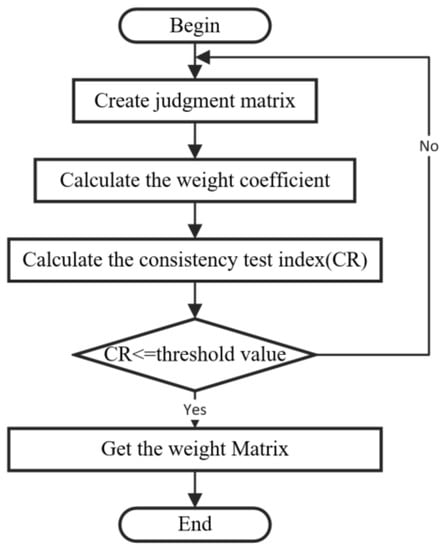
Figure 2.
Execution process of AHP.
For the judgment process, the priorities of the two indicators are shown in Table 2. Bi and Bj represent the impact of the ith and jth indexes, respectively. The Bi/Bj becomes larger with the importance of the ith index increasing relative to the jth index [38].

Table 2.
Priorities of the two indicators.
With the help of a two-by-two comparison between factors, it is transformed into mathematical information that can be processed by a computer. Hierarchical analysis requires experts to understand the nature of the development of things, but when the problem reaches a certain level of complexity, it is easy for error to occur [39].
In information theory, entropy is a measure of the uncertainty of a system. In general, the higher the value of entropy is, the greater the dispersion degree of the indicators [40]. If a random variable X may take the value of {x1, x2, … xm}, its probability distribution is , and the entropy value of random variable X is defined as shown in Equation (7). Entropy weight method (EWM) relies mainly on the calculation of indicator data, which sometimes results in missing errors and makes it difficult to obtain an idealized indicator ranking [41].
In view of the fact that the relevant basic data of IES are unsatisfactory and incomplete, based on the above theory, this paper choose the combination of subjective and objective “AHP–EWM” method [42] to determine the indicator weights, in order to clarify the influence of different types of indicators on the assessment results. The following weighting algorithm is proposed.
Step 1: Construct a judgment matrix Mi,j for the number of states (i) and the number of indicators (j) of the system;
where Mij donates the matrix line product, and the value of is shown in Table 2.
Step 2: The consistency ratio index (CR) was calculated to ensure the reliability of the AHP weights:
RI donates the average value of the result consistency index according to the order of the matrix. CI is the consistency index and can be expressed as follows:
where λmax donates the maximum or principal eigenvalue of the matrix. When CR was less than 0.10, the matrix had good consistency, otherwise it should be changed.
Step 3: To avoid the influence of units of measure, the data were standardized as follows:
Step 4: The information entropy was then calculated. Particularly, the j-th index’s information entropy (Ej) was defined as follows:
is the probability of each of these indices, which can be calculated as follows:
Step 5: Calculate the objective weight Wj of each indicator, which is calculated as shown in Equation (3).
Step 6: The subjective weights Wm and objective weights Wj are combined to obtain the comprehensive weight W of the indicator, which is calculated as shown in Equation (4).
The λ is adjusted according to the actual situation. If the data is sufficient and accurate, the value of a should be correspondingly larger; otherwise, it should be smaller.
3.2. Multi-Level Fuzzy Evaluation
The basic idea of fuzzy evaluation is to use the principle of fuzzy linear transformation and the principle of maximum subordination to consider all evaluation factors and quantify them uniformly, assign weights according to the degree of influence of different factors on the judged object and then make a reasonable evaluation [43,44]. The evaluation process is shown in Figure 3.
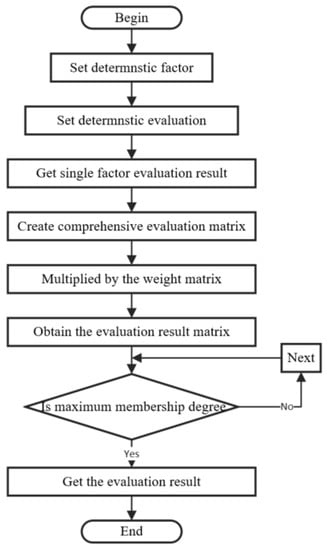
Figure 3.
Process of AHP multi-level fuzzy evaluation.
For the IES discussed in this paper, all possible rubrics used to represent the outcome are assumed to be m, denoted V = (v1, v2, … vm) and called the set of rubrics. Through analysis and experimentation, the affiliation of each first-level rubric to each rubric vi (I = 1, 2, …, m) is determined, and the single-factor rubric results are obtained as follows.
The single-factor evaluation is actually a fuzzy mapping of the set of factors to the set of rubrics, and the fuzzy evaluation matrix Ri for Ui is
Among them, the affiliation ∈[0,1].
For multi-level fuzzy synthesis evaluation (taking level 2 as an example), it is necessary to perform level 1 fuzzy evaluation first and then use the result value as the factor value for level 2 synthesis evaluation [45,46]. The result of the first-level fuzzy evaluation is the synthesis result of the fuzzy evaluation matrix and the weight vector, as shown in Equation (17).
Using the above results as the factor values for the second-level fuzzy comprehensive evaluation, the second-level fuzzy relationship matrix RT is
Normalize the fuzzy composite judging results.
Taking B′ as the final judgment result, is the probability that the evaluation object belongs to rubric i. According to the principle of maximum affiliation, max() is the final judgment result of the evaluation object.
3.3. Framework for Reliability Assessment of IES
Compared with the single evaluation method, The combined evaluation method combines quantitative and qualitative analysis with feasibility and operability, thus enabling IES to reduce unnecessary overhead and improve the accuracy of assessment work in condition assessment, fault prediction, overhaul and maintenance.
Based on the combined method, the hierarchical analysis, entropy weighting and multi-level fuzzy comprehensive evaluation are integrated to assess the reliability of IES, as shown in Figure 4. Firstly, the IES system model is constructed based on the historical data and real-time state, and then the multi-granularity indicator system is constructed. Next, the combination of AHP and EWM is used to determine the weight of each indicator, and then the fuzzy evaluation method is used to define the affiliation degree of single factor to each indicator, to calculate the fuzzy evaluation matrix and obtain the single-level evaluation results, and finally the multi-level fuzzy comprehensive evaluation of IES is carried out to obtain the final evaluation results.
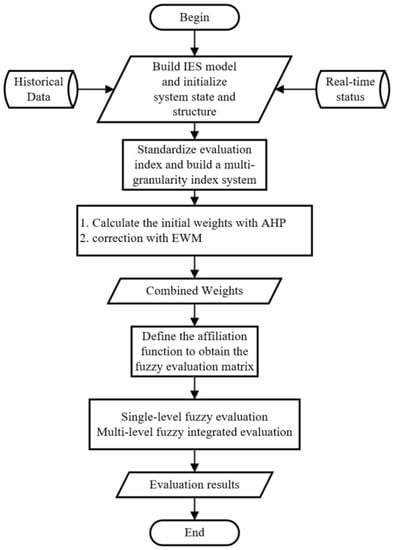
Figure 4.
IES evaluation process based on combined methods.
AHP is a systematic hierarchical method combining qualitative and quantitative, which is applicable in the case of complex structure and lack of data, but it is subject to too strong human subjective factors and requires several experts to make judgments. EWM [47,48] applies the idea of information entropy to the process of determining weights to make up for the defects of too strong subjectivity of determining weights in the hierarchical analysis method, i.e., the objectivity of the data makes up for the subjectivity of the evaluator [49].
4. Results and Discussion
4.1. Case Studies
We selected an industrial park in Xi’an as a typical IES for analysis, collected the relevant data of the park from January to July 2020, processed the original data and combined the processed data with the graph drawn. The overall energy supply and use characteristics of the park from January to July were analyzed from five aspects: power supply, power consumption, heating, energy consumption of heating water and cooling. as shown in Figure 5.

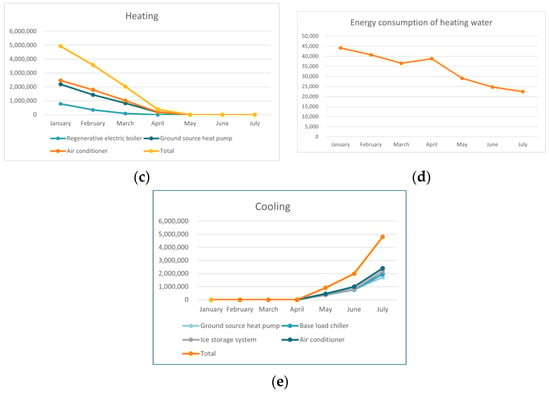
Figure 5.
Energy supply and use characteristics of IES. (a) Power supply. (b) Power consumption. (c) Heating. (d) Energy consumption of heating water. (e) Cooling.
The operation characteristics of the system can be summarized as follows.
- (1)
- The power supply of the park mainly depends on the municipal power supply, the external power supply of the park accounts for 96.21% of the total power supply of the park, the total power supply of the photovoltaic system and the energy storage micro-grid system accounts for 3.79%, and the energy storage micro-grid power generation base is small and can be ignored.
- (2)
- In the subsystem, the regenerative electric boiler and ground-source heat pump system occupy the first and second places in the power consumption, respectively, accounting for 16.02% and 12.19% of the total power consumption of the park, respectively. The power consumption of ground-source heat pump system decreases from January to April and increases from May to July.
- (3)
- The heating in the park is mainly supplied by the ground-source heat pump system, supplemented by the regenerative electric boiler. The heat supply of the ground-source heat pump accounts for 62.24% of the total heat supply in the park.
- (4)
- The park is mainly cooled by the ground-source heat pump, supplemented by a base load chiller, ice storage system and air conditioning. The cooling supply of ground-source heat pump system accounts for 73.36% of the total cooling supply in the park, and the cooling supply increases from May to July.
For the relevant evaluation indicators proposed in the literature, combined with the indicator classification method proposed in [50], the system evaluation indicators are divided into two levels. There are five first level indicators, which include reliability, network loss, response efficiency, equipment economy and environmental friendliness. There are 12 secondary indicators, which include average time of disability, electricity network loss rate and so on, as shown in Figure 6.
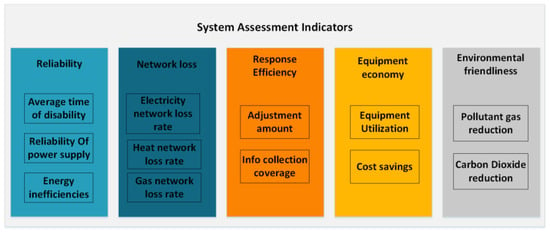
Figure 6.
Classification of system evaluation indicators.
4.2. Results
During the analysis of the weighting of the first-level indicators, the 1–9 scale method was used to quantify the indicators based on expert experience and an analysis of the cumulative industry data. The system can work stably for a long time and has an emergency and self-healing ability in case of failure, which is most important for an integrated energy system, as reliability is the first priority; a high proportion of clean energy is also one of the goals of an integrated energy system, which can represent environmental protection to a certain extent. Considering that environmental protection indicators can evaluate the discharge of pollutants, environmental friendliness is the second priority. Network loss will not only affect the economy of the system to some extent but also reflect the advanced technology of the energy network; if the network loss is too large, it will reflect the fault of some parts of the system, so we think it is more important than the demand-side response. Equipment economy is the last consideration.
After analysis, we construct the judgment matrix as shown in Equation (20):
Analytic hierarchy process is used to calculate the initial index weight of the judgment matrix C1, and the maximum eigenvalue λmax, consistency index CI and CR are, respectively,
where CR is less than 0.1, which meets the consistency requirement. Then, the combined weight w1 is calculated by the entropy formula according to the standardized judgment matrix R1.
w1 = [0.5323 0.1273 0.0681 0.0401 0.2319]
Taking the secondary indicator of reliability as an example to illustrate the weight calculation method, as shown above, the reliability contains three secondary indicators: average time of disability, reliability of the power supply and energy inefficiencies. Based on the accumulated experience of loss and data analysis, the judgment matrix and standardized judgment matrix of the secondary indicator of reliability are given as follows:
The judgment matrix C21 and initial indicator weights W21, with large eigenvalues λ max and consistency indicators CI and CR, were calculated using hierarchical analysis as
W21 = [0.6267 0.0936 0.2797]T
The consistency requirement is satisfied. The entropy formula is used to calculate the drops E21, deviation degree d21, correction coefficient u21, weight coefficient θ22 after correction of the weight method and combination weight w21 for each level of the indicators based on the standardized judgment matrix R21, respectively.
Other secondary indicators are calculated in the same way as reliability, as shown in Figure 7.
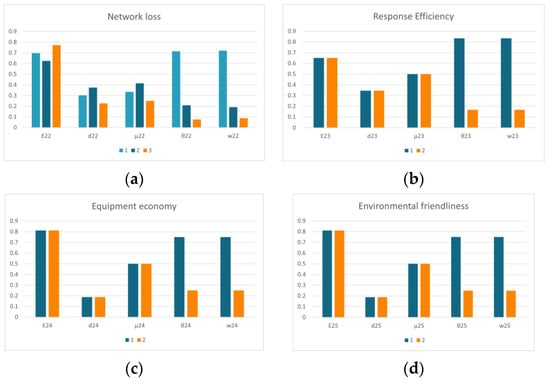
Figure 7.
Calculation results of secondary indicators. (a) Network loss. (b) Response efficiency. (c) Equipment economy. (d) Environmental friendliness.
After the combination weights are calculated by the AHP–EWM method, the evaluation set is divided into five levels, as shown in Table 3.

Table 3.
Division of evaluation sets.
The higher the score is, the better the system status is. According to each indicator set and evaluation level’s scoring table, the industry experts’ experience is summarized to obtain the frequency of each indicator for different evaluation levels, which is normalized to obtain the affiliation degree of each indicator. We summarized 10 evaluation levels’ scoring tables and normalized the scoring results, as shown in Table 4.

Table 4.
Results of index membership.
We can calculate the fuzzy comprehensive evaluation matrix of the first-level indicators according to the statistical results. For example, the reliability fuzzy evaluation matrix is
The reliability fuzzy evaluation vector can be obtained from the combination weight w21 and fuzzy matrix F21:
Similarly, F12, F13, F14, and F15 can be obtained in the same way, by taking them as elements of the second-level fuzzy comprehensive evaluation matrix, as shown by Equation (30):
The fuzzy judgment vector was calculated from w1 and M1:
The final evaluation results were:
4.3. Discussion
The multi-level fuzzy evaluation model based on combined empowerment was used to evaluate the reliability of an IES in this paper, and the evaluation score was 85.15, which means the system was in good condition. According to the membership vector, combination weight and fuzzy evaluation matrix during the process of evaluation, the total scores, scores and scoring rates of all indicators can be calculated, as shown in Figure 8.
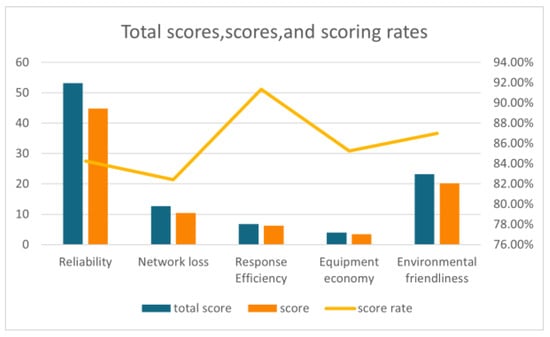
Figure 8.
Total scores, scores, and scoring rates.
The high score (91.34%) of the response efficiency is due to the complete hardware facilities of information collection in an integrated energy system, which enables the control platform to monitor the energy flow in real time and optimize the allocation of energy accordingly. Reliability has the greatest impact on the evaluation results, but its score is not satisfactory (84.25%). According to the analysis of the secondary indicator, reliability of the power supply is the biggest hidden danger, so we need to pay attention to it in our subsequent optimization work. The environmental friendliness score is excellent (87%) because the inclusion of renewable energy sources reduces the park’s electricity consumption, thereby reducing the amount of carbon dioxide and gas pollutants. Network loss has the lowest score rate (82.43%), maybe because the obsolescence of the power grid or heat network equipment leads to a low transmission completion rate.
5. Conclusions
In this paper, we designed a system reliability evaluation process, based on the research status of an IES’s reliability evaluation, and proposed a multi-level fuzzy comprehensive evaluation method for IES reliability, based on combined empowerment. From the perspective of multi-level indicators and fuzzy classification, an IES reliability evaluation model based on a multi-level fuzzy comprehensive evaluation was constructed. By calculating the initial weight of the evaluation indicators with AHP and correcting the weight with EWM, we calculated the fuzzy evaluation matrix and obtained the single-level evaluation results; finally, the multi-level fuzzy comprehensive evaluation of an IES was carried out to obtain the final evaluation results. Finally, case studies were carried out based on a practical integrated energy system; we proposed 5 first-level indicators such as reliability and economy and 12 second-level indicators such as mean time of incapacity. The simulation results (85.15) showed the effectiveness and advantages of the proposed model, so the work shown in this paper provides a new way of thinking regarding the evaluation of an IES.
Author Contributions
Conceptualization, P.H., X.W. and Y.G.; methodology, P.H.; validation, S.Z.; resources, Z.Z.; data curation, Z.Z.; writing—original draft preparation, P.H.; writing—review and editing, Y.G.; project administration, Y.G. All authors have read and agreed to the published version of the manuscript.
Funding
This research has been supported the Project of National Defense Basic Research Program, the National Defense Science and Technology Key Laboratory Fund Under Grant No. 6142219200205, the Open Fund of CETC Key Laboratory of Data Link Technology Under Grant No. CLDL-20202208_2, the Fundamental Research Funds for the Central Universities (G2022KY0603) and the National Natural Science Foundation of China under grant No. 62203361.
Institutional Review Board Statement
Not applicable.
Informed Consent Statement
Not applicable.
Data Availability Statement
The data presented in this study are available on request from the corresponding author. The data are not publicly available due to ownership of copyright.
Conflicts of Interest
The authors declare no conflict of interest.
References
- Stec, M.; Grzebyk, M. Statistical Analysis of the Level of Development of Renewable Energy Sources in the Countries of the European Union. Energies 2022, 15, 8278. [Google Scholar] [CrossRef]
- Patel, A.R.; Vyas, D.R.; Markana, A.; Jayaraman, R. A Conceptual Model for Integrating Sustainable Supply Chain, Electric Vehicles, and Renewable Energy Sources. Sustainability 2022, 14, 14484. [Google Scholar] [CrossRef]
- Energy—Renewable Energy; Investigators from Punjabi University Zero in on Renewable Energy (Grey Wolf Optimizer for Optimal Sizing of Hybrid Wind and Solar Renewable Energy System). Available online: https://onlinelibrary.wiley.com/doi/abs/10.1111/coin.12349 (accessed on 19 December 2022).
- Qin, C.; Yan, Q.; He, G. Integrated energy systems planning with electricity, heat and gas using particle swarm optimization. Energy 2019, 188, 116044. [Google Scholar] [CrossRef]
- Wang, Y.; Li, J.; Wang, S.; Yang, J.; Qi, C.; Guo, H.; Liu, X.; Zhang, H. Operational optimization of wastewater reuse integrated energy system. Energy 2020, 200, 117309. [Google Scholar] [CrossRef]
- Chen, Z.; Zhang, Y.; Tang, W.; Lin, X.; Li, Q. Generic modelling and optimal dayahead dispatch of micro-energy system considering the price-based integrated demand response. Energy 2019, 176, 171–183. [Google Scholar] [CrossRef]
- Wang, J.; Ghosh, S.; Olayinka, O.A.; Doğan, B.; Shah, M.I.; Zhong, K. Achieving energy security amidst the world uncertainty in newly industrialized economies: The role of technological advancement. Energy 2022, 261, 125265. [Google Scholar] [CrossRef]
- Li, G.; Huang, G.; Bie, Z.; Lin, Y.; Huang, Y. Component importance assessment of power systems for improving resilience underwind storms. J. Mod. Power Syst. Clean Energy 2019, 7, 676–687. [Google Scholar] [CrossRef]
- Bao, M.; Ding, Y.; Shao, C.; Yang, Y.; Wang, P. Nodal reliability evaluation of interdependent gas and power systems considering cascading effects. IEEE Trans. Smart Grid 2020, 11, 4090–4104. [Google Scholar] [CrossRef]
- Gao, X.; Liu, W. Optimal device capacity planning and strategy determination in an integrated energy system to promoting IES integration considering reliability value. IET Gener. Transm. Distrib. 2021, 15, 2356–2370. [Google Scholar] [CrossRef]
- Su, H.; Zio, E.; Zhang, J.; Li, Z.; Wang, H.; Zhang, F.; Chi, L.; Fan, L.; Wang, W. A systematic method for the analysis of energy supply reliability in complex Integrated Energy Systems considering uncertainties of renewable energies, demands and operations. J. Clean. Prod. 2020, 267, 122117. [Google Scholar] [CrossRef]
- Davis, M.; Ahiduzzaman, M.; Kumar, A. How to model a complex national energy system? Developing an integrated energy systems framework for long-term energy and emissions analysis. Int. J. Glob. Warm. 2019, 17, 23–58. [Google Scholar] [CrossRef]
- Haider, J.; Lee, B.; Choe, C.; Abdul Qyyum, M.; Shiung Lam, S.; Lim, H. SNG production with net zero outflow of CO2 in an integrated energy system: An energy and economic aspects. Energy Convers. Manag. 2022, 270, 116167. [Google Scholar] [CrossRef]
- Wu, X.; Liao, B.; Su, Y.; Li, S. Multi-objective and multi-algorithm operation optimization of integrated energy system considering ground source energy and solar energy. Int. J. Electr. Power Energy Syst. 2023, 144, 108529. [Google Scholar] [CrossRef]
- Li, Y.; Wang, X. Community Integrated Energy System Multi-Energy Transaction Decision Considering User Interaction. Processes 2022, 10, 1794. [Google Scholar] [CrossRef]
- Yang, Z.; Wang, X. Research on Low-Carbon Capability Evaluation Model of City Regional Integrated Energy System under Energy Market Environment. Processes 2022, 10, 1906. [Google Scholar] [CrossRef]
- Zhou, J.; Li, S.; Zhou, X.; Li, C.; Xiong, Z.; Zhao, Y.; Liang, G. Operation optimization for gas-electric integrated energy system with hydrogen storage module. Int. J. Hydrogen Energy 2022, 47, 36622–36639. [Google Scholar] [CrossRef]
- Xu, B.; Xiang, Y. Optimal operation of regional integrated energy system based on multi-agent deep deterministic policy gradient algorithm. Energy Rep. 2022, 8 (Suppl. 13), 932–939. [Google Scholar] [CrossRef]
- Wang, Y.; Zhang, Y.; Xue, L.; Liu, C.; Song, F.; Sun, Y.; Liu, Y.; Che, B. Research on planning optimization of integrated energy system based on the differential features of hybrid energy storage system. J. Energy Storage 2022, 55 Pt A, 105368. [Google Scholar] [CrossRef]
- Li, S.; Chen, K. Economic Operation of the Regional Integrated Energy System Based on Particle Swarm Optimization. Comput. Intell. Neurosci. 2022, 2022, 5055338. [Google Scholar] [CrossRef]
- Mo, L.; Liu, X.; Chen, H.; Zhao, Z.; Chen, J.; Deng, Z. Exergy-economic analysis and evaluation method of park-level integrated energy system. Front. Energy Res. 2022, 10, 968102. [Google Scholar] [CrossRef]
- Li, C.F.; Bie, Z.H.; Wang, R.H.; Jiang, J.F.; Kou, Y. Research status and outlook of integrated energy system reliability assessment. High Volt. Technol. 2017, 43, 114–121. [Google Scholar]
- Zhao, Z.; Wang, Y.; Jiang, M.; Liu, X. Research on reliability assessment and multi-time scale improvement strategy of electricity-gas integrated energy system under cyber attack. Front. Energy Res. 2022, 10, 1049920. [Google Scholar] [CrossRef]
- Chi, L.; Su, H.; Zio, E.; Qadrdan, M.; Zhou, J.; Zhang, L.; Fan, L.; Yang, Z.; Xie, F.; Zuo, L.; et al. A systematic framework for the assessment of the reliability of energy supply in Integrated Energy Systems based on a quasi-steady-state model. Energy 2023, 263 Pt B, 125740. [Google Scholar] [CrossRef]
- Zhu, Y.; Sun, W.; Miao, C.; Wang, Q.; Tang, Y.; Huang, Y. Reliability Assessment of the Integrated Energy System Considering Gas–Thermal Inertia. Front. Energy Res. 2022, 10, 948887. [Google Scholar] [CrossRef]
- Zhao, J.; Xiong, J.; Yu, H.; Bu, Y.; Zhao, K.; Yan, J.; Li, P.; Wang, C. Reliability Evaluation of Community Integrated Energy Systems Based on Fault Incidence Matrix. Sustain. Cities Soc. 2022, 80, 103769. [Google Scholar] [CrossRef]
- Li, Z.; Wang, Z.; Fu, Y.; Zhao, N. Energy supply reliability assessment of the integrated energy system considering complementary and optimal operation during failure. IET Gener. Transm. Distrib. 2021, 15, 1897–1907. [Google Scholar] [CrossRef]
- Li, Z.; Wang, C.; Li, B.; Wang, J.; Zhao, P.; Zhu, W.; Yang, M.; Ding, Y. Probability-Interval-Based Optimal Planning of Integrated Energy System with Uncertain Wind Power. IEEE Trans. Ind. Appl. 2020, 56, 4–13. [Google Scholar] [CrossRef]
- Jia, H.; Mu, Y.; Yu, X. Reflections on the development of integrated energy system in China. Power Constr. 2015, 36, 16–25. [Google Scholar]
- GE Renewable Energy Inaugurates 3D Printing Facility That Will Research More Efficient Ways to Produce Towers for Wind Turbines. M2 Presswire General Electric. 21 April 2022. Available online: https://www.ge.com/news/press-releases/ge-renewable-energy-inaugurates-3d-printing-facility-research-more-efficient-ways-produce-towers-for-wind-turbines (accessed on 19 December 2022).
- Shuo, Y.; Xing, C.; Shiqian, W.; Zhe, C.; Man, J.; Xingwu, G.; Yao, L. Research on Electricity Retail Market Design Considering Renewable Energy Storage Resources. In Proceedings of the 2nd International Symposium on Economics, Management, and Sustainable Development (EMSD 2021), Hangzhou, China, 27–28 November 2021; pp. 356–361. [Google Scholar] [CrossRef]
- Zhou, P.; Cheng, Y.; Zeng, M. Analysis of supply and demand characteristics and comprehensive benefit assessment of multi-energy systems for smart cities. Shandong Electr. Power Technol. 2019, 46, 1–7+35. [Google Scholar]
- Xu, M.M.; Cao, W.S.; Yao, S. Risk assessment of repetitive multiple outages in distribution networks based on fuzzy hierarchical analysis method. Power Autom. Equip. 2018, 38, 19–25, 31. [Google Scholar]
- Li, G.; Jiao, Y.; Liu, F. Comprehensive assessment of power big data quality by jointly adopting entropy power and gray system theory. Power Constr. 2016, 37, 24–31. [Google Scholar]
- Cui, Y.; Liu, W.; Su, J.; Yan, T.; Zhang, X.; Li, J.; Zhang, L. Integrated energy system reliability evaluation based on sequential Monte Carlo simulation and fault recovery optimization. IOP Conf. Ser. Earth Environ. Sci. 2021, 645, 012053. [Google Scholar] [CrossRef]
- Saaty, T.L. The modern science of multicriteria decision making and its practical applications: The AHP/ANP approach. Oper. Res. 2013, 61, 1101e18. [Google Scholar] [CrossRef]
- Iaria, J.; Susca, T. Analytic Hierarchy Processes (AHP) evaluation of green roof- and green wall- based UHI mitigation strategies via ENVI-met simulations. Urban Climate 2022, 46, 101293. [Google Scholar] [CrossRef]
- Dehraj, P.; Sharma, A. An empirical assessment of automaticity for autonomic query optimizers using fuzzy-AHP technique. Appl. Soft. Comput. J. 2020, 90, 106137. [Google Scholar] [CrossRef]
- Liu, H.; Li, J.; Zhang, J.; Pang, D. Decision Analysis of a Reinforcement Scheme for In-Service Prestressed Concrete Box Girder Bridges Based on AHP and Evaluation of the Reinforcement Effect. Buildings 2022, 12, 1771. [Google Scholar] [CrossRef]
- Yang, X.; Yang, J.; Lu, Y. Higher education evaluation system based on AHP & EWM. Adv. Educ. Technol. Psychol. 2022, 6, 75–93. [Google Scholar]
- Yang, J.; Dong, X.; Liu, S. Safety Risks of Primary and Secondary Schools in China: A Systematic Analysis Using AHP–EWM Method. Sustainability 2022, 14, 8214. [Google Scholar] [CrossRef]
- Liu, C.; Hou, Z. Study on environmental assessment of Saihanba based on AHP-EWM and linear clustering. In Proceedings of the 2022 International Conference on Applied Statistics, Computational Mathematics, and Software Engineering (ASCMSE 2022), Qingdao, China, 21–22 May 2022. [Google Scholar]
- Xue, Y.; Peng, D.; Wang, X.; Zhang, T.; Liu, H. Research on Improved Fuzzy Evaluation Model for Power System Development Diagnosis. J. Phys. Conf. Ser. 2021, 2095, 012024. [Google Scholar] [CrossRef]
- Li, J.; Zhang, H.; Wang, Z.; Feng, Z. A Fuzzy Evaluation Method of Power Transformer Insulation Health State Based on Multi-weight Fusion. J. Electr. Eng. Technol. 2022, 17, 2049–2060. [Google Scholar] [CrossRef]
- Luo, J.; Wang, D.; Gao, Y.; Zhang, D.; Mohammed, S.; Calvi, A. An improved AHP based fuzzy evaluation model for ship collision risk. J. Intell. Fuzzy Syst. 2021, 41, 4905–4913. [Google Scholar] [CrossRef]
- Ding, D.; Wu, J.; Zhu, S.; Mu, Y.; Li, Y. Research on AHP-based fuzzy evaluation of urban green building planning. Environ. Chall. 2021, 5, 100305. [Google Scholar] [CrossRef]
- Feng, J. Research on the Evaluation Model of the Health of the Higher Education System Based on EWM and FCE. Front. Educ. Res. 2022, 5, 050308. [Google Scholar]
- Xi, H.; Li, Z.; Han, J.; Shen, D.; Li, N.; Long, Y.; Chen, Z.; Xu, L.; Zhang, X.; Niu, D.; et al. Evaluating the capability of municipal solid waste separation in China based on AHP-EWM and BP neural network. Waste Manag. 2021, 139, 208–216. [Google Scholar] [CrossRef] [PubMed]
- Ling, S. Coal Mine Safety Evaluation Based on EWM. J. Phys. Conf. Ser. 2020, 1549, 042055. [Google Scholar]
- Chen, B.S.; Liao, Q.F.; Liu, D.C. Integrated assessment indicators and methods for regional integrated energy systems. Power Syst. Autom. 2018, 042, 174–182. [Google Scholar]
Disclaimer/Publisher’s Note: The statements, opinions and data contained in all publications are solely those of the individual author(s) and contributor(s) and not of MDPI and/or the editor(s). MDPI and/or the editor(s) disclaim responsibility for any injury to people or property resulting from any ideas, methods, instructions or products referred to in the content. |
© 2022 by the authors. Licensee MDPI, Basel, Switzerland. This article is an open access article distributed under the terms and conditions of the Creative Commons Attribution (CC BY) license (https://creativecommons.org/licenses/by/4.0/).