Abstract
Hyperbolic space has received extensive attention because it can accurately and concisely represent hierarchical data. Currently, for knowledge graph completion tasks, the introduction of exogenous information of entities can enrich the knowledge representation of entities, but there is a problem that entities have different levels under different relations, and the embeddings of different entities in Euclidean space often requires high dimensional space to distinguish. Therefore, in order to solve the above problem, we propose a method that use entity descriptions to complete the knowledge graph in the Poincaré ball model of hyperbolic space. In this method, the text representation of entity descriptions is in Euclidean space and mapped to hyperbolic space through exponential map. Next, the triple embeddings are initialized in hyperbolic space, and the structured representation of the triple is trained by the hyperbolic model. Finally, the text representation and the structured representation of the entity are cross-fused in hyperbolic space, and then the balance factors are used to adjust the unbalanced energy function. Experimental results show that, compared with baseline models, the proposed method can improve the performance of knowledge graphs completion.
1. Introduction
Knowledge graph has received extensive attention since it was proposed by Google. As an important resource for building information retrieval applications, knowledge graph has been applied to many related tasks. However, most knowledge graphs suffer from incompleteness, which leads to the task of predicting missing links, that is, knowledge graph completion. In a given knowledge graph , where E represents the set of all entities, R represents the set of all relations, and F is the set of all triples, the task of knowledge graph completion is to predict the missing triples [1], where h, r, and t are the head entity, relation, and tail entity, respectively, in the knowledge graph G. Specifically, knowledge graph completion is mainly abstracted into a link prediction problem, that is, to predict the missing parts of the triple, such as entity prediction (h, r, ?) and relation prediction (h, ?, t). The question mark represents the part to be predicted, while the other two parts are known [2,3].
Knowledge graph completion is an important task of knowledge base expansion. Its main purpose is to solve the problem of data sparsity, which is common in large-scale knowledge bases. Its mainstream method is knowledge representation learning. In euclidean space, there are mainly translation models [4,5] represented by TransE [4], bilinear models [6], neural network models [7,8,9], and rotation models [10,11]. For translation models and bilinear models, the models are relatively simple, and it is difficult to fully explore the relationship between triple entities. Neural network models and rotation models often need to spend more memory space to express the embeddings of entities to obtain more semantic information [12,13,14]. In order to reduce the demand for memory space, in recent years, hyperbolic models have gradually attracted attention in hyperbolic space [15,16]. Nickel et al. [17] have proved that Poincaré ball embeddings in hyperbolic geometry has great advantages in hierarchical data, and can accurately and concisely represent hierarchical data. Balaevic et al. [18] have proved that hyperbolic embeddings are better than Euclidean embeddings at lower dimensionality in hyperbolic Poincaré ball link prediction.
Compared with hyperbolic space, some research results show that models of Euclidean space can not well reflect complex data structures [19,20]. For a knowledge graph with a tree-like hierarchical structure, its volume (with a node as the center and the number of nodes within a certain radius) grows exponentially with the radius, while the volume of balls in Euclidean space grows polynomially with the radius, while the volume of balls in hyperbolic space grows exponentially with the radius [21]. It can be seen that embedding knowledge graph into Euclidean space will lead to high distortion embeddings, while embedding knowledge graph into hyperbolic space may show high fidelity performance.
In addition, in order to expand the knowledge graph better, the models of Euclidean space usually integrate the external descriptions of entities. Some models of Euclidean space integrate entity descriptions, and use rich external information and structured information of entities to train together to mine more entity semantic information [22,23,24,25]. For hyperbolic space, Balaevic et al. [18] and Chami et al. [26,27] find that using the natural properties of hyperbolic space, data hierarchy can be modeled, and semantic information of entities can be expressed in lower dimensions. Currently, according to previous research results, hyperbolic embeddings are better than Euclidean embeddings in learning space. In knowledge representation, fusing entity descriptions can improve the representation ability of entities.
Inspired by Balaevic et al. [18] and Xie et al. [22], this paper completes the knowledge graph in the Poincaré ball models of hyperbolic space by combining the structured information of triples and the text descriptions of entities. The text descriptions of entities can find the semantic correlation between entities and provide accurate semantic expression. The characteristics of hyperbolic space can not only try to express the embeddings of entities with low dimensions, but also model the hierarchical information of data. The combination of entity descriptions and hyperbolic space can save space and improve the results of link prediction.
As shown in Figure 1, an example of the description of the triple entity in Freebase is given. According to the triple structured information, it can be seen that Berkeley is located in Alameda, and according to the entity descriptions, it can be seen that Berkeley is one of the main cities in Alameda. alameda is located in California, United States. Berkeley is a city situated on the San Francisco Bay Area in northern California. This indicates that the description of entities can provide rich semantic information and be used as an important supplement in this paper.
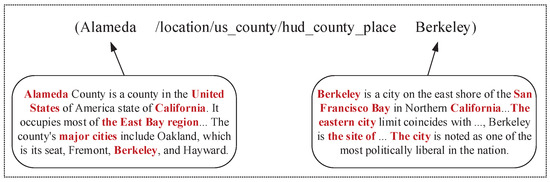
Figure 1.
An example of the description of triple entity in Freebase.
The main contributions are as follows: (1) a knowledge graph completion method is proposed, which takes advantage of both triple structured information and entity descriptions in hyperbolic space. We name it as DMuRP (Multi-Relational Poincaré graph embeddings with entity Descriptions). (2) In order to reduce the memory requirement, we try to explore in hyperbolic space. DMuRP is compared with other models in the same dimensions (100 dimensions). Moreover, under the same conditions, we give the results of this model in low dimensions (40 dimensions), and it can achieve more optimistic results. (3) Due to the differences between the knowledge representation of entities in triples and text representation of entity descriptions, we set the balance factors to solve it. Compared with the models of Euclidean space, DMuRP has effectively improved on MR and Hit@10, respectively.
2. Related Work
2.1. Knowledge Representation Learning
From the perspective of development, knowledge representation learning has mainly dealt with translation models and bilinear models that use the idea of vector translation, neural network models that mine deep information, rotation models that treat relations as rotations between head entities and tail entities, and hyperbolic models that use the isometric idea of hyperbolic space.
Euclidean embeddings. The translation models [4,5] and the bilinear models [6] are basic models of knowledge representation learning, using the idea of vector translation to infer the relationship between entities. Compared with neural network models [7,8,9] and rotation models [10,11], these methods are relatively simple, and have fewer parameters; however, they failed to encode logical properties such as symmetry, anti-symmetry, inversion, and combination at the same time [10]. For example, the translation model TransE [4] cannot encode symmetry, and the bilinear model DisMult [6] cannot encode anti-symmetry, inversion and combination, and the limitations of these models will affect the results of link prediction. Due to the prominent applications of neural network models in other aspects, they are now also applied to knowledge graph embeddings. However, using neural network models often requires pre-training knowledge base embeddings as input, resulting in excessive computation [28,29,30]. For rotation models RotatE [10], it theoretically proves to be able to solve symmetry, anti-symmetry, inversion, and combination problems, but these embeddings require high-dimensional space, which leads to high memory cost.
Hyperbolic embeddings. From the translation models to the graph neural network models to the hyperbolic models, the knowledge graph embedding models are from simple to complex, and the embedding effect is continuously improved. In hyperbolic space, Kolyvakis et al. [31] demonstrate that the hysteresis of translation models relative to bilinear models can be unconstrained in hyperbolic space. In addition, RotationH [26] provides a key concept of sufficiently rich representation for complex logical patterns, which can be used to model logical patterns in hyperbolic space. Based on RotationH [26], AttH [27] uses attention mechanism to capture hierarchical and logical information in knowledge graph. In order to have the advantages of different spaces, some models [32,33,34] apply hyperbolic space, Euclidean space, and spherical space to obtain knowledge representation with spatial advantages.
2.2. Representation Learning of Entity Descriptions
Most knowledge representation learning models only use triple structured information, and do not make effective use of other information of entities, such as entity descriptions, image descriptions. We treat the knowledge as auxiliary information for knowledge graph completion, which can effectively discover new triples in knowledge graph.
The knowledge representation ability of the entity is improved by combining with entity descriptions. The DKRL model [22] uses the description of entities and achieves better results than TransE [4] in link prediction. On its basis, Xu et al. [35] propose the Jointly model, which used NBOW, LSTM, and Att-LSTM three text encoding ways to encode entity descriptions, and LSTM encoding method achieves good results in link prediction. Moreover, Xiao et al. [36] propose the model SSP that a semantic space projection by jointly learning from triple structured information and entity descriptions. Analogous to the TransH, the eHP proposed by Qin et al. [24] projects the entity structured representation onto semantic hyperplane of the entity Descriptions.
Specifically, most models that encoding the description of entities choose the way of neural network. Recently, Zhao et al. [37] also propose three encoding methods, CNN, Bi-LSTM, and Transformer, for entity descriptions, which are combined with the TransE method to improve the experimental results. Zhou et al. [38] use Bi-LSTM to encode entity descriptions, and guide the representation of entity descriptions and entity structured representation interactively. Yu et al. [39] think that the latent semantic information of entity descriptions obtained by CNN and LSTM is limited and propose a new method that incorporates the entity description and network structure. Cheng et al. [23] encode entity descriptions through Transformer and attention, and utilize capsule network to capture global semantic features between entities and relations, and achieve good results in link prediction. Considering that previous models rarely pay attention to the global semantics of text information, Hu et al. [25] use text graph neural network to preserve it. However, these models are all performed in Euclidean space. Entity descriptions are rarely introduced into hyperbolic space.
To sum up, we improve the representation ability of the entity by integrating entity descriptions into the representation of knowledge graph, and represent the embeddings of the entity in hyperbolic space. Based on the research of Xie et al. [22] and Balaževic et al. [18], a new method of knowledge graph completion is proposed that combines the description of entities with the Poincaré ball model of hyperbolic space.
3. Knowledge Representation Learning Based on Hyperbolic Space
3.1. Hyperbolic Geometric Poincaré Ball
This paper represents the knowledge graph based on the Poincaré ball model of hyperbolic space, and uses this representation to complete the knowledge graph completion task. The Poincaré ball is a d-dimensional manifold, with as the curvature, as the radius [18,26,27]. For a two-dimensional hyperbolic Poincaré ball, it can be represented by a unit disk, and we call it as Poincaré disk [40].
We mainly use the definitions of Möbius addition (Equation (1)), Möbius multiplication (Equation (2)), logarithmic map (Equation (3)), exponential map (Equation (4)), and distance function (Equation (5)) between two points that defined in the Poincaré ball [18,27], the definitions are as follows:
where c, , and represent curvature, Euclidean inner product, Euclidean norm, and matrix, respectively.
3.2. DMuRP Frame
We define that, in euclidean space, the representation of the description of the head entity and the tail entity are denoted as , , respectively. In hyperbolic space, structured representation of the head entity and the tail entity are regarded as , , respectively, and the representation of the relation is shown as .
The combination of the description of the entity in hyperbolic space is mainly divided into three steps. As shown in Figure 2, first, we use SBERT [41] model to obtain the entity description-based Euclidean representations and , and then utilize exponential map to map them into hyperbolic space and obtain the entity description-based hyperbolic representations and . Second, we take advantage of the hyperbolic model MuRP [18] to obtain structured representation of triples (, , ), and the representation of the relation is shared. Finally, we learn the two entity representations simultaneously into the same continuous vector space, and introduce balance factors to the two entity representations for the consideration of better representing ability.
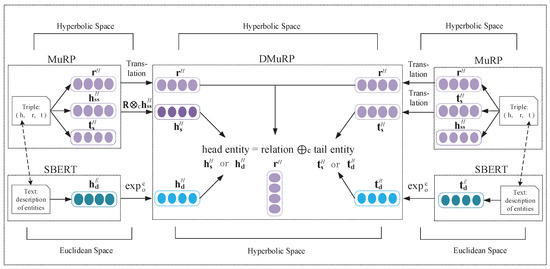
Figure 2.
DMuRP overall frame.
3.3. DMuRP Method
- Step one: Representation learning of entity descriptions (Text Representation).
In hyperbolic space, the work of Leimeister et al. [42] shows that the skip-gram algorithm for hyperbolic word embeddings has no obvious advantage compared with Euclidean counterpart. In addition, the research of Dhingra et al. [43] finds that the effectiveness of text embeddings method in hyperbolic space depends on the specific downstream tasks, and this method did not achieve ideal results yet in word embeddings and sentence embeddings.
Therefore, we choose to encode the description of entities in Euclidean space. For the text descriptions of entities, the description-based representations of entities is trained in Euclidean space through Siamese BERT networks. Different from others, we directly use sentence embedding models instead of word embedding models. For example, Xie et al. [22] extract keywords in entity descriptions and use convolutional neural networks to embed these keywords, which will lose the semantic information of entities to some extent. Finally, we map the description-based representations of entities into hyperbolic space according to exponential function, and obtain the description-based representation of entities in hyperbolic space.
Specifically, for processing the description of entities, we directly use the sentence embedding model SBERT [41]. The SBERT model uses the pre-trained BERT network, and adds a pooling operation to the output of BERT to generate a fixed-dimensional sentence embeddings. This paper directly takes the sentence representation after the pooling of the SBERT model. Our experimental results show that this is feasible and effective.
- Step two: Hyperbolic representation learning of triples (Structured Representation).
For the structured representation of triples in hyperbolic space, we use the hyperbolic model to obtain the structured embeddings of triples (, , ). is introduced into DMuRP model after using Möbius multiplication. and are translated directly into DMuRP model.
The MuRP defines the calculation method of the triple distance function as . The research work of Balaževic et al. [18] shows that the MuRP using this distance function is better than , , This shows that the relation matrix is important for the head entity to obtain a better representation.
Therefore, we use the calculation method of the triple distance function to train triples and obtain the entity structure-based representations.
- Step three: Joint the entity text representation and structured representation.
To make the learning process of description-based representations of entities to be compatible with structured representation of entities, we make use of the cross-fusion method in this paper.
The head entity and the tail entity of the triple have two representations, respectively, as shown in Figure 2. Based on (, , ), the head entity is replaced by , and the triple embedding (, , ) is obtained. Similarly, the tail entity is replaced, we obtain the triple embedding (, , ). In addition, the head entity and the tail entity are replaced at the same time, we have the triple embedding (, , ). Finally, we obtain four representations of triples, (, , ), (, , ), (, , ) and (, , ).
As shown in Figure 3, the case where the entity text representation and structured representation are cross-fused is intuitively expressed in the DMuRP method, and the structured relation vector is shared. Four energy functions , , , and are generated.
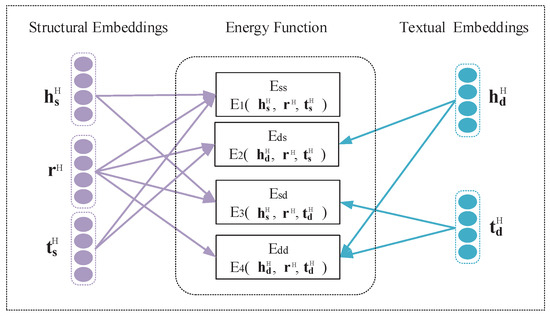
Figure 3.
Cross-fusion diagram.
is structured energy function. Based on it, to keep both description-based and structure-based representations of entities in the same semantic space, we define energy functions , and . The definitions of , , and are as follows. , , , and are balance factors, and the value range is [0, 1].
Define the triple structured energy function as , Equation (7):
In the same way, the description-based representations of the entity replaces the structure-based representations of the entity through the exponential map, , and are defined as Equation (8), Equation (9) and Equation (10), respectively.
Among them, and are the hyperbolic representation of the head and tail entities; , is description-based representations of the entity in Euclidean space; is a diagonal relation matrix, which is combined with Möbius multiplication to adjust the head entity embeddings, whose value is determined by the specific triple relation; is the hyperbolic representation of the relation.
In addition, , , , and are constants, which are balance factors that control each energy function, and their values are determined by the performance of the energy functions , , , and . As shown in Figure 4, the balance of the triple embedding (, , ) itself is adjusted by the balance factor . For unbalanced energy function, for example, when we use the head entity description-based representations to replace the head entity structure-based representations , + , and are obtained. Because the structured representations of the entity and the described representations of the entity are different, + ≠ will be caused, resulting in an unbalanced energy function . It is adjusted by the balance factor . Similarly, when the tail entity description-based representations replace the tail entity structure-based representations, the unbalanced energy function is generated. The unbalanced energy function is adjusted by the balance factor . The head entity based on the described representations and the tail entity based on the described representations replace the head entity based on the structured representations and the tail entity based on the structured representations at the same time, and the unbalanced energy function is generated, and it is adjusted by the balance factor . The influence of each energy function is balanced by introducing balance factors.
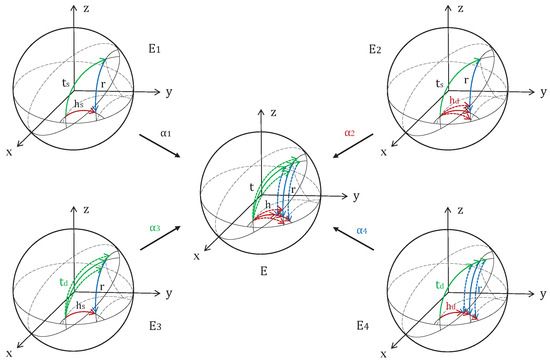
Figure 4.
Diagram of the energy function.
According to the above energy functions, the total score function of the DMuRP method is defined as , Equation (11).
where and are head entity bias and tail entity bias [18].
In order to explore the influence of , , , and on the energy function E, the score functions , , , and are defined. The DMuRPss without containing entity descriptions is used as the baseline, and the DMuRPss score function is defined as , Equation (12). It is worth noting that is also the definition of the MuRP [18] score function.
In the same way, in hyperbolic space, we define the score functions containing entity descriptions (DMuRPds, DMuRPsd, DMuRPdd) as , , and , they are shown as Equations (13)–(15).
The loss function is a negative log-likelihood loss, and it is defined as , Equation (16).
In this formula, n is the number of training samples, p is the predicted probability, and y is the label of the positive samples or negative samples. The positive samples represent the existing structured triples in the knowledge graph, and the negative samples represent the error triples randomly generated during the training process, and the generation method satisfies Equation (17).
where represents the entity set containing head entity and tail entity.
We use Riemannian stochastic gradient descent (RSGD) as optimizer in this paper [18,44]. The Riemann gradient () is equal to the Euclidean gradient () times the inverse of the Poincaré metric tensor, i.e., . Instead of the Euclidean update step , we use to computer the Riemannian update , where , denotes the learning rate.
3.4. Algorithm
In this paper, we give the process of knowledge representation learning for the DMuRP method, as shown in Algorithm 1. DMuRP uses the triple set and entity descriptions as input. First, we obtain hyperbolic embeddings of triples by the MuRP model (line 1). Second, sample a minibatch of size b from the training set (line 3). Third, several negative samples are generated for each correct triple (lines 6–8). Third, calculate the energy function based on Equation (6), and calculate the result of the score function based on Equation (11) (lines 9–10). Finally, calculating the loss, optimize the loss function by Riemannian stochastic gradient descent (line 12, line 14). After many iterations, hyperbolic embeddings of triples and hyperbolic embeddings of entity descriptions with corresponding semantic information are obtained.
The time complexity of learning DMuRP is O(Num × len(train)/batchSize). Num is the number of iterations, batchSize is the sampling size, and len(train) is the size of training set. The time complexity of this algorithm is related to the number of iterations, the sampling size, and the size of training set. When the number of iterations and training sets increases or the number of samples decreases, the time complexity will increase. The space complexity is O((len(Ent) + len(des) + len(Rel)) × d). len(Ent) is the size of the entity set, len(des) is the size of the entity descriptions, len(Rel) is the size of the relation set, and d is the embedding dimensions. When the size of the entity set, the size of the entity descriptions, and the size of the relation set increase, the space complexity will increase.
| Algorithm 1 Learning DMuRP [4] |
Input: Training set , , , , // triples set, entity description-based representations, balanced factors. Output: get hyperbolic embeddings: // hyperbolic embeddings of triples and entity descriptions.
|
4. Experiment and Analysis
4.1. Datasets
FB15k [4] is a triple extracted from Freebase, a large knowledge base, and the description of the entity is public data provided by Xie et al. [22]. The average length of entity descriptions is 69, and the maximum length is 343. WN18 [4] is a triple extracted from the knowledge base WordNet, with a hierarchical structure, and the description of the entity is public data provided by Cheng et al. [23]. The length of entity descriptions contains an average of 13 words, with a maximum length of 73. The specific details are shown in Table 1.

Table 1.
Experimental datasets.
4.2. Implementation
We explore the influence of different parameters on the experimental results on WN18 and FB15k, and optimize the value of the above methods through the Riemannian stochastic gradient descent [18,44] defined in hyperbolic space. Under d = 100 dimensions, the learning rate lr is chosen among {20, 50, 60, 70, 80} and the balance factors are tried to find between [0, 1]. According to the method of binary search to find parameters, by comparing and analyzing the experimental results, the following optimal parameters are selected. WN18 dataset: learning rate lr = 60, balance factors , , , . FB15k dataset: learning rate lr = 60, balance factors , , , .
4.3. Evaluation Metrics
We follow the standard evaluation protocol in the filtered setting [37]. When we construct negative triples, some negative examples may appear in train set or valid set, so all positive triples are removed from negative examples to ensure that all negative triples do not belong to this dataset. DMuRP is evaluated using mean rank (MR), mean reciprocal rank (MRR), and Hit@10. The average ranking is the average of the rankings of all positive triples. The higher the ranking of the positive triples, the better the model, that is, the smaller the MR value, the better. The average reciprocal rank is the reciprocal of each correct triple rank and then averaged, in contrast to MR, the larger the MRR value, the better. Hits@10 is a measure of the number of times the positive triple appears in the top 10, usually it is expressed as a percentage or a decimal.
4.4. Experiments
We set up four kinds of experimental contents. Section 4.4.1 is link prediction based on entity descriptions, the main purpose is to compare the performance of the four energy functions. Section 4.4.2 and Section 4.4.3 are entity prediction and relation prediction, respectively, and the DMuRP is comprehensively analyzed. Section 4.4.4 is a comparative analysis of the DMuRP and MuRP.
4.4.1. Link Prediction Based on Entity Descriptions (Ablation Experiment)
In this section, through ablation research, we compared and analyzed the experimental results of four energy functions , , and , so that the energy function with good performance accounts for a larger proportion in the score function and the energy function with poor performance accounts for a smaller proportion in the score function. According to the performance of these four energy functions, it can also provide reference for us to set the value of balance factors. We set up the comparative experiments of DMuRPss (), DMuRPds (), DMuRPsd (), DMuRPdd (), and uses DMuRPss (without containing entity descriptions) as the baseline to compare and analyze the two representation effects of entity between description-based representations and structure-based representations.
The hyperparameters of WN18 and FB15k are set, the learning rate lr = 60, the batchSize = 256, the dimensions d = 100 and the experimental results are taken after 500 iterations. The experimental results are shown in Table 2, Figure 5 and Figure 6.
Table 2.
Entity prediction results based on entity descriptions.
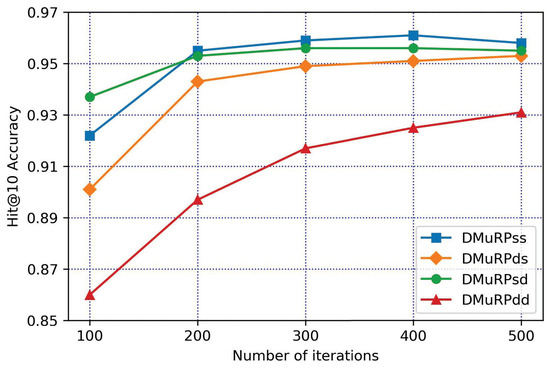
Figure 5.
The variation of WN18 Hit@10 with the number of iterations.
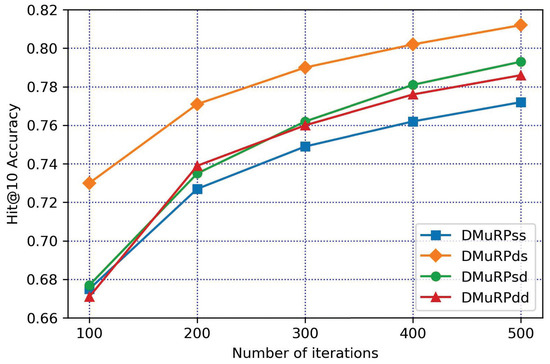
Figure 6.
The variation of FB15k Hit@10 with the number of iterations.
(1) By comparing the two datasets horizontally, with using DMuRPss as the benchmark, the method of containing entity descriptions (DMuRPds, DMuRPsd, DMuRPdd) performed more prominently on FB15k, and generally performed on WN18. The main reason is that the length of entity descriptions in the two datasets is different. The descriptions of entities contain an average of 13 words in WN18, and entity descriptions in FB15k are an average of 69 words. Compared with FB15k, the semantic information of WN18 is relatively scarce. Therefore, it can be seen from Figure 5 and Figure 6 that the increase in WN18 is not as large as that of FB15k. In specific applications, the effect can be further improved by improving the quality and quantity of entity descriptions.
(2) By vertical comparison, according to the experimental results of FB15k, it can be seen that the method of containing entity descriptions (DMuRPds, DMuRPsd, DMuRPdd) is better than baseline DMuRPss, and it is also indicating that description-based representations contain more semantic information. In link prediction, description-based representations’ results outperform structure-based representations’ results. On the contrary, for WN18, the energy function of the fused entity description is relatively general, which indicates that the descriptions of the entity is relatively scarce.
(3) From the specific analysis, it can be seen from Table 2 that the MR value of WN18 is not ideal. Through the analysis, it may be because the MR value is related to entity descriptions and the number of relations. Through the analysis, it may be because the MR value is related to relations and entity descriptions. From the overall observation of Figure 5, the effect of adding entity descriptions is not ideal, which may be because entity descriptions of WN18 are relatively less, but the performance of DMuRPsd is slightly better. Based on , it is found by comparing the formula of , and , the experimental results may be affected by relations. Compared with FB15k, WN18 has fewer relations and less entity descriptions, and its performance will be poor, which will affect the experimental results. To sum up, the quality of the entity descriptions and the number of relations will have an impact on the experimental results.
(4) In addition, the description-based and structure-based representations of entities tend to learn the same semantic space, which is realized by the energy functions , , and . According to the principle that the better the performance, the larger the value of the balance factor, the performance of DMuRPss, DMuRPds, DMuRPsd, and DMuRPdd in Figure 5 and Figure 6 provides a basis for determining the values of the balance factors , , , and on the score function of the DMuRP.
(5) Hyperparameter selection. According to Figure 5, for WN18, the performance of DMuRPds and DMuRPdd contained entity descriptions are general. In order to further explore whether it is necessary to exist in DMuRP, relevant experiments are set up, as shown in Table 3. Under the optimal parameters of DMuRP, , are removed, respectively, and remove and at the same time, that is, for the energy function E, compare the experimental results when = 0, = 0, respectively, and simultaneously = 0, = 0.
Table 3.
Effect of balance factor on WN18.
According to the results in Table 3, balance factors have a great influence on the MR value of WN18. For FB15k, according to Figure 6, the methods of adding entity descriptions (DMuRPds, DMuRPsd, DMuRPdd) are better than structured methods (DMuRPss), in order to balance the good generalization ability of DMuRP on different datasets, the energy function and are retained under the premise of ensuring the quality of knowledge representation.
To sum up, according to (1), (2), and (3), it can be seen that the introduction of entity descriptions will effectively improve the experimental results, and the quality of entity descriptions and the number of relations will affect the experimental results; according to (4) and (5), it can be seen that the values of balance factors , , , and are determined by the performance of each energy function.
4.4.2. Entity Predication
In this section, by link prediction, DMuRP is compared with the model fusing entity descriptions of Euclidean space to prove the effectiveness of our method. Specifically, it can prove that our fusion method and the balance factors are effective. In order to prove that the embeddings of hyperbolic space has certain advantages in low dimensions, we also give the experimental results in 40 dimensions. The comparison of experimental results between DMuRP and the models of Euclidean space is shown in Table 4. These models are fused with entity descriptions. The DKRL model is an early attempt to add description information to the knowledge graph. Most of the models described by fusion entities will be compared with it. Therefore, we use the DKRL model as our baseline. The characteristics of other comparison models are as follows.
Table 4.
DMuRP entity prediction results.
The DKRL [22] model uses CNN to encode the descriptions of entities, and learns the entity representations of description-based and structure-based through cross fusion.
Jointly(LSTM) [35] model introduces LSTM to encode the descriptions of entities, and combines a gating mechanism to improve the experimental results.
The SSP [36] model uses the semantic space projection which jointly learns from the symbolic triples and textual descriptions. It offers precise semantic embedding.
The EHP [24] model learns both from knowledge triples and text descriptions, which maps entities of triples in knowledge space to the description space.
The EDGE [38] model proposes entity descriptions-guided embedding to learn the knowledge graph representations with semantic guidance from entity descriptions.
The TransE_Transformer [37] model uses the complete attention mechanism and Transformer encoder to improve the experimental results in link prediction.
The MCapsEED [23] model combines relation attention mechanism, Transformer and capsule network to better integrate the structured and description representations of entities into a synthetic representation.
The Teger_ConvE [25] model proposes to model the whole auxiliary text corpus with a graph. It enriches the knowledge graph representations and alleviating the inherent structure sparsity.
Under the same dimensions (d = 100) and the same dataset, DMuRP achieved better results. In order to illustrate the advantages of low-dimensional embeddings of knowledge graph in hyperbolic space, the experimental results of DMuRP in different dimensions are compared and analyzed.
Overall, the DMuRP effect in hyperbolic space is more prominent, especially the MR value, which indicates that the representation learning in hyperbolic space is richer than that in Euclidean space. According to the analysis of the Poincaré disk [40,45], the distance between two points closer to the edge is infinite if the distance is calculated directly along the edge, which can be understood as the entity embeddings closer to the edge, the more space there is to distinguish the two entities semantic information. Hyperbolic space has more advantages in tree-like hierarchical structure data. Since WN18 dataset has hierarchical structure and FB15k has less hierarchical data, the MR of WN18 has a greater increase than that of FB15k.
Specifically, for FB15k, Hit@10 performs poorly. We present the ranking distribution of FB15k’s Hit@10, as shown in Figure 7. The higher the number of positive triples, the better. Hit@n the higher the better. Hit@n represents the proportion of positive triples ranking within the top n in the total triples. ΔHit@n indicates the proportion of positive triples ranking in the n-th. From the Hit@n and ΔHit@n curves, it can be seen that the slopes of the curves before Hit@3 are steeper, indicating that the proportion of positive triples ranking within the top 3 is relatively large, and the number of positive triples is higher. After the n-th (), ΔHit@n shows a downward trend, indicating that the proportion of subsequent positive triples gradually decreases, and the number of positive triples is lower. In summary, although the effect of Hit@10 is general, the Hit@n () distribution of positive triples is relatively high, and most of them are distributed within the top three. The Hit@10 ranking distribution of FB15k is more optimistic.
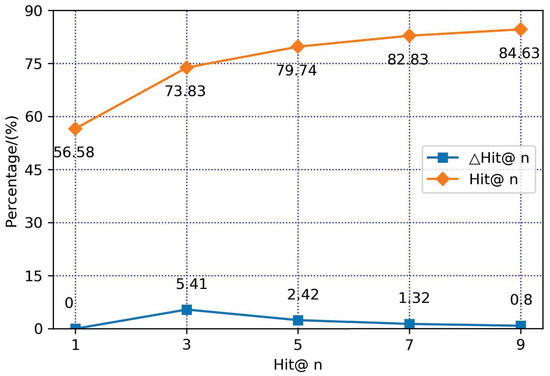
Figure 7.
Rank distribution of FB15k.
In addition, according to the performance of DMuRP in different dimensions, when the low dimension is 40 dimensions, the Hit@10 of WN18 performs better, and the MR of FB15k performs better, which may be due to the different internal structures of the two datasets. WN18 with hierarchical structure is more suitable for Poincaré ball. When there is a limitation on memory space, the embeddings in hyperbolic space can be given priority.
4.4.3. Relation Predication
In order to fully demonstrate the effectiveness of this paper in fusing entity descriptions in hyperbolic space, we compare the experimental results of relation prediction. MR and Hit@1 are used as evaluation indicators. As shown in Table 5. Considering the problems of data quality and relation quantity, compared with FB15k, WN18 has less entity descriptions and fewer relation quantities, so relation prediction is only performed on FB15k.
Table 5.
Relation prediction results on FB15k.
Hit@1 represents the proportion of positive triples ranking No. 1, which also means the accuracy of prediction. It can be seen from Table 5 that our Hit@1 result has an average increase of 3.37%, which indicates that the fusion of entity descriptions can effectively improve the representation ability of the knowledge graph, specifically in relation prediction.
According to Table 5, MR and Hit@1 of FB15k do not achieve simultaneously the optimal results in relation prediction. Maybe FB15k has less hierarchical data, it does not take advantage of the natural advantages of Poincaré ball for hierarchical data, which also reflects that Poincaré ball are more suitable for representing hierarchical data.
4.4.4. DMuRP vs. MuRP
According to the experimental results in Table 4, compared with the models of Euclidean space, the performance of DMuRP is more prominent. In order to prove that the effect of containing entity descriptions is better than that without containing entity descriptions in hyperbolic space, the results of DMuRP and MuRP are compared. As shown in Table 6. DMuRP contains entity descriptions, and MuRP does not contain entity descriptions.
Table 6.
Contrast between DMuRP and MuRP.
According to the experimental results shown in Table 6, the experimental results of DMuRP are obviously better than those of MuRP on both datasets. It can be seen that the results of Hit@10 have an average increase of 2.35%, and the results of MR rose by 15.5 ranks on average. By comparing DMuRP with the model of fusion entity descriptions in Euclidean Space in Section 4.4.2, and DMuRP and MuRP in hyperbolic space in this section, it shows that the method proposed is effective and feasible.
According to the experimental results shown in Figure 8 and Figure 9, DMuRP outperforms MuRP on both datasets. Specifically, DMuRP is suitable for hierarchical data WN18, but due to the low quality of entity descriptions of WN18 and the small number of relations in triples, in Figure 8, it is shown that the improvement of WN18 is not high. Contrary to WN18, FB15k has a higher quality of entity descriptions and a moderate number of relations in triples, in Figure 9, it is shown that the improvement of FB15k is higher.
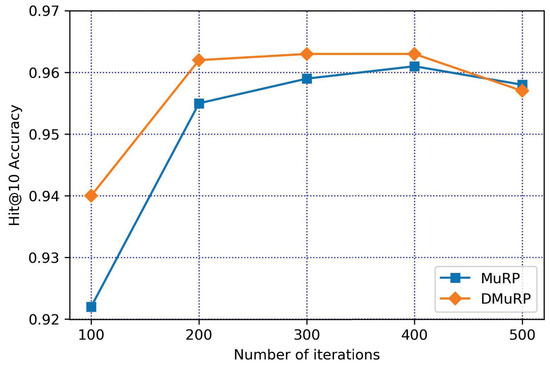
Figure 8.
DMuRP vs. MuRP on WN18.
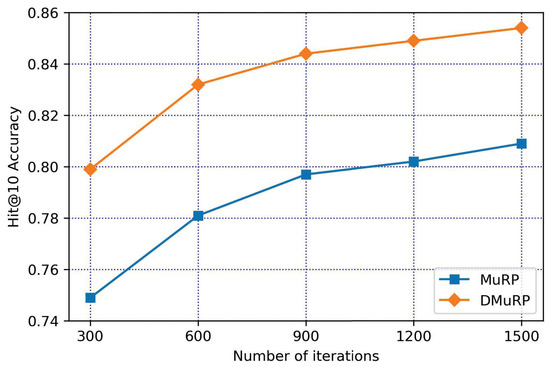
Figure 9.
DMuRP vs. MuRP on FB15k.
5. Summary
We propose a knowledge graph completion method that integrated entity descriptions in the Poincaré ball model of hyperbolic space, and analyze that hyperbolic space is more suitable for representing hierarchical data. Compared with Euclidean space, hyperbolic space has enough space to represent semantic information. The link prediction experiment proves that our method is effective and the effect in hyperbolic space is better than that in Euclidean space.
According to the experimental results in this paper, we find that factors such as the length of entity descriptions and the number of relations in datasets will affect the results of the experiment. Both high-quality entity descriptions and a moderate number of triple relations can improve the performance of the model, and hierarchical datasets are more suitable for modeling in hyperbolic space. Moreover, our method can integrate heterogeneous data of entities. It is worth noting that our algorithm takes the heterogeneous and unstructured embedding of entities as the input and cannot directly input heterogeneous and unstructured data.
However, there are complex relationship problems such as one-to-many (1-N), many-to-one (N-1), and many-to-many (N-N) in the triple relationship of knowledge graph. Our algorithm does not consider the adaptability of dynamic graph, which may be a limitation of our algorithm. These problems have not been addressed in this paper, and we will attempt to build complex relational models and consider the adaptability of dynamic graph in hyperbolic space to improve link predication results.
Author Contributions
Conceptualization, X.Z. and D.T.; methodology, H.W. and D.T.; software, D.T.; validation, X.Z. and H.W.; formal analysis, X.Z., D.T. and H.W.; writing—original draft preparation, X.Z., D.T. and H.W.; writing—review and editing, X.Z., D.T. and H.W.; visualization, D.T.; supervision, X.Z., D.T. and H.W. All authors have read and agreed to the published version of the manuscript.
Funding
This work was funded by Natural Science Foundation of Hebei Province (Grant number F2022208002) and Science and Technology Project of Hebei Education Department (Grant number ZD2021048).
Institutional Review Board Statement
Not applicable.
Informed Consent Statement
Not applicable.
Data Availability Statement
The datasets generated during and analyzed during the current study are available from the corresponding author on reasonable request.
Conflicts of Interest
The authors declare no conflict of interest.
References
- Ji, S.; Pan, S.; Cambria, E.; Marttinen, P.; Philip, S.Y. A survey on knowledge graphs: Representation, acquisition, and applications. IEEE Trans. Neural Netw. Learn. Syst. 2021, 33, 494–514. [Google Scholar] [CrossRef]
- Zamini, M.; Reza, H.; Rabiei, M. A Review of Knowledge Graph Completion. Information 2022, 13, 396. [Google Scholar] [CrossRef]
- Shen, T.; Zhang, F.; Cheng, J. A comprehensive overview of knowledge graph completion. Knowl. Based Syst. 2022, 255, 109597. [Google Scholar] [CrossRef]
- Bordes, A.; Usunier, N.; Garcia-Duran, A.; Weston, J.; Yakhnenko, O. Translating embeddings for modeling multi-relational data. In Proceedings of the Advances in Neural Information Processing Systems, Lake Tahoe, NV, USA, 5–8 December 2013; Volume 26. [Google Scholar]
- Wang, Z.; Zhang, J.; Feng, J.; Chen, Z. Knowledge graph embedding by translating on hyperplanes. In Proceedings of the AAAI Conference on Artificial Intelligence, Quebec City, QC, Canada, 27–31 July 2014; Volume 28. [Google Scholar]
- Yang, B.; Yih, W.t.; He, X.; Gao, J.; Deng, L. Embedding entities and relations for learning and inference in knowledge bases. In Proceedings of the International Conference on Learning Representations (ICLR), San Diego, CA, USA, 7–9 May 2015; pp. 1–13. [Google Scholar]
- Dettmers, T.; Minervini, P.; Stenetorp, P.; Riedel, S. Convolutional 2d knowledge graph embeddings. In Proceedings of the AAAI Conference on Artificial Intelligence, New Orleans, LA, USA, 2–7 February 2018; Volume 32. [Google Scholar]
- Vu, T.; Nguyen, T.D.; Nguyen, D.Q.; Phung, D. A capsule network-based embedding model for knowledge graph completion and search personalization. In Proceedings of the 2019 Conference of the North American Chapter of the Association for Computational Linguistics: Human Language Technologies, Volume 1 (Long and Short Papers), Minneapolis, MI, USA, 3–5 June 2019; pp. 2180–2189. [Google Scholar]
- Borrego, A.; Ayala, D.; Hernández, I.; Rivero, C.R.; Ruiz, D. CAFE: Knowledge graph completion using neighborhood-aware features. Eng. Appl. Artif. Intell. 2021, 103, 104302. [Google Scholar] [CrossRef]
- Sun, Z.; Deng, Z.H.; Nie, J.Y.; Tang, J. Rotate: Knowledge graph embedding by relational rotation in complex space. In Proceedings of the International Conference on Learning Representations (ICLR), New Orleans, LA, USA, 6–9 May 2019; pp. 1–18. [Google Scholar]
- Zhang, S.; Tay, Y.; Yao, L.; Liu, Q. Quaternion knowledge graph embeddings. In Proceedings of the Advances in Neural Information Processing Systems, Vancouver, BC, Canada, 8–14 December 2019; Volume 32. [Google Scholar]
- Baseri Saadi, S.; Tataei Sarshar, N.; Sadeghi, S.; Ranjbarzadeh, R.; Kooshki Forooshani, M.; Bendechache, M. Investigation of Effectiveness of Shuffled Frog-Leaping Optimizer in Training a Convolution Neural Network. J. Healthc. Eng. 2022, 2022, 4703682. [Google Scholar] [CrossRef]
- Aghamohammadi, A.; Ranjbarzadeh, R.; Naiemi, F.; Mogharrebi, M.; Dorosti, S.; Bendechache, M. TPCNN: Two-path convolutional neural network for tumor and liver segmentation in CT images using a novel encoding approach. Expert Syst. Appl. 2021, 183, 115406. [Google Scholar] [CrossRef]
- Li, L.; Zhang, X.; Ma, Y.; Gao, C.; Wang, J.; Yu, Y.; Yuan, Z.; Ma, Q. A knowledge graph completion model based on contrastive learning and relation enhancement method. Knowl. Based Syst. 2022, 256, 109889. [Google Scholar] [CrossRef]
- Sohn, J.; Ma, M.D.; Chen, M. Bending the Future: Autoregressive Modeling of Temporal Knowledge Graphs in Curvature-Variable Hyperbolic Spaces. arXiv 2022, arXiv:2209.05635. [Google Scholar]
- Zheng, W.; Wang, W.; Qian, F.; Zhao, S.; Zhang, Y. Hyperbolic Hierarchical Knowledge Graph Embeddings for Link Prediction in Low Dimensions. arXiv 2022, arXiv:2204.13704. [Google Scholar]
- Nickel, M.; Kiela, D. Poincaré embeddings for learning hierarchical representations. In Proceedings of the Advances in Neural Information Processing Systems, Long Beach, CA, USA, 4–9 December 2017; Volume 30. [Google Scholar]
- Balazevic, I.; Allen, C.; Hospedales, T. Multi-relational poincaré graph embeddings. In Proceedings of the Advances in Neural Information Processing Systems, Vancouver, BC, Canada, 8–14 December 2019; Volume 32. [Google Scholar]
- Bronstein, M.M.; Bruna, J.; LeCun, Y.; Szlam, A.; Vandergheynst, P. Geometric deep learning: Going beyond euclidean data. IEEE Signal Process. Mag. 2017, 34, 18–42. [Google Scholar] [CrossRef]
- Ganea, O.; Bécigneul, G.; Hofmann, T. Hyperbolic neural networks. In Proceedings of the Advances in Neural Information Processing Systems, Montreal, QC, Canada, 3–8 December 2018; Volume 31. [Google Scholar]
- Chami, I.; Ying, Z.; Ré, C.; Leskovec, J. Hyperbolic graph convolutional neural networks. In Proceedings of the Advances in Neural Information Processing Systems, Vancouver, BC, Canada, 8–14 December 2019; Volume 32. [Google Scholar]
- Xie, R.; Liu, Z.; Jia, J.; Luan, H.; Sun, M. Representation learning of knowledge graphs with entity descriptions. In Proceedings of the AAAI Conference on Artificial Intelligence, Phoenix, AZ, USA, 12–17 February 2016; Volume 30. [Google Scholar]
- Cheng, J.; Zhang, F.; Yang, Z. Knowledge Graph Representation Learning with Multi-Scale Capsule-Based Embedding Model Incorporating Entity Descriptions. IEEE Access 2020, 8, 203028–203038. [Google Scholar] [CrossRef]
- Qin, S.; Wang, N.; Wang, H.; Zhou, L.; Zhan, H. EHP: Entity hyperplane projection for knowledge graph embedding with entity descriptions. In Proceedings of the 2019 Computing, Communications and IoT Applications (ComComAp), Shenzhen, China, 26–28 October 2019; pp. 265–269. [Google Scholar]
- Hu, L.; Zhang, M.; Li, S.; Shi, J.; Shi, C.; Yang, C.; Liu, Z. Text-graph enhanced knowledge graph representation learning. Front. Artif. Intell. 2021, 4, 697856. [Google Scholar] [CrossRef] [PubMed]
- Chami, I.; Wolf, A.; Sala, F.; Ré, C. Low-dimensional knowledge graph embeddings via hyperbolic rotations. In Proceedings of the Graph Representation Learning NeurIPS 2019 Workshop, Vancouver, BC, Canada, 8–14 December 2019. [Google Scholar]
- Chami, I.; Wolf, A.; Juan, D.C.; Sala, F.; Ravi, S.; Ré, C. Low-dimensional hyperbolic knowledge graph embeddings. In Proceedings of the 58th Annual Meeting of the Association for Computational Linguistics, Online, 5–10 July 2020; pp. 6901–6914. [Google Scholar]
- Ranjbarzadeh, R.; Tataei Sarshar, N.; Jafarzadeh Ghoushchi, S.; Saleh Esfahani, M.; Parhizkar, M.; Pourasad, Y.; Anari, S.; Bendechache, M. MRFE-CNN: Multi-route feature extraction model for breast tumor segmentation in Mammograms using a convolutional neural network. Ann. Oper. Res. 2022, 1–22. [Google Scholar] [CrossRef]
- Ghoushchi, S.J.; Ranjbarzadeh, R.; Dadkhah, A.H.; Pourasad, Y.; Bendechache, M. An extended approach to predict retinopathy in diabetic patients using the genetic algorithm and fuzzy C-means. BioMed Res. Int. 2021, 2021, 5597222. [Google Scholar] [CrossRef]
- Ranjbarzadeh, R.; Bagherian Kasgari, A.; Jafarzadeh Ghoushchi, S.; Anari, S.; Naseri, M.; Bendechache, M. Brain tumor segmentation based on deep learning and an attention mechanism using MRI multi-modalities brain images. Sci. Rep. 2021, 11, 10930. [Google Scholar] [CrossRef]
- Kolyvakis, P.; Kalousis, A.; Kiritsis, D. Hyperbolic knowledge graph embeddings for knowledge base completion. In Proceedings of the European Semantic Web Conference, Heraklion, Greece, 31May–4 June 2020; pp. 199–214. [Google Scholar]
- Shen, Y.; Li, Z.; Wang, X.; Li, J.; Zhang, X. Datatype-aware knowledge graph representation learning in hyperbolic space. In Proceedings of the 30th ACM International Conference on Information & Knowledge Management, Online, 1–5 November 2021; pp. 1630–1639. [Google Scholar]
- Cao, Z.; Xu, Q.; Yang, Z.; Cao, X.; Huang, Q. Geometry Interaction Knowledge Graph Embeddings. In Proceedings of the AAAI Conference on Artificial Intelligence, Virtual, 22 February–1 March 2022. [Google Scholar]
- Iyer, R.G.; Bai, Y.; Wang, W.; Sun, Y. Dual-Geometric Space Embedding Model for Two-View Knowledge Graphs. In Proceedings of the 28th ACM SIGKDD Conference on Knowledge Discovery and Data Mining, Washington, DC, USA, 14–18 August 2022; pp. 676–686. [Google Scholar]
- Xu, J.; Chen, K.; Qiu, X.; Huang, X. Knowledge graph representation with jointly structural and textual encoding. In Proceedings of the International Joint Conference on Artificial Intelligence (IJCAI), Melbourne, Australia, 19–25 August 2017; pp. 1318–1324. [Google Scholar]
- Xiao, H.; Huang, M.; Meng, L.; Zhu, X. SSP: Semantic space projection for knowledge graph embedding with text descriptions. In Proceedings of the Thirty-First AAAI Conference on Artificial Intelligence, San Francisco, CA, USA, 4–9 February 2017. [Google Scholar]
- Zhao, M.; Zhao, Y.; Xu, B. Knowledge graph completion via complete attention between knowledge graph and entity descriptions. In Proceedings of the 3rd International Conference on Computer Science and Application Engineering, Sanya, China, 22–24 October 2019; pp. 1–6. [Google Scholar]
- Wang, S.; Jiang, C. Knowledge graph embedding with interactive guidance from entity descriptions. IEEE Access 2019, 7, 156686–156693. [Google Scholar]
- Yu, C.; Zhang, Z.; An, L.; Li, G. A knowledge graph completion model integrating entity description and network structure. Aslib J. Inf. Manag. 2022. [Google Scholar] [CrossRef]
- Chamberlain, B.P.; Clough, J.R.; Deisenroth, M.P. Neural Embeddings of Graphs in Hyperbolic Space. arXiv 2017, arXiv:1705.10359. [Google Scholar]
- Reimers, N.; Gurevych, I. Sentence-bert: Sentence embeddings using siamese bert-networks. In Proceedings of the 2019 Conference on Empirical Methods in Natural Language Processing and the 9th International Joint Conference on Natural Language Processing (EMNLP-IJCNLP), Hong Kong, China, 3–7 November 2019; pp. 3982–3992. [Google Scholar]
- Leimeister, M.; Wilson, B.J. Skip-gram word embeddings in hyperbolic space. arXiv 2018, arXiv:1809.01498. [Google Scholar]
- Dhingra, B.; Shallue, C.J.; Norouzi, M.; Dai, A.M.; Dahl, G.E. Embedding text in hyperbolic spaces. In Proceedings of the Twelfth Workshop on Graph-Based Methods for Natural Language Processing, New Orleans, LV, USA, 6 June 2018; Association for Computational Linguistics (TextGraphs-12): Stroudsburg, PA, USA, 2018; pp. 59–69. [Google Scholar]
- Bonnabel, S. Stochastic gradient descent on Riemannian manifolds. IEEE Trans. Autom. Control 2013, 58, 2217–2229. [Google Scholar] [CrossRef]
- Jiang, H.; Shuwen, Y. Hyperbolic representation learning for complex networks. J. Softw. 2021, 32, 93–117. [Google Scholar]
Disclaimer/Publisher’s Note: The statements, opinions and data contained in all publications are solely those of the individual author(s) and contributor(s) and not of MDPI and/or the editor(s). MDPI and/or the editor(s) disclaim responsibility for any injury to people or property resulting from any ideas, methods, instructions or products referred to in the content. |
© 2022 by the authors. Licensee MDPI, Basel, Switzerland. This article is an open access article distributed under the terms and conditions of the Creative Commons Attribution (CC BY) license (https://creativecommons.org/licenses/by/4.0/).