
Severity Prediction of Highway Crashes in Saudi Arabia Using Machine Learning Techniques
 ,
,  ,
,  ,
, 
Abstract
1. Introduction
2. Related Works
2.1. Crash Injury Severity Categorization
2.2. Modeling Approaches
2.3. Previous Studies
3. Materials and Methods
3.1. Proposed Severity Prediction Framework
3.2. Study Area and Collection of Accident Data
3.3. Methods
3.3.1. Platform
3.3.2. Response Process
3.3.3. Logistic Regression
3.3.4. Extreme Gradient Boosting (XGBoost)
3.3.5. Random Forest
3.3.6. Hyperparameter Tuning
3.3.7. Model Interpretation
3.3.8. Model Evaluation
4. Results and Discussion
4.1. Multi-Classification
4.2. Binary Classification
4.3. Model Interpretations
4.4. Dependence Plot
5. Conclusions
Author Contributions
Funding
Institutional Review Board Statement
Informed Consent Statement
Data Availability Statement
Acknowledgments
Conflicts of Interest
Appendix A. Summary of Past Studies on Injury Severity Prediction
| No. | Year | Country | Duration | Size | Injury Severity Classes | Approach | Best Approach | Significant Factors | Reference |
| 1 | 2022 | Pakistan | 2015–2019 | 1784 |
|
|
|
| S. Zhang, Khattak, Matara, Hussain, & Farooq (2022) [55] |
| 2 | 2022 | China | 2018 | 567 |
|
|
|
| Yang, Wang, Yuan, & Liu (2022) [75] |
| 3 | 2021 | Saudi Arabia | Jan 2017–Dec 2019 | 13,546 |
|
|
|
| Jamal et al. (2021) [47] |
| 4 | 2021 | US | 2004–2021 | 204,758 |
|
|
|
| Niyogisubizo et al. (2021) [19] |
| 5 | 2020 | US | 2010–2018 | 8859 |
|
|
|
| Lin, Wu, Liu, Xia, & Bhattarai (2020) [51] |
| 6 | 2020 | India | 2016–2018 | 7654 |
|
|
|
| Panicker & Ramadurai (2022) [9] |
| 7 | 2019 | US | 2017 | 201,581 |
|
|
|
| Wang & Kim (2019) [32] |
| 8 | 2019 | South Africa | 2015–2017 | 1525 |
|
|
|
| Mokoatle et al. (2019) [37] |
| 9 | 2018 | US | 2008–2012 | 32,730 |
|
|
|
| Mafi et al. (2018) [30] |
| 10 | 2018 | US | 2012–2015 | 15,164 |
|
|
|
| Liao et al. (2018) [74] |
| 11 | 2017 | Malaysia | 2009–2015 | 1130 |
|
|
|
| Sameen and Pradhan (2017) [75] |
| 12 | 2017 | UAE | 2008–2013 | 5973 |
|
|
|
| Taamneh et al. (2017) [25] |
| 13 | 2016 | Saudi Arabia | 2014–2015 | 85,605 |
|
|
|
| Al-Turaiki et al. (2016) [24] |
| 14 | 2015 | Iran | 2007 | 1063 |
|
|
|
| Aghayan et al. (2015) [72] |
References
- International Transport Forum (ITF). Road Safety Annual Report 2021: The Impact of COVID-19; ITF: Paris, France, 2021. [Google Scholar]
- World Health Organization (WHO). Global Status Report on Road Safety; WHO: Geneva, Switzerland, 2018. [Google Scholar]
- Al-Atawi, A.M.; Kumar, R.; Saleh, W. A framework for accident reduction and risk identification and assessment in Saudi Arabia. World J. Sci. Technol. Sustain. Dev. 2014, 11, 214–223. [Google Scholar] [CrossRef]
- Memish, Z.A.; Jaber, S.; Mokdad, A.H.; AlMazroa, M.A.; Murray, C.J.; Al Rabeeah, A.A.; Saudi Burden of Disease Collaborators. Peer reviewed: Burden of disease, injuries, and risk factors in the Kingdom of Saudi Arabia, 1990–2010. Prev. Chronic Dis. 2014, 11, E169. [Google Scholar] [CrossRef]
- Barrimah, I.; Midhet, F.; Sharaf, F. Epidemiology of road traffic injuries in Qassim region, Saudi Arabia: Consistency of police and health data. Int. J. Health Sci. 2012, 6, 31. [Google Scholar] [CrossRef] [PubMed]
- FHWA. Highway Safety Manual; American Association of State Highway and Transportation Officials: Washington, DC, USA, 2010; Volume 19192.
- Hosseinzadeh, A.; Moeinaddini, A.; Ghasemzadeh, A. Investigating factors affecting severity of large truck-involved crashes: Comparison of the SVM and random parameter logit model. J. Saf. Res. 2021, 77, 151–160. [Google Scholar] [CrossRef]
- Al-Moqri, T.; Haijun, X.; Namahoro, J.P.; Alfalahi, E.N.; Alwesabi, I. Exploiting Machine Learning Algorithms for Predicting Crash Injury Severity in Yemen: Hospital Case Study. Appl. Comput. Math 2020, 9, 155–164. [Google Scholar] [CrossRef]
- Panicker, A.K.; Ramadurai, G. Injury severity prediction model for two-wheeler crashes at mid-block road sections. Int. J. Crashworthiness 2022, 27, 328–336. [Google Scholar] [CrossRef]
- Tang, J.; Liang, J.; Han, C.; Li, Z.; Huang, H. Crash injury severity analysis using a two-layer Stacking framework. Accid. Anal. Prev. 2019, 122, 226–238. [Google Scholar] [CrossRef]
- Bahiru, T.K.; Singh, D.K.; Tessfaw, E.A. Comparative study on data mining classification algorithms for predicting road traffic accident severity. In Proceedings of the 2018 Second International Conference on Inventive Communication and Computational Technologies (ICICCT), Coimbatore, India, 20–21 April 2018. [Google Scholar]
- Prati, G.; Pietrantoni, L.; Fraboni, F. Using data mining techniques to predict the severity of bicycle crashes. Accid. Anal. Prev. 2017, 101, 44–54. [Google Scholar] [CrossRef]
- Özden, C.; Acı, Ç. Analysis of injury traffic accidents with machine learning methods: Adana case. Pamukkale Univ. J. Eng. Sci. 2018, 24, 266–275. [Google Scholar] [CrossRef]
- Beshah, T.; Ejigu, D.; Abraham, A.; Snasel, V.; Kromer, P. Mining Pattern from Road Accident Data: Role of Road User’s Behaviour and Implications for improving road safety. Int. J. Tomogr. Simul. 2013, 22, 73–86. [Google Scholar]
- Zhang, S.; Khattak, A.; Matara, C.M.; Hussain, A.; Farooq, A. Hybrid feature selection-based machine learning Classification system for the prediction of injury severity in single and multiple-vehicle accidents. PLoS ONE 2022, 17, e0262941. [Google Scholar] [CrossRef] [PubMed]
- Arhin, S.A.; Gatiba, A. Predicting crash injury severity at unsignalized intersections using support vector machines and naïve Bayes classifiers. Transp. Saf. Environ. 2020, 2, 120–132. [Google Scholar] [CrossRef]
- Candefjord, S.; Muhammad, A.S.; Bangalore, P.; Buendia, R. On Scene Injury Severity Prediction (OSISP) machine learning algorithms for motor vehicle crash occupants in US. J. Transp. Health 2021, 22, 101124. [Google Scholar] [CrossRef]
- Mokhtarimousavi, S.; Anderson, J.C.; Azizinamini, A.; Hadi, M. Improved support vector machine models for work zone crash injury severity prediction and analysis. Transp. Res. Rec. 2019, 2673, 680–692. [Google Scholar] [CrossRef]
- Ma, Z.; Mei, G.; Cuomo, S. An analytic framework using deep learning for prediction of traffic accident injury severity based on contributing factors. Accid. Anal. Prev. 2021, 160, 106322. [Google Scholar] [CrossRef] [PubMed]
- AlMamlook, R.E.; Kwayu, K.M.; Alkasisbeh, M.R.; Frefer, A.A. Comparison of machine learning algorithms for predicting traffic accident severity. In Proceedings of the 2019 IEEE Jordan International Joint Conference on Electrical Engineering and Information Technology (JEEIT), Amman, Jordan, 9–11 April 2019. [Google Scholar]
- Chen, M.-M.; Chen, M.-C. Modeling road accident severity with comparisons of logistic regression, decision tree and random forest. Information 2020, 11, 270. [Google Scholar] [CrossRef]
- Niyogisubizo, J.; Liao, L.; Lin, Y.; Luo, L.; Nziyumva, E.; Murwanashyaka, E. A Novel Stacking Framework Based On Hybrid of Gradient Boosting-Adaptive Boosting-Multilayer Perceptron for Crash Injury Severity Prediction and Analysis. In Proceedings of the 2021 IEEE 4th International Conference on Electronics and Communication Engineering (ICECE), Xi’an, China, 17–19 December 2021. [Google Scholar]
- Shibata, A.; Fukuda, K. Risk factors of fatality in motor vehicle traffic accidents. Accid. Anal. Prev. 1994, 26, 391–397. [Google Scholar] [CrossRef]
- Duncan, C.S.; Khattak, A.J.; Council, F.M. Applying the ordered probit model to injury severity in truck-passenger car rear-end collisions. Transp. Res. Rec. 1998, 1635, 63–71. [Google Scholar] [CrossRef]
- Al-Turaiki, I.; Aloumi, M.; Aloumi, N.; Alghamdi, K. Modeling traffic accidents in Saudi Arabia using classification techniques. In Proceedings of the 2016 4th Saudi International Conference on Information Technology (Big Data Analysis)(KACSTIT), Riyadh, Saudi Arabia, 6–9 November 2016. [Google Scholar]
- Taamneh, M.; Alkheder, S.; Taamneh, S. Data-mining techniques for traffic accident modeling and prediction in the United Arab Emirates. J. Transp. Saf. Secur. 2017, 9, 146–166. [Google Scholar] [CrossRef]
- Alkheder, S.; Taamneh, M.; Taamneh, S. Severity prediction of traffic accident using an artificial neural network. J. Forecast. 2017, 36, 100–108. [Google Scholar] [CrossRef]
- Breiman, L. Bagging predictors. Mach. Learn. 1996, 24, 123–140. [Google Scholar] [CrossRef]
- Zhang, J.; Li, Z.; Pu, Z.; Xu, C. Comparing prediction performance for crash injury severity among various machine learning and statistical methods. IEEE Access 2018, 6, 60079–60087. [Google Scholar] [CrossRef]
- Krishnaveni, S.; Hemalatha, M. A perspective analysis of traffic accident using data mining techniques. Int. J. Comput. Appl. 2011, 23, 40–48. [Google Scholar] [CrossRef]
- Jiang, H. A comparative study on machine learning based algorithms for prediction of motorcycle crash severity. PLoS ONE 2019, 14, e0214966. [Google Scholar]
- Mafi, S.; Abdelrazig, Y.; Doczy, R. Machine learning methods to analyze injury severity of drivers from different age and gender groups. Transp. Res. Rec. 2018, 2672, 171–183. [Google Scholar] [CrossRef]
- Wang, X.; Kim, S.H. Prediction and factor identification for crash severity: Comparison of discrete choice and tree-based models. Transp. Res. Rec. 2019, 2673, 640–653. [Google Scholar] [CrossRef]
- Santos, K.; Dias, J.P.; Amado, C. A literature review of machine learning algorithms for crash injury severity prediction. J. Saf. Res. 2022, 80, 254–269. [Google Scholar] [CrossRef] [PubMed]
- Khan, M.U.A.; Shukla, S.K.; Raja, M.N.A. Load-settlement response of a footing over buried conduit in a sloping terrain: A numerical experiment-based artificial intelligent approach. Soft Comput. 2022, 26, 6839–6856. [Google Scholar] [CrossRef]
- Rezapour, M.; Molan, A.M.; Ksaibati, K. Analyzing injury severity of motorcycle at-fault crashes using machine learning techniques, decision tree and logistic regression models. Int. J. Transp. Sci. Technol. 2019, 9, 89–99. [Google Scholar] [CrossRef]
- Mokoatle, M.; Vukosi Marivate, D.; Michael Esiefarienrhe Bukohwo, P. Predicting road traffic accident severity using accident report data in South Africa. In Proceedings of the 20th Annual International Conference on Digital Government Research, Dubai, United Arab Emirates, 18–20 June 2019. [Google Scholar]
- Chen, T.; Guestrin, C. Xgboost: A scalable tree boosting system. In Proceedings of the 22nd ACM Sigkdd International Conference on Knowledge Discovery and Data Mining, San Francisco, CA, USA, 13–17 August 2016. [Google Scholar]
- Hawla, N.V.; Bowyer, K.W.; Hall, L.O.; Kegelmeyer, W.P. SMOTE: Synthetic minority over-sampling technique. J. Artif. Intell. Res. 2002, 16, 321–357. [Google Scholar]
- Rahim, M.A.; Hassan, H.M. A deep learning based traffic crash severity prediction framework. Accid. Anal. Prev. 2021, 154, 106090. [Google Scholar] [CrossRef] [PubMed]
- Wolpert, D.H. Stacked generalization. Neural Netw. 1992, 5, 241–259. [Google Scholar] [CrossRef]
- Lundberg, S.M.; Lee, S.-I. A unified approach to interpreting model predictions. Adv. Neural Inf. Process. Syst. 2017, 30, 2493. [Google Scholar]
- Dong, S.; Khattak, A.; Ullah, I.; Zhou, J.; Hussain, A. Predicting and analyzing road traffic injury severity using boosting-based ensemble learning models with SHAPley Additive exPlanations. Int. J. Environ. Res. Public Health 2022, 19, 2925. [Google Scholar] [CrossRef] [PubMed]
- Chakraborty, M.; Gates, T.; Sinha, S. Causal Analysis and Classification of Traffic Crash Injury Severity Using Machine Learning Algorithms. arXiv 2021, arXiv:2112.03407. [Google Scholar]
- Jiang, L.; Xie, Y.; Wen, X.; Ren, T. Modeling highly imbalanced crash severity data by ensemble methods and global sensitivity analysis. J. Transp. Saf. Secur. 2022, 14, 562–584. [Google Scholar] [CrossRef]
- Labib, M.F.; Rifat, A.S.; Hossain, M.M.; Das, A.K.; Nawrine, F. Road accident analysis and prediction of accident severity by using machine learning in Bangladesh. In Proceedings of the 2019 7th International Conference on Smart Computing & Communications (ICSCC), Sarawak, Malaysia, 28–30 June 2019. [Google Scholar]
- Jamal, A.; Zahid, M.; Rahman, M.T.; Al-Ahmadi, H.M.; Almoshaogeh, M.; Farooq, D.; Ahmad, M. Injury severity prediction of traffic crashes with ensemble machine learning techniques: A comparative study. Int. J. Inj. Control Saf. Promot. 2021, 28, 408–427. [Google Scholar] [CrossRef]
- Sattar, K.; Oughali, F.C.; Assi, K.; Ratrout, N.; Jamal, A.; Rahman, S.M. Prediction of electric vehicle charging duration time using ensemble machine learning algorithm and Shapley additive explanations. Int. J. Energy Res. 2022, 46, 15211–15230. [Google Scholar]
- Ullah, I.; Liu, K.; Yamamoto, T.; Zahid, M.; Jamal, A. Modeling of machine learning with SHAP approach for electric vehicle charging station choice behavior prediction. Travel Behav. Soc. 2023, 31, 78–92. [Google Scholar] [CrossRef]
- Sattar, K.; Chikh Oughali, F.; Assi, K.; Ratrout, N.; Jamal, A.; Masiur Rahman, S. Transparent deep machine learning framework for predicting traffic crash severity. Neural Comput. Appl. 2022, 34, 1–13. [Google Scholar] [CrossRef]
- Lin, C.; Wu, D.; Liu, H.; Xia, X.; Bhattarai, N. Factor identification and prediction for teen driver crash severity using machine learning: A case study. Appl. Sci. 2020, 10, 1675. [Google Scholar] [CrossRef]
- Wu, S.; Yuan, Q.; Yan, Z.; Xu, Q. Analyzing accident injury severity via an extreme gradient boosting (XGBoost) model. J. Adv. Transp. 2021, 2021, 3771640. [Google Scholar]
- Zhu, S.; Wang, K.; Li, C. Crash injury severity prediction using an ordinal classification machine learning approach. Int. J. Environ. Res. Public Health 2021, 18, 11564. [Google Scholar] [CrossRef]
- Aldhari, I.; Bakri, M.; Alfawzan, M.S. Prediction of California Bearing Ratio of Granular Soil by Multivariate Regression and Gene Expression Programming. Adv. Civ. Eng. 2022, 2022, 7426962. [Google Scholar]
- Minstry of Interior (MOI). Emirate of Al-Qasim Province. National Information Center “Absher”, Saudi Arabia 2022; 2022. Available online: https://www.moi.gov.sa/wps/portal/Home/emirates/qasim/ (accessed on 8 October 2022).
- Almoshaogeh, M.; Abdulrehman, R.; Haider, H.; Alharbi, F.; Jamal, A.; Alarifi, S. Traffic accident risk assessment framework for qassim, saudi arabia: Evaluating the impact of speed cameras. Appl. Sci. 2021, 11, 6682. [Google Scholar] [CrossRef]
- Al-Tit, A.A.; Ben Dhaou, I.; Albejaidi, F.M.; Alshitawi, M.S. Traffic safety factors in the Qassim region of Saudi Arabia. Sage Open 2020, 10, 2158244020919500. [Google Scholar] [CrossRef]
- Witten, I.H.; Frank, E.; Trigg, L.E.; Hall, M.A.; Holmes, G.; Cunningham, S.J. Weka: Practical Machine Learning Tools and Techniques with Java Implementations; University of Waikato, Department of Computer Science: Hamilton, New Zealand, 1999. [Google Scholar]
- Witten, I.H.; Frank, E.; Hall, M.A. Data Mining: Practical Machine Learning Tools and Techniques, 3rd ed.; Elsevier: Amsterdam, The Netherlands, 2005; Volume 2. [Google Scholar]
- Beshah, T.; Hill, S. Mining Road Traffic Accident Data to Improve Safety: Role of Road-Related Factors on Accident Severity in Ethiopia. In 2010 AAAI Spring symposium series. 2010. Available online: https://www.aaai.org/ocs/index.php/SSS/SSS10/paper/view/1173/1343 (accessed on 17 November 2022).
- Khera, D.; Singh, W. Prediction and analysis of injury severity in traffic system using data mining techniques. Int. J. Comput. Applic 2015, 7, 1–7. [Google Scholar]
- Castro, Y.; Kim, Y.J. Data mining on road safety: Factor assessment on vehicle accidents using classification models. Int. J. Crashworthiness 2016, 21, 104–111. [Google Scholar] [CrossRef]
- Mitrpanont, J.; Sawangphol, W.; Vithantirawat, T.; Paengkaew, S.; Suwannasing, P.; Daramas, A.; Chen, Y.C. A study on using Python vs Weka on dialysis data analysis. In Proceedings of the 2017 2nd International Conference on Information Technology (INCIT), Nakhonpathom, Thailand, 2–3 November 2017. [Google Scholar]
- Friedman, J.H. Greedy function approximation: A gradient boosting machine. Ann. Stat. 2001, 29, 1189–1232. [Google Scholar] [CrossRef]
- Xgboost Developers. Revision 62ed8b5f, Introduction/XGBoost Objective Function. 2022. Available online: https://xgboost.readthedocs.io/en/stable/tutorials/model.html (accessed on 23 August 2022).
- Shapley, L. Quota Solutions op n-person Games1; Artin, E., Morse, M., Eds.; Princeton University Press: Princeton, NJ, USA, 1953; p. 343. [Google Scholar]
- SHAP. SHAP Documentation. SHAP 2017. Available online: https://shap.readthedocs.io/en/latest/index.html (accessed on 3 September 2022).
- Yu, R.; Abdel-Aty, M. Utilizing support vector machine in real-time crash risk evaluation. Accid. Anal. Prev. 2013, 51, 252–259. [Google Scholar] [CrossRef]
- Pillajo-Quijia, G.; Arenas-Ramírez, B.; González-Fernández, C.; Aparicio-Izquierdo, F. Influential factors on injury severity for drivers of light trucks and vans with machine learning methods. Sustainability 2020, 12, 1324. [Google Scholar] [CrossRef]
- Aghayan, I.; Hosseinlou, M.H.; Kunt, M.M. Application of support vector machine for crash injury severity prediction: A model comparison approach. J. Civ. Eng. Urban. 2015, 5, 193–199. [Google Scholar]
- Shanthi, S.; Ramani, R.G. Feature relevance analysis and classification of road traffic accident data through data mining techniques. In Proceedings of the World Congress on Engineering and Computer Science, San Francisco, CA, USA, 24–26 October 2012. [Google Scholar]
- Kunt, M.M.; Aghayan, I.; Noii, N. Prediction for traffic accident severity: Comparing the artificial neural network, genetic algorithm, combined genetic algorithm and pattern search methods. Transport 2011, 26, 353–366. [Google Scholar] [CrossRef]
- Yang, Y.; Wang, K.; Yuan, Z.; Liu, D. Predicting freeway traffic crash severity using XGBoost-Bayesian network model with consideration of features interaction. J. Adv. Transp. 2022, 2022, 4257865. [Google Scholar] [CrossRef]
- Liao, Y.; Zhang, J.; Wang, S.; Li, S.; Han, J. Study on crash injury severity prediction of autonomous vehicles for different emergency decisions based on support vector machine model. Electronics 2018, 7, 381. [Google Scholar] [CrossRef]
- Sameen, M.I.; Pradhan, B. Severity prediction of traffic accidents with recurrent neural networks. Appl. Sci. 2017, 7, 476. [Google Scholar] [CrossRef]


| Variables | Description | Variable Categories | Frequencies |
|---|---|---|---|
| Dependent Variable | |||
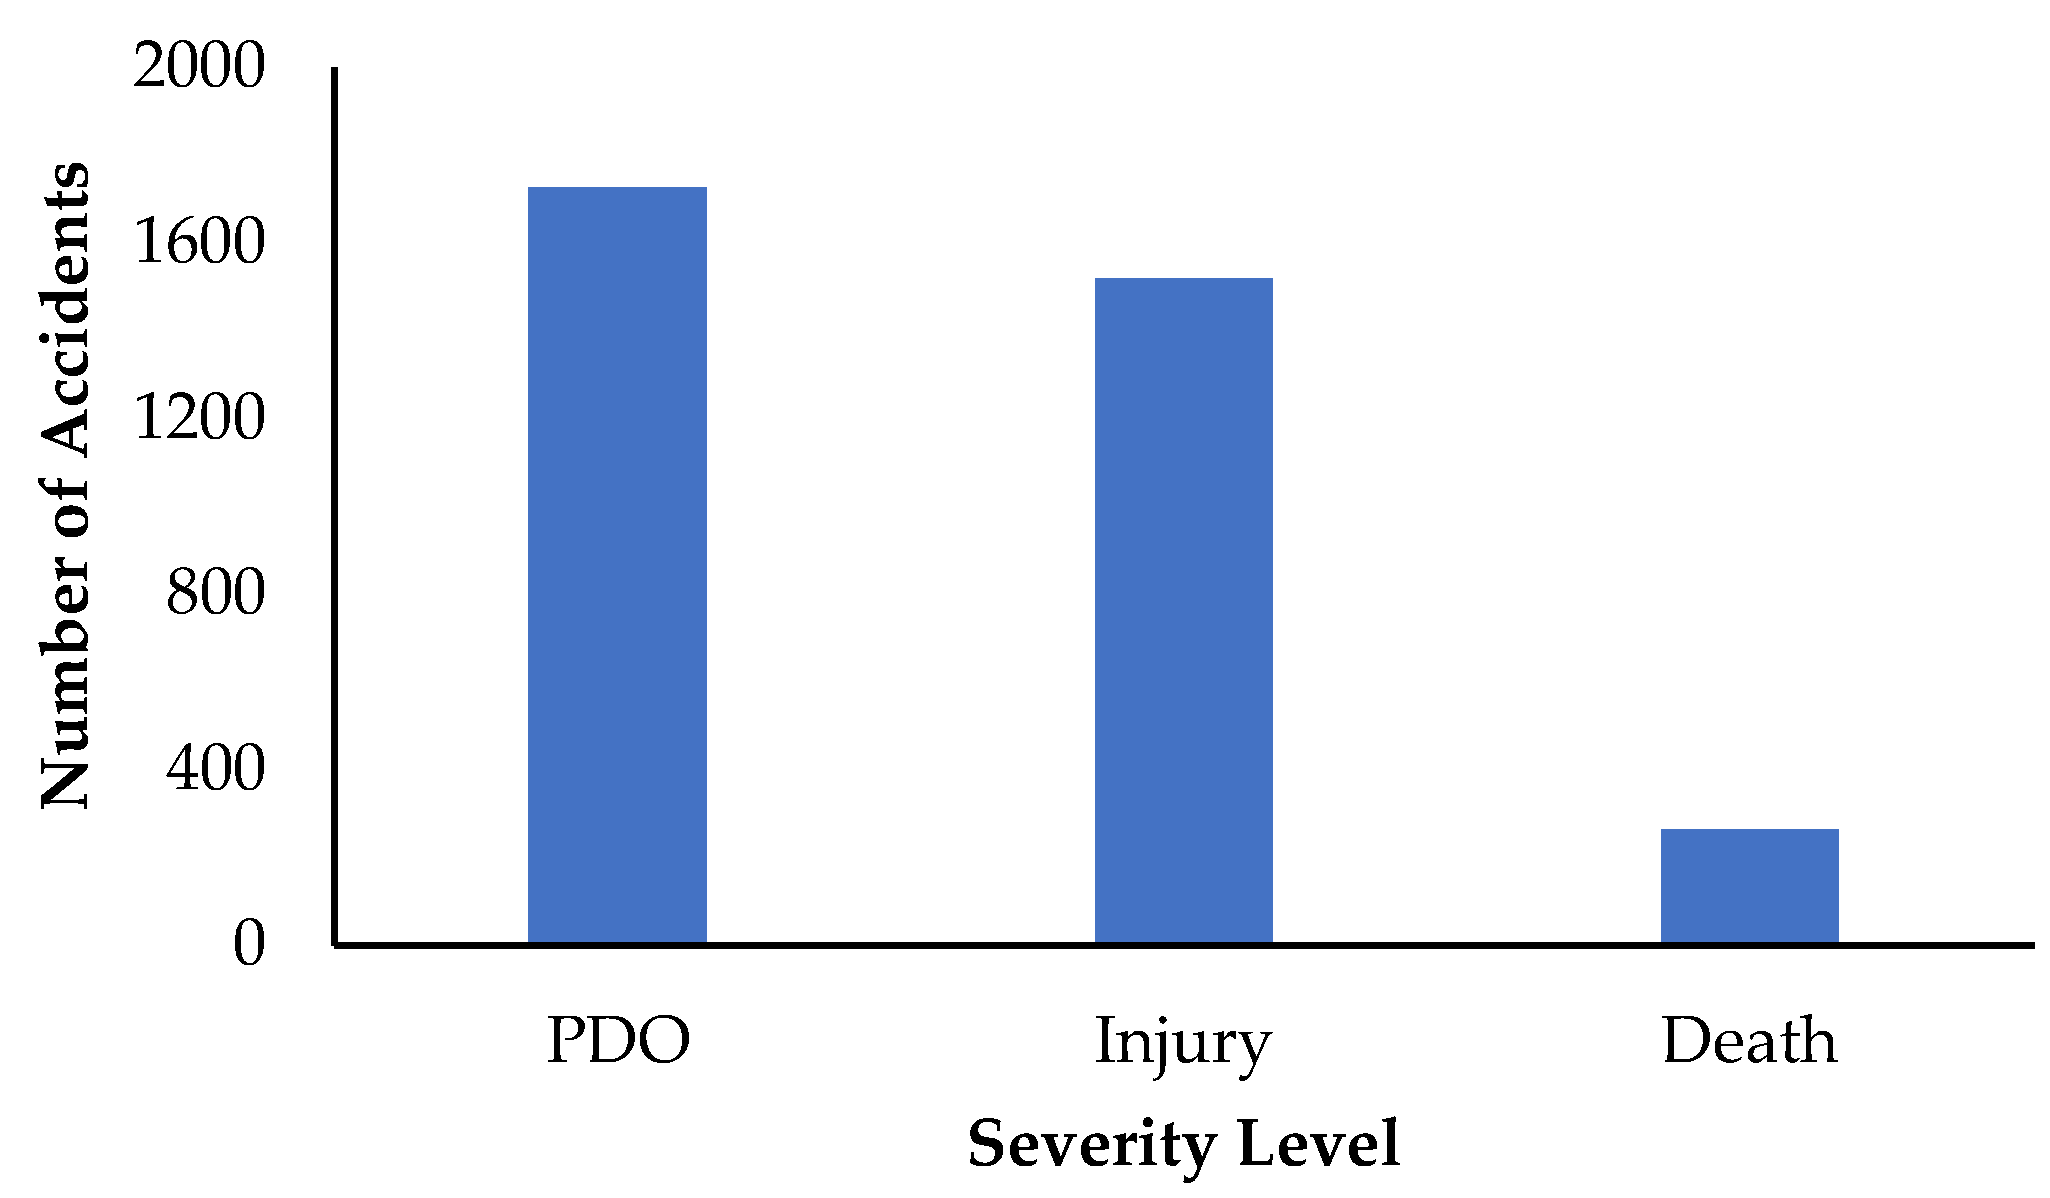
| Accident_categories | Severity of crash | Property damage only (PDO)/Injury/Death | 49.2%, 43.3%, 7.5% |
| Independent Variables | |||
| Temporal Attributes | |||
| Day | Day of the week | Sunday/Monday/Tuesday/Wednesday/Thursday/Friday/Saturday | 15%, 15%, 15%, 16%, 15%, 11%, 13% |
| Day_Type | Weekday or weekend | Weekday/Weekend | 76%, 24% |
| Rush_Hour | Time of the day (TOD) | Peak hours/Non-peak hours | 59%, 41% |
| Season | Season of the year | Summer/Autumn/Winter/Spring | 62%, 11%, 15%, 12% |
| Month | Month of the year | January/February/March/April/May/June/July/August/September/October/November/December | 4.7%, 4.7%, 6.5%, 6%, 6.5%, 5%, 30%, 15%, 5%, 5.7%, 5.4%, 5.5% |
| Quarter | Quarter of the year | Q1/Q2/Q3/Q4 | 15.8%, 17.5%, 50.1%, 16.6% |
| Environmental Factors | |||
| Lighting Condition | Light condition at time of accident | Twilight/Daylight/Darkness/Dusk | 3%, 57%, 36%, 4% |
| Weather condition | Weather status at time of the accident | Good/Rainy/Dusty/Other | 95.9%, 1.9%, 1.9%, 0.3% |
| Roadway Characteristics | |||
| Road_Status | Condition of the road | Good/Road Works/Other | 99.5%, 0.1%, 0.4% |
| Road_Type | Type of road the accident occurred in | Single Carriageway/Dual Carriageways/Highway | 19.9%, 28.6%, 51.5% |
| Geometric_Road_Type | Road geometric characteristics | Straight road/Vertical curve/Horizontal curve/Intersection/U Turn | 96.2%, 0.4%, 2.5%, 0.6%, 0.3% |
| Paints | Existence of road paint marking | True/False | 99%, 1% |
| Eyes | Existing of cat’s eyes on road | True/False | 99%, 1% |
| Vehicle Characteristics | |||
| Vehicle_Type | Type of vehicles in accident | Private car/Light truck/Heavy truck/Bus | 81%, 5.3%, 13.4%, 0.3% |
| No_Vehicles_Involved | Number of vehicles in accident | 1–17 | |
| Crash Characteristics | |||
| Accident_Type | Collision type | Swerving/Burning/Collision/Rollover/Rear-end collision/Head-on collision/Faulty tire/Animal runover/Human runover | 12.1%, 3.8%, 50.5%, 24.9%, 6%, 0.5%, 0.1%, 1.7%, 0.4% |
| ACC_Cause | Cause of accident | Driver/Vehicle/Driver + Vehicle/Road | 83.8%, 13.2%, 2.6%, 0.4% |
| Main_Cause | Root cause of accident | Speeding/Inattention/Tire explosion/Obstacles/Vehicle malfunction/Traffic violation | 31.8%, 49.3%, 11.8%, 1.2%, 2.9%, 3% |
| Damage_Road_Type | Type of damage to accident surroundings | No damage/Flexible barrier/Fixed barrier/Road sign/Road surface/Light post | 75%, 18.4%, 2%, 2.5%, 0.6%, 1.5% |
| Consequence | What are the consequences of that accident? | Vehicle/Vehicles damage/Vehicle and infrastructure damage/Rollover/Run off the road/Animal runover/Human runover | 40.3%, 11.7%, 36.9%, 9.2%, 1.6%, 0.3% |
| XGBoost Hyperparameter Optimization | ||
|---|---|---|
| Parameter | Typical Value | Values |
| learning_rate | 0.01 to 0.2 | 0.05, 0.10, 0.15, 0.20, 0.25, 0.30 |
| max_depth | 3 to 10 | 3, 4, 5, 6, 8, 10, 12, 15 |
| min_child_weight | N/A | 1, 3, 5, 7 |
| gamma | N/A | 0.0, 0.1, 0.2, 0.3, 0.4 |
| n_estimators | N/A | 10, 50, 100, 150, 200, 250, 300 |
| colsample_bytree | 0.5–0.9 | 0.3, 0.4, 0.5, 0.7 |
| Random Forest Hyperparameter Optimization | ||
| max_depth | 3 to 10 | 3, 4, 5, 6, 8, 10, 12, 15 |
| min_samples_leaf | N/A | 1, 5, 10 |
| min_samples_split | 2, 4, 10, 12, 16 | |
| n_estimators | 10, 50, 100, 150, 200, 250, 300 | |
| criterion | Gini or Entropy | Gini or Entropy |
| Logistic Regression Hyperparameter Optimization | ||
| c_values | N/A | 100, 10, 1.0, 0.1, 0.01 |
| penalty | l1 and l2 | |
| solvers | Newton-cg, lbfgs, or liblinear | |
| Multi-Classes | |||||
|---|---|---|---|---|---|
| Classifier | Accuracy | Precision | Recall | F1-Score | AUC |
| XGBoost | 0.71 | 0.7 | 0.71 | 0.7 | 0.87 |
| Random Forest | 0.69 | 0.68 | 0.69 | 0.68 | 0.87 |
| Logistic Regression | 0.43 | 0.43 | 0.43 | 0.43 | 0.62 |
| Binary-Classes | |||||
|---|---|---|---|---|---|
| Classifier | Accuracy | Precision | Recall | F1-Score | AUC |
| XGBoost | 0.94 | 0.94 | 0.94 | 0.94 | 0.98 |
| Random Forest | 0.9 | 0.91 | 0.9 | 0.9 | 0.97 |
| Logistic Regression | 0.65 | 0.65 | 0.65 | 0.65 | 0.70 |
Disclaimer/Publisher’s Note: The statements, opinions and data contained in all publications are solely those of the individual author(s) and contributor(s) and not of MDPI and/or the editor(s). MDPI and/or the editor(s) disclaim responsibility for any injury to people or property resulting from any ideas, methods, instructions or products referred to in the content. |
© 2022 by the authors. Licensee MDPI, Basel, Switzerland. This article is an open access article distributed under the terms and conditions of the Creative Commons Attribution (CC BY) license (https://creativecommons.org/licenses/by/4.0/).
Share and Cite
Aldhari, I.; Almoshaogeh, M.; Jamal, A.; Alharbi, F.; Alinizzi, M.; Haider, H. Severity Prediction of Highway Crashes in Saudi Arabia Using Machine Learning Techniques. Appl. Sci. 2023, 13, 233. https://doi.org/10.3390/app13010233
Aldhari I, Almoshaogeh M, Jamal A, Alharbi F, Alinizzi M, Haider H. Severity Prediction of Highway Crashes in Saudi Arabia Using Machine Learning Techniques. Applied Sciences. 2023; 13(1):233. https://doi.org/10.3390/app13010233
Chicago/Turabian StyleAldhari, Ibrahim, Meshal Almoshaogeh, Arshad Jamal, Fawaz Alharbi, Majed Alinizzi, and Husnain Haider. 2023. "Severity Prediction of Highway Crashes in Saudi Arabia Using Machine Learning Techniques" Applied Sciences 13, no. 1: 233. https://doi.org/10.3390/app13010233
APA StyleAldhari, I., Almoshaogeh, M., Jamal, A., Alharbi, F., Alinizzi, M., & Haider, H. (2023). Severity Prediction of Highway Crashes in Saudi Arabia Using Machine Learning Techniques. Applied Sciences, 13(1), 233. https://doi.org/10.3390/app13010233