Article

Laboratory Investigations of Mold Growth on Transverse and Longitudinal Wood Surfaces

1
Department of Building Structures, Faculty of Civil Engineering, Czech Technical University in Prague, Thákurova 7, 166 29 Prague, Czech Republic
2
University Centre for Energy Efficient Buildings, Czech Technical University in Prague, Třinecká 1024, 273 43 Buštěhrad, Czech Republic
*
Author to whom correspondence should be addressed.
Appl. Sci. 2023, 13(1), 228; https://doi.org/10.3390/app13010228
Submission received: 26 October 2022 / Revised: 16 December 2022 / Accepted: 19 December 2022 / Published: 24 December 2022
(This article belongs to the Special Issue New Trends in Biosciences III)

Abstract

:

Featured Application

A better understanding of mold growth on wood and the parameters on which this growth depends will lead to improved calculation models for predicting mold occurrence in buildings and building components.

Abstract

The possible influence of anatomical sections of wood on mold growth was investigated by means of a laboratory experiment. The selected fungi, Aspergillus sp., Penicillium sp., and Alternaria sp. were inoculated by spraying on the surface of wood specimens prepared from pine (Pinus sylvestris) and spruce (Picea abies). The incubation was carried out under stable environmental conditions (temperature of 22 °C, relative humidity of 75, 87, and 95%) over three months. Mold growth was evaluated based on regular microscopic and macroscopic observations. The recorded mold coverage fractions and the qualitative indicators of mold development were later expressed by a dimensionless mold index. The differences in mold growth in the anatomical sections of wood were found to be relatively insignificant. In contrast, comparison of measured data with other experimental studies showed large differences, especially in the initial growth phase. The discrepancy is probably related to differences among the experimental protocols. It is concluded that laboratory mold growth studies would be improved if a common standardized methodology was developed and followed.

1. Introduction

Wood is a natural, renewable material that has been used in building structures for many centuries. The durability of wood is affected by a number of loads, e.g., weathering, chemicals, and biological agents. Wood can last for hundreds of years in dry conditions [1]. Under risky conditions of increased moisture, mold fungi are amongst the first colonizers of wood. Although molds do not cause significant structural damage to wood, they are a clear indicator showing that the moisture state of a wooden element is problematic.
The durability of wood products is an urgent issue for its future use as a competitive building material. The occurrence of molds on wooden building elements may increase in the future due to changing climatic conditions [2,3]. Faster drying methods, and the wrong use of wood in construction without regard to its natural durability limits, may also have an effect on mold growth on wooden elements.
The remediation of mold damage and the renovation of wooden elements is expensive and technically demanding, especially in the case of building structural elements (e.g., timber framing, roof trusses). For these reasons, the prevention of mold growth has economic benefits. Several mold growth prediction models [4,5,6,7] have been developed in the last decades to predict the risk of mold growth on wooden elements in buildings.
Whereas mold germination is solely related with relative humidity and temperature, mold growth depends on both environmental conditions and the availability of nutrients. The concentration of simple carbohydrates on the surface affects the growth rate of fungi [8]. The distribution of nutrients can be affected by processing wood prior to experiments [9,10].
The minimum relative humidity for mold growth on wood is between 75 and 80% [11]. In such environmental conditions, the time for the first signs of molds (microscopic observation) takes many weeks [12,13]. The growth rate decreases with the decrease in relative humidity [11,12,13,14,15,16]. The mold development also strongly depends on the duration of suitable exposure. If relative humidity fluctuates between favorable and unfavorable environmental conditions, mold development slows [4,9,17]. In stable conditions, the time required for the first visual occurrence of molds on pine and spruce sapwood at temperatures between 25 °C and 40 °C and relative humidity exceeding 95% is only a few days [18]. In addition to environmental conditions, wood species, surface quality and treatment, and differences between heartwood and sapwood, influence mold growth as well. For example, pine has been shown to be more susceptible to fungal growth than spruce [8] and the growth is faster on original kiln dried wood than on sawn wood [5]. Other influencing factors are felling time and the drying method [10].
This paper presents mold growth curves observed during a laboratory experiment on pine and spruce wood. The experiment was carried out under constant environmental conditions (temperature 22 °C; relative humidity 75, 87, and 95%). The wood specimens were prepared with respect to the structure of the wood to obtain specimens showing tangential, radial, and transversal surfaces. Mold growth was recorded over time on the basis of regular microscopic and macroscopic observations. The focus was primarily on three important characteristic times in mold development: the time of the first microscopic signs of the growth, the time of the first macroscopic signs of growth, and the time when the maximum coverage was achieved. When appropriate, mold decay was also quantitatively expressed. The differences between mold growth on anatomical sections, and the differences between the data obtained by the experiment performed and the mold growth data found in the literature are discussed.

2. Materials and Methods

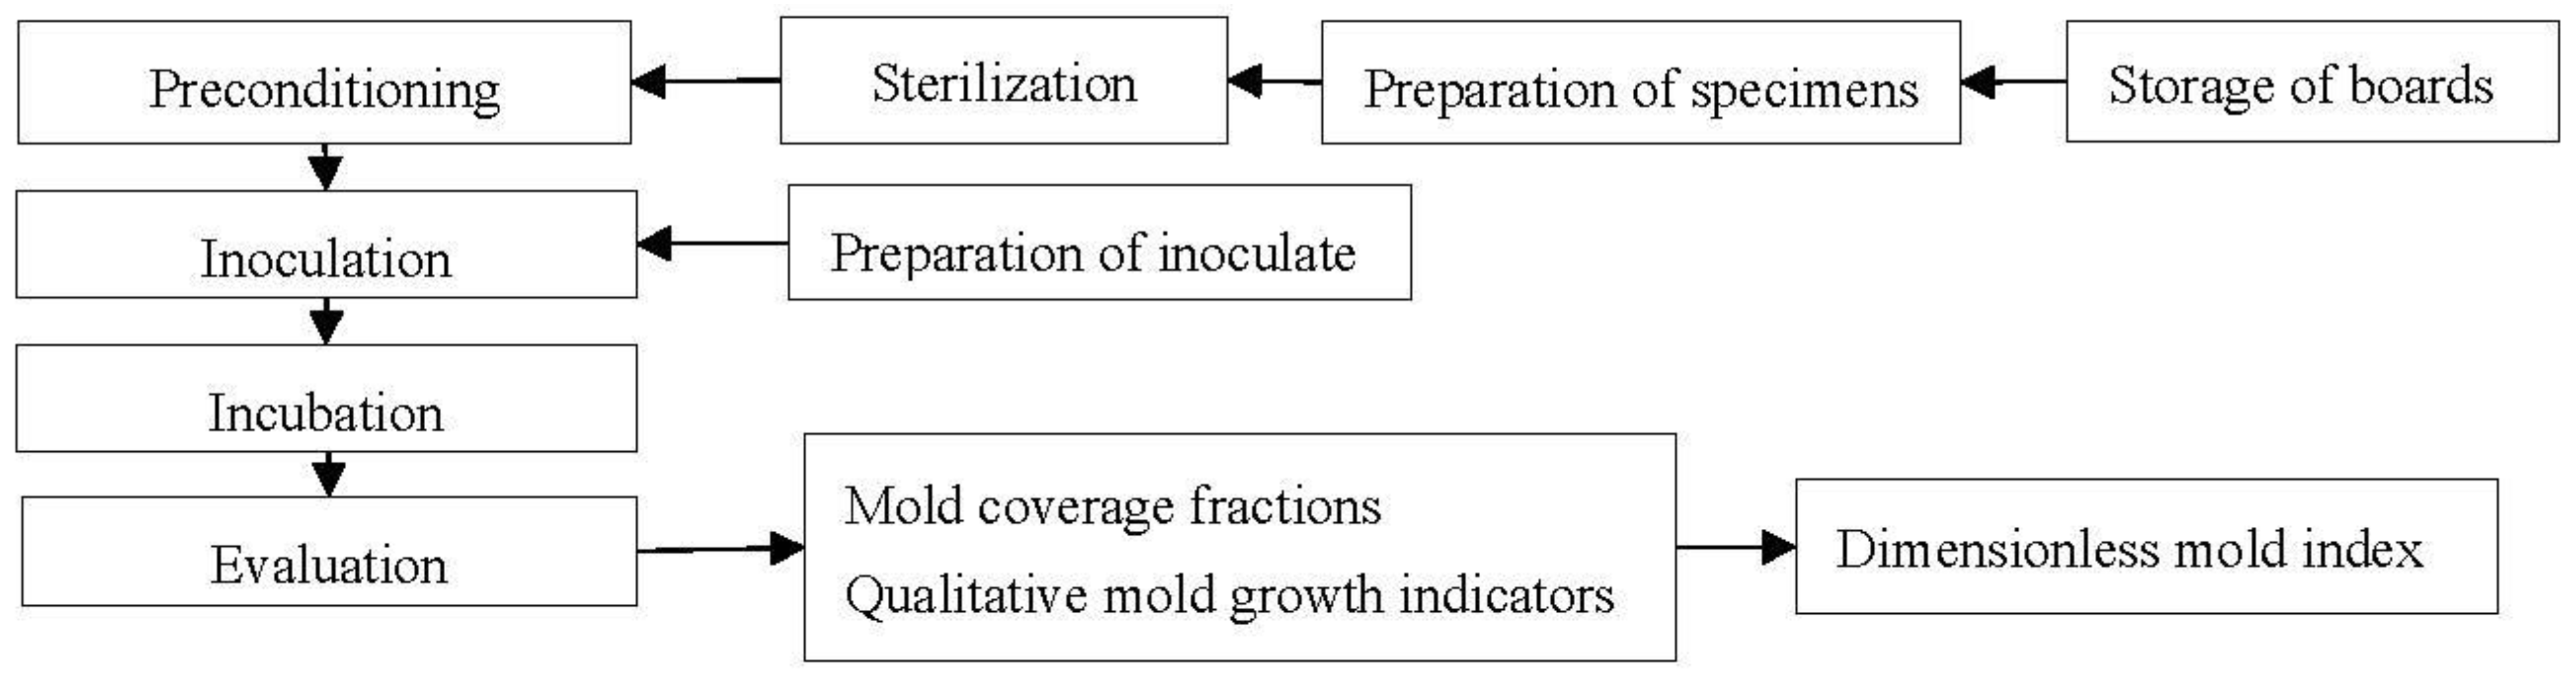
2.1. Experimental Procedure

The mold growth experiment procedure was similar to the procedure described in [11]. The experiment consisted of the preparation of the specimens, the preconditioning (equalization of the moisture), the preparation and application of the inoculate (inoculation), the incubation (the storage of specimens in defined stable environmental conditions, relative humidity 75, 87, and 95%), and the evaluation of mold growth. The scheme of the experimental procedure is shown in Figure 1.

2.2. Wood Specimens

The wood specimens were prepared from spruce (Picea abies (L.) H. Karst.) and pine (Pinus sylvestris L.). Spruce is the most common wood species used for construction of timber buildings in the Czech Republic. Pine is a standard wood species used for laboratory studies of mold growth [12,19].
The sapwood part of a single board was used (Figure 2). Heartwood was not used in the experiment. The pine sapwood is frequently used in mold growth laboratory studies due to high susceptibility to mold growth. The four-meter-long boards without any biocidal treatment were obtained in a commercial woodworking store in year 2017. The boards were cut from a single tree in the straight lower part of the trunk. The exact location in the Czech Republic where the tree grew is not known. The wood was free of defects (without blue stain fungi, knots, or resin). The wood was dried at a temperature lower than 60 °C. The dry bulk density was 387–454 kg/m3 (spruce) and 478–565 kg/m3 (pine). The variation of the dry bulk density for the wood specimens is expected to be lower due to the similar position at the trunk. The boards were stored under controlled environmental conditions (temperature of 20–25 °C, relative humidity of 50–60%).
The dimensions of the specimen were 20 mm × 20 mm × 3 mm. The wood specimens (P—pine, S—spruce) were cut with respect to main anatomical directions (Figure 2) to study mold growth on the tangential (T), radial (R), and transversal (X) surfaces. The inoculation and observations of mold growth were performed on the main surface of each specimen, i.e., on the square 20 mm × 20 mm (Table 1). The remaining sides of specimen were not sealed. These sides were not used for mold growth observations. Three specimens were prepared for each wood species and surface used in the experiment. Labelling of the specimens with respect to the anatomical surface and relative humidity is specified in Table 1.
The surface of the specimens was treated with a planer (Makita 2012NB) to unify the quality of the surface, except for the transversal surface. The tangential surfaces of the specimens were composed only of earlywood. The specimens were sterilized with UV radiation for 30 min on each side, to ensure that mold growth did not occur during the conditioning in the initial phase of the experiment.

2.3. Preparation of Inoculate

The inoculum was prepared from fungi genera that commonly occur in the Czech Republic and are reported to grow on wooden materials [20,21,22]. The following genera from the Czech Collection of Microorganisms held at the Faculty of Science at Masaryk University were selected: Aspergillus niger van Tieghem (CCM 8189), Penicillium cf. brevicompactum Dierckx (CCM 8288), Alternaria alternata (Fries: Fries) von Keissler (CCM F-397). The number in brackets is their access number.
Before inoculation, the fungi were revitalized at 25 ± 2 °C by growing on Czapek dox agar three consecutive times. The spores were collected from the last passage agar plate by the following procedure. The agar plate was covered with 1 mL of sterile saline buffer and the spores were released with a sterile glass loop. The solution, which consisted of spores and hyphae debris, was removed from the agar plate using a sterile pipet and filtered through sterile gauze with appropriate mesh size. The obtained spore solution was washed three times with saline buffer to remove contaminants from the agar plate. The solution for each genus was prepared separately. The concentration was determined in a Büchner chamber with a microscope (BA 410E Epi microscope, Motic) with a magnification of 10× to 40×. The concentration of spores in each solution was adjusted to 1 × 10⁸ CFU/mL (colony-forming units per milliliter). Subsequently, the inoculate was prepared from the adjusted single spore solutions by mixing in a 1:1:0.25 ratio with the least amount of Aspergillus sp.

2.4. Main Experiment

2.4.1. Preconditioning of Specimens

The relative humidity (RH) for the experiments was set in the range of 75 to 95%, which is commonly used for mold growth experiments [13,17,23]. The sterile wood specimens (by UV for 30 min to each site) were placed in sterile desiccators (sterilization by ethanol and UV for 30 min) with a relative humidity of 75%, 87% and 95% for 14 days to achieve the equilibrium moisture content. The relative humidity in the desiccators was prepared using saturated salt solutions (NaCl, Na2SO4, and KNO3).

2.4.2. Inoculation

The specimens with equilibrium moisture content were inoculated by spraying. The amount of inoculate was estimated separately on microscopic glass. The amount of inoculum was measured by weighing. Approximately 20 µL of inoculate was used for each specimen. In this case, it was assumed that the conversion of grams to milliliters was 1:1.

2.4.3. Incubation

The inoculated specimens were placed back in desiccators with a relative humidity of 75, 87 and 95%. The temperature was maintained at 22 °C ± 2 °C. The temperature and relative humidity (RH) were monitored by COMET dataloggers (accuracy, ±0.3 °C, ±2.5% RH).

2.4.4. Evaluation of Mold Growth
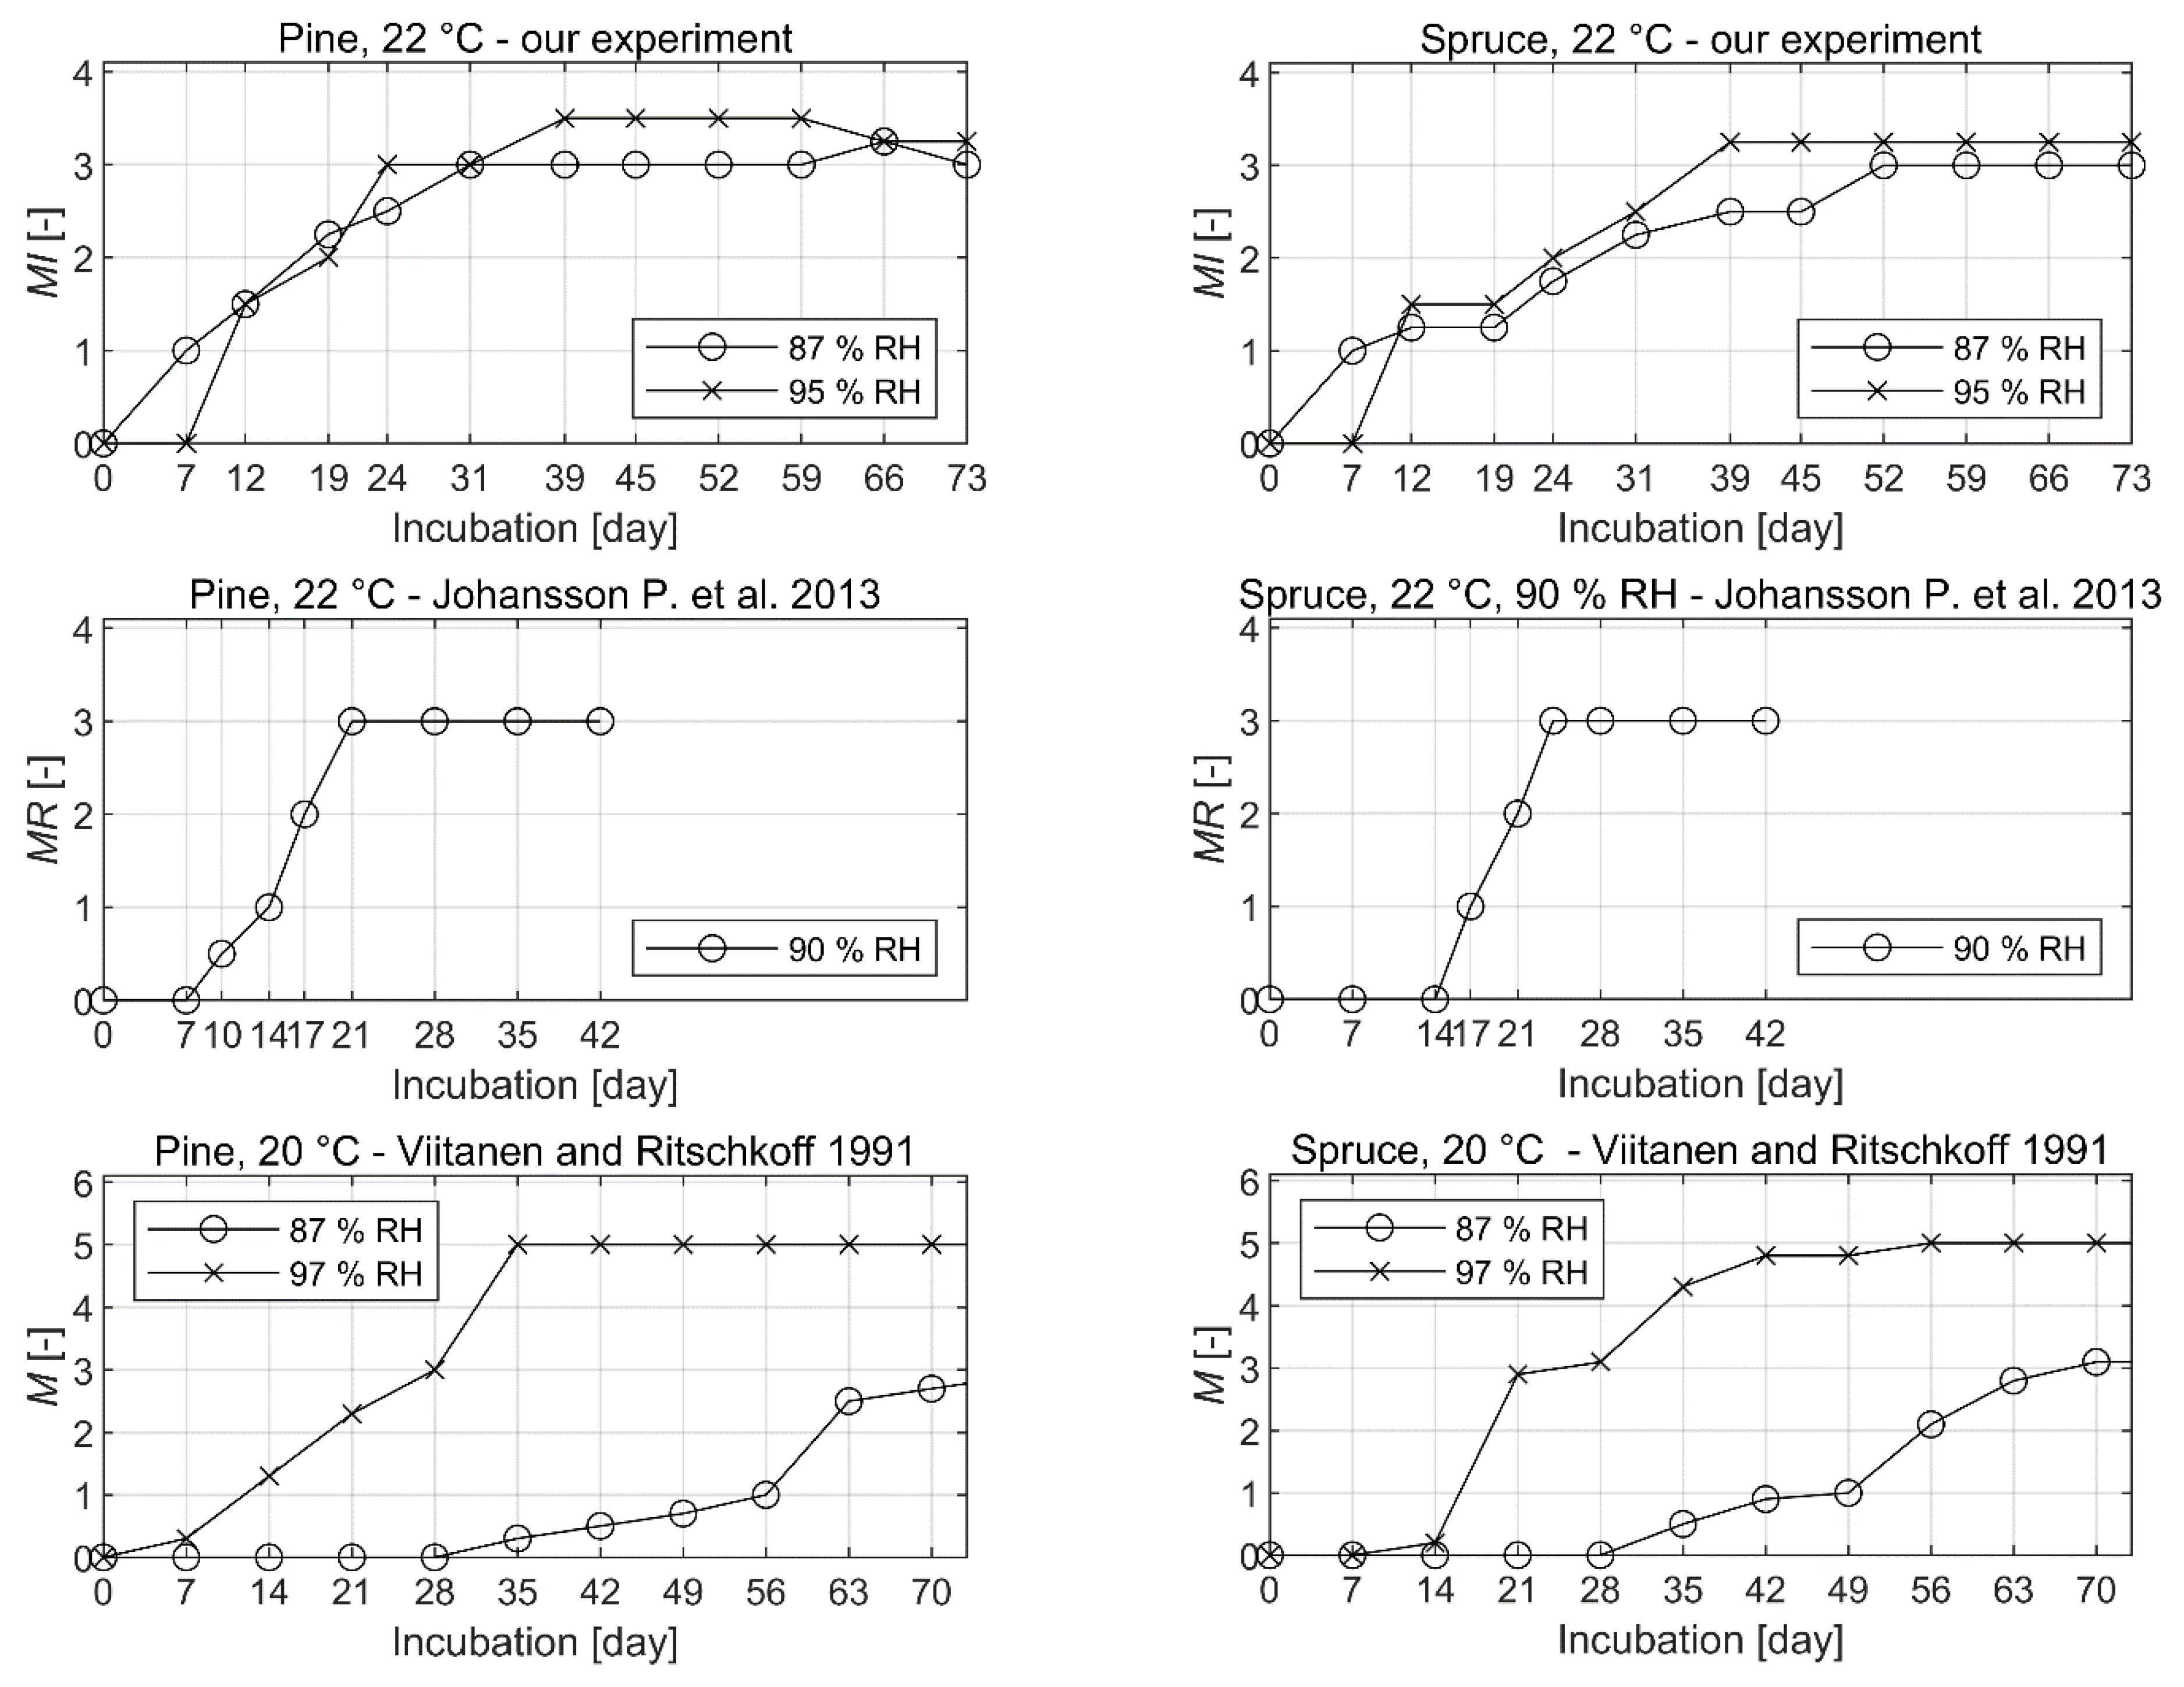
Mold growth was observed under a microscope (BA 410E Epi microscope, Motic) with a magnification of 40× and 100× (microscopic observation). Microscopic images were taken with the Promicam Pro 3-3CP camera attached to the microscope (10× magnification). Macroscopic images were taken with a Canon photo camera. The frequency of observation was three days at the beginning of the experiment. It was extended to seven days during the middle phase of the experiments, and 14 days at the end of the experiment. The duration of the experiment was three months.
Both quantitative and qualitative indicators that describe mold growth have been recorded, which were used for calculating mold index (MI). Microscopic coverage of the surface in % was estimated through microscopic observations (magnification 100×). The macroscopic coverage, starting from MI = 3, was estimated from photographs (magnification 10×). The presence (visibility) of hyphae and sporangia, and the quality of the sporangia were also noted. Hyphae, especially on the transversal surface, was difficult to observe.
The mold coverage and qualitative indicator were converted to the dimensionless5-degree scale mold index according to Table 2. The typical mold coverage fractions corresponding with degrees of mold index 1–4 are illustrated in Table 3 (selected photographs of pine specimens). The mold growth rating scale used in the experiment was similar to the median mold rating of Johansson et al. [11,12,24].
Since observation and evaluation of mold coverage fractions is subjective, the uncertainty of the mold index is expected to be ±0.5 points. The uncertainty on the time axis is expected to range from −2 to 0 days for the first microscopic signs and ±3 days for the first macroscopic signs.

3. Results

The development of the mold index over time is shown in Figure 3. The development of molds on pine and spruce specimens is also shown in photographs (Appendix A).
Mold growth occurred only in environments with 87% and 95% RH, respectively. The dominant mold throughout the experiment was Aspergillus niger. Penicillium brevicompactum. showed only minor growth. Alternaria alternata was not observed until the end of the experiment. Mold growth did not occur at 75% RH.
Table 4 summarizes the characteristic times in mold growth on the test specimens. The first microscopic signs of molds were observable between days 7 and 12, except for transversal surface of spruce specimens (SX), which did not show signs until day 19. Germination appeared to be slightly faster on pine and at 87% RH. The first macroscopic growth was observed between days 19 and 52, with the fastest growth always on specimens with tangential surfaces (PT and ST). In many cases, it was also the time at which the maximum mold index was reached. Spruce specimens achieved lower maximum mold index than pine specimens. Mold decay characterized by sporangium disintegration was observed on pine specimens (with the exception of PT-87 and PT-95). The decay was not observed on spruce specimens.

4. Discussion

4.1. The Experimental Results

The experimental results showed that a relative humidity of 75% is too low for mold growth on solid wood. This is consistent with previous findings [11,13,15,19]. The genera Penicillium spp. and Aspergillus spp. grew at relative humidity of 87 and 95%. The growth of Alternaria alternata was not observed at a relative humidity of 87%, and surprisingly not even at 95%, although the minimum relative humidity to initiate its growth on wood is reported between 85 and 89% [15]. This genus is commonly found on plants, but also colonizes building materials, including wood [14,20,21,25]. Nielsen [14] reported that the relative humidity required for the growth of Alternaria spp. on woodchip wallpaper is greater than 90%. We interpret that Alternaria alternata does not grow on a clean and planed surface of wood. The explanation may be that this genus requires an additional source of nutrients, for example, in the form of dust.
With respect to the main anatomical surfaces of the wood, two patterns were noticed in the mold growth curves. The maximum delay in mold growth was found on the transversal surface of spruce specimens. The shortest time of reaching the maximum mold index was found for the tangential surface of both species. With respect to the latter, a possible explanation might be that the tangential surfaces were almost purely composed of earlywood. On the other hand, the explanation could also be that mold growth on tangential surface is easier to observe in a microscope due to the flat surface without tree rings. It should be stressed that both mentioned trends are not very apparent and should be interpreted with care due to high uncertainty of characteristic times (due to the low frequency of observation and somewhat limited number of test specimens).

4.2. Comparison to Other Mold Growth Studies

There is only a limited number of laboratory studies that present mold growth curves for spruce and pine wood. The data of Johansson et al. [12] and Viitanen and Ritschkoff [19] were selected due to the similarity of environmental conditions and the surface quality (planed surface). The data are compared with the mold growth curves obtained in the experiment (Figure 4). The mold growth curves for the experiment are presented as averages of the growth curves for the tangential and radial surfaces. In this regard, it was assumed that the other studies used specimens with general longitudinal sections not distinguishing between tangential and radial surfaces.
The definition of mold growth metrics differs among authors. Johansson et al. use a 5-degree scale denoted as MR. Viitanen and Ritschkoff use a 7-degree scale denoted as M. Therefore, only the characteristic times in mold development can be compared. The characteristic times from our experiment agree with those of Johansson et al., although there are some differences in the times for the first microscopic signs. The discrepancy might be related to some extent to differences in the definition of mold indexes.
Contrary to Johansson’s results, Viitanen and Ritschkoff show, at 87% RH, a much longer time needed to reach the first microscopic and macroscopic signs of molds. In this case, mold growth is delayed by approximately four weeks, similarly for pine and spruce. On the other hand, Viitanen’s characteristic times at 97% RH agree with mold growth observed at 95% RH. In our experiment, mold growth curves were similar for the relative humidity 87 and 95%. This does not correspond to much larger differences in mold growth curves between 87 and 97% RH that appear in Viitanen and Ritschkoff’s work.
Since fungal growth is a very complex microbiological process that can be influenced by even small changes in experimental procedures, explaining differences amongst experiments is not straightforward. The discrepancy between experiments may be related to differences amongst experimental protocols to some extent. Since the time shift between mold growth curves was especially noticed, the selection of mold species, their quality and quantity, absence of hyphae in the suspension, physiological state of spores, the method of application of inoculum, sterilization prior inoculation, etc., are aspects which should be carefully assessed. These potential factors are discussed by Veerecken et al. [26].
Currently, several standardized laboratory methods are available to obtain the resistance of a material against molds or critical relative humidity for mold growth. Some of the existing experimental methods were briefly compared in [27,28]. Imken et al. [29] compared two existing methods by testing wood and wood-based materials. The correlation of mold growth results between methods was poor. They concluded that the experimental setup could have an effect on mold resistance tests to a large extent. To our best knowledge, a common standard method for assessing the dynamics of mold growth on wood is not yet established.

5. Conclusions

The development of mold growth on the surface of wood specimens was regularly observed by means of microscopic and macroscopic observations. The mold growth data obtained in the experiment were compared with two mold growth experimental datasets found in the scientific literature. Significant differences between the data were observed. In particular, a large time shift between published mold growth curves has been found. The following conclusions can be drawn from our study:
  • The differences of mold growth between anatomical sections were relatively small and are not considered to be significant.
  • The time shift between mold growth curves was observed between the experiment performed and the published mold growth experiments. It is believed that the discrepancy is to some extent related to differences among experimental protocols. Scientific mold growth studies would be improved if a common standardized methodology were to be developed and followed.

Author Contributions

Conceptualization, P.R., P.K. and K.S.; methodology, P.R., P.K. and K.S.; formal analysis, P.R. and P.K.; investigation, P.R.; resources, J.R.; data curation, P.R. and P.K.; writing—original draft preparation, P.R. and P.K.; writing—review and editing, P.K., K.S. and J.R.; visualization, P.R. and P.K.; supervision, J.T.; project administration, P.R.; funding acquisition, P.R., P.K. and J.T. All authors have read and agreed to the published version of the manuscript.

Funding

This research has received funding from the Czech Science Foundation (GAČR), grant number 20-12941S.

Institutional Review Board Statement

Not applicable.

Informed Consent Statement

Not applicable.

Data Availability Statement

We have published all the data in the article.

Acknowledgments

The authors are grateful to laboratory technicians Ivana Loušová and Petra Schůtová for their contribution to the project.

Conflicts of Interest

The authors declare no conflict of interest.

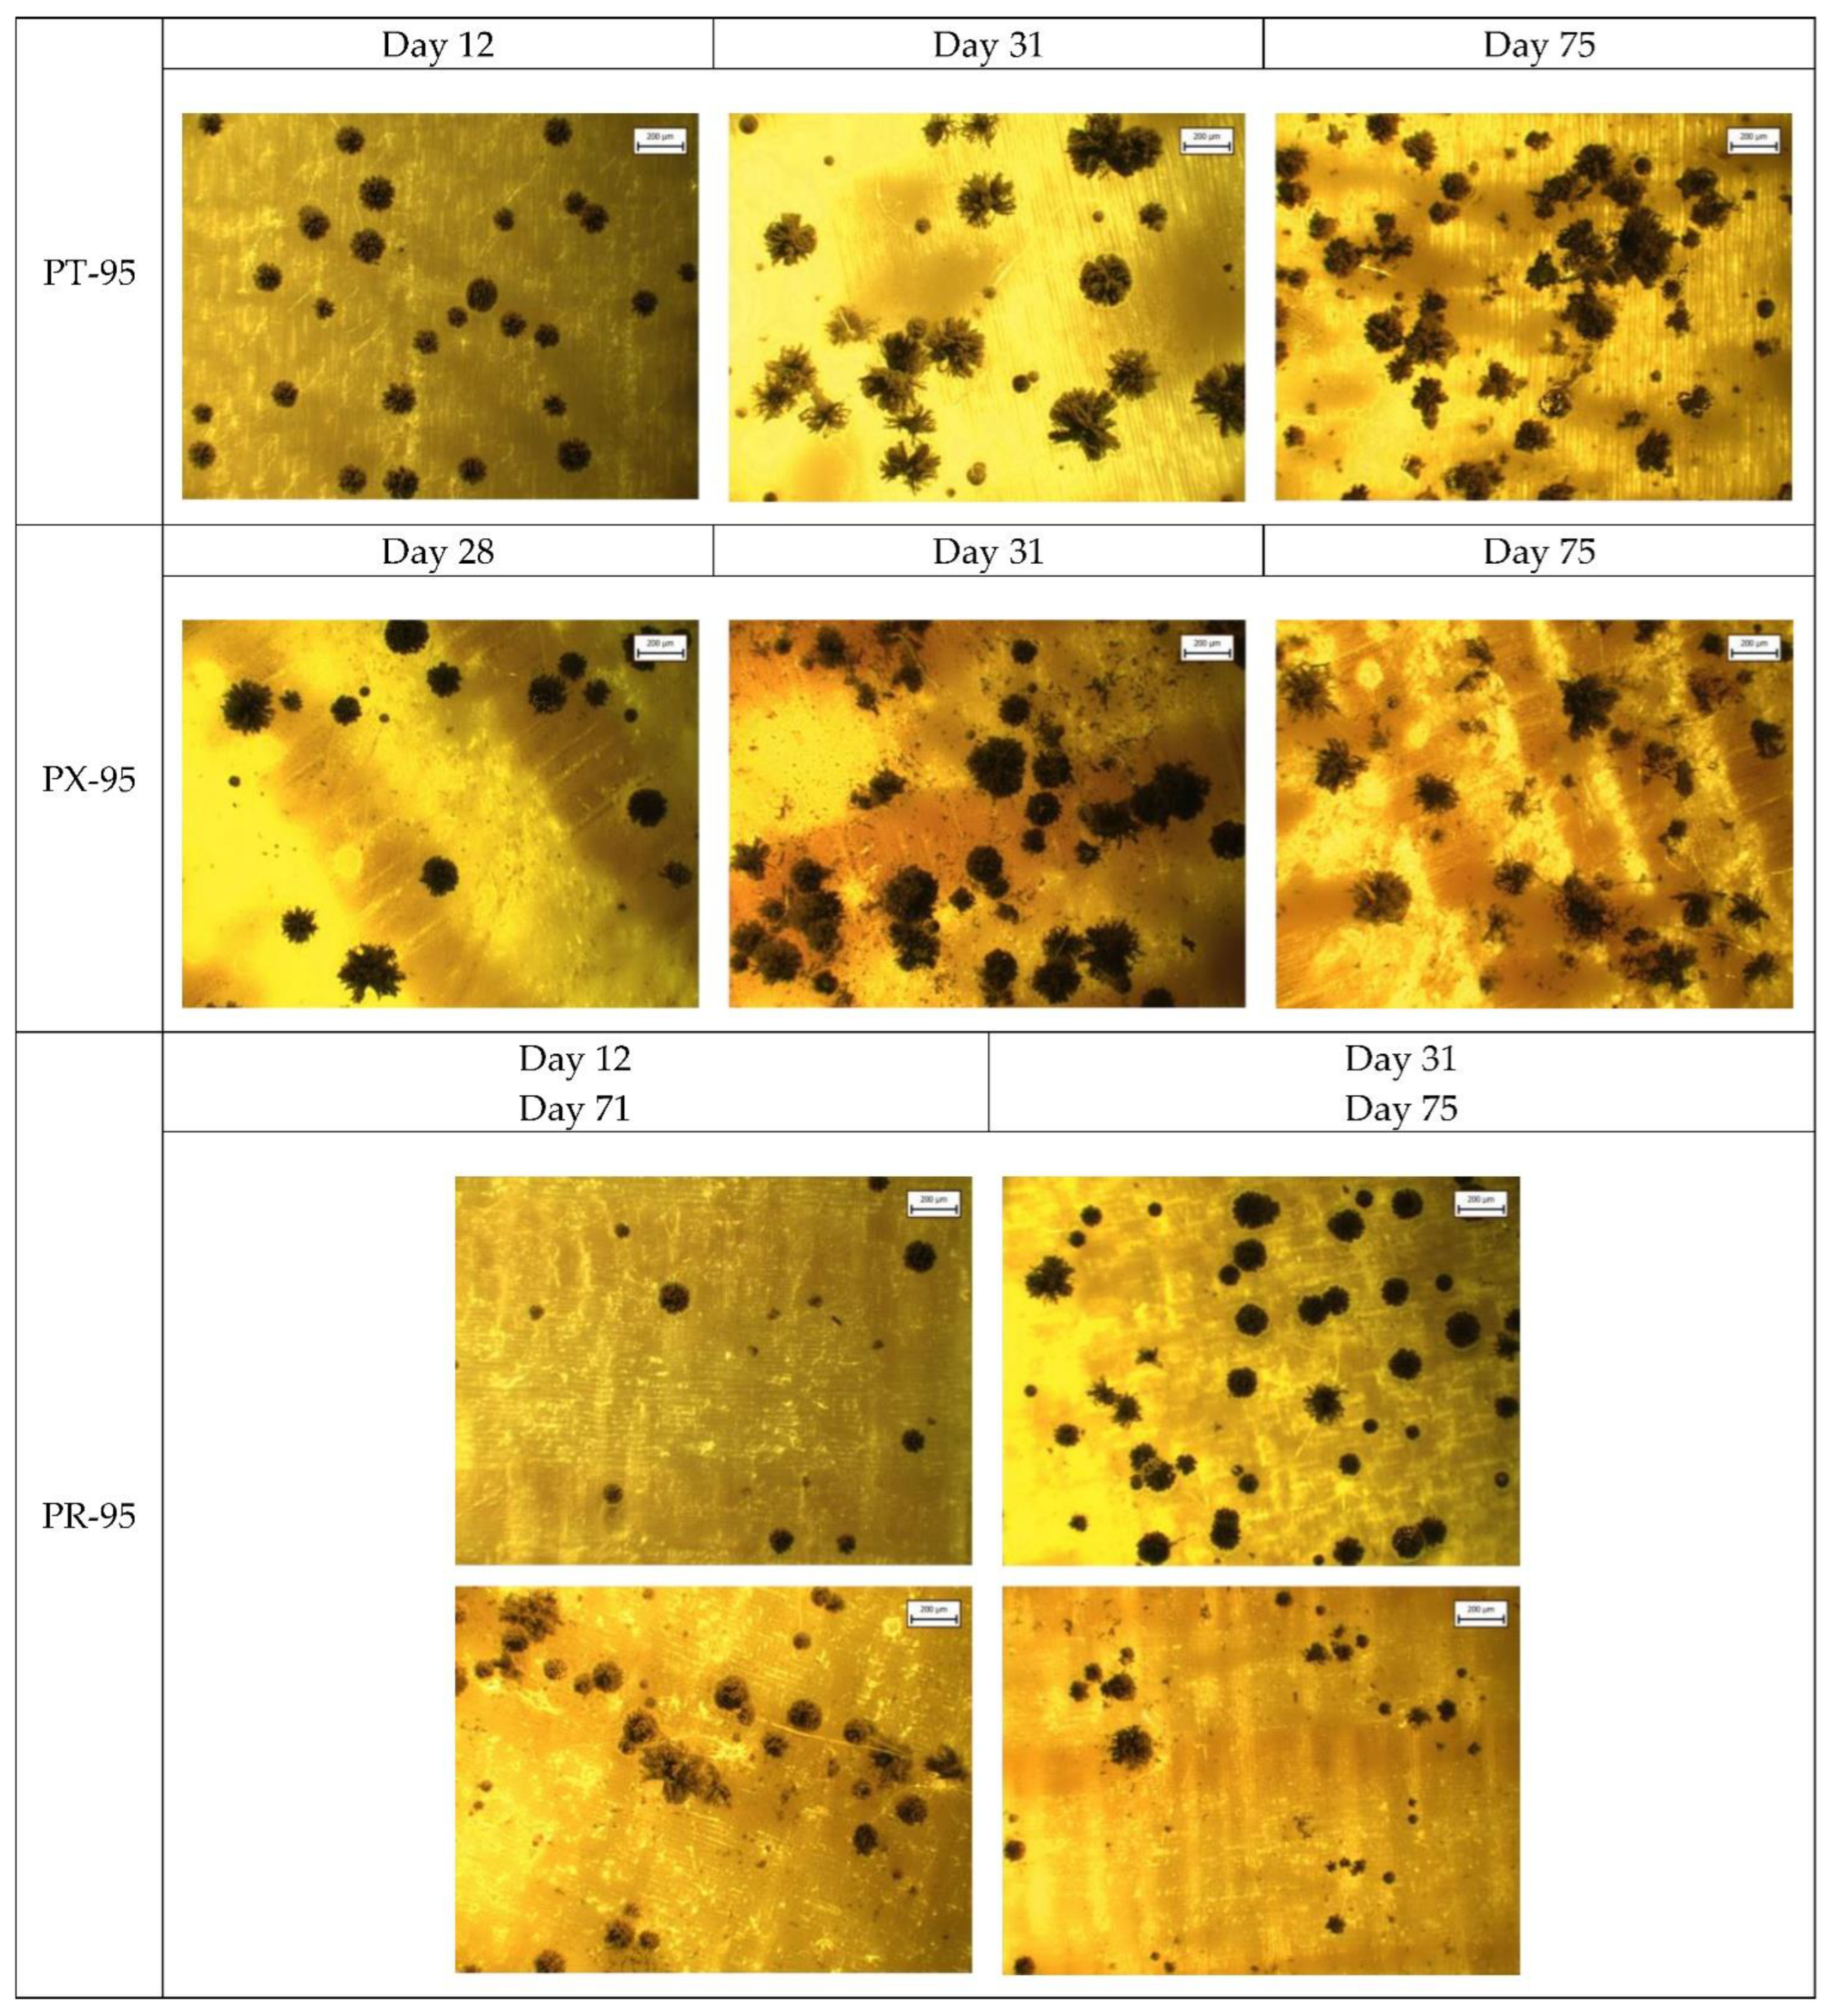
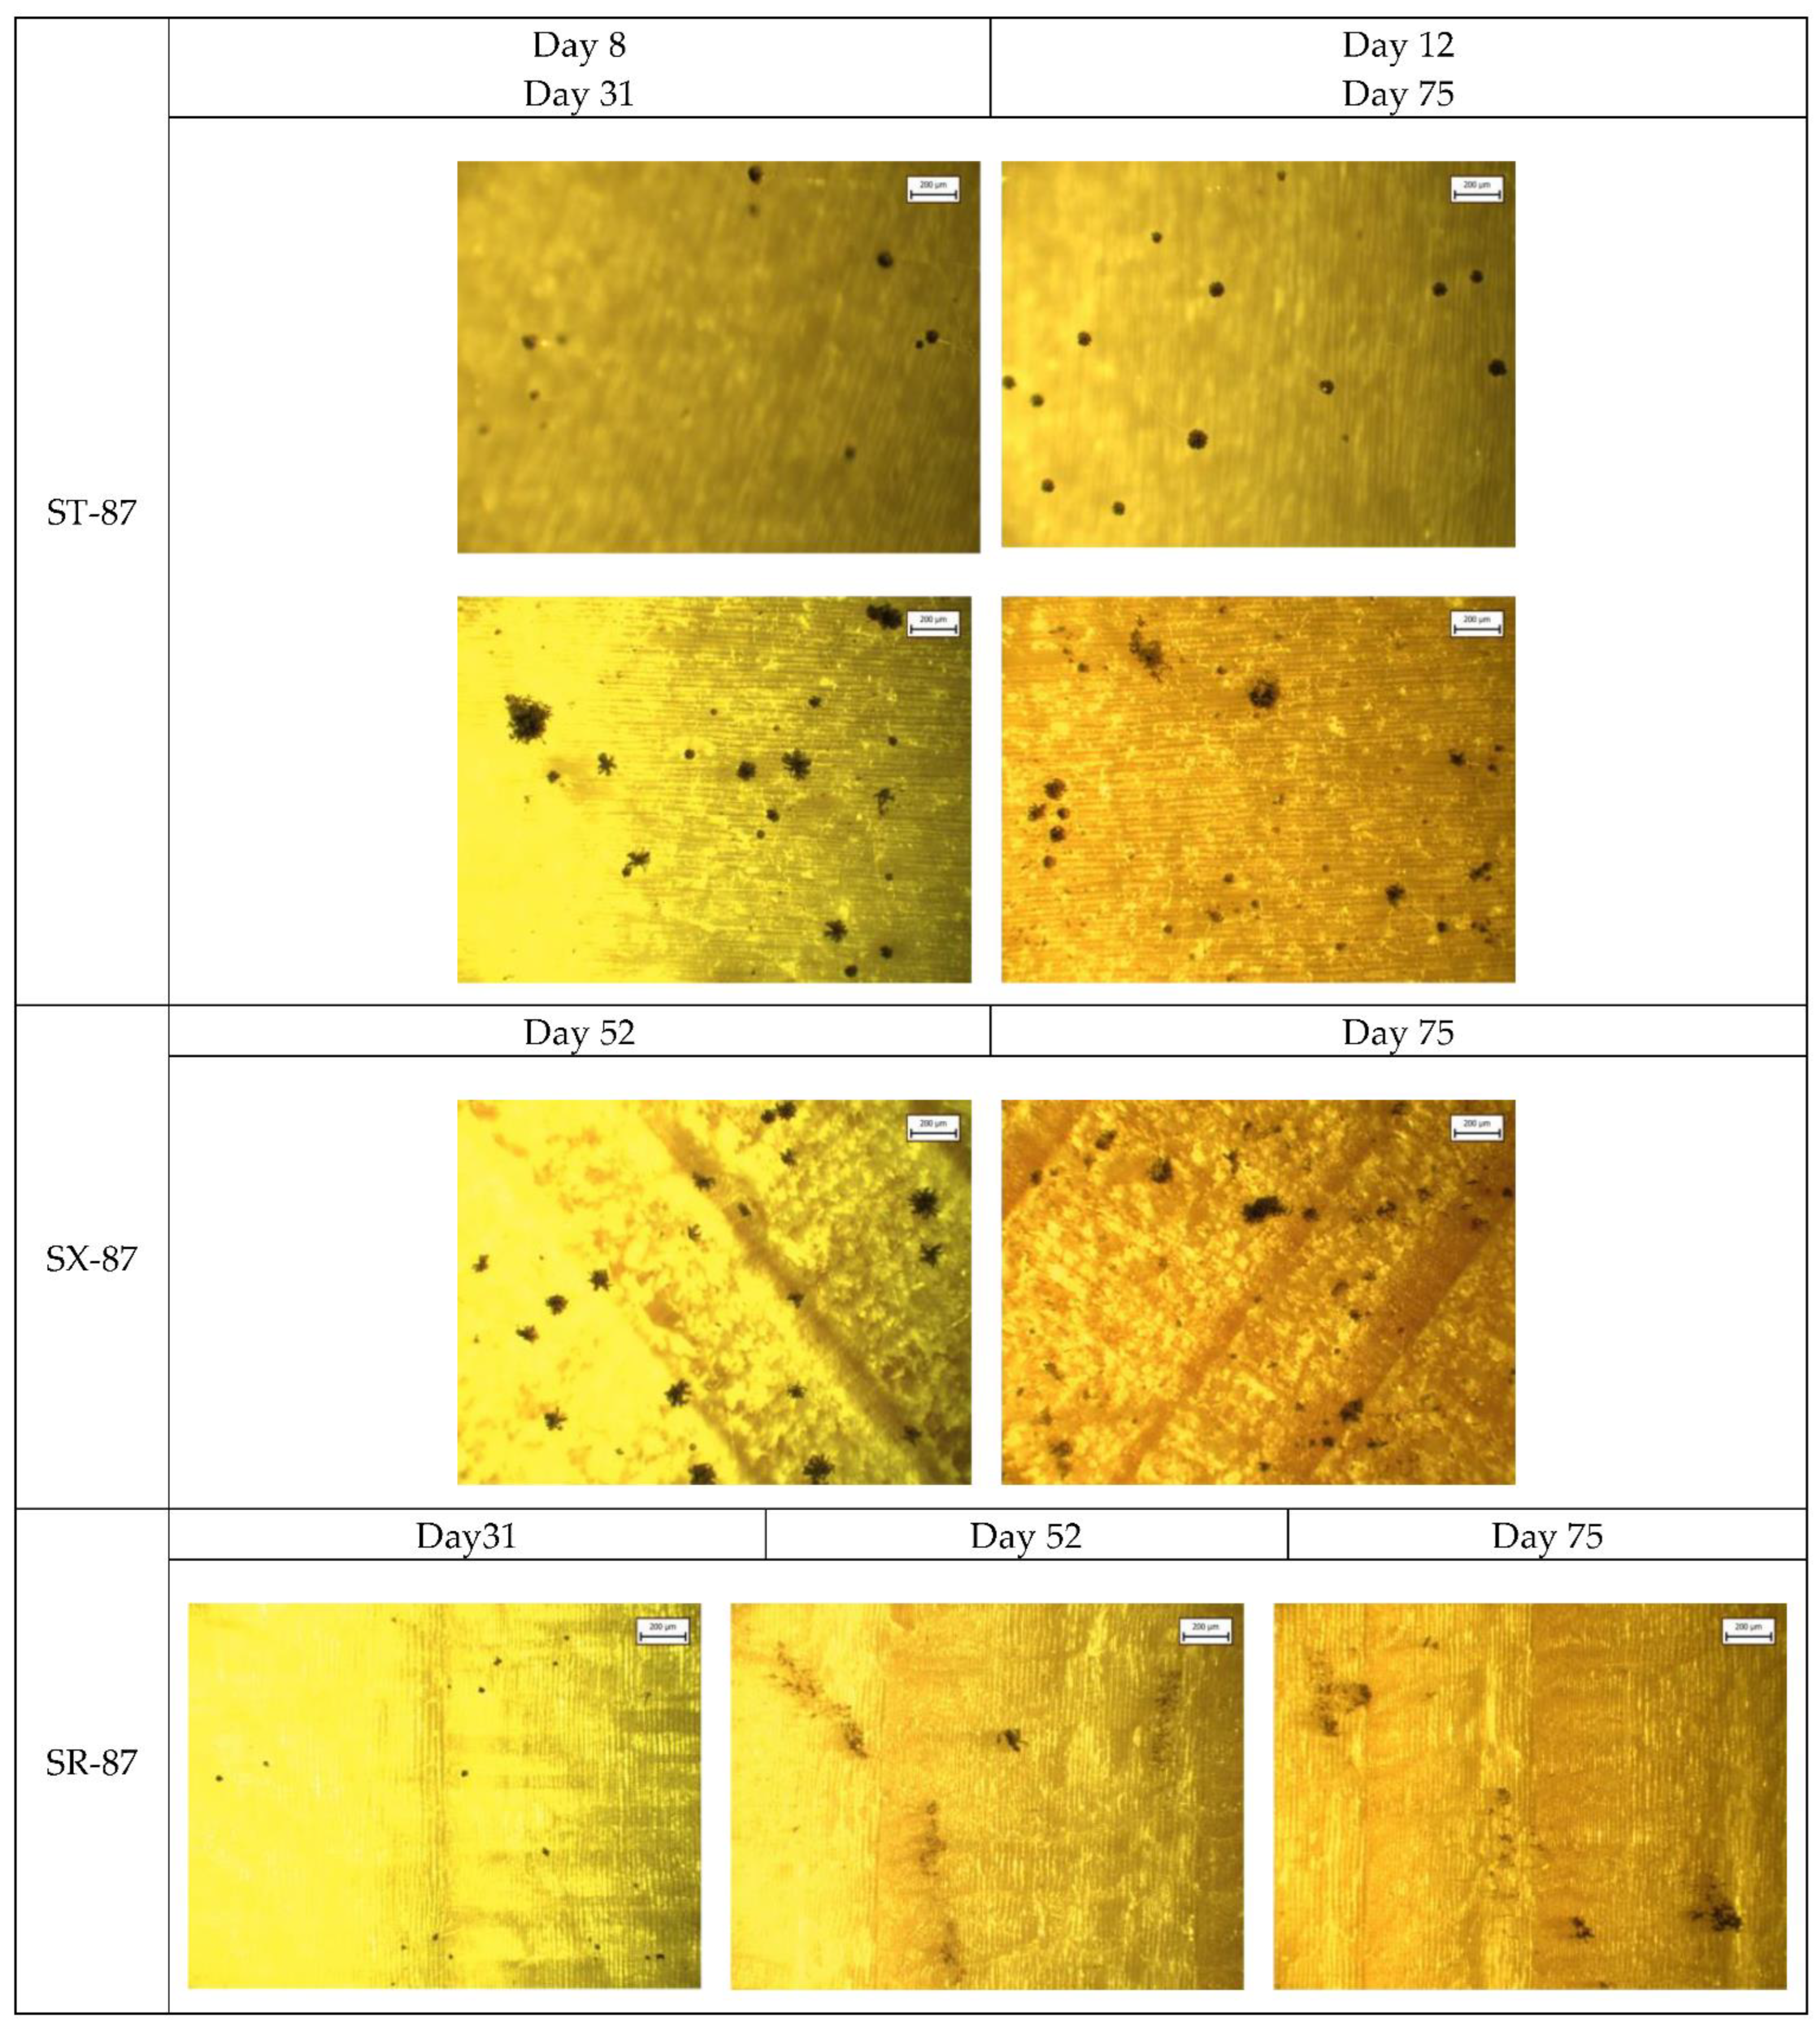
Appendix A. Selected Microscopic Images

Figure A1. Selected microscopic images for subsets PT-87, PX-87, PR-87 (bar is 200 μm).
Applsci 13 00228 g0a1
Figure A2. Selected microscopic images for subsets PT-95, PX-95, PR-95 (bar is 200 μm).
Applsci 13 00228 g0a2
Figure A3. Selected microscopic images for subsets ST-87, SX-87, SR-87 (bar is 200 μm).
Applsci 13 00228 g0a3
Figure A4. Selected microscopic images for subsets ST-95, SX-95, SR-95 (bar is 200 μm).
Applsci 13 00228 g0a4

References

  1. Koziróg, A.; Otlewska, A.; Piotrowska, M.; Rajkowska, K.; Nowicka-Krawczyk, P.; Hachułka, M.; Wolski, G.J.; Gutarowska, B.; Kunicka-Styczyńska, A.; Libudzisz, Z.; et al. Colonising organisms as a biodegradation factor affecting historical wood materials at the former concentration camp of Auschwitz II-Birkenau. Int. Biodeterior. Biodegrad. 2014, 86, 171–178. [Google Scholar] [CrossRef]
  2. Choidis, P.; Kraniotis, D.; Lehtonen, I.; Hellum, B. A Modelling Approach for the Assessment of Climate Change Impact on the Fungal Colonization of Historic Timber Structures. Forests 2021, 12, 819. [Google Scholar] [CrossRef]
  3. Ingebretsen, S.B.; Andenæs, E.; Gullbrekken, L.; Kvande, T. Microclimate and Mould Growth Potential of Air Cavities in Ventilated Wooden Façade and Roof Systems—Case Studies from Norway. Buildings 2022, 12, 1739. [Google Scholar] [CrossRef]
  4. Isaksson, T.; Thelandersson, S.; Ekstrand-Tobin, A.; Johansson, P. Critical conditions for onset of mould growth under varying climate conditions. Build. Environ. 2010, 45, 1712–1721. [Google Scholar] [CrossRef]
  5. Hukka, A.; Viitanen, H.A. A mathematical model of mould growth on wooden material. Wood Sci. Technol. 1999, 33, 475–485. [Google Scholar] [CrossRef]
  6. Gradeci, K.; Labonnote, N.; Time, B.; Köhler, J. Mould growth criteria and design avoidance approaches in wood-based materials—A systematic review. Constr. Build. Mater. 2017, 150, 77–88. [Google Scholar] [CrossRef]
  7. Vereecken, E.; Roels, S. Review of mould prediction models and their influence on mould risk evaluation. Build. Environ. 2012, 51, 296–310. [Google Scholar] [CrossRef] [Green Version]
  8. Feng, J.; Li, C.; Chen, J.; Chen, M.; Shu, X.; Shi, Q. Evaluation of the association between natural mold resistance and chemical components of nine wood species. BioResources 2018, 13, 6524–6541. [Google Scholar] [CrossRef]
  9. Sehlstedt-Persson, M.; Karlsson, O.; Wamming, T.; Morén, T. Mold Growth on Sapwood Boards Exposed Outdoors: The Impact of Wood Drying. For. Prod. J. 2011, 61, 170–179. [Google Scholar] [CrossRef]
  10. Terziev, N.; Boutelje, J. Effect of Felling Time and Kiln-Drying on Color and Susceptibility of Wood to Mold and Fungal Stain During an Above-Ground Field Test. Wood Fiber Sci. 1998, 4, 360–367. [Google Scholar]
  11. Johansson, P.; Ekstrand-Tobin, A.; Svensson, T.; Bok, G. Laboratory study to determine the critical moisture level for mould growth on building materials. Int. Biodeterior. Biodegrad. 2012, 73, 23–32. [Google Scholar] [CrossRef]
  12. Johansson, P.; Bok, G.; Ekstrand-Tobin, A. The effect of cyclic moisture and temperature on mould growth on wood compared to steady state conditions. Build. Environ. 2013, 65, 178–184. [Google Scholar] [CrossRef]
  13. Viitanen, H.; Salonvaara, M. Moisture Conditions and Biodeterioration Risk Of Building Materials and Structure. Indoor Air no. Figure 1. 2015, pp. 1001–1006. Available online: https://www.irbnet.de/daten/iconda/CIB5413.pdf (accessed on 15 April 2018).
  14. Nielsen, K.F. Mould Growth on Building Materials. Ph.D. Thesis, Technical University of Denmark, Lyngby, Denmark, 2002. Available online: https://backend.orbit.dtu.dk/ws/portalfiles/portal/2988232/phd-kfn.pdf (accessed on 15 April 2018).
  15. Nielsen, K.; Holm, G.; Uttrup, L.; Nielsen, P. Mould growth on building materials under low water activities. Influence of humidity and temperature on fungal growth and secondary metabolism. Int. Biodeterior. Biodegrad. 2004, 54, 325–336. [Google Scholar] [CrossRef]
  16. Segers, F.J.J.; van Laarhoven, K.A.; Huinink, H.P.; Adan, O.C.G.; Wösten, H.A.B.; Dijksterhuis, J. The Indoor Fungus Cladosporium halotolerans Survives Humidity Dynamics Markedly Better than Aspergillus niger and Penicillium rubens despite Less Growth at Lowered Steady-State Water Activity. Appl. Environ. Microbiol. 2016, 82, 5089–5098. [Google Scholar] [CrossRef] [Green Version]
  17. Viitanen, H.A. Modelling the Time Factor in the Development of Mould Fungi—The Effect of Critical Humidity and Temperature Conditions on Pine and Spruce Sapwood. Holzforschung 1997, 51, 6–14. [Google Scholar] [CrossRef]
  18. Johansson, P.; Mjörnell, K.; Arfvidsson, J. Examples of characteristics of wood that affect mould growth: A meta-analysis. Eur. J. Wood Wood. Prod. 2016, 75, 603–613. [Google Scholar] [CrossRef]
  19. Viitanen, H.; Ritschkoff, A.-C. Mould Growth on Pine and Spruce Sapwood in Relation to Air Humidity and Temperature; Rapport nr. 221; Swedish University of Agricultural Sciences: Uppsala, Sweden, 1991. [Google Scholar]
  20. Gobakken, L.R.; Høibø, O.A.; Solheim, H. Mould growth on paints with different surface structures when applied on wooden claddings exposed outdoors. Int. Biodeterior. Biodegrad. 2010, 64, 339–345. [Google Scholar] [CrossRef]
  21. Lee, Y.M.; Lee, H.; Jang, Y.; Cho, Y.; Kim, G.-H.; Kim, J.-J. Phylogenetic analysis of major molds inhabiting woods. Part 4. Genus Alternaria. Holzforschung 2014, 68, 247–251. [Google Scholar] [CrossRef]
  22. Ryparová, P.; Rácová, Z. The Occurrence of Mold in Construction Materials before Inbuilt into New Building and Protection against this Type of Biodegradation. Key Eng. Mater. 2016, 714, 44–50. [Google Scholar] [CrossRef]
  23. Viitanen, H. Factors affecting the development of biodeterioration in wooden constructions. Mater. Struct. 1994, 27, 483–493. [Google Scholar] [CrossRef]
  24. Johansson, P.; Lång, L.; Capener, C.-M. How well do mould models predict mould growth in buildings, considering the end-user perspective? J. Build. Eng. 2021, 40, 102301. [Google Scholar] [CrossRef]
  25. Yang, D.-Q. Isolation of wood-inhabiting fungi from Canadian hardwood logs. Can. J. Microbiol. 2005, 51, 1–6. [Google Scholar] [CrossRef] [PubMed]
  26. Vereecken, E.; Vanoirbeek, K.; Roels, S. Towards a more thoughtful use of mould prediction models: A critical view on experimental mould growth research. J. Build. Phys. 2015, 39, 102–123. [Google Scholar] [CrossRef]
  27. Adan, O. On the Fungal Defacement of Interior Finishes. Ph.D. Thesis, University of Eindhoven, Eindhoven, The Netherlands, 1994. [Google Scholar]
  28. Johansson, P. Determination of the Critical Moisture Level for Mould Growth on Building Materials. Ph.D. Thesis, Lund University, Lund, Sweden, 2014. [Google Scholar]
  29. Imken, A.A.; Brischke, C.; Kögel, S.; Krause, K.C.; Mai, C. Resistance of different wood-based materials against mould fungi: A comparison of methods. Eur. J. Wood Wood Prod. 2020, 78, 661–671. [Google Scholar] [CrossRef]
Figure 1. Scheme of the mold growth experiment.
Applsci 13 00228 g001
Figure 2. Boards used for the preparation of wood specimens. Spruce board is located on the top, pine board on the bottom. Red dashed lines separate heartwood and sapwood.
Applsci 13 00228 g002
Figure 3. Mold index MI (defined according to Table 2) over time for all wood specimens tested. The mold growth curves are presented as the average for each subset of specimens.
Applsci 13 00228 g003
Figure 4. Comparison of experimental mold growth curves (our experiment—mean mold growth curves calculated from specimens with radial and tangential surfaces, data of Johansson et al. 2013 [12], data of Viitanen and Ritschkoff 1991 [19]. The time for the first microscopic signs of molds corresponds to MR = 1 and M = 1. The time for the first macroscopic signs of molds corresponds to MR = 3 and M = 3.
Applsci 13 00228 g004
Table 1. Labelling of wood specimens—view from top on the main square surface of wood specimens.
Tangential Surface (T)Radial Surface (R)Transversal Surface (X)
Pine (P)Spruce (S)Pine (P)Spruce (S)Pine (P)Spruce (S)
Applsci 13 00228 i001Applsci 13 00228 i002Applsci 13 00228 i003
PT-75ST-75PR-75SR-75PX-75SX-75
PT-87ST-87PR-87SR-87PX-87SX-87
PT-95ST-95PR-95SR-95PX-95SX-95
Table 2. Definition of mold growth rating scale.
Mold
Index [-]
SubindexObservation and Coverage [%]Description
0 MicroMacroNo mold growth is present.
11.0<10%0%Sparsely distributed sporangia, hyphae difficult to observe.
1.510–30%
2>30%>0%Sporangia and hyphae observable.
33.0100%<30%Full microscopic coverage, the first macroscopic signs.
3.530–70%
4>70%Macroscopic coverage is substantial.
Table 3. The scale of mold index and subindex (according to Table 2) exemplified by microscopic and macroscopic photographs.
MicroscopicMI = 1MI = 1.5MI = 2
Applsci 13 00228 i004Applsci 13 00228 i005Applsci 13 00228 i006
MI = 3MI = 3.5MI = 4
Applsci 13 00228 i007Applsci 13 00228 i008Applsci 13 00228 i009
MacroscopicMI = 3MI = 3.5MI = 4
Applsci 13 00228 i010Applsci 13 00228 i011Applsci 13 00228 i012
Table 4. Characteristic times in mold growth on test specimens. The values are expressed in days and represent: MI = 1, the time of the first microscopic signs of the growth; MI = 3, the time of the first macroscopic signs of growth; Max MI, the time when the mold index was achieved and its value in brackets; Decay, the time when the decay of sporangium maximum was first observed.
SpeciesPineSpruce
RH [%]87958795
SpecimensPT-87PX-87PR-87PT-95PX-95PR-95ST-87SX-87SR-87ST-95SX-95SR-95
MI = 1 [day]777127127197121912
MI = 3 [day]242431193124315252243139
Max MI [day]
(MI value)]
66
(4)
45
(3)
31
(3)
39
(4)
39
(4)
24
(3)
31
(3)
52
(3)
52
(3)
24
(3)
31
(3)
39
(3.5)
Decay [day]-5966-6666------
Disclaimer/Publisher’s Note: The statements, opinions and data contained in all publications are solely those of the individual author(s) and contributor(s) and not of MDPI and/or the editor(s). MDPI and/or the editor(s) disclaim responsibility for any injury to people or property resulting from any ideas, methods, instructions or products referred to in the content.

