Article

Experimental Research on Unit Operation for Fruit Crops’ Bones Calibration

1
Department of Engineering Mechanics and Computer-Aided Design, Dmytriy Motornyi Tavria State Agrotechnological University, 72310 Melitopol, Ukraine
2
Department of Electrical Engineering and Electromechanics Named after Prof. V.V. Ovharov, Dmytriy Motornyi Tavria State Agrotechnological University, 72310 Melitopol, Ukraine
3
Department of Electricity Supply and Energy Management, State Biotechnological University, 61052 Kharkiv, Ukraine
4
Department of Entrepreneurship and Marketing, Institute of Economics and Management, Ivano-Frankivsk National Technical Oil and Gas University, 76019 Ivano-Frankivsk, Ukraine
5
SCIRE Foundation, 00867 Warsaw, Poland
6
Department of Tractors and Agricultural Machines, Operating and Maintenance, Mykolaiv National Agrarian University, 54020 Mykolaiv, Ukraine
*
Author to whom correspondence should be addressed.
Appl. Sci. 2023, 13(1), 21; https://doi.org/10.3390/app13010021
Submission received: 9 November 2022 / Revised: 15 December 2022 / Accepted: 16 December 2022 / Published: 20 December 2022
(This article belongs to the Special Issue Innovations in Agri-Food Plants)

Abstract

:
The article presents the results of the implementation of the mathematical planning of the experiment to determine the optimal parameters of the calibration process of cherry, sweet cherry, cherry plum, apricot and almond seeds. The essence of this process is the separation of seeds (bones) of fruit crops into fractions homogenous in size in order to highlight the middle fraction, which is about 80% of the total number of bones. The bones of the middle fraction are of the highest quality and are most suitable for sowing. The shape of the bones was evaluated by three parameters: length, width, and height. Calibration was performed according to the width of the bone. To carry out experimental studies, a calibration device was developed, the working body of which is the sieve part. Ball cleaners were used to prevent clogging of the perforated sieve. A mathematical theory of experimental planning was used. The criterion of optimization for all fruit crops was taken as an indicator of the quality of bone division into homogeneous fractions. The functional dependence of this indicator on the frequency and amplitude of oscillations of the grating part of the calibration unit, as well as on the angle of inclination of the sieves, was investigated. To implement the experimental data, we used a rotatable Boks plan of the second order. Regression models of the cherry, sweet cherry, cherry plum, apricot, and almond calibration process were obtained. Adequacy of the models was assessed by Fisher’s criterion. As a result, the optimal operating parameters of the installation were determined. This ensures the qualitative separation of the bones of fruit crops into homogeneous fractions with a mass deviation of up to 7%. An assessment of the quality of work of ball sieve cleaners was carried out. To do this, we used the coefficient of efficiency of the live cross-section. With the optimal parameters of the installation, the value of this coefficient of the unit for all fruit crops is within 0.87 to 0.95. This indicates that the calibration process is of high quality.

1. Introduction

One of the ways to reduce the prime cost of fruit crops seedlings (cherries, sweet cherries, cherry plums, apricots and almonds) is to introduce technology into their production to make using the site for growing rootstocks unnecessary [1,2,3]. The above technology eliminates the necessity of operations of digging rootstocks and transplanting them to the area of seedling cultivation. That is, the cultivation of rootstocks takes place directly on the site for seedlings growing with their subsequent grafting of the cultivar.
It is possible to reduce labor costs for sown rootstock care on the site of seedlings where the distance in a row between the seeds when sowing bones should be between 15 to 17 cm. Thus, the process involves the use of a precision seeder with sowing apparatus designed to sow calibrated bones. To form the appropriate batches of bones for sowing, their total mass should be divided into homogeneous in size fractions [4,5].
Following such a practice enables obtaining a batch of bones, which will be aligned in size with a deviation by weight of up to 10%. This quality can be achieved by ensuring that sieves are at least 80% free from stuck bones during calibration.
Analysis in recent studies indicates that scientific data on the development of sorting or calibration machines for agricultural seeds [6,7,8,9,10] are not sufficient for fruit bones.
Therefore, the working out of the unit for fruit bones calibration is a prerequisite for the application of the above technology [11,12,13,14].
The scientific novelty of the obtained results consists of the following: a mathematical model for the process of calibration of the bones of fruit crops has been obtained, which establishes dependence between the quality of separation of bones into fractions and the factors influencing the process of calibration. This allows scientific substantiation of the technology of seed preparation for sowing. The practical value of the obtained results is in determining the optimal values of factors influencing the process of seed separation.

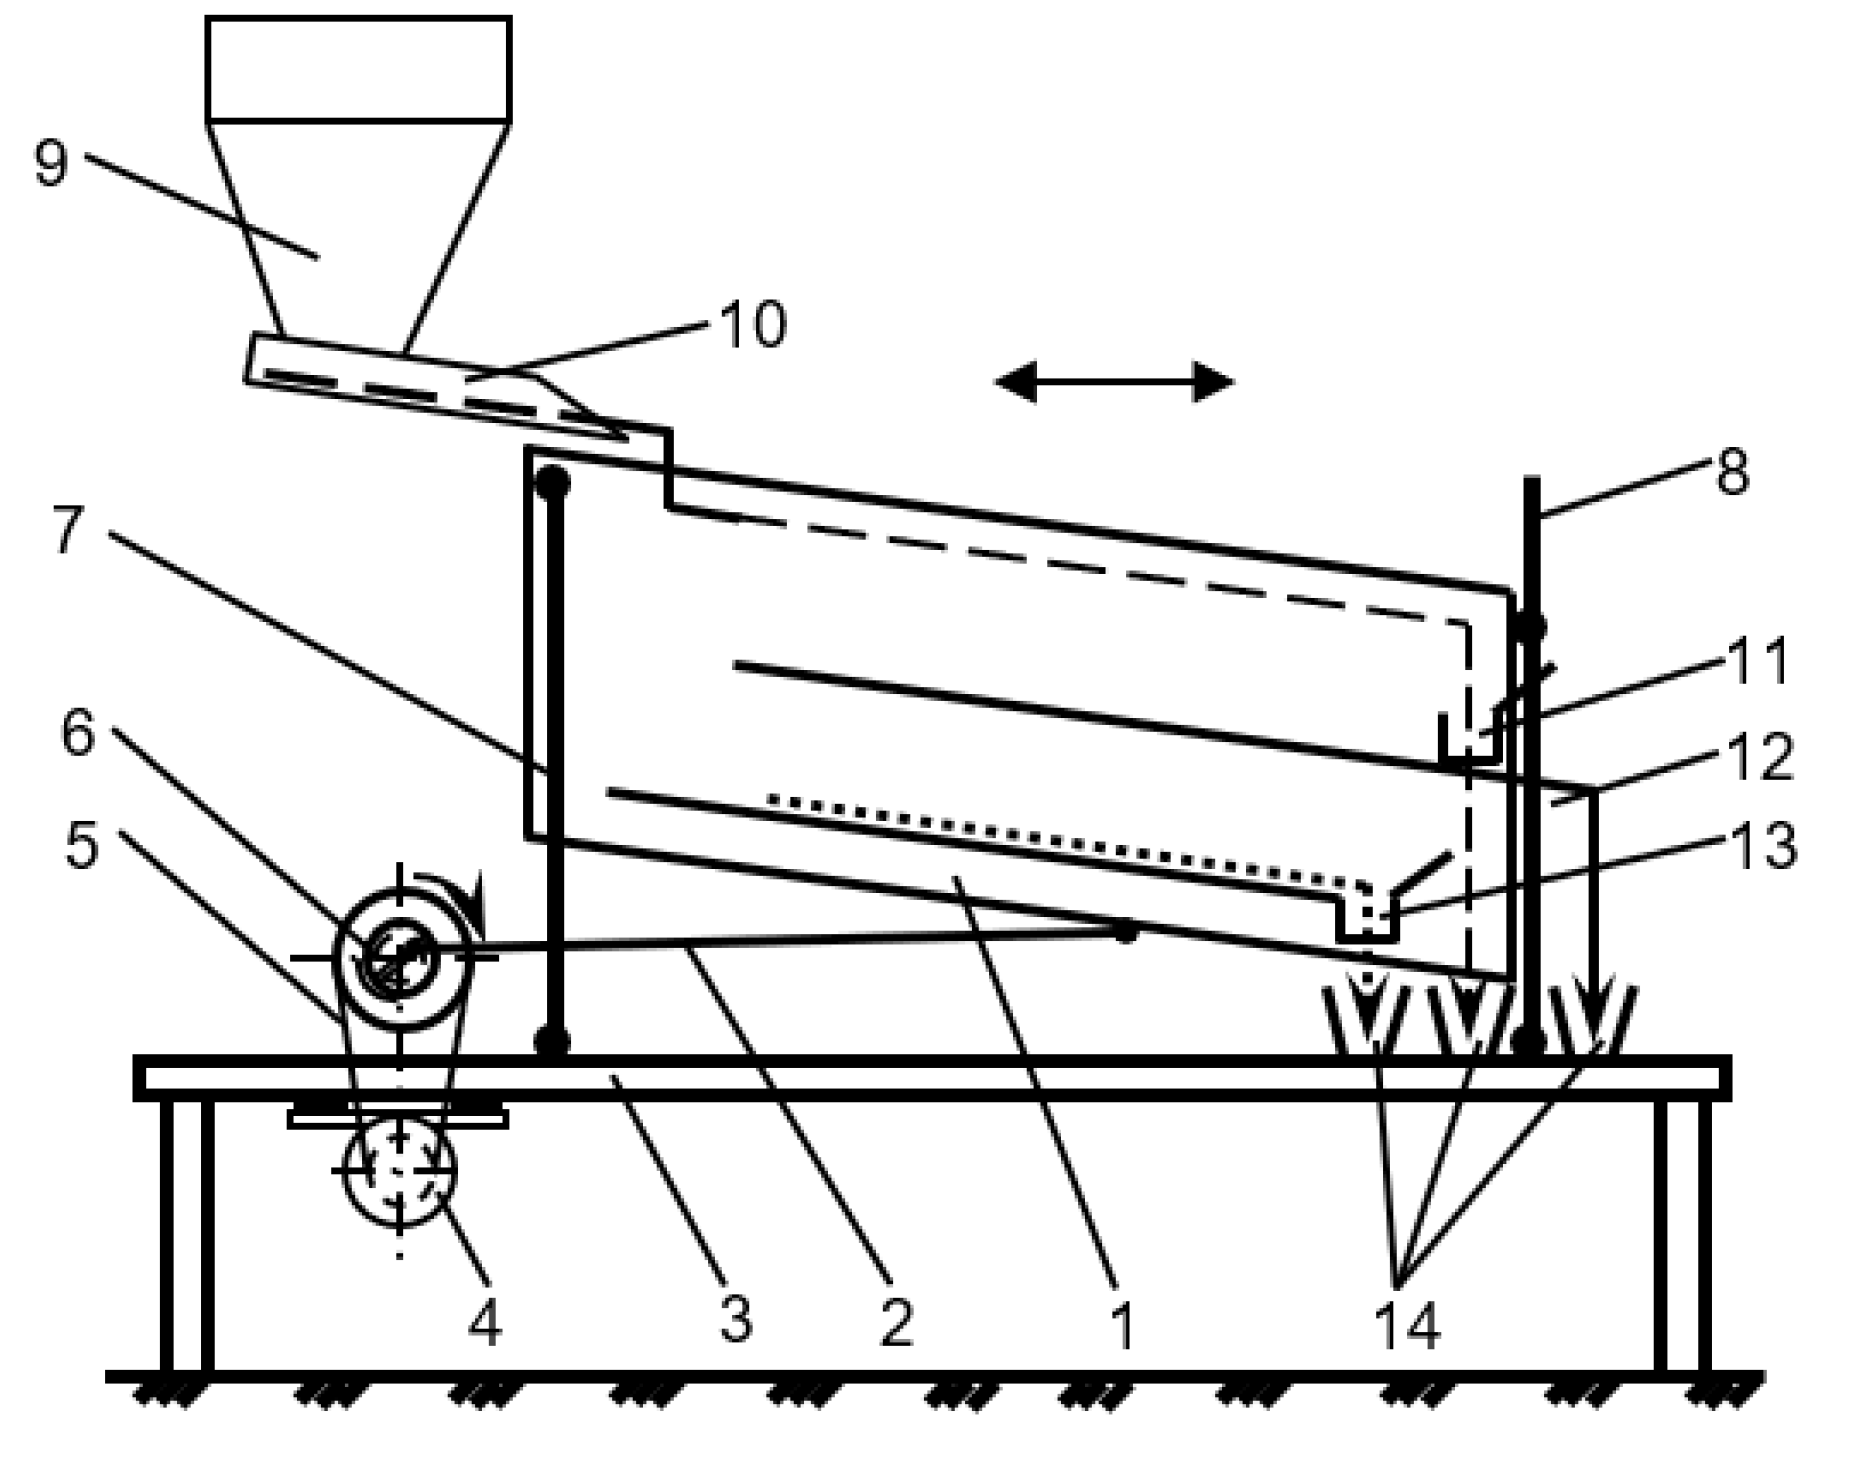
2. Materials and Methods

The research program provided definition by experimental methods of the optimal values of the parameters for laboratory installation operation mode, enabling the achievement of the required quality of bones calibration [15,16,17,18].
The sieves are the principal working part of the machines for seeds sorting and calibration. They separate seeds into differently sized fractions [19,20,21,22,23].
The obtaining of high-quality material is provided by the effective sieve operation [24].
The process of bones calibration on the sieves includes the following phases:
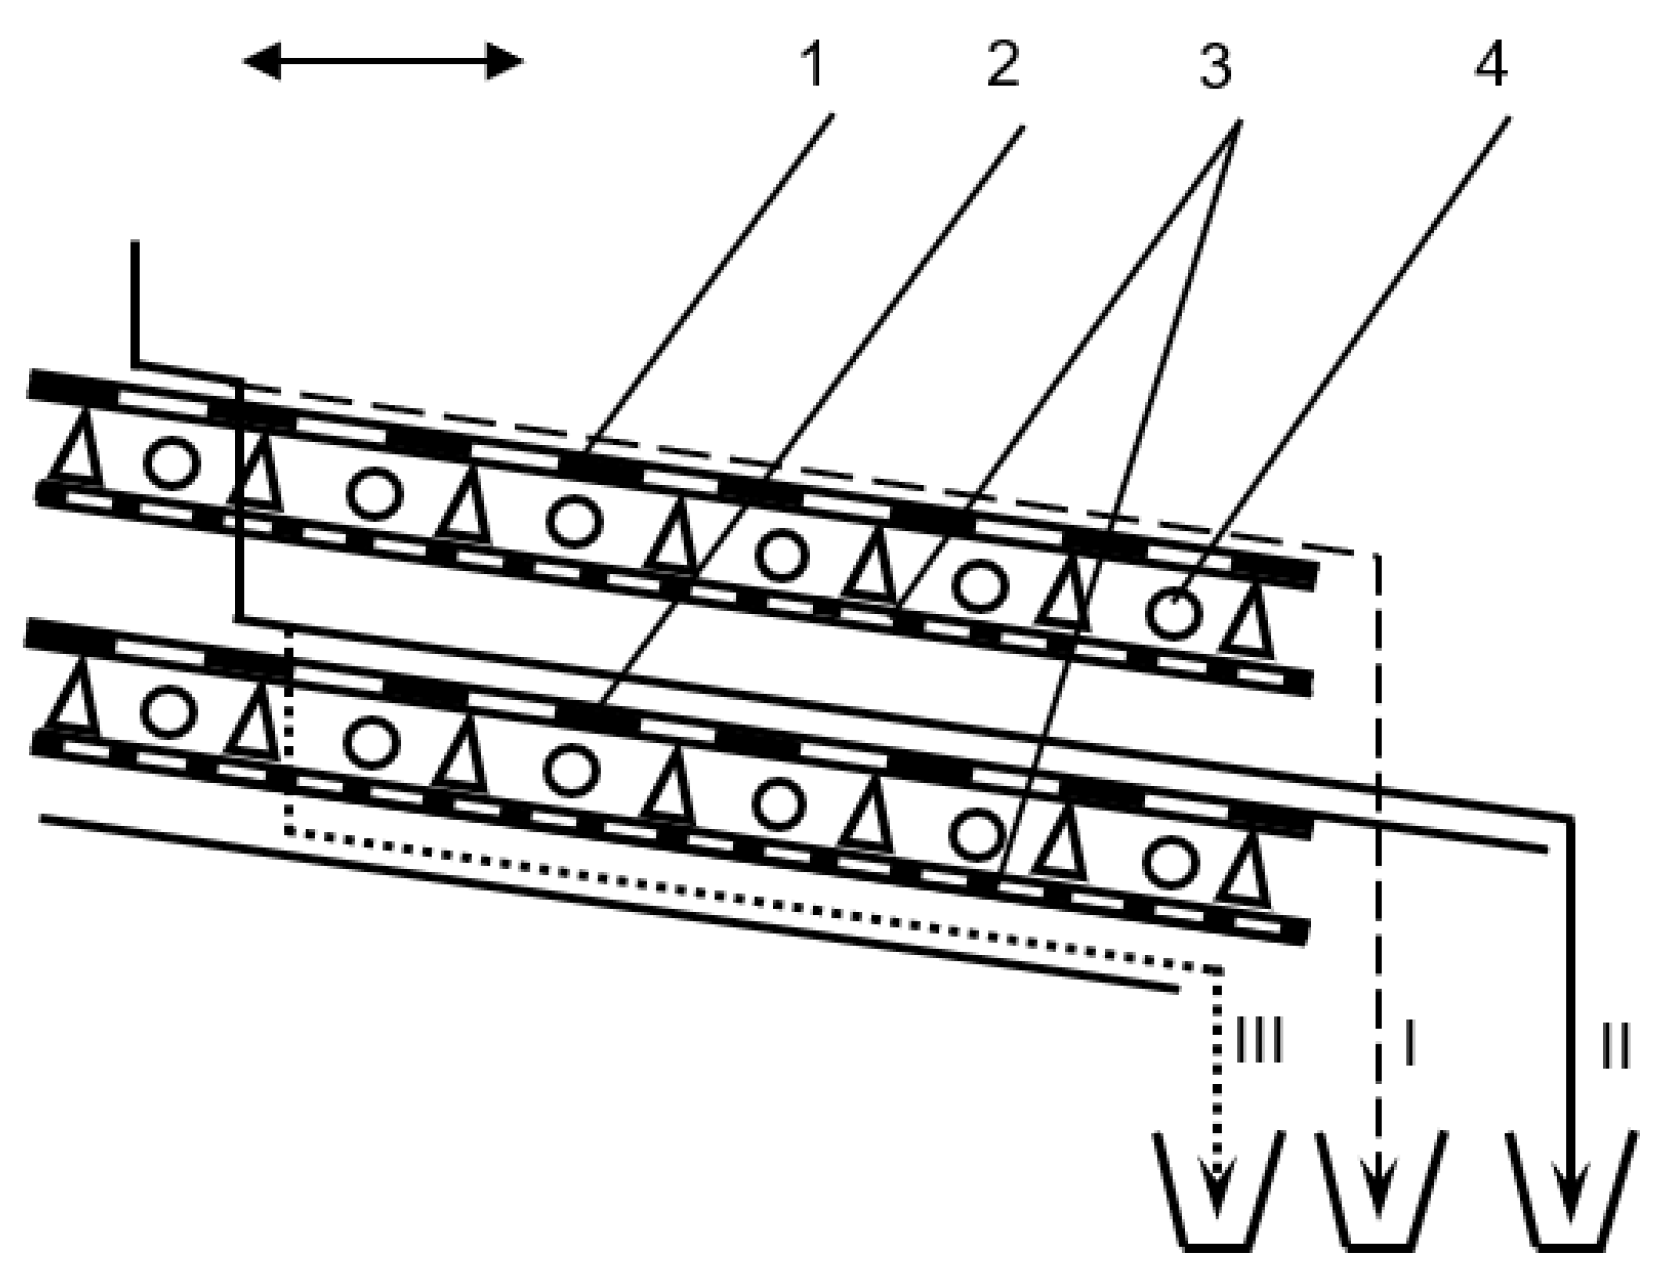
  • Moving the bones on the working surface of the sieve;
  • Sifting through the holes of the sieve;
  • Cleaning the sieves’ openings from the bones stuck.
The calibration process efficiency depends on the characteristics of these phases [24].
Laboratory unit description. On the basis of the design analysis of the calibration machines of crop seeds, the structural and technological scheme of the unit for calibration of fruit cultures bones, given in Figure 1, was substantiated.
The unit consists of the unit sieves part (1), which has movable risers—two front (7) and two rear (8)—being mounted on the frame and swinging in the horizontal plane from the action of the connecting rod (2).
On the rear risers (8) the mechanism for adjusting the angle of the sieves’ incline is being provided. The drive of the unit sieves part consists of an electric motor (4), a belt drive (5) and a shaft (6), which has a mechanism for adjusting the amplitude of oscillations. Above the unit sieves part, there is a hopper (9) with a sloping board (10), by means of which the bones are conveyed to the sieves. For the removal of bone fractions, the unit sieves part has two gutters (11, 13) and one inclined tray (12). There are three receiving trays (14) for collecting bone fractions.
The unit sieves part (Figure 2) consisted of two flat stamped sorting sieves (1 and 2), mounted one below the other. As a result of oscillations of the unit sieves, part of the ball periodically moves into the space under the sieve.
According to this arrangement of sieves, the total bones volume was divided into three fractions: large I, medium II and small III. The upper sieve 1 is designed to isolate a large fraction of the bones, and the lower sieve 2—for the middle. Sieves had circular openings, which provided the separation of the bones in width. To clean stuck bones from the holes in the sieve, the ball cleaners were set under the sieves, consisting of rubber balls (4), located on the reflective rod surfaces (3). The balls exert a shock effect on the sieves, knocking the stuck bones out of the holes [25,26,27]. According to the results of previous theoretical research, the following optimal values of the parameters of the ball cleaner were obtained [2]:
  • ball diameter D = 33 mm;
  • distance between the rods t = 23 mm;
  • height of space under sieve H = 40 mm.
The method of experimental research provided for determining the optimal values of the parameters of the sieve part of the installation, by which the qualitative separation of the bones into fractions occurs, namely:
  • oscillation frequencies of the sieve part (n);
  • oscillation amplitudes of the sieve part (A);
  • the angle of inclination of the sieves and ball cleaners (β).
The sieve part of the unit for bones calibration of fruit crops with a ball purifier is shown in Figure 3.
The criterion of optimization for all fruit crops was taken as an indicator of the quality of bone division into large, middle and small fractions, where the average fraction should be 80–85% of the total volume bones.
Such an indicator was determined by the formula:
F ( n ; A ; β ) = | ε large id ε large   ex | + | ε med   id ε med   ex | + | ε small   id ε small ex |
where ε i id , ε i ex —the coefficient of calibration efficiency for each fraction (ideal and experimental value).
The amount of each fraction was determined by the coefficient of calibration efficiency, which is expressed as a percentage by weight:
ε i = M i M t · 100 %
  • where
  • M i —the mass of the obtained bones fraction;
  • M t —total mass of bones.
The minimum value of the obtained function (1) most effectively reflects the quality of the process of calibration of fruit bones. The ideal values of the coefficient of efficiency of calibration are determined as a result of studies of size-mass parameters [4,5] and confirmed by manual sieving of a batch of bones [27,28].
The experiments were carried out at a laboratory facility, the flow chart of which is shown in Figure 1.
Calibrated bones of cherry magalebs, sweet cherries, cherry plums, apricots and almonds of wild forms, which were selected in accordance with [29], were tested. The calibration of the bones of each fruit crop was performed on sorting sieves with openings of appropriate diameters (Table 1).
The sieves varied depending on the type of fruit crop whose bones were calibrated, and the parameters within the following limits:
  • oscillation frequency n from 200 to 500 rpm;
  • the amplitude of oscillations A from 5 to 10 mm;
  • angle of sieves and ball cleaners β from 0 to 20°.
The drive of the sieve part of the unit (Figure 1) had an electric motor with a rated frequency of 1500 rpm and a power of 0.27 kW. The oscillation frequency was adjusted by the use of the HITACHI X200—002 SFEF frequency converter [30], which made it possible to obtain oscillation frequency values in Hertz and smoothly change its value from 10 to 50 Hz to within 0.08 Hz.
To measure the amplitude of oscillations, a special design of the shaft is provided with graduation in millimeters applied to its end, which was deposited with the help of VC-1 caliper with the accuracy of 0.1 mm.
The angle of the sieves incline was determined using a protractor and a ruler. The legs were placed with a ruler with an accuracy of 0.1 mm. The corresponding values of the incline angles of the sieves β were determined by the formula:
β = a r c t g x y   ,
  • where
  • x—opposite leg, mm;
  • y—adjacent leg, mm.
The accuracy of determining the angle of inclination was ± 0.250, which was obtained by logarithmization and then differentiation of both parts of Equation (3).
Weighing of batches of bones used for calibration was performed on weighing scales desktop lever dial with the maximum limit of weighing −10 kg DL-10d, with an accuracy of 5 g.
After calibration, the bones mass of each fraction was weighed on lever scales and electronic quadrant laboratory scales with tare compensation mechanism QLT-500g depending on the volume of the experimental batch. Electronic scales enabled obtaining bones mass values with an accuracy of 0.05 g.

3. Results and Discussion

The optimal values of the parameters of the sieve part of the unit, by which the qualitative separation of the bones into fractions occurs, were determined with the help of a rotary second-order Boxing plan [31,32].
The levels of input factors, the coding conditions of the independent variables are given in Table 2 and the intervals for their variation are shown for all fruit crops.
For these factors, three criteria were tested and analyzed:
  • Student criterion—checking the significance of regression coefficients;
  • Kohren’s criterion—checking the reproducibility of experiments;
  • Fisher criterion—checking the adequacy of the model.
Data processing was done using the Mathematica-5 computer program, MathCad software and the Microsoft Excel office application.
To study the regularities of the relationship between the independent values x1, x2, x3 (factors) with the dependent variable y (response function), a regression analysis of the experimental data was carried out.
As a result, second-order mathematical models of the calibration process of the bones of fruit crops, which are called regression dependencies, were obtained:
for cherries:
Y cherries = 20.13 + 4.7653 · x 1 + 13.631 · x 2 + 6.8943 · x 3 + 1.5471 · x 1 · x 3 + + 1.935 · x 2 · x 3 + 3.65 · x 1 2 + 5.0631 · x 2 2 + 0.6354 · x 1 · x 2
Y sweet   cherries = 24.49 + 8.474 · x 1 + 14.823 · x 2 + 4.41 · x 3 + + 3.169 · x 1 · x 3 + 2.759 · x 2 · x 3 + 3.815 · x 1 2 + 15.445 · x 3 2 + 8.695 · x 1 · x 2
Y plum   cherries = 34.15 + 4.524 · x 1 + 7.004 · x 2 + 13.61 · x 3 + + 32.837 · x 1 2 12.71 · x 2 2 + 3.717 · x 3 2 + 9.888 · x 1 · x 2 + 7.318 · x 1 · x 3
Y apricots = 20.98 + 9.55 · x 1 + 3.546 · x 2 + 2.7 · x 3 + + 2.001 · x 1 2 + 1.04 · x 2 2 + 9.917 · x 3 2 + 2.913 · x 2 · x 3
Y almonds = 28.25 + 16.72 · x 1 + 4.266 · x 2 1.88 · x 3 + + 12.568 · x 1 2 + 5.34 · x 2 2 + 1.73 · x 3 2 2.123 · x 1 · x 3 + 5.688 · x 2 · x 3
The regression coefficients were calculated using the known formulas given in [31]. After determining the regression coefficients, their significance was verified by known formulas given in [31] according to the following method:
  • variance characterizing the error of the experiment was determined (Table 3);
  • variance of reproducibility by the results of the experiments in the center of the de-sign was calculated Dm (Table 3);
  • variances characterizing the errors in determining the coefficients of the regression equation were found;
  • the confidence interval of the regression coefficients was calculated using Student’s t-criterion, with the number of degrees of freedom f = N · ( γ 1 ) = 28 . Its value is found from the tables [31]; in our case it is tcr = 2.05;
  • confidence intervals are compared to the values of regression coefficients.
Checking the significance of the regression coefficients of the obtained model allows rejection, with 95% confidence, of the least significant coefficients: cherries b33, sweet cherries b22, cherry plum b23, apricot b12 and b13, almond b12.
To check the homogeneity of the dispersions of the reproducibility of the experiments, Kohren’s criterion was used. With the help of this criterion, the repeatability of experiments is checked within certain measurement limits with a given confidence level. The number of experiments was k = 14, the number of degrees of freedom f = 2, the number of repetitions of the experiments was 3. The tabular value of Kohren’s criterion, in accordance with [31] Gtab = 0.35. Calculated values of Kohren’s criterion Gp are obtained:
  • for cherries Gp = 0.21;
  • for sweet cherries Gp = 0.31;
  • for plum cherries Gp = 0.2;
  • for apricots Gp = 0.29;
  • for almonds Gp = 0.27.
It was found that for all crops Gp < Gtab; hence, the reproducibility dispersion is homogeneous.
By the tightness of the relationship between the experimental and theoretical regression, one can judge the presence of a correlation. To determine the percentage of scatter of the desired response function (y) relative to its average value, determined by the variability of the factors x1, x2, x3, regression statistics of mathematical models (4)–(8) were calculated:
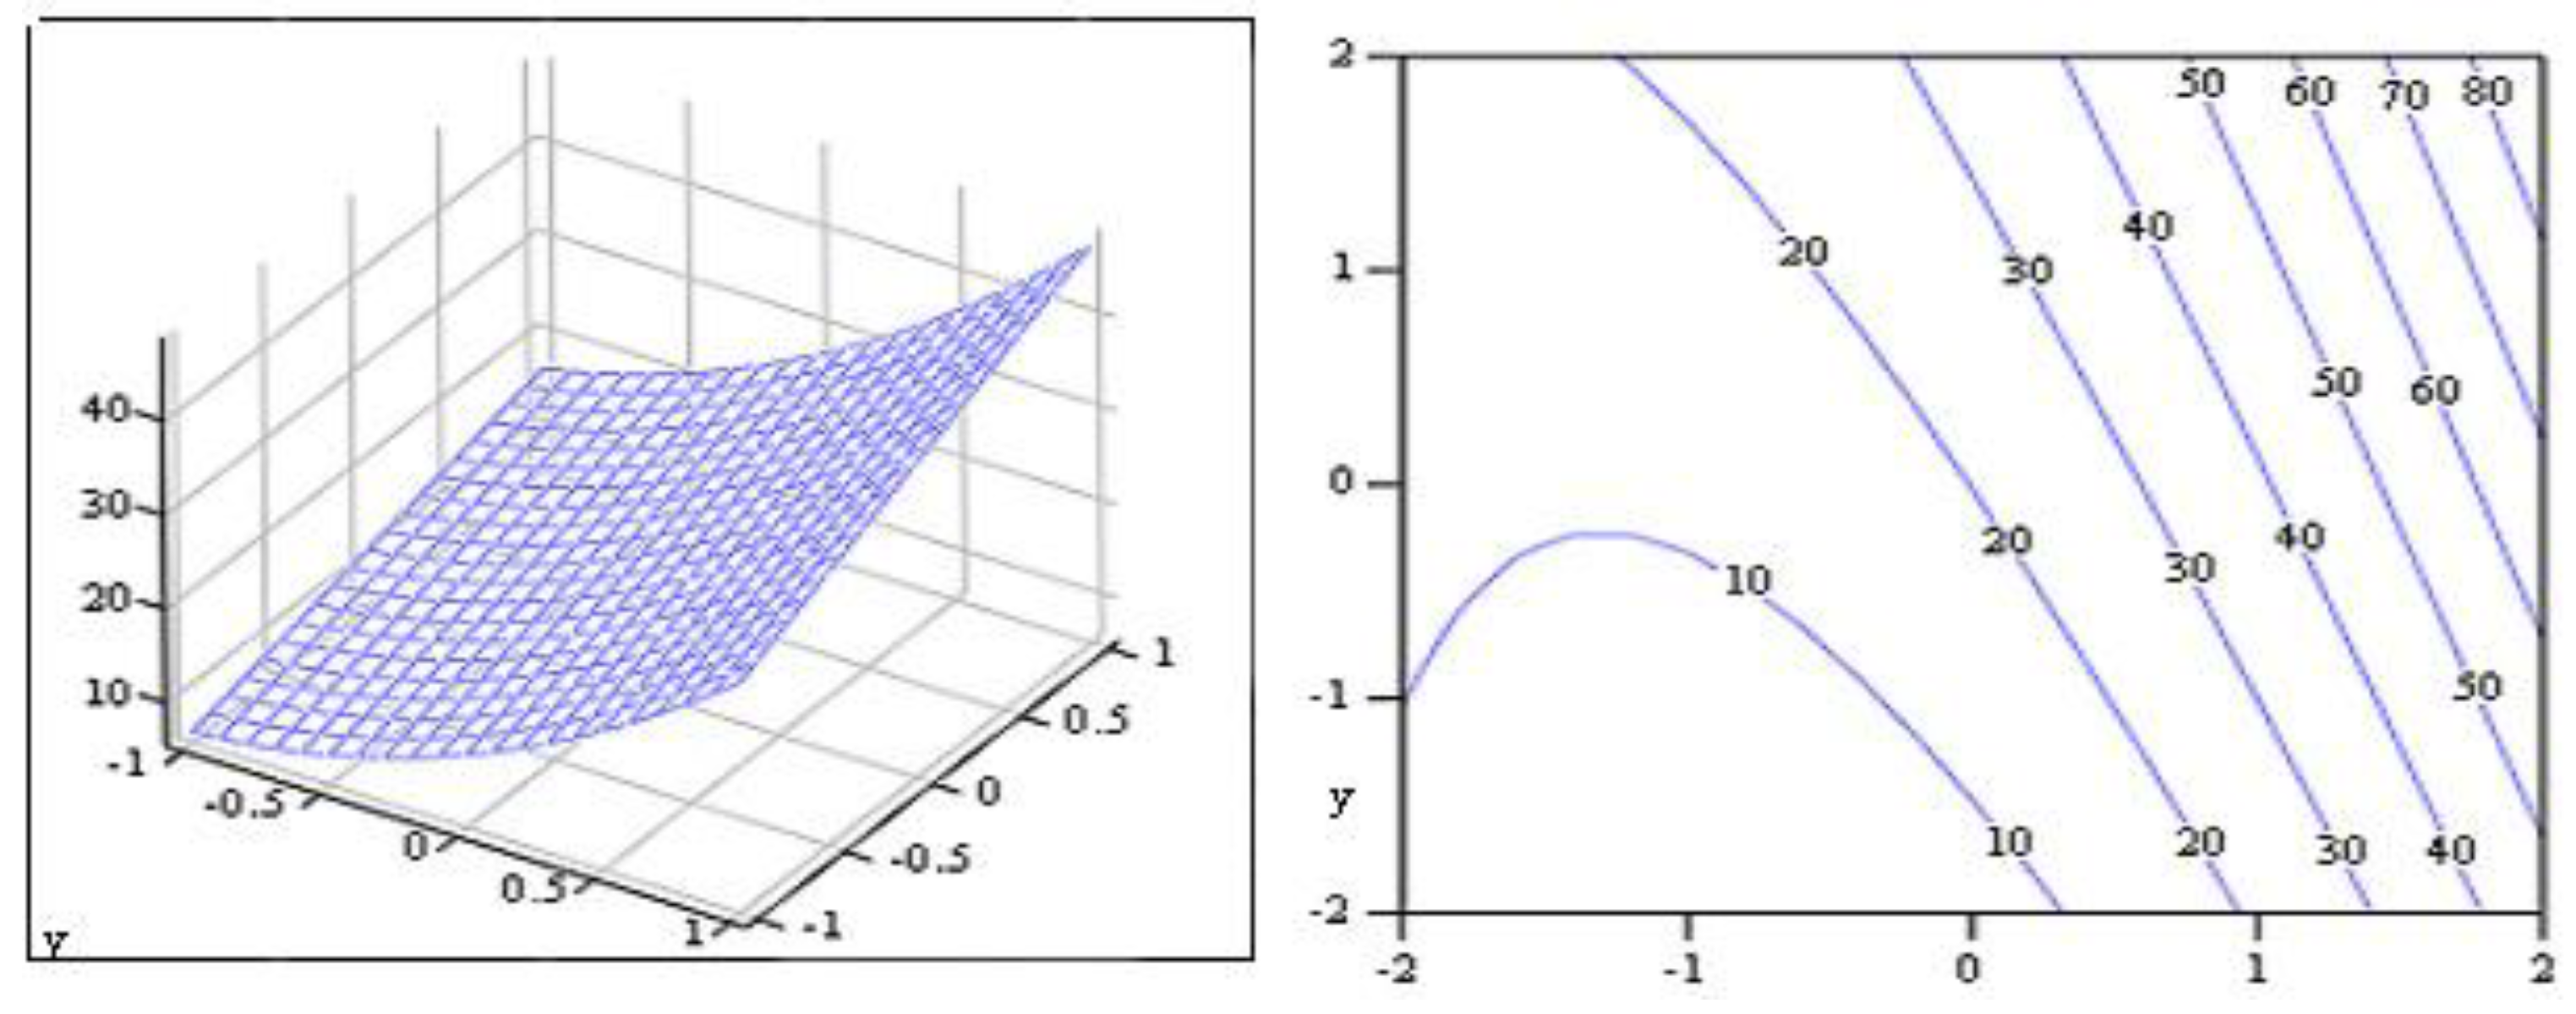
  • coefficient of multiple correlation R;
  • coefficient of determination R2 (r-square).
The calculation results are presented in Table 3.
The coefficient of determination for all cultures averages R2 = 0.87. This means that on average 87% of the spread is due to variability and 13% to other causes. This means that the variability of the function (y) is almost completely characterized by a spread of factors.
The adequacy check of the obtained models was carried out according to the Fisher criterion [31]. It is determined that the hypothesis about the adequacy of the description by the equation of experimental results is accepted with 95% probability:
  • for cherries Fp = 1.71 < Fcr = 2.19;
  • for sweet cherries Fp = 1.03 < Fcr = 2.19;
  • for plum cherries Fp = 2.01 < Fcr = 2.19;
  • for apricots Fp = 1.80 < Fcr = 2.19;
  • for almonds Fp = 1.92 < Fcr = 2.19.
The critical value of the Fisher criterion was determined by the number of degrees of freedom [31]: f 1 = N ( k + 1 ) = 10 ; f 2 = N · ( γ 1 ) = 28 .
To analyze the obtained Equations (4)–(8), the method of two-dimensional sections was used. Calculations to determine the optimal values of the optimization parameters in accordance with Equations (4)–(8) were carried out using the computer programs “Mathematica 5” and “MathCad”.
Consider the application of this method on the example of one crop—cherries. The resulting regression Equation (5) is reduced to the canonical form. To do this, we move the origin of coordinates to a new point in the factor space.
Considering that each of the factors varies within:
1 X 1 1 ; 1 X 2 1 ; 1 X 3 1 ;
the coordinates of the new centers in coded form for each crop will be:
R = { x 1 x 2 x 3 }
The resulting second-order regression equation is differentiated with respect to each independent variable, x1, x2, x3, and equated to zero.
This gives:
d y d x 1 = 8.474 + 7.63 · x 1 + 8.695 · x 2 + 3.169 · x 3 = 0 d y d x 2 = 14.823 + 8.695 · x 1 + 2.758 · x 3 = 0 d y d x 1 = 4.41 + 3.169 · x 1 + 2.758 · x 2 + 30.89 · x 3 = 0
Solving the system of equations, we obtain the coordinates of the new center:
R min s w e e t   c h e r r y = { 0.053 1 0.059 }
Substituting these values into the regression Equation (5), we obtain the value of the criterion at the minimum point Y m i n   s w e e t   c h e r r y = 9.61 .
Thus, the analysis of Equations (4), (6)–(8) was performed and response surfaces for all crops were built (Figure 4, Figure 5, Figure 6, Figure 7 and Figure 8), their appearance determined and an analysis carried out by the method of two-dimensional sections, depending on the factors of variation, fixing each of them at a certain level.
The coordinates of the new centers for cherries, apricots, cherry plums and almonds are presented here:
R c h e r r y = { 0.364 1 1 } ;   R p l u m   c h e r r y = { 0.193 1 1 } ;   R a p r i c o t   = { 1 1 0.037 } ; R a l m o n d s   = { 0.581 1 1 } .
Substituting these values into the regression Equations (4), (6)–(8), we obtain the values of the optimization criteria at the minimum point:
  • for cherries Y min c h e r r y = 6.12 ;
  • for plum cherries Y min p l u m   c h e r r y = 3.32 ;
  • for apricots Y min a p r i c o t   = 4.84 ;
  • for almonds Y min a l m o n d s   = 19.22 .
Calculations to determine the optimal values of the optimization parameters according to Equations (4)–(8) were carried out using the computer algebra system “Mathcad”.
Decoding certain factors have been considered:
X 1 = n n mean   λ n ; X 2 = A A mean   λ A ; X 3 = β β mean   λ β   ,
where n mean   , A mean   , β mean   —the mean values of the frequency parameters, the oscillation amplitude and the slope angle of the sieves at the basic level of variation (Table 2);
λ n , λ A , λ β – are the intervals of variation in the parameters of the oscillation frequency, the amplitude of oscillations and the slope angle (Table 2).
Then, the regression Equations (4)–(8) can be written in the decoded form:
F ( n ; A ; β ) c h e r r y = 421.432 1.7 n 12.21 A 5.514 a + + 0.0131 n a + 0.3096 A a + 0.0018 n 2 + 0.81 A 2 + 0.005648   n A
F ( n ; A ; β ) s w e e t   c h e r r y = 388.2879 1.1342 n 18.8506 A 32.0578 a + 0.0163 n a + 0.3677 A α + 0.0009 n 2 + 1.7161 α 2 + 0.0535 n A
F ( n ; A ; β ) p l u m   c h e r r y = 1385.645 6.3663 n + 9.009 A 16.2298 α + 0.0067 n 2 2.034 A 2 + 0.413 α 2 + 0.0565 n A + 0.0348 n α
F ( n ; A ; β ) apricot = 253.267 + 0.9114 n + 7.3088 A 5.6395 α 0.0008 n 2 0.4622 A 2 + 0.1823 α 2 + 0.4855 a A
F ( n ; A ; β ) almonds = 909.1113 3.883 n 26.337 A 7.5121 α + 0.00503 n 2 + 1.335 A 2 + 0.4325 α 2 0.0212 n a + 1.1422 A α
The calculations for determining the optimum values of the optimization parameters according to Equations (10)–(14) were performed using the Mathematica-5 computer software and MathCad software. The response surfaces were constructed, their appearance was determined, and two-dimensional sections were analyzed according to the variation factors [31].
Analyzing the response surfaces, we determined the optimal values of parameters and modes of laboratory installation for the calibration of fruit bones, which are shown in Table 4.
The clogging process of sieve openings has been estimated. The coefficient of efficiency of the live section G—the ratio of the number of free of stuck bones to the total number of openings—has been taken as an indicator of the quality of the cleaning operation [28].
The cleaners of the type under consideration had a reflective surface made of rods with a diameter of d0 = 3 mm in increments of t = 23 mm, and were divided into cells with dimensions of 125 × 209 mm, which contained 3–4 rubber balls with a diameter of D = 33 mm.
As a result of oscillations of the unit sieves, part of the ball periodically moves in the space under the sieve. Moreover, the movement of the ball is random due to the influence of a large number of factors.
It was established that the angle of inclination of the sieves has a negligible effect on the clogging of the holes, so it was not considered in the research. The frequency of oscillations of the sieves part has a significant effect on the coefficient of efficiency of the live section: when it increases, there is a decrease in the number of clogged holes. To a greater extent, the amplitude of the vibrations of the grating part affects the coefficient of efficiency of the live section: the larger it is, the fewer stuck seeds there are. However, if these indicators exceed the received optimal operating modes of the installation, the required separation quality is not ensured.
It has been defined that when calibrating the bones of all fruit crops, almost the same tendency towards the presence of clogged openings existed. In this case, the coefficient of effectiveness of live cross-sections for all fruit crops ranged from G = 0.87–0.95. This indicates that the combination of theoretically determined geometric parameters of ball purifiers with the parameters of the operating mode of the installation (n, A, β) provides the desired quality of the process of bone separation into fractions.
To confirm the data obtained as a result of mathematical planning of the experiment, validation experiments with respect to mathematical models were carried out.
We studied the effectiveness of the influence of the obtained constructive and kinematic parameters of the installation on the quality of calibration of lots of seeds of fruit stone crops. The seeds of fruit stone crops were calibrated for three fractions at optimal operating parameters of the installation. The obtained seed fractions were weighed; the measurement results were written down in the laboratory observation journal. The criterion for the effectiveness of the calibration process is the quality indicator of the separation of seeds into fractions (1).
As a result, confidence intervals of rational parameters and operating modes of the calibration process of cherry, sweet cherry, apricot, cherry plum and almond seeds were obtained (Table 5).
During testing, the total calibration time of a batch of seeds was fixed. Thus, the productivity of the installation was determined as the ratio of the total mass M t of a batch of seeds to the total time tt calibration:
Q i = M t t t .
With the established parameters and regimes, which are listed in Table 4, a confirmatory experiment was conducted to calibrate seed batches of fruit crops. The fractional composition and performance of the installation were obtained (Table 6).
The data in Table 6 show that the obtained optimal parameters and operating modes of the installation allow obtaining the fractional composition of the seeds of fruit crops with a weight deviation of 3 to 7%. The productivity of the laboratory unit was 150 kg/h.
Based on the agrotechnical requirements for calibrated seeds, a fraction consisting of seeds of the same size with a high absolute weight was obtained.

4. Conclusions

It is suggested here to characterize the efficiency of ball purifiers by the coefficient of efficiency of a live cross section, the value of which is the ratio of the number of openings of the sieve free from stuck bones to the total number of openings at a certain point in time during the calibration process.
A full-factorial experiment has been carried out, for which a rotatable Boks plan of the second order has been chosen. The criterion of optimization was taken as an indicator of the quality division of seeds into fractions homogenous in size. Oscillation frequency n, oscillation amplitude A and the angle of inclination of the sieves α have been taken as factors. The process of separating seeds into fractions most effectively reflects the minimum value of the obtained criterion of optimization.
As a result of experimental studies of the process of calibration, a regression model was obtained which establishes the relationship between the qualitative indicator of the process and the main factors affecting it.
According to the results of experimental studies, the structural, technological and kinematic parameters that ensure the maximum quality of separation have been determined:
  • − Cherry: n = 440 fluct/min, A = 5.0 mm; α = 7 deg;
  • − Sweet cherry: n = 420 fluct/min, A = 5.0 mm; α = 7 deg;
  • − Cherry plum: n = 440 fluct/min, A = 5.0 mm; α = 4 deg;
  • − Apricot: n = 400 fluct/min, A = 7.0 mm; α = 6 deg;
  • − Almond: n = 400 fluct/min, A = 6.0 mm; α = 7 deg.
Calibration of batches of seeds at the specified parameters of the installation allows obtaining fractions, homogeneous in size, of the bones of fruit crops with a mass deviation of up to 7%. This corresponds to the specified accuracy of the received data and ensures a high-quality flow of the calibration process. The coefficient of efficiency of the live cross-section G of the sieve in the process of operation of the unit for all fruit crops is within 0.87 to 0.95.

Author Contributions

Conceptualization, L.B. and S.H.; methodology, L.B. and O.M. (Oleksandr Miroshnyk); software, I.T.; validation, O.V., V.N. and V.H.; formal analysis, O.M. (Oleksandr Matsulevych), V.N., and V.H.; investigation, O.M. (Oleksandr Matsulevych) and V.N.; data curation, O.M. (Oleksandr Miroshnyk), O.V.; writing—original draft preparation, L.B., O.M. (Oleksandr Matsulevych) and I.T.; writing—review and editing, I.T., O.V. and V.N.; visualization, L.B., S.H., supervision—V.N., and V.H. All authors have read and agreed to the published version of the manuscript.

Funding

This research received no external funding.

Institutional Review Board Statement

Not applicable.

Informed Consent Statement

Not applicable.

Data Availability Statement

Data sharing not applicable.

Conflicts of Interest

The authors declare no conflict of interest.

References

  1. Karaiev, O.H. Scientific Bases of Creation of Mechanized Technological Complexes for Production Systems of Seedlings of Fruit Crops. Ph.D. Thesis, Dmytriy Motornyi Tavria State Agrotechnological University, Melitopol, Ukraine, 2017. [Google Scholar]
  2. Karaiev, O.; Bondarenko, L.; Halko, S.; Miroshnyk, O.; Vershkov, O.; Karaieva, T.; Shchur, T.; Findura, P.; Prístavka, M. Mathematical Modelling of the fruit-stone culture seeds calibration process using flat sieves. Acta Technol. Agric. 2021, 24, 119–123. [Google Scholar] [CrossRef]
  3. Myhan, R.; Jachimczyk, E. Grain separation in a straw walker unit of a combine harvester: Process model. Biosyst. Eng. 2016, 145, 93–107. [Google Scholar] [CrossRef]
  4. Bondarenko, L.Y. Investigation of size and mass parameters of seed material of fruit stones. Pr. Tavriiskoi Derzhavnoi Ahrotekhnichnoi Akad. 2006, 35, 111–117. [Google Scholar]
  5. Bondarenko, L.Y. Correlation-regression analysis of size-mass parameters of seeds of fruit stones. Pr. Tavriiskoi Derzhavnoi Ahrotekhnichnoi Akad. 2006, 36, 105–110. [Google Scholar]
  6. Sadek, M.A.; Chen, Y. Discrete element modeling of hemp particle separation using a 3D vibratory separator. Can. Biosyst. Eng. 2013, 55, 2.23–2.31. [Google Scholar] [CrossRef]
  7. Bracacescu, C.; Pirna, I.; Sorica, C.; Popescu, S.; Stan, O. Experimental researches on influence of functional parameters of gravity separator on quality indicators of separation process with application on cleaning of wheat seeds. Eng. Rural Dev. 2012, 11, 16–21. [Google Scholar]
  8. Xu, L.; Li, Y.; Li, Y.; Chai, X.; Qiu, J. Research Progress on Cleaning Technology and Device of Grain Combine Harvester. Nongye Jixie Xuebao/Trans. Chin. Soc. Agric. Mach. 2019, 50, 1–16. [Google Scholar]
  9. Wang, L.; Duan, L.; Zheng, Z.; Li, Y.; Zhao, H. Optimization and Experiment on Driving Mechanism of Vibrating Screen with Three Translations and Two Rotations. Nongye Jixie Xuebao/Trans. Chin. Soc. Agric. Mach. 2018, 49, 138–145. [Google Scholar]
  10. Shi, L.; Ma, Z.; Zhao, W.; Yang, X.; Sun, B.; Zhang, J. Calibration of simulation parameters of flaxed seeds using discrete element method and verification of seed-metering test. Nongye Gongcheng Xuebao/Trans. Chin. Soc. Agric. Eng. 2019, 35, 25–33. [Google Scholar]
  11. Tabor, S.; Lezhenkin, A.; Halko, S.; Miroshnyk, A.; Kovalyshyn, S.; Vershkov, A.; Hryhorenko, O. Mathematical simulation of separating work tool technological process. In Proceedings of the International Scientific Conference on Progress of Mechanical Engineering Supported by Information Technology, Czajowice, Poland, 19 September 2019; p. 132. [Google Scholar]
  12. Havrylenko, Y.; Kholodniak, Y.; Halko, S.; Vershkov, O.; Miroshnyk, O.; Suprun, O.; Dereza, O.; Shshur, T.; Śrutek, M. Representation of a monotone curve by a contour with regular change in curvature. Entropy 2021, 23, 923. [Google Scholar] [CrossRef]
  13. Struchaiev, N.; Bondarenko, L.; Vershkov, O.; Chaplinskiy, A. Improving the efficiency of fruit tree sprayers. Mod. Dev. Paths Agric. Prod. Trends Innov. 2019, 1, 3–10. [Google Scholar]
  14. Lezhenkin, A.; Lezhenkin, I.; Vershkov, A.; Kolomiyets, S. Agrobiological as well as mechanical and technological framework of development of the harvesting technology with the method of grain crops combing in standing position. Mod. Dev. Paths Agric. Prod. Trends Innov. 2019, 1, 85–91. [Google Scholar]
  15. Lezhenkin, O.M.; Halko, S.V.; Miroshnyk, O.O.; Vershkov, O.O.; Lezhenkin, I.O.; Suprun, O.M.; Shchur, T.G.; Kruszelnicka, W.; Kasner, R. Investigation of the separation of combed heap of winter wheat. J. Phys. 2021, 1781, 012016. [Google Scholar] [CrossRef]
  16. Havrylenko, Y.; Kholodniak, Y.; Halko, S.; Vershkov, O.; Bondarenko, L.; Suprun, O.; Miroshnyk, O.; Shchur, T.; Śrutek, M.; Gackowska, M. Interpolation with Specified Error of a Point Series Belonging to a Monotone Curve. Entropy 2021, 23, 493. [Google Scholar] [CrossRef] [PubMed]
  17. Bazaluk, O.; Struchaiev, N.; Halko, S.; Miroshnyk, O.; Bondarenko, L.; Karaiev, O.; Nitsenko, V. Ways to Improve the Efficiency of Devices for Freezing of Small Products. Mater. This Link Is Disabl. 2022, 15, 2412. [Google Scholar] [CrossRef]
  18. Craessaerts, G.; Saeys, W.; Missotten, B.; De Baerdemaeker, J. Identification and control of the cleaning section on a combine harvester. VDI Ber. 2007, 106, 359–365. [Google Scholar] [CrossRef]
  19. Chen, Y.; Lan, Y.; Zhu, J.; Yin, X.; Wang, W.; Peng, Q.; Li, J.; Wang, B. Direct calibration of discrete element method simulation parameters of seed metering device. Int. Agric. Eng. J. 2020, 29, 181–189. [Google Scholar]
  20. Huang, W.-Y.; Sheu, S.-J. Separation and identification of the fifteen constituents in forsythiae fructus. J. Food Drug Anal. 2007, 15, 33–39. [Google Scholar] [CrossRef]
  21. Heise, H.M.; Damm, U.; Lampen, P.; Davies, A.N.; Mcintyre, P.S. Spectral variable selection for partial least squares calibration applied to authentication and quantification of extra virgin olive oils using Fourier transform Raman spectroscopy. Appl. Spectrosc. 2005, 59, 1286–1294. [Google Scholar] [CrossRef]
  22. Zeng, Z.; Ma, X.; Cao, X.; Li, Z.; Wang, X. Critical Review of Applications of Discrete Element Method in Agricultural Engineering. Nongye Jixie Xuebao/Trans. Chin. Soc. Agric. Mach. 2021, 52, 1–20. [Google Scholar] [CrossRef]
  23. Korenko, M.; Bulgakov, V.; Kurylo, V.; Ihnatiev, Y.; Matušeková, E. Formation of crop yields of energy crops depending on the soil and weather conditions. Acta Technol. Agric. 2021, 24, 42–47. [Google Scholar] [CrossRef]
  24. Bondarenko, L.Y.; Tsymbal, V.I. Investigation of the shape and size of the openings of the sieve for the calibration of the seed material of fruit stones. Mech. Electrif. Agric. 2008, 92, 176–180. [Google Scholar]
  25. Kiurchev, S.; Verkholantseva, V.; Yeremenko, O.; Al-Nadzhar, F. Research and changes in berries using technology of freezing during storage. Eng. Rural Dev. 2020, 19, 997–1002. [Google Scholar]
  26. Hrytsaienko, H.; Hrytsaienko, I.; Bondar, A.; Zhuravel, D. Mechanism for the maintenance of investment in agriculture. Mod. Dev. Paths Agric. Prod. Trends Innov. 2019, 1, 29–40. [Google Scholar]
  27. Zhuravel, D.; Samoichuk, K.; Petrychenko, S.; Gródek-Szostak, Z.; Sorokin, D. Modeling of Diesel Engine Fuel Systems Reliability When Operating on Biofuels. Energies 2022, 15, 1795. [Google Scholar] [CrossRef]
  28. Piven, M.V. Substantiation of the Parameters of the Grating Separation Process of Grain Mixtures. Ph.D. Thesis, Kharkiv Petro Vasylenko National Technical University of Agricultur, Kharkiv, Ukraine, 2006. [Google Scholar]
  29. Qawaqzeh, M.; Szafraniec, A.; Halko, S.; Miroshnyk, O.; Zharkov, A. Modelling of a household electricity supply system based on a wind power plant. Przegląd Elektrotechniczny 2020, 96, 36–40. [Google Scholar] [CrossRef]
  30. X200 Series Frequency Converters Quick Reference Guide. Available online: http://vened.kiev.ua/pr/X200_QRG.pdf (accessed on 22 February 2022).
  31. Mencher, J.M.; Zemshman, A.J. Fundamentals of Experiment Planning with Elements of Mathematical Statistics in Viticulture Research; Shtiintsa: Kishinev, Moldova, 1986; p. 238. [Google Scholar]
  32. Lawinska, K.; Wodzinski, P.; Modrzewski, R. Verification of the mathematical model of the screen blocking process. Powder Technol. 2014, 256, 506–511. [Google Scholar] [CrossRef]
Figure 1. Structural and technological scheme of the calibration unit. 1—the unit sieves part; 2—connecting rod; 3—frame; 4—electric motor; 5—belt transmission; 6—a shaft with regulation of amplitude of oscillations; 7—front risers; 8—rear risers with a mechanism for adjusting the angle of inclination of sieves; 9—a hopper for bones; 10—distribution board; 11, 12,13—trays for removal of bones fractions; 14—receiving trays.
Applsci 13 00021 g001
Figure 2. Design and technological scheme of arrangement of sorting sieves and ball cleaners. 1—top sorting sieve; 2—lower sorting sieve;3—reflective rod surfaces of ball cleaners; 4—rubber balls; I—large fraction, II—medium fraction; III—small fraction.
Applsci 13 00021 g002
Figure 3. Ball purifiers will settle the installation for calibration.
Applsci 13 00021 g003
Figure 4. The graph and contour curves of the dependence of the criteria Y on the factors x3, x2 for cherries, when x1 = 0.
Applsci 13 00021 g004
Figure 5. Graph and contour curves of the dependence of criteria Y on the factors x1, x3 for cherries, when x2 = 0.
Applsci 13 00021 g005
Figure 6. The graph and contour curves of the dependence of criteria Y on the factors x1, x3 for cherries, when x2 = 0.
Applsci 13 00021 g006
Figure 7. Graph and contour curves of the dependence factors of criterion Y on factors x2, x3 for apricot, when x1 = 0.
Applsci 13 00021 g007
Figure 8. Graph and contour curves of the dependence factors of criterion Y on factors x1, x2 for almonds, when x3 = 0.
Applsci 13 00021 g008
Table 1. The diameters of the openings of the sieve d, mm.
Fruit CropUpper SieveLower Sieve
Cherry6.55.0
Sweet cherry8.06.5
Cherry plum13.011.0
Apricot20.015.0
Almond22.015.0
Table 2. Factors variation intervals.
Fruit CropsFactorsn, fluct/minA, mm β , deg
The Coded DesignationX1X2X3
CherryVariation Interval452.52.5
Basic level (0)4557.59.5
Top level (+1)50010.012.0
Lower level (−1)4105.07.0
Sweet cherryVariation Interval652.53.0
Basic level (0)4157.57.0
Top level (+1)48010.010.0
Lower level (−1)3505.04.0
Cherry plumVariation Interval702.53.0
Basic level (0)4307.57.0
Top level (+1)50010.010.0
Lower level (−1)3605.04.0
ApricotVariation Interval501.54.0
Basic level (0)4508.56.0
Top level (+1)50010.09.0
Lower level (−1)4007.03.0
AlmondVariation Interval502.02.0
Basic level (0)4308.05.0
Top level (+1)48010.07.0
Lower level (−1)3806.03.0
Table 3. Regression statistics of mathematical models of the process of sizing the bones of fruit crops.
Regression StatisticsCherrySweet CherryCherry PlumApricotAlmond
Adequacy variance, 0.6000.9412.4131.8502.290
Average variance of the whole experiment, Dm0.2000.3140.8000.6170.765
Multiple correlation coefficient, R0.9640.8970.9990.9500.870
Determination coefficient, R20.9300.8040.9970.9000.750
Table 4. Optimal parameters and operating modes laboratory installation for the calibration of fruit bones.
Parametersn, fluct/minA, mm β
Fruit Crops
Cherry44057
Sweet Cherry42057
Cherry Plum44054
Apricot40076
Almond40067
Table 5. Rational parameters and modes of calibration of seeds of fruit stone crops.
Fruit CropsThe Diameter of the
Opening of the Sieve d, mm
n,
fluct/min
A,
mm
β ,
beg
CherryUpper d = 6.5 MM
Lower d = 5.0 MM
435–4455.0–5.56.5–7.0
Sweet CherryUpper d = 8.0 MM
Lower d = 6.5 MM
415–4255.0–5.56.5–7.0
Cherry PlumUpper d = 13.0 MM
Lower d = 11.0 MM
435–4455.0–5.54.0–4.5
ApricotUpper d = 20.0 MM
Lower d = 15.0 MM
395–4057.0–7.56.0–6.5
AlmondUpper d = 22.0 MM
Lower d = 15.0 MM
395–4055.5–6.06.5–7.0
Table 6. Fractional composition of seeds as a percentage of the mass and productivity of the unit for calibration of fruit culture bones.
Fruit CropsThe Mass of Fraction, %The Criterion of Optimization, %Productivity,
kg/h
LargeMiddleSmall
IdealExperimentalIdealExperimentalIdealExperimental
Cherry7.555.9077.657.555.9077.657.555.90
Sweet Cherry12.4514.1085.4512.4514.1085.4512.4514.10
Cherry Plum15.4019.2075.0015.4019.2075.0015.4019.20
Apricot7.2510.6088.357.2510.6088.357.2510.60
Almond14.8517.4083.1514.8517.4083.1514.8517.40
Disclaimer/Publisher’s Note: The statements, opinions and data contained in all publications are solely those of the individual author(s) and contributor(s) and not of MDPI and/or the editor(s). MDPI and/or the editor(s) disclaim responsibility for any injury to people or property resulting from any ideas, methods, instructions or products referred to in the content.

