Featured Application
The plant has been demonstrated to have a low energy requirement and extreme compactness, thus making it very attractive for the adoption in a small dairy factory.
Abstract
The paper investigates an alternative treatment plant for the typical wastewater effluent of a cheese-making industry, mainly composed of acid or sweet whey mixed with washing-water. Two variable parameters have been considered during the tests: four treatment temperatures (39, 46, 53 and 60 °C) and three solid content values (30%, 50% and 70%) of the concentrated product. The minimum and maximum values of the removal efficiency (pollutant amount into concentrate related to raw whey) range from 94.6% to 97.7% for conductivity, from 98.3% to 99.5% for BOD5, from 98.7% to 99.6% for COD and from 98.2% to 99.3% for Total Nitrogen. The plant capacity ranges from about 2 L/h (at 39 °C) to 6 L/h (at 60 °C) of processed whey. On the basis of the experimental findings, the proposed purification technology has demonstrated its suitability both to purify the effluent wastewater and to recover high-quality products (e.g., whey protein concentrate, lactose), thanks to its low thermal damage on the treated product and to its relatively low energy consumption from 0.4 kWh/L (at 60 °C) to 1.0 kWh/L (at 39 °C) of processed whey, with a Coefficient of Performance from approximately 0.6 up to 1.5.
1. Introduction
Cheese-making industries, during their process, generally discharge wastewater effluents. Such effluents are mainly made of acid or sweet whey mixed with washing-water [1]. Within the current management of wastewater effluent, the main task is to adopt an appropriate wastewater treatment plant [2]. In order to appropriately fit environmental restrictions and economical needs, the treatment technology should combine both the depuration of wastewater [3] and the recovery of whey products [4,5]. Some specific purification plants can be used for this kind of wastewater; the most common plants are: trickling filters; aerobic-activated sludge and anaerobic digesters [3,6]. However, these plants are inadequate to reduce very high BOD5 and COD loads of a typical cheese-making industry wastewater, and they are also unable to recover whey products.
Purification techniques generally need to be combined with recovery technologies for whey components in the treatment process. For this reason, other alternative or integrative plants are needed. Among these, some recovery technologies that can be adopted are reverse-osmosis [7], spray evaporation, membrane ultra-filtration and ion exchange, in sequence or in parallel [4,8]. These technical systems, although able to recover whey products while also preserving their high quality (e.g., whey protein concentrate; lactose), are much more expensive [9,10]. This high financial cost consistently decreases the interest in adopting these recovery technologies [11], especially in small cheese-making factories. These factors suggest the need to study an alternative treatment strategy to purify wastewater and to recover whey products, which can be competitive in comparison with other available systems.
Distillation at low-pressure, also known as vacuum distillation, is a process commonly employed in industry processes to extract or purify essential oils, to deodorize vegetable oils and to purify and dry some chemicals. However, the early scientific papers or patents on vacuum distillation technology have been focused on seawater desalinization [12,13]. The field of utilization of the vacuum distillation technique is wider, comprising biodiesel refining, organic synthesis and wastewater treatment [14,15]. Particularly, on the subject of wastewater treatment, scientific studies have demonstrated that the vacuum distillation technique performs remarkably in removing different pollutants such as: total suspended solids (TSS), total dissolved solids (TDS), biochemical oxygen demand (BOD), chemical oxygen demand (COD). It is also effective at removing and recovering heavy metals and various mineral compounds dispersed in an aqueous solution [16,17].
Vacuum distillation, often combined with membrane technology, is commonly employed to treat industrial olive oil wastewater and food process wastewater. More specifically, in olive oil wastewater treatment, the potentialities of vacuum distillation have been studied in combination with membrane process [18,19]. Furthermore, vacuum distillation has been used as a subsequent stage to the extraction process of Phenol, in the treatment of olive mill wastewater [20,21].
Depending on the type of dairy production, the curdling process produces a quantity of whey equal to approximately 85–90% of the volume of processed milk [22]. The organoleptic characteristics of the whey, which also determine its economic value, are strictly connected to the specific chemical composition. Dairy wastewater, being characterized by a high polluting load, does not allow its direct discharge, but requires a purification treatment [23]. Furthermore, whey is an unstable product due to the fermentation process produced by the bacteria present in the milk; this makes its management difficult and causes environmental problems for the dairy industry [5]. Nevertheless, whey is a potentially important resource to be economically utilized [4,24].
The following attributes of vacuum distillation of whey wastewater have not yet been quantified:
- The degree of purification achievable on the polluting load;
- The possible recovery of valuable products (as whey proteins have excellent functional properties, they are widely utilized in the food industry);
- The overall energetic cost of the treatment per unit of raw, processed product.
Moreover, the small dairy industry is continuously searching for inexpensive treatment for purification and recovery of by-products that could be economically utilized to increase its overall income. As recovery plants can become expensive when installed in a small cheese-making factory, all the alternative treatments, competitive in comparison with other available systems, are greatly appreciated.
This work investigates the existing gap in the literature related to raw whey wastewater treatment using a system of vacuum distillation that also uses a low treatment temperature. This method could make the processes of purifying the polluting load and the recovery of whey protein more economically profitable.
Therefore, in the present paper, an alternative treatment technology, based on a “low-temperature and low-pressure vapor distillation” plant has been proposed and applied to the cheese-making industry’s wastewater effluent. The experimental results obtained in the treatment process demonstrate the process’s suitability to purify the effluent wastewater and to recover whey products; indeed, this purification technology can recover high quality products (e.g., whey protein concentrate; lactose) thanks to its low thermal damage on the treated product and to its relatively low energy cost.
2. Materials and Methods
A low-temperature and low-pressure distillation (LTPD) laboratory plant, able to process the cheese effluent in batch mode, was used in this work. We carried out a series of experiments to study its performance.
A photograph of the LTPD laboratory plant is shown in Figure 1a, and its corresponding layout is shown in Figure 1b; the main components of the plant are shown and numbered: a heat pump, a low-pressure chamber equipped with two heat exchangers (hot side and cold side), and a circulation pump and a Venturi ejector to create the low pressure into the evaporation chamber. The plant worked in batch mode: it was fed by whey wastewater through an opening into the vacuum chamber when the plant was turned off. The operative capacity of the plant consists of a volume of 60 L regarding the ebullition chamber and a volume of 24 L with regard to the distillate tank. The distillation rate of the process was about 5 L/h (influent). The plant required an overall electric power of about 2 kW.
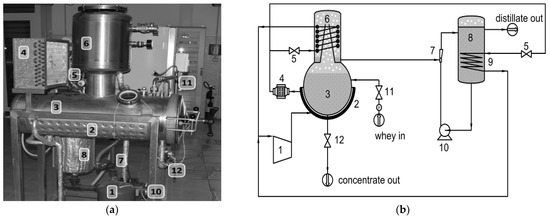
Figure 1.
Image (a) and simplified layout (b) of the low-temperature low-pressure vapor distillation laboratory plant: (1) compressor; (2) heating envelope (hot side); (3) ebullition chamber; (4) refrigerant under-cooling heat exchanger (hot side); (5) thermostatic valves of expansion; (6) condensation chamber (cold side); (7) Venturi ejector creating the low-pressure (with sampling open); (8) distillate tank; (9) distillate cooling (cold side); (10) centrifugal pump; (11) inflow electro-valve from whey tank (not shown) and (12) outflow discharge hand-valve to collecting concentrate tank (not shown).
This plant was able to treat the wastewater through an evaporation process at a low temperature of about 35 to 65 °C thanks to the low-pressure conditions in the evaporation chamber, where the absolute pressure reached about 6.0–6.5 kPa.
The first preliminary operation to carry out is to completely fill the distillate tank with demineralized water (100 uS/cm). The treatment process starts by feeding the ebullition chamber with the wastewater, then the centrifugal pump is activated until the absolute pressure decreases and the low-pressure condition is reached. Subsequently, the compressor is started and contemporarily, the treatment temperature (35 to 65 °C) of the ebullition chamber can be regulated, according to the manometer of the refrigerant gas high pressure side (hot side), operating the fan of the heat exchanger of the refrigerant under-cooling (hot side), and, at the same time, by allowing the cooling of the condensation chamber and of the distillate tank (cold side). These operations cause the product temperature to rise to its boiling temperature, depending on the chamber pressure, and the contents begin to evaporate. The vapor moves up towards the condenser (cold side), where the temperature is lower with respect to that in the condensation chamber, so the condensed vapor is discharged through the pipe connected to the Venturi ejector and accumulated into the distillate tank. From here, it can continuously exit by overflow at environmental pressure. At the end of the process, the plant is turned off, and the concentrated fraction can be extracted by opening the ebullition chamber.
In order to monitor the overall LTPD process, the plant is equipped with several measurement devices: a PT100 sensor to measure the temperature in the ebullition chamber; a vacuum-meter (Bennert’s U-type) for pressure measurement into the ebullition chamber; a flow-meter to measure the distillate effluent; a temperature sensor and a manometer sensor for refrigerant (for both the high- and low-pressure circuits) and a bulb thermometer to measure the environmental temperature. In addition, an electrical energy/power recording unit was used to monitor both the electrical power requirement and the overall electrical energy consumption of the plant.
Both the concentrate and the distillate fraction of the wastewater were analyzed. The capability of the LTPD process to recover high-quality products was evaluated considering the concentrate fraction, while the ability of the LTPD process to depurate the effluent was evaluated by considering the distillate fraction. Additionally, thermal and energetic conditions were considered to identify optimal processing conditions.
The samples were taken:
- At the tank of influent flow, where the raw whey resided;
- At the outlet of the distillate tank, where the effluent distillate resided;
- At the vacuum chamber, where the concentrate resided (at the end of the run).
The measurements were carried out on each stage of the wastewater: raw whey, distillate and concentrate. The measured characteristics of the samples were as follows: pH, conductivity, chemical oxygen demand (COD), biochemical oxygen demand after 5 days (BOD5), total nitrogen (TN), total phosphorus (TP) and solid content (SC).
Specifically, the measurements were executed according to the following methods: COD by the dichromate reflux method; BOD5 by the respirometric method; TN and TP by the Koroleff’s alkaline persulfate digestion method [25,26] and SC by the desiccation method, at 105 °C. Additionally, the following characteristics of the products were measured in an external laboratory: proteins, fats and lactose. No specific conditions of samples storage were adopted because the analysis was performed within about one hour of the sampling phase.
Density of the samples was measured by a Quevenne lacto-dense-meter; viscosity was measured by a viscous-meter (Brookfield HBD VII+, Brookfield Engineering Laboratories Inc., Stoughton, MA, USA); conductivity was measured by a conductivity-meter (HD 8706–R1, Delta Ohm, Padova, Italy) and pH was measured by a pH-meter (Hanna Instruments, pH 301, Padova, Italy).
In order to obtain measures at different operating conditions, we operated it on two parameters: one related to the plant and one related to the concentrated product. Since the heat necessary to the evaporation is supplied by the hot side of a refrigeration cycle, the first parameter considered was the refrigerant temperature on the hot side, that the plant allowed us to set. Accordingly, four different test values: 39 °C, 46 °C, 53 °C and 60 °C were selected. However, these values fluctuated around their set-point average value, with an inevitable oscillation during the plant functioning.
The parameter we considered was the final concentration of the concentrated product. Considering an initial average solid content of whey of 6.5%, as indicated in the literature, the goal was to achieve three different values of SC%: 30%, 50% and 70%. This was performed by monitoring the volume of water evaporated in each test and by stopping the operation of the plant once the calculated water volume to be removed was reached. However, due to the variability of the initial characteristics of the whey, the values of the final SC we actually obtained were slightly different from those intended.
The combinations of the two variable parameters required 12 tests, and since each one was repeated 3 times, in total, 36 tests were performed as reported in Table 1.

Table 1.
Trials coding and combinations of variable parameters and intended SC%.
In the first phase of the work, the performance of the LTPD plant was separately studied with two different fluids: the first one was distillate water and the second consisted of saline water (NaCl). Then, several trials were carried out at different operating conditions in order to identify the best operational conditions. In the second phase of the work, a set of “optimal” operating parameters was selected to ensure the process’s effectiveness when treating the whey wastewater.
All experiments were carried out employing raw whey wastewater (20 L each run), coming from a cheese-making industry, located at nearby Potenza (Southern Italy), derived from the manufacturing of cheese from cow milk. The main characteristics of the whey wastewater are listed in Table 2 and Table 3.
Table 2.
Overall raw cheese whey characteristics.
Table 3.
Raw cheese whey characteristics for each trial. The standard deviation is reported after the ± character.
3. Results and Discussion
The ability of the proposed treatment process can be analyzed by considering the removal in the distillation fraction and the contemporary accumulation of certain pollutant substances in the concentrate fraction at the end of the purifying treatment. Typically, main indicators of pollution can be assumed to be pH, conductivity, COD, BOD5, TN, TP and SC.
3.1. Concentrate
Table 4 reports the results of the experimental trials carried out, concerning the analyzed parameters, identified as main indicators of pollution, related to the concentrated fraction of the whey. These values must be compared with their starting values as reported in Table 3. To this purpose, in Table 5 are reported the final concentrated whey characteristics compared as a ratio to the raw whey initial values reported in Table 3.
Table 4.
Final concentrated whey characteristics. The standard deviation is reported after the ± character.
Table 5.
Final concentrated whey characteristics compared as a ratio to the raw whey. The standard deviation is reported after the ± character.
The pH value slightly decreases during the process time; this means that the acidity roughly does not vary. The SC, conductivity, BOD5, COD, TN and TP values greatly increase during the process time, as expected, depending on the trial duration and final reached SC.
Therefore, the concentration efficiency must be compared using the final increment reached on the SC value with respect to the raw whey.
Hypothesizing a linear relationship between the SC and the conductivity, BOD5, COD, TN and TP values, the concentration efficiency can be estimated regarding the previously mentioned parameters with regard to the reached SC.
The slope of the linear model represents the concentration efficiency with respect to the considered characteristics (conductivity, BOD5, COD, TN and TP). The concentration efficiency characterizes the retaining capability (RC) of the plant for the considered pollutant in the raw whey referred to SC (this capability is hypothesized to be 1, or 100%, for SC).
Table 6 reports the results of the linear model applied to conductivity, BOD5, COD, TN and TP versus SC% values. As previously stated, the pH does not vary as its slope is very small and near zero, therefore, the RC for pH is negligible. On the contrary, the conductivity shows the maximum concentration efficiency and intermediate values are related to BOD5, COD and TN, whereas TP shows a low value of RC.
Table 6.
Linear model of pH, conductivity, BOD5, COD, TN and TP vs. SC%. The slope represents the retaining capability (RC) regarding the specific pollutant referred to SC. In round brackets the 95% confidence bounds for the slope are reported.
In addition, in order to assess the thermal damage corresponding to different processing conditions, an index of heat treatment associated with the percentage of non-denatured whey protein in the concentrate can be calculated by evaluating the protein loss of solubility: briefly, the denaturation varies from about 81% (trial P1) to 34% (trial P12) increasing as the time process increases and the treatment temperature decreases (energy of activation of roughly 38 kJ/mol).
3.2. Distillate (Evaporate)
As discussed above, the effectiveness of the process is analyzed by considering the removal in the distillation fraction of a certain pollutant substance at the end of the purification treatment. The experimental results for the distillate fraction explain the ability of the LTPD process to purify the whey wastewater.
Table 7 reports the final distillate characteristics.
Table 7.
Final distillate characteristics. The standard deviation is reported after the ± character.
As the maximum limit for effluent discharge for industrial wastewater is 5.5ߝ9.5 for pH, 50 mg/L for TN, 500 mg/L for COD and 250 mg/L for BOD5, from Table 7 it is evident that the obtained distillate is not suitable to be directly discharged as effluent. This is due to the small volume of treated whey (20 L). However, by increasing the amount of treated whey, due to the scaling properties of the plant, the distillate polluting load can be reduced to allow for its direct discharge as effluent.
It is possible to assess the pollutant removal efficiency during each trial considering:
- The amount of pollutant in the starting raw whey;
- The volume of the treated raw whey;
- The pollutant in the distilled outflow and the volume of the distillate.
Table 8 reports the removal efficiency of each specific pollutant as 100% minus the ratio between the volumetric pollutant amount into distillate and into raw whey expressed as percentage. Unfortunately, due to some problems during the analysis, no measures are available concerning the TP and SC of the distillate fraction.
Table 8.
Removal efficiency of the specific pollutant: 100 minus the ratio between volumetric pollutant amount into distillate and into raw whey expressed as percentage.
The minimum and maximum value of the removal efficiency (considering the initial (raw whey) and the final (distillate) value of conductivity, BOD5, COD and TN) ranges from 94.6% to 97.7% for conductivity; from 98.3% to 99.5% for BOD5; from 98.7% to 99.6% for COD and from 98.2% to 99.3% for TN. These results demonstrate that the LTPD process is very powerful for purifying whey wastewater as the greatest amount of pollutant remains into the concentrated fraction.
3.3. Evaporation Capacity and Energy Costs
By grouping the tests for the selected different treatment temperatures of the heat exchanger (hot side), considering the data of the product treatment capacity and of the electrical energy consumption, the measured data were expressed considering the average measured electrical energy consumption per unit volume of treated whey (kWh/L) and the average operational capacity of the system (L/h), corresponding to each operating condition of treatment temperature (Table 9).
Table 9.
Relationship between the treatment temperature and the energy cost (measured electrical energy consumption during the trial) per unit volume of processed product; the average volumetric processing rate per unit volume of processed product and the coefficient of performance (COP) as ratio between the absorbed thermodynamic energy of evaporation and the measured electrical energy consumption. The standard deviation of the mean is reported after the ± character.
In addition, Table 9 evaluated the coefficient of performance (COP) of the plant as the ratio between the evaporation energy absorbed by the distilled vapor, considering the enthalpy of the water vapor at the pressure of the ebullition chamber and the treatment temperature, and the measured electrical energy consumption also taking into account the electrical consumption of the ancillary equipment.
The average rate of evaporation approximately decreases when the temperature of the heat exchanger decreases; furthermore, with regard to the temperature of the hot side exchanger, a marked decrease can be observed in the slope of the data describing the evolution of the SC of the concentrate by increasing the process time.
It is evident that when increasing the operating temperature from 39 °C to 60 °C, the operating capacity increases from about 2 L/h (at 39 °C) to 6 L/h (at 60 °C) of processed raw whey. This result is a direct consequence of the greater amount of heat transfer, with a correspondent increase of evaporated water.
The measured electrical energy consumption shows that by increasing the treatment temperature, a reduction in energy costs for each unit volume of processed whey can be obtained: a better operating capacity for the plant has been obtained by reducing the operating time, due to a more rapid water evaporation and a more rapid reaching of the prefixed concentration.
However, the results obtained have highlighted that it is significantly less expensive to operate at a certain temperature (in this case, 53 °C), above which the specific energy consumption is minimized towards about a constant level (COP of approximately 1.5). Such an optimal temperature depends on the characteristics of the exchange surfaces, the type of concentrator, the type of treated product and the efficiency of the vacuum circuit.
The results obtained can be considered as a direct consequence of the combined effect of the following physical and chemical factors:
- Viscosity: the viscosity of the concentrate increased over the time, bringing a reduction in the overall heat transfer coefficient;
- Ebullioscopic raising: since the vapor pressure of an aqueous solution is lower than that of pure water at the same temperature, at a given pressure, the solution boiled at a temperature higher than that of pure water, bringing an overall reduction in the amount of evaporated water from the concentrate.
4. Conclusions
The experimental results of the trials carried out bring some observations regarding the two main investigated parameters: the treatment temperature and the solid content SC in the final product.
(1) With regard to the effect of the treatment temperature, a high operating capacity of the plant was observed at high temperature (60 °C), at which up to 6 L/h of raw whey can be processed with a relatively low energy cost, due to the reduced treatment time. Unfortunately, this economical advantage results in a worse quality of the concentrated product, resulting in a significant loss due to a higher amount of denatured whey protein, as a result of their poor tolerance to high temperature. On the other hand, at a low operating temperature, the treatment time is longer and the energy consumption is higher.
(2) With regard to the obtainable solid content SC, it seems evident that the objective to achieve high SC causes a worse operational capacity of the plant. This is due to the increase in treatment time, which is a consequence of the global heat transfer coefficient decrease caused by the higher viscosity of the concentrated product, which is from raising the ebullioscopic temperature of the solution and from the blanketing phenomenon. On the other hand, prolonging the treatment time in order to achieve high SC has been revealed to be inefficient in the pollutant-content removal by the distillate (the removal efficiency being greater at the beginning of the treatment and decreasing as time elapses). However, this helps to retain the greatest amount of pollutant into the concentrated fraction.
(3) The best operative conditions of the plant are dependent on the two different objectives that can be achieved:
- When the plant is required to reduce the polluting load in the distillate, while the concentrate quality is neglected, a quick solution might be operating at a high treatment temperature with high operating capability, low energy costs, and large amounts of processed whey;
- Alternatively, when a high quality of the recovered product is required, then a low treatment temperature must be adopted, however, consequences will be a worse processing rate and a decreased cost saving.
(4) In any case, it is not convenient to push the evaporation up to the achievement of a high value of SC in the concentrate, as the overall heat exchange coefficient tends to decrease.
As a significant conclusion, the interpretation of the experimental results suggests that the driving parameter governing and limiting the evolution of the evaporative phenomenon is the overall heat transfer coefficient. Since this coefficient depends on the Reynolds number, the system could be supplied with a device simply moving the liquid concentrated phase in contact with the exchanger hot side in order to improve the overall heat exchange.
In addition, the productivity of the plant can be improved by increasing the transfer rate of the mass of the evaporated water from the boiling chamber to the condensation chamber by means of a mechanical system, however, this feature may not be as useful because it has been experimentally found that the pressure in the chamber decreases slightly according to the decrease of the boiling temperature. Thus, the limiting factor in this process is the global heat transfer coefficient, which decreases when the whey concentration increases.
Finally, the above considerations suggest that an optimal system solution can be reached through the adoption of two concentration treatments in parallel. Since the concentration at low pressure is discontinuous, this could optimize the loading and discharge phase and the reaching of the low pressure in the ebullition chamber.
On the whole, the results obtained in the present work have demonstrated that the proposed treatment technology can be suitable both to depurate cheese-making industry wastewater and to recover whey products. Particularly, the proposed treatment plant has been shown to be characterized by low temperatures along the distillation process, and this feature helps to prevent thermal and chemical damages to the recovered products. Moreover, the treatment plant has been demonstrated to have a low energy requirement in comparison with other treatment/recovery technologies. Further, the treatment plant is so compact that it can be an attractive option to meet the needs of small dairy factories.
Author Contributions
Conceptualization, G.A. and G.C.D.R.; Data curation, V.D.L., F.G. and A.M.; Investigation, F.G. and L.S.; Methodology, F.G. and A.M.; Supervision, G.C.D.R.; Writing—original draft, G.A. and V.D.L.; Writing—review and editing, G.A. and V.D.L. All authors have read and agreed to the published version of the manuscript.
Funding
This research received no external funding.
Informed Consent Statement
Not applicable.
Data Availability Statement
The data generated during the study are publicly available at https://docs.google.com/spreadsheets/d/1dHV4O0SDE2EcU6WjPd4qQydKKZq5VG_U/edit?usp=share_link. Or equivalently a short link can be used: https://tinyurl.com/245pml8h.
Conflicts of Interest
The authors declare no conflict of interest.
Nomenclature
| BOD | Biochemical oxygen demand |
| BOD5 | Biochemical oxygen demand after five days |
| COD | Chemical oxygen demand |
| COP | Coefficient of performance of the equipment |
| LTPD | Low-temperature and low-pressure distillation |
| RC | Retaining capability |
| SC | Solid content |
| TDS | Total dissolved solids |
| TN | Total nitrogen |
| TP | Total phosphorus |
| TSS | Total suspended solids |
References
- Shi, W.; Healy, M.G.; Ashekuzzaman, S.M.; Daly, K.; Leahy, J.J.; Fenton, O. Dairy Processing Sludge and Co-Products: A Review of Present and Future Re-Use Pathways in Agriculture. J. Clean. Prod. 2021, 314, 128035. [Google Scholar] [CrossRef]
- Guerreiro, R.C.S.; Jerónimo, E.; Luz, S.; Pinheiro, H.M.; Prazeres, A.R. Cheese Manufacturing Wastewater Treatment by Combined Physicochemical Processes for Reuse and Fertilizer Production. J. Environ. Manag. 2020, 264, 110470. [Google Scholar] [CrossRef] [PubMed]
- Chatzipaschali, A.A.; Stamatis, A.G. Biotechnological Utilization with a Focus on Anaerobic Treatment of Cheese Whey: Current Status and Prospects. Energies 2012, 5, 3492–3525. [Google Scholar] [CrossRef]
- Das, B.; Sarkar, S.; Sarkar, A.; Bhattacharjee, S.; Bhattacharjee, C. Recovery of Whey Proteins and Lactose from Dairy Waste: A Step towards Green Waste Management. Process Saf. Environ. Prot. 2016, 101, 27–33. [Google Scholar] [CrossRef]
- Zandona, E.; Blažić, M.; Režek Jambrak, A. Whey Utilization: Sustainable Uses and Environmental Approach. Food Technol. Biotechnol. 2021, 59, 147. [Google Scholar] [CrossRef]
- Janet Joshiba, G.; Senthil Kumar, P.; Femina, C.C.; Jayashree, E.; Racchana, R.; Sivanesan, S. Critical Review on Biological Treatment Strategies of Dairy Wastewater. Desalin. Water Treat. 2019, 160, 94–109. [Google Scholar] [CrossRef]
- Bickers, P.O.; Bhamidimarri, R. Aerobic Treatment of Reverse Osmosis Permeate in the Dairy Industry for Reuse. Water Sci. Technol. 1998, 38, 61–67. [Google Scholar] [CrossRef]
- Di Renzo, G.C.; Altieri, G. Whey Protein Concentrations Production Using a Membrane Ultrafiltration Pilot Plant. Production Optimisation with Different Pre-Treatment Systems. Riv. Di Ing. Agrar. (Italy) 2006, 37, 19–28. [Google Scholar]
- Dhineshkumar, V.; Ramaswamy, D. Review on Membrane Technology Applications in Food and Dairy Processing. J. Appl. Biotechnol. Bioeng. 2017, 3, 399–407. [Google Scholar] [CrossRef]
- Reig, M.; Vecino, X.; Cortina, J.L. Use of Membrane Technologies in Dairy Industry: An Overview. Foods 2021, 10, 2768. [Google Scholar] [CrossRef]
- Morr, C.V.; Ha, E.Y.W. Whey Protein Concentrates and Isolates: Processing and Functional Properties. Crit. Rev. Food Sci. Nutr. 1993, 33, 431–476. [Google Scholar] [CrossRef] [PubMed]
- Al-Kharabsheh, S.; Goswami, D.Y. Experimental Study of an Innovative Solar Water Desalination System Utilizing a Passive Vacuum Technique. Sol. Energy 2003, 75, 395–401. [Google Scholar] [CrossRef]
- Scheffler, T.B.; Leao, A.J. Fabrication of Polymer Film Heat Transfer Elements for Energy Efficient Multi-Effect Distillation. Desalination 2008, 222, 696–710. [Google Scholar] [CrossRef]
- McCabe, D.L.; Vivona, M.A. Treating Process Wastewater Employing Vacuum Distillation Using Mechanical Vapor Recompression. Environ. Prog. 1999, 18, 30–33. [Google Scholar] [CrossRef]
- Wang, Y.; Shu, F.; Xiang, X.; Zhang, Y.; Luo, G.; Huang, M. Research on Treatment of Abandoned Water-Based Drilling Fluid by Low Pressure Distillation Process. In Proceedings of the Society of Petroleum Engineers—IADC/SPE Asia Pacific Drilling Technology Conference 2012—Catching the Unconventional Tide: Winning the Future Through Innovation, Tianjin, China, 9–11 July 2012; Volume 1, pp. 435–442. [Google Scholar] [CrossRef]
- Criscuoli, A.; Bafaro, P.; Drioli, E. Vacuum Membrane Distillation for Purifying Waters Containing Arsenic. Desalination 2013, 323, 17–21. [Google Scholar] [CrossRef]
- Hsu, C.J.; Xiao, Y.Z.; Chung, A.; Hsi, H.C. Novel Applications of Vacuum Distillation for Heavy Metals Removal from Wastewater, Copper Nitrate Hydroxide Recovery, and Copper Sulfide Impregnated Activated Carbon Synthesis for Gaseous Mercury Adsorption. Sci. Total Environ. 2022, 855, 158870. [Google Scholar] [CrossRef] [PubMed]
- Carnevale, M.C.; Gnisci, E.; Hilal, J.; Criscuoli, A. Direct Contact and Vacuum Membrane Distillation Application for the Olive Mill Wastewater Treatment. Sep. Purif. Technol. 2016, 169, 121–127. [Google Scholar] [CrossRef]
- Ochando-Pulido, J.M.; Martinez-Ferez, A. On the Recent Use of Membrane Technology for Olive Mill Wastewater Purification. Membranes 2015, 5, 513. [Google Scholar] [CrossRef]
- Frascari, D.; Bacca, A.E.M.; Zama, F.; Bertin, L.; Fava, F.; Pinelli, D. Olive Mill Wastewater Valorisation through Phenolic Compounds Adsorption in a Continuous Flow Column. Chem. Eng. J. 2016, 283, 293–303. [Google Scholar] [CrossRef]
- Zagklis, D.P.; Vavouraki, A.I.; Kornaros, M.E.; Paraskeva, C.A. Purification of Olive Mill Wastewater Phenols through Membrane Filtration and Resin Adsorption/Desorption. J. Hazard. Mater. 2015, 285, 69–76. [Google Scholar] [CrossRef]
- Pires, A.F.; Marnotes, N.G.; Rubio, O.D.; Garcia, A.C.; Pereira, C.D. Dairy By-Products: A Review on the Valorization of Whey and Second Cheese Whey. Foods 2021, 10, 1067. [Google Scholar] [CrossRef] [PubMed]
- Nabbou, N.; Benyagoub, E.; Mellouk, A.; Benmoussa, Y. Risk Assessment for Chemical Pollution of Dairy Effluents from a Milk Processing Plant Located in Bechar (Southwest of Algeria). Appl. Water Sci. 2020, 10, 229. [Google Scholar] [CrossRef]
- Kilara, A. Whey and Whey Products. In Dairy Processing and Quality Assurance; John Wiley & Sons, Ltd.: Hoboken, NJ, USA, 2015; pp. 349–366. [Google Scholar] [CrossRef]
- Koroleff, F. Simultaneous Oxidation of Nitrogen and Phosphorus Compounds by Persulfate, 2nd ed.; Grasshoff, K., Ehrhardt, M., Kremling, K., Eds.; Verlag Chemie Weinhein: New York, NY, USA, 1983; Volume 2. [Google Scholar]
- Qualls, R.G. The Biogeochemical Properties of Dissolved Organic Matter in a Hardwood Forest Ecosystem: Their Influence on the Retention of Nitrogen. Phosphorus and Carbon. Ph.D. Dissertation, University of Georgia, Athens, GA, USA, 1989. [Google Scholar]
Publisher’s Note: MDPI stays neutral with regard to jurisdictional claims in published maps and institutional affiliations. |
© 2022 by the authors. Licensee MDPI, Basel, Switzerland. This article is an open access article distributed under the terms and conditions of the Creative Commons Attribution (CC BY) license (https://creativecommons.org/licenses/by/4.0/).