Abstract
Under the action of Arctic low temperatures and long-term alternating loads, the fatigue life of the submarine rudder stock mechanism is severely tested. In this paper, the research method of the static strength analysis and fatigue life analysis of the submarine rudder stock mechanism is proposed by combining multibody dynamics, the finite element method, and tests. Based on the three-dimensional model and the motion law of the rudder stock mechanism, a multibody dynamic model is established, and the time history loads of each node of the mechanism are obtained. According to the working temperature range of the submarine rudder stock mechanism in the Arctic, low-temperature tensile tests are carried out. Based on the experimental data, the finite element model is built, and static analysis is carried out. Using the S–N static fatigue design method, fatigue simulation analysis is performed by using nCode DesignLife. The analysis results show that the fatigue life of the submarine rudder stock mechanism decreases significantly when the temperature is reduced from 0 °C to −60 °C. This method can provide a reference for submarine design and life model establishment in the Arctic environment.
1. Introduction
With global warming and the application of new technologies, the rich oil, gas, and mineral resources in the Arctic are expected to be developed, and new ocean transportation routes are expected to be opened. The unprecedented melting of Arctic ice provides new opportunities for shipping by decreasing the distance for commercial traffic between Asia and Europe by up to 40% [1]. The Arctic Channel will also become a convenient channel. It is its shipping value that determines the strategic military value of the Arctic.
Seventy-three percent of the Arctic Ocean is covered by ice. The ice layer up to several meters thick can effectively prevent the penetration of electromagnetic waves. Even the most advanced satellites have difficulty tracking and monitoring submarines. The huge noise generated by the frequent breaking of sea ice can interfere with sound waves, thus damaging the tracking of underwater monitoring systems so that submarines can move freely under the ice without being detected. The efficiency of long-range backscatter radar for detecting submarines is greatly reduced due to the frequent interference of the ionosphere in polar regions. Therefore, the Arctic is the “ideal hiding place” for submarines [2].
The Arctic is foggy, the visibility is low, and the channel is winding and tortuous and changes with sea ice movement. When a submarine sails on the Arctic surface, it needs to change the course frequently to use the ice water channel and thin ice area. When sailing in an ice area, the submarine speed is low, the steering efficiency is reduced, and the submarine turns slowly [3]. Submarines mainly rely on the rudder stock mechanism located in the nonwatertight area between the pressure hull and the submarine shell for lifting. After the actual investigation of our research team, large pieces of ice floes are unable to enter the area where the rudder stock mechanism is located, while smaller ice floes have little effect on this structure. Unlike in pressure hull, the rudder stock mechanism will be directly exposed to extremely cold temperatures. Therefore, low temperature is the most important factor affecting the fatigue life of submarine rudder stock mechanism in the Arctic environment. Under the action of Arctic low temperatures and long-term alternating loads, the fatigue life of the submarine rudder stock mechanism is severely tested.
The fatigue life of the rudder stock due to the ship roll motion under random sea waves was examined by AS Mujahid et al., but temperature conditions lower than the normal operating temperature were not included in the calculation model [4]. Braun et al. presented a comprehensive review of the current state-of-the-art high-cycle fatigue strength assessment methods for steel structures subjected to subzero temperatures and provided an overview of how to account for temperature effects on the fatigue strength when designing steel structures [5]. They also experimentally analyzed the effect of subzero temperatures on the fatigue strength of butt-welded normal and high strength steel structures [6]. Wang et al. studied the low-temperature mechanical properties and low-temperature fatigue properties of polar icebreaker steel and concluded that the yield strength, tensile strength, and other static properties increase to varying degrees with decreasing temperature, the plasticity of the steel decreases, and the brittleness increases [7]. In conclusion, research on the fatigue of polar ships mainly focuses on the fatigue of hull structures under ice loads and low temperature loads, while research on the low temperature fatigue of machinery outside the sealed cabin is scarce.
In recent years, with the continuous development of computer technology and the wide application of finite element calculations, it is very common for scholars to combine fatigue analysis software (FE safe, nCode DesignLife, etc.,) with different fatigue design methods for fatigue analysis [8,9,10,11,12,13]. Md Asif Amin and Brian Veitch used the finite element method to evaluate the fatigue life of the Arctic Class Icebreaker profiler [14]. Astarry Nugroho et al. used the finite element method to analyze the steering system of ORCA fishing inspection vessels and checked each component of the steering system [15]. Li et al. used advanced hierarchical finite element technology to calculate the dangerous tooth load histories under the influence of system global elastic behavior, and the tooth probability fatigue strength was obtained through the gear low-cycle fatigue test and life distribution transformation method [16]. Li et al. used the layered finite element method to calculate the fatigue load history of gear teeth under the coupling of the overall elastic behavior of the system [17]. Li et al. analyzed the fatigue life of the main reducer gear considering electromagnetic braking and traditional friction braking based on the static analysis results and the S–N curve of materials [18].
In this paper, multibody dynamics, the finite element method, and tests are combined to study the fatigue life of the submarine rudder stock mechanism. The analysis flow chart is shown in Figure 1.
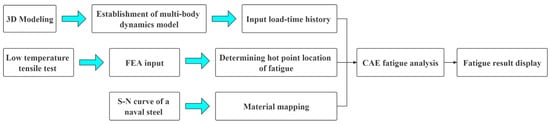
Figure 1.
Analysis flow chart.
2. Multibody Dynamics Analysis
The submarine elevator is used to control the attitude and direction of the submarine, which is composed of a rudder stock mechanism and hydraulic steering gear. The submarine elevator is a balanced nonwatertight rudder located at the stern of the submarine as a whole. It is a trapezoidal structure with double rudder blades and is fixed on the horizontal stabilizer wings on both sides of the submarine stern by a shaft connection. The hydraulic steering gear in the pressure resistant hull exerts axial push and pull on the transmission rod, and the force is transmitted to the guide rod through the guide device. The rod drives the linkage rod and the tiller to rotate, generating the rudder force to realize the floating and diving of the submarine.
2.1. Dynamic Analysis of the Rudder Stock Mechanism
After the three-dimensional model of the rudder stock is established, it is imported into the view function module of Adams dynamic analysis software by using the software interface. The left and right tillers are hinged on the connecting rod and have a rotation degree of freedom with the connecting rod, which can rotate around the connecting rod. One end of the guide rod is connected with the connecting rod and can rotate relative to the connecting rod. To omit the complicated driving device in the submarine pressure hull, a virtual crank is added to the structure to drive the mechanism. One end of the virtual crank is connected to the guide rod through the reaming hole, and it can rotate relative to the guide rod; the other end is connected to the virtual shell and can rotate relative to the shell. According to the motion principle of the rudder stock mechanism, rotation pairs are added in the software for the linkage and the hull, the crank and the guide rod, the guide rod and the linkage, and the tiller and the hull.
2.2. Simulation Parameter Setting
During dynamic analysis, it is necessary to define the materials of each part of the model. The software automatically calculates the mass of each part according to the density and volume of the materials and finally produces dynamic effects according to the mass and gravity acceleration. The parts of the submarine rudder stock mechanism are made of various types of high-strength structural steel with similar material densities, so the material type is steel.
The rudder stock mechanism is in the gravity field as a whole, so the gravity field is added to the whole model. In addition, the tiller is subject to a load, so a load needs to be added. To navigate in the complex ice area, submarines operating in the polar region will use surface manipulation in a large number of cases. When the submarine elevator operates at a fixed rudder angle, its rudder force and moment are calculated according to the following formulas:
where is the rudder force; is the rudder angle; is the density of seawater; is the speed of the submarine; and is the chord length of the rudder blade; is the rudder torque.
As the left and right tillers of the rudder stock are symmetrically arranged, the torque borne by the rudder stock is 1,440,000 N·m. The dynamic model after adding the constraint, drive, and load is shown in Figure 2.
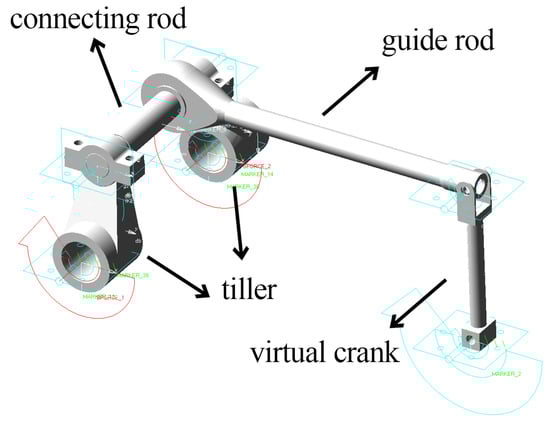
Figure 2.
Dynamic model after adding the load, constraint, and drive.
2.3. Simulation Analysis Process
In this paper, inverse simulation analysis is carried out by adding angular displacement to the connecting rod. The tiller rotates 30 degrees in the forward direction in 0–10 s, resets in 10–20 s, rotates 30 degrees in the reverse direction in 20–30 s, resets in 30–40 s, and the average speed is 3 degrees/s. Since the actual driving source is on the crank, the driving law of the driving source is unknown. Therefore, the drive on the tiller is first loaded, and then, the movement law of the crank is simulated. Then, the driving law is loaded on the crank to drive the movement of the whole device. The movement of the crank is shown in Figure 3.
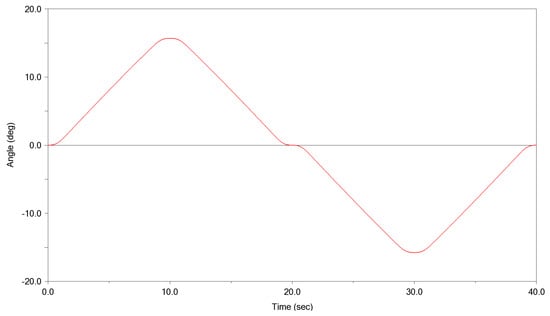
Figure 3.
Crank motion law.
In this paper, the interactive simulation solver is selected for simulation calculation. To ensure the accuracy of the simulation results and take into account the simulation efficiency, the simulation time is set as 40 s, and the number of simulation steps is 1000. The simulation results are shown in Figure 4, Figure 5, Figure 6, Figure 7 and Figure 8.
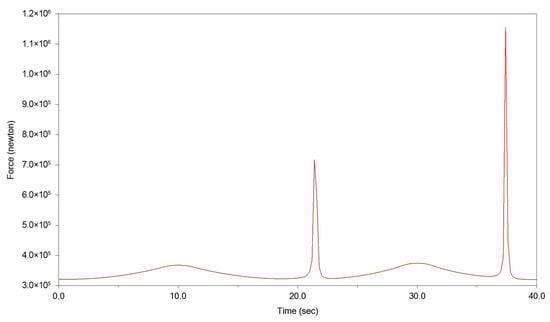
Figure 4.
Stress at the node of the guide rod and connecting rod.
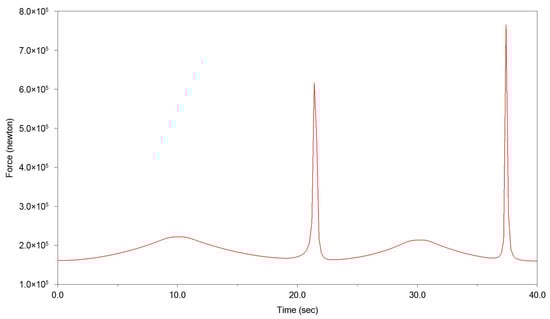
Figure 5.
Stress at the connection between the left tiller and connecting rod.
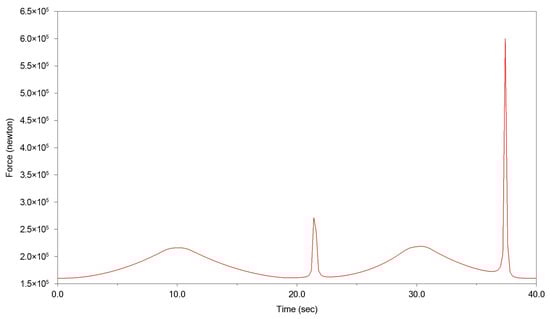
Figure 6.
Stress at the connection between the right tiller and connecting rod.
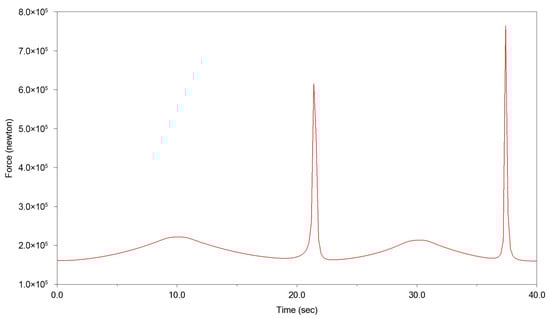
Figure 7.
Stress at the connection between the left tiller and the non-pressure hull.
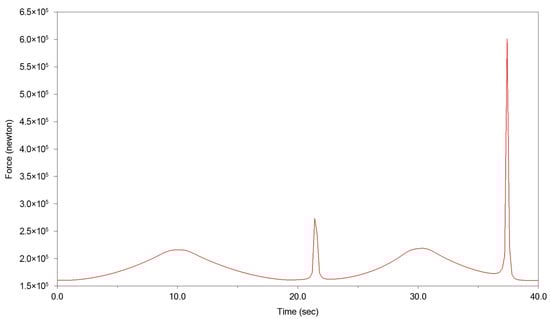
Figure 8.
Stress at the connection between the right tiller and the non-pressure hull.
During the working process of the rudder stock mechanism, the force curve of the above nodes changes with the rotation of the mechanism, and the force change curve is similar because under a certain load, the force of two adjacent mechanisms satisfies the relationship between the force and the reaction force. At the same time, it can be seen that there are two peaks in the curve, and the values there are far greater than those at other times. Therefore, the two points are numerical singularities. In the actual value, the two peaks are not considered, and the numerical singularities are eliminated. The maximum force value of each node is shown in Table 1.

Table 1.
Maximum force value of each node.
The analysis and simulation results show that the maximum force on each node occurs at the connection between the guide rod and the link, indicating that this is the fatigue hotspot of the mechanism. The multibody dynamics simulation analysis also gives its time history load spectrum, which provides data support for subsequent static analysis and fatigue analysis.
3. Static Analysis
3.1. Low-Temperature Tensile Test of a Naval Steel
In the components of the submarine rudder stock, the guide rod plays an important role in transmitting the torque of the steering gear. The connecting rod connects the guide rod and the tiller in series to form a complete connecting rod mechanism. The material used in the mechanism is a certain type of naval steel, and the mechanical properties of the steel will be reflected at low temperatures, mainly the increase in strength and decrease in toughness [19].
The average temperature in the Arctic Sea area is −20 °C to −40 °C in winter, up to −70 °C in extreme cases, and below 8 °C in summer [20]. ABS also provides for low polar design temperatures, giving the lowest design temperature for polar vessels at −60 °C degrees Celsius [21]. According to the temperature condition data, the working temperature range of the rudder stock mechanism of the submarine performing tasks in the Arctic is between 0 °C and −60 °C. To improve the accuracy of the simulation analysis, the authors carried out low-temperature tensile tests. The test temperatures are set as 0 °C, −20 °C, −40 °C, and −60 °C. Three test pieces were analyzed at each temperature. The test piece is shown in Figure 9. The test process and refrigerating system are shown in Figure 10.
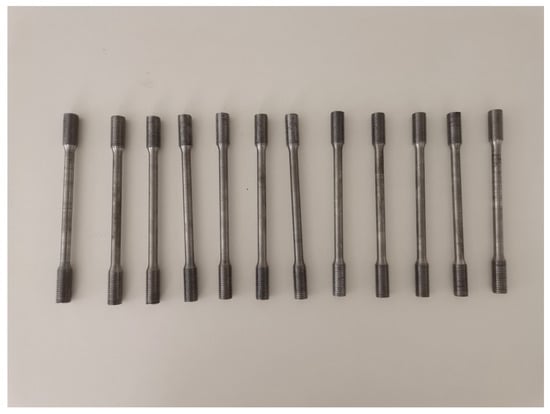
Figure 9.
Test piece.
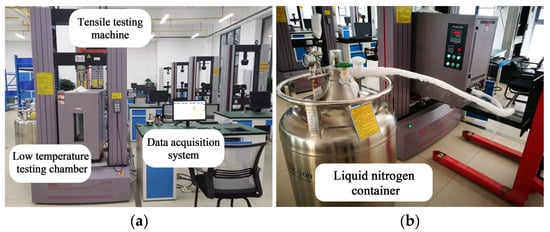
Figure 10.
(a) Test process; (b) Refrigerating system.
The stress-strain curves of a certain type of naval ship steel at the four temperatures can be obtained through the data acquisition software (Figure 11).
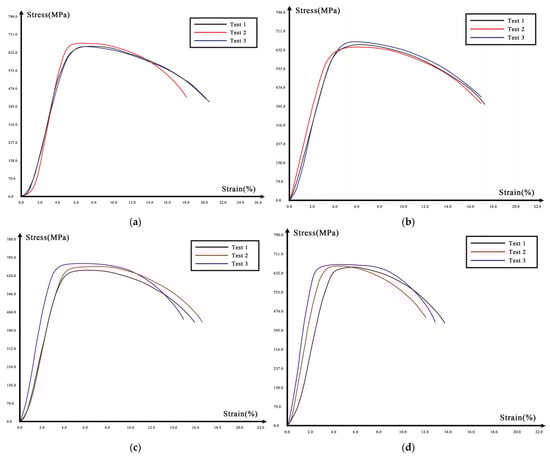
Figure 11.
Stress-strain curves at four temperatures. (a) 0 °C; (b) −20 °C; (c) −40 °C; and (d) −60 °C.
The changes of the tensile strength and yield strength with temperature are shown in Table 2.
Table 2.
The tensile strength and yield strength with temperature of a naval steel.
3.2. Finite Element Model
To simplify the calculation, the small structural parts of the model are removed. The simplified model is imported into Workbench through the software interface, and the automatic division method is selected to grid the mechanism. A total of 27,159 nodes and 11,469 units are generated. The FE meshing result is shown in Figure 12. Boundary conditions and the loading of FE model are shown in Figure 13.
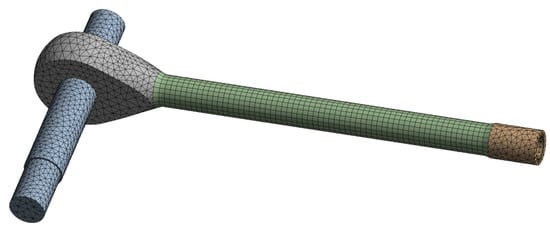
Figure 12.
FE mesh.
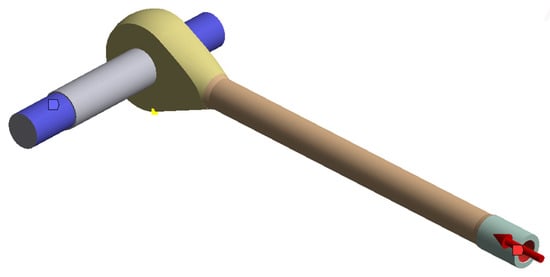
Figure 13.
Boundary conditions and the loading of FE model.
3.3. Static Simulation Analysis Results
Based on the calculation of the rudder force of the rudder stock, the equivalent stress distribution of the rudder stock mechanism is obtained by imposing static loads and constraints on the structure. According to the calculation of Workbench, the maximum stresses at 0 °C, −20 °C, −40 °C, and −60 °C are 170.94 MPa, 181.15 Mpa, 228.37 Mpa, and 275.58 MPa, respectively. The stress nephogram is shown in Figure 14.
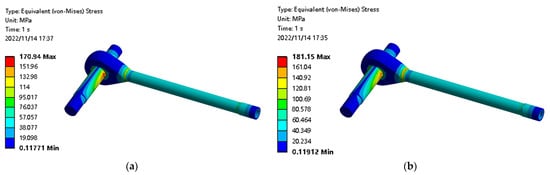
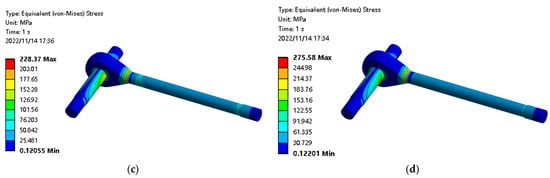
Figure 14.
Stress nephogram of the rudder stock mechanism at four temperatures. (a) 0 °C; (b) −20 °C; (c) −40 °C; and (d) −60 °C.
The stress concentration occurs at the joint of the guide rod and the connecting rod, which is consistent with the multibody dynamics simulation results. With decreasing temperature, the maximum stress of the rudder stock mechanism shows a nonlinear upward trend.
4. Fatigue Life Analysis
4.1. Compilation of the Load Spectrum
As an important factor affecting fatigue analysis, the load spectrum determines the accuracy of the final results of the fatigue analysis. The load spectrum in the fatigue analysis is divided into the time series load spectrum, time step load spectrum, constant amplitude load spectrum, etc. According to the actual working condition of the submarine rudder stock, the static fatigue analysis method is adopted, and the load spectrum is determined as the time series load spectrum.
In the preparation of the load spectrum, the data relationship between the actual force and time of many mechanisms is not easy to collect, so many scholars use the method of multibody dynamics simulation to prepare the load spectrum. Zhang et al. carried out a dynamic simulation analysis for the transmission mechanism of the cross rudder of a sightseeing mini-submarine, and the variation tendency of the contact force between the tiller and piston rod was obtained through simulation results [22]. Moritz et al. used numerical models to simulate the dynamic ice-, wind-, and wave-structure interaction, which can then be used as a loading sequence for the fatigue assessment or fatigue testing of the welded joints of offshore wind turbine support structures [23].
Since it is difficult to obtain data from the actual time history load spectra of the submarine rudder stock, the curves obtained in Section 2 are used as the time series load spectra in this section.
4.2. Fatigue Analysis Method
The fatigue life commonly refers to the number of cycles of stress or strain that parts endure when they fail due to fatigue.
Current fatigue analysis methods are divided into three main categories [24]:
- The first is the S–N method, which is used to calculate the stress of a member that does not reach the yield strength of the material. It is mainly used to calculate the high cycle fatigue life. This method studies the life of the member before fatigue failure;
- The second is the E–N method, which is used to calculate the local stress–strain of a member when its stress reaches the yield strength but does not reach the tensile strength. It is mainly used for the calculation of low cycle fatigue life, which studies the life from local strain to crack initiation;
- Third, the method of crack propagation life is used to study the fatigue life of components after cracks occur, which is based on the theory of fracture mechanics. This method reveals the essence of fatigue life from a micro perspective. However, due to the high theoretical requirements for fracture mechanics, it is difficult to apply this method widely in engineering practice.
The rudder stock mechanism belongs to the high cycle fatigue type, so the S–N method is selected for the fatigue life analysis. Its theoretical basis is the fatigue cumulative damage hypothesis (Miner criterion). It is assumed that fatigue damage and failure are linear cumulative processes that ultimately reach the failure limit value, which leads to fatigue failure.
The fatigue characteristic parameters of the materials of the submarine rudder stock mechanism have a decisive influence on the fatigue life. Therefore, only by obtaining accurate fatigue characteristic parameters of the materials, the exact fatigue life can be obtained. The conventional group test method for obtaining S–N curve is a time-consuming and expensive test program [25]. In fatigue research, it is a common method to infer the S–N curve of materials through static stress data and modify the existing curve. Alvaro provided an overview of how to account for temperature effects on fatigue strength when designing steel structures [26]. The method proposed by Dong [27] is used to modify the S–N curve of naval steel, and the S–N curve of a naval steel at low temperature is obtained (Figure 15).
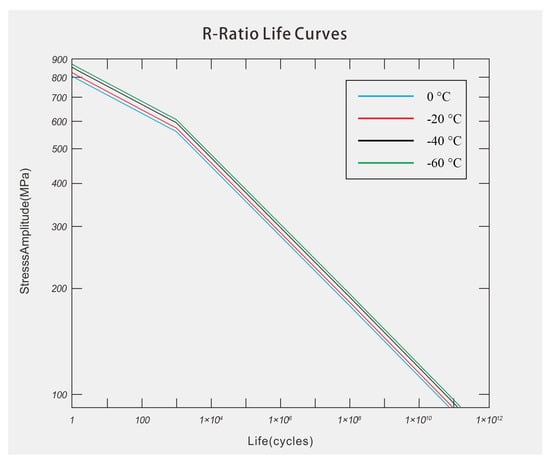
Figure 15.
S–N curve of a naval steel at low temperature.
4.3. Fatigue Life Analysis Results
The nCode DesignLife is integrated on Workbench platform and is positioned as an integrated fatigue durability engineering solution. Its functions are mainly divided into fatigue data acquisition, post-processing of stress output results, and fatigue cloud generation, providing users with advanced fatigue analysis methods. The fatigue analysis module can be initiated after completing the static calculation. Through the analysis type selected in Workbench, the S–N static fatigue analysis process is automatically established in nCode DesignLife. After setting the parameters of each module, the fatigue life nephogram of the rudder stock mechanism is obtained, as shown in Figure 16.
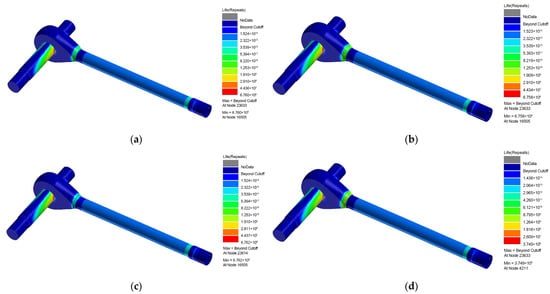
Figure 16.
Fatigue life nephogram of the rudder stock mechanism at four temperatures. (a) 0 °C; (b) −20 °C; (c) −40 °C; and (d) −60 °C.
It can be seen from the figure that:
- The severely damaged area of the rudder stock mechanism is located at the connection between the guide rod and the connecting rod. With the temperature decreasing in a gradient, the fatigue hotspot position is transferred from the connection between the guide rod and the connecting rod to the front end of the guide rod.
- When the temperature is 0 °C, 20 °C, and 40 °C, there is no significant difference in the fatigue life of the rudder stock mechanism.
- When the temperature is reduced to −60 °C, compared with the previous temperature, the fatigue life suddenly decreases from 6.72 × 10⁶ to 3.74 × 10⁶. The reason may be that the substantial increase in the equivalent stress is related to the material properties of the steel structure itself.
5. Conclusions
In this paper, the static strength analysis and fatigue life analysis of the submarine rudder stock mechanism at low temperatures in the Arctic are carried out using the research methods of multibody dynamics, finite element analysis, and experimentation.
- The fatigue hotspot of the mechanism is located at the joint of the guide rod and the connecting rod.
- With the temperature decreasing from 0 °C to 60 °C, the fatigue life of the submarine rudder stock mechanism is significantly shortened.
- This analysis forms a method to obtain the time history load spectrum by using multibody dynamics analysis and to analyze the fatigue life of the rudder stock mechanism by connecting a low-temperature test, static analysis, and fatigue life analysis in series, which provides a solution idea and means for fatigue analysis of the rudder stock mechanism and lays a foundation for establishing the life model and optimal design of submarine mechanical structures under Arctic low temperatures in the future.
- To obtain a more accurate fatigue life, factors such as the ductile brittle transition of steel structures at low temperature and the low-temperature fatigue of welded joints should also be considered. The load spectrum should also select the measured data from the submarine as a reference. The next step will be devoted to research in this field.
Author Contributions
Conceptualization, S.C. and W.G.; methodology, S.C.; software, C.C.; validation, L.Y., H.C. and J.H.; formal analysis, S.C.; investigation, J.Z.; resources, W.G.; data curation, L.Y.; writing—original draft preparation, S.C.; writing—review and editing, H.C.; visualization, H.C. All authors have read and agreed to the published version of the manuscript.
Funding
This research was funded by the “13th Five Year Plan” Dual Program (grant nos. 3901C9), China.
Institutional Review Board Statement
Not applicable.
Informed Consent Statement
Not applicable.
Data Availability Statement
Not applicable.
Acknowledgments
We acknowledge the support provided to this study by Naval University of Engineering in the form of time and facilities.
Conflicts of Interest
The authors declare no conflict of interest.
References
- Makarova, I.; Makarov, D.; Buyvol, P.; Barinov, A.; Gubacheva, L.; Mukhametdinov, E.; Mavrin, V. Arctic Development in Connection with the Northern Sea Route: A Review of Ecological Risks and Ways to Avoid Them. J. Mar. Sci. Eng. 2022, 10, 1415. [Google Scholar] [CrossRef]
- Zuo, P. A Study on Polar Strategy, 1st ed.; Current Affairs Press: Beijing, China, 2018; pp. 12–13. [Google Scholar]
- Huang, J. Research on the Influence of Arctic Navigation on the Navigation Performance of Submarine. Ship Electron. Eng. 2020, 40, 62–66. [Google Scholar]
- Mujahid, A.S.; Nugroho, W.H. A Prediction Method of Fatigue Life at The Rudder Stock. Sci. Eng. 2017, 9, 1–6. [Google Scholar]
- Braun, M.; Milakovi, A.S.; Ehlers, S.; Kahl, A.; Fischer, C. Sub-Zero Temperature Fatigue Strength of Butt-Welded Normal and High-Strength Steel Joints for Ships and Offshore Structures in Arctic Regions. In Proceedings of the ASME 2020 39th International Conference on Ocean, Offshore and Arctic Engineering, Online, 3–7 August 2020. [Google Scholar]
- Braun, M.; Ehlers, S. Review of methods for the high-cycle fatigue strength assessment of steel structures subjected to sub-zero temperature. Mar. Struct. 2022, 82, 103153. [Google Scholar] [CrossRef]
- Wang, K.; Wu, L.; Li, Y.-Z.; Qin, C. Experimental study on low temperature fatigue performance of polar icebreaking ship steel. Ocean. Eng. 2020, 216, 107789. [Google Scholar] [CrossRef]
- Lan, Q.; Song, F. Fatigue Simulation of Railway Car Bogie Frame Based on Multi-body Dynamics and Finite Element Analysis. Proc. J. Phys. Conf. Ser. 2021, 1885, 042057. [Google Scholar] [CrossRef]
- Wu, N.; Wang, Y.; Wei, M. Fatigue life analysis of driving shaft of conveyor system based on nCode design-life. Int. Core J. Eng. 2019, 5, 174–179. [Google Scholar]
- Chen, S.; Yang, Y.; Wang, T.; Zhang, J. Analysis of fatigue characteristics of gears based on NCode designlife. Proc. IOP Conf. Ser. Mater. Sci. Eng. 2019, 542, 012076. [Google Scholar] [CrossRef]
- Tenghiri, L.; Khalil, Y.; Abdi, F.; Bentamy, A. Structural design and analysis of a small wind turbine blade using Simple Load Model, FAST-MLife codes, and ANSYS nCode DesignLife. Wind. Eng. 2019, 45, 0309524X1988243. [Google Scholar] [CrossRef]
- Li, C.; Song, S.; Han, Z. Fatigue Reliability Analysis of Frame Based on nCode Design-Life. J. Graph. 2014, 35, 42–45. [Google Scholar]
- Gorash, Y.; Comlekci, T.; Mackenzie, D. Comparative study of FE-models and material data for fatigue life assessments of welded thin-walled cross-beam connections. Procedia Eng. 2015, 133, 420–432. [Google Scholar] [CrossRef][Green Version]
- Amin, M.A.; Veitch, B. Application of Polar Class Rules for Fatigue to an Existing Arctic Class Icebreaker Propeller. In Proceedings of the Fifth International Symposium on Marine Propulsors smp’17, Espoo, Finland, 12–15 June 2017. [Google Scholar]
- Nugroho, A.; Nubli, H.; Prabowo, A.R.; Yudo, H. Finite element based analysis of steering construction system of orca class fisheries inspection ship. Procedia Struct. Integr. 2020, 27, 46–53. [Google Scholar] [CrossRef]
- Alshoaibi, A.M.; Bashiri, A.H. Adaptive Finite Element Modeling of Linear Elastic Fatigue Crack Growth. Materials 2022, 15, 7632. [Google Scholar] [CrossRef] [PubMed]
- Li, M.; Luo, Y.; Xie, L. Fatigue Reliability Design Method for Large Aviation Planetary System Considering the Flexibility of the Ring Gear. Appl. Sci. 2022, 12, 10361. [Google Scholar] [CrossRef]
- Du, J.; Wu, X.; Mao, J. Fatigue Life Analysis of Main Reducer Gears for Battery Electric Bus Considering Regenerative Braking. Appl. Sci. 2022, 12, 7205. [Google Scholar] [CrossRef]
- Wang, Y.; Liao, X.; Shi, Y.; Jia, D. Overview of research progress for the Low-Temperature fatigue performance of steel structures. Prog. Steel Build. Struct. 2018, 20, 11. [Google Scholar]
- Garcia-Soto, C.; Cheng, L.; Caesar, L.; Schmidtko, S.; Jewett, E.B.; Cheripka, A.; Rigor, I.; Caballero, A.; Chiba, S.; Báez, J.C. An overview of ocean climate change indicators: Sea surface temperature, ocean heat content, ocean pH, dissolved oxygen concentration, arctic sea ice extent, thickness and volume, sea level and strength of the AMOC (Atlantic Meridional Overturning Circulation). Front. Mar. Sci. 2021. [Google Scholar] [CrossRef]
- ABS. Guide for Vessels Operating in Low Temperature Environments; American Bureau of Shipping: Houston, TX, USA, 2015. [Google Scholar]
- Zhang, X.; Chen, T.; Li, L.W.; Cui, W.W.; Cui, J.J.; Cao, Y.; Zhao, H.R. Dynamics simulation study on transmission mechanism of cross rudder for sightseeing mini-submarine. Proc. Appl. Mech. Mater. 2011, 88, 684–687. [Google Scholar] [CrossRef]
- Braun, M.; Dörner, A.; ter Veer, K.F.; Willems, T.; Seidel, M.; Hendrikse, H.; Høyland, K.V.; Fischer, C.; Ehlers, S. Development of Combined Load Spectra for Offshore Structures Subjected to Wind, Wave, and Ice Loading. Energies 2022, 15, 559. [Google Scholar] [CrossRef]
- Kamal, M.; Rahman, M. Advances in fatigue life modeling: A review. Renew. Sustain. Energy Rev. 2018, 82, 940–949. [Google Scholar] [CrossRef]
- Gao, J.; Xu, R.; Wu, Z.; Zhu, P. A general method for determining probabilistic S–N curve based on static strength data of material. Proc. Inst. Mech. Eng. Part C J. Mech. Eng. Sci. 2022, 236, 4862–4875. [Google Scholar] [CrossRef]
- Alvaro, A.; Akselsen, O.M.; Ren, X.; Kaneko, A. Fundamental aspects of fatigue of steel in Arctic applications. In Proceedings of the Twenty-fourth International Ocean and Polar Engineering Conference, Busan, Republic of Korea, 15–20 June 2014. [Google Scholar]
- Dong, P.; Hong, J. The master SN curve approach to fatigue evaluation of offshore and marine structures. In Proceedings of the International Conference on Offshore Mechanics and Arctic Engineering, Vancouver, BC, Canada, 20–25 June 2004; pp. 847–855. [Google Scholar]
Disclaimer/Publisher’s Note: The statements, opinions and data contained in all publications are solely those of the individual author(s) and contributor(s) and not of MDPI and/or the editor(s). MDPI and/or the editor(s) disclaim responsibility for any injury to people or property resulting from any ideas, methods, instructions or products referred to in the content. |
© 2022 by the authors. Licensee MDPI, Basel, Switzerland. This article is an open access article distributed under the terms and conditions of the Creative Commons Attribution (CC BY) license (https://creativecommons.org/licenses/by/4.0/).