Article

Effects of Vibration on Adjacent Pipelines under Blasting Excavation

Faculty of Engineering, China University of Geosciences, Wuhan 430074, China
*
Author to whom correspondence should be addressed.
Appl. Sci. 2023, 13(1), 121; https://doi.org/10.3390/app13010121
Submission received: 10 November 2022 / Revised: 20 December 2022 / Accepted: 20 December 2022 / Published: 22 December 2022
(This article belongs to the Special Issue Advances in Underground Pipeline Technology)

Abstract

:
Exploring a pipeline’s response to blast vibration during tunnel excavation is critical for ensuring the safety of the pipeline. In this paper, the vibration monitoring and numerical simulation methods are used to evaluate the dynamic response of ground soil and pipelines to blasts. The attenuation law of peak particle velocity (PPV) and the distribution characteristics of peak effective stress (PES) in pipe sections under different working conditions are studied. The following findings are recorded: (1) A three-dimensional model considering in situ stress is established, and it is found the triangular equivalent load simulation blast effect method used in this paper can effectively reflect the impact of blasting on pipelines. The simulation error is controlled at 7.69%. (2) The ground PPV of each monitoring point decays continuously with the increase in horizontal and axial distance, and the cavity enlargement effect is exhibited above the excavation area. The oncoming blast side PPV of the pipe section is more significant than that behind the blast side. (3) When the blast vibration is transmitted to the pipe, there are differences in the PPV and PES distribution characteristics across the pipe cross-section. The PPV is greater in the lower part of the pipe section, while the PES value is greater in the upper part of the pipe section. The maximum PES of 1.53 MPa is significantly lower than the safety threshold (≤4.6 MPa) at the hazardous-section-monitoring point. (4) A pipeline PPV prediction model is proposed to guide subsequent blasting program development. An empirical formula for the safety criterion applicable to this study is proposed for the scientific implementation of safety assessments for subsequent construction. This safety evaluation framework can be used as a reference for similar projects.

1. Introduction

Drilling and blasting are common techniques for excavating underground spaces, and their main advantages are their low cost and high efficiency [1]. However, the blast wave generated during the blasting process may harm the underground space cavern structure and the surrounding rock and even impact the stability of the surface structure [2,3]. To guarantee the safety and stability of buried pipes, it is essential to scientifically assess blast vibration impact on buried pipes and control the adverse effects of blast vibration.
At present, researchers have extensively studied the effects of high-strain rates and loading conditions, such as blast shock loads, on buried pipelines [4,5,6,7,8]. To ensure the pipelines can serve under blast loads, researchers have developed relevant safety standards, but there are discrepancies in their conclusions [9,10,11]. It has also been found that due to the influences of geological conditions, pipe materials, and types, the responses of different pipes to the same explosion source vary. Researchers have explored different perspectives to analyze pipeline response characteristics effectively. Kouretzis et al. studied the pipeline strain characteristics of the P-wave and Rayleigh wave through theoretical analysis [12]. Esparza et al. proposed relevant empirical equations to analyze the effects of blast impact loading [13]. With the development of science and technology, people have begun to use numerical simulation methods combined with field tests to study the effects of explosive loading on pipelines [14,15,16]. Previous studies have focused on pipeline dynamic response characteristics and influencing factors [17]. For example, Zhu Bin et al. investigated the effects upon adjacent pipelines during rock-blasting excavation in soil layers using numerical simulation methods [18]. Yandong Qu et al. investigated the dynamic response of buried polyethylene pipes to blast impact loads and analyzed the influencing factors using numerical simulation [19]. Giannaros et al. investigated the blast response of a glass fiber reinforced polymer pipeline using numerical simulation [20]. Parviz et al. analyzed the response characteristics of water and pipes under blast vibration using numerical simulations [21].
This study is based on a blasting construction project and used a buried pipeline as its research object (Section 2). Firstly, the propagation law of blasting vibration was conducted by developing a surface soil PPV prediction model (Section 3). Secondly, a three-dimensional numerical model considering in situ stress was established to analyze the response characteristics of the buried pipe under blasting vibration using the finite element analysis software, ANSYS/LS-DYNA (Section 4). Finally, the dynamic response characteristics of the buried pipe and the attached soil were analyzed, and the safety criterion was proposed (Section 5). This paper serves as a case study to comprehensively assess the safety of pipelines subjected to blast shock loads, focusing on the dynamic response characteristics of soil and pipelines to blast vibration.

2. Experimental Design of Blasting Vibration

2.1. Background and Blasting Parameters

Figure 1 depicts the location of the water conveyance tunnel excavation project in the Haishu district of Ningbo, Zhejiang Province. The main cave is buried at a depth of 22–36 m with a 14 m height gap. Erosion hills are the main geomorphic feature of the region. The surrounding rocks under the soil layers are sintered tuff and were developed with good joints for better homogeneity belonging to Jurassic Xishantou Formation (J3b) with a grade of IV. There are residential areas and gas pipeline networks located above the tunnel. The tunnel crosses through and perpendicularly intersects with a ductile iron pipeline. The vertical distance between the pipe and the blast source is 19 m and is 3 m from the ground. The pipe diameter is 500 mm, and the wall thickness is 10 mm.
This paper employs full-section smooth blasting excavation, with the excavation section being horseshoe-shaped and the tunnel face measuring 3.2 m in height and 2.6 m in width (Figure 2). Seven detonation sections were set up in the cut, relief, auxiliary, perimeter, and bottom sections, respectively. An empty hole was set to expand the free surface of the cut blasting, and the single consumption of the cutting section was increased to reduce the blasting restraint effect. Table 1 shows the blasting parameters.

2.2. Layout of the Measurement Point

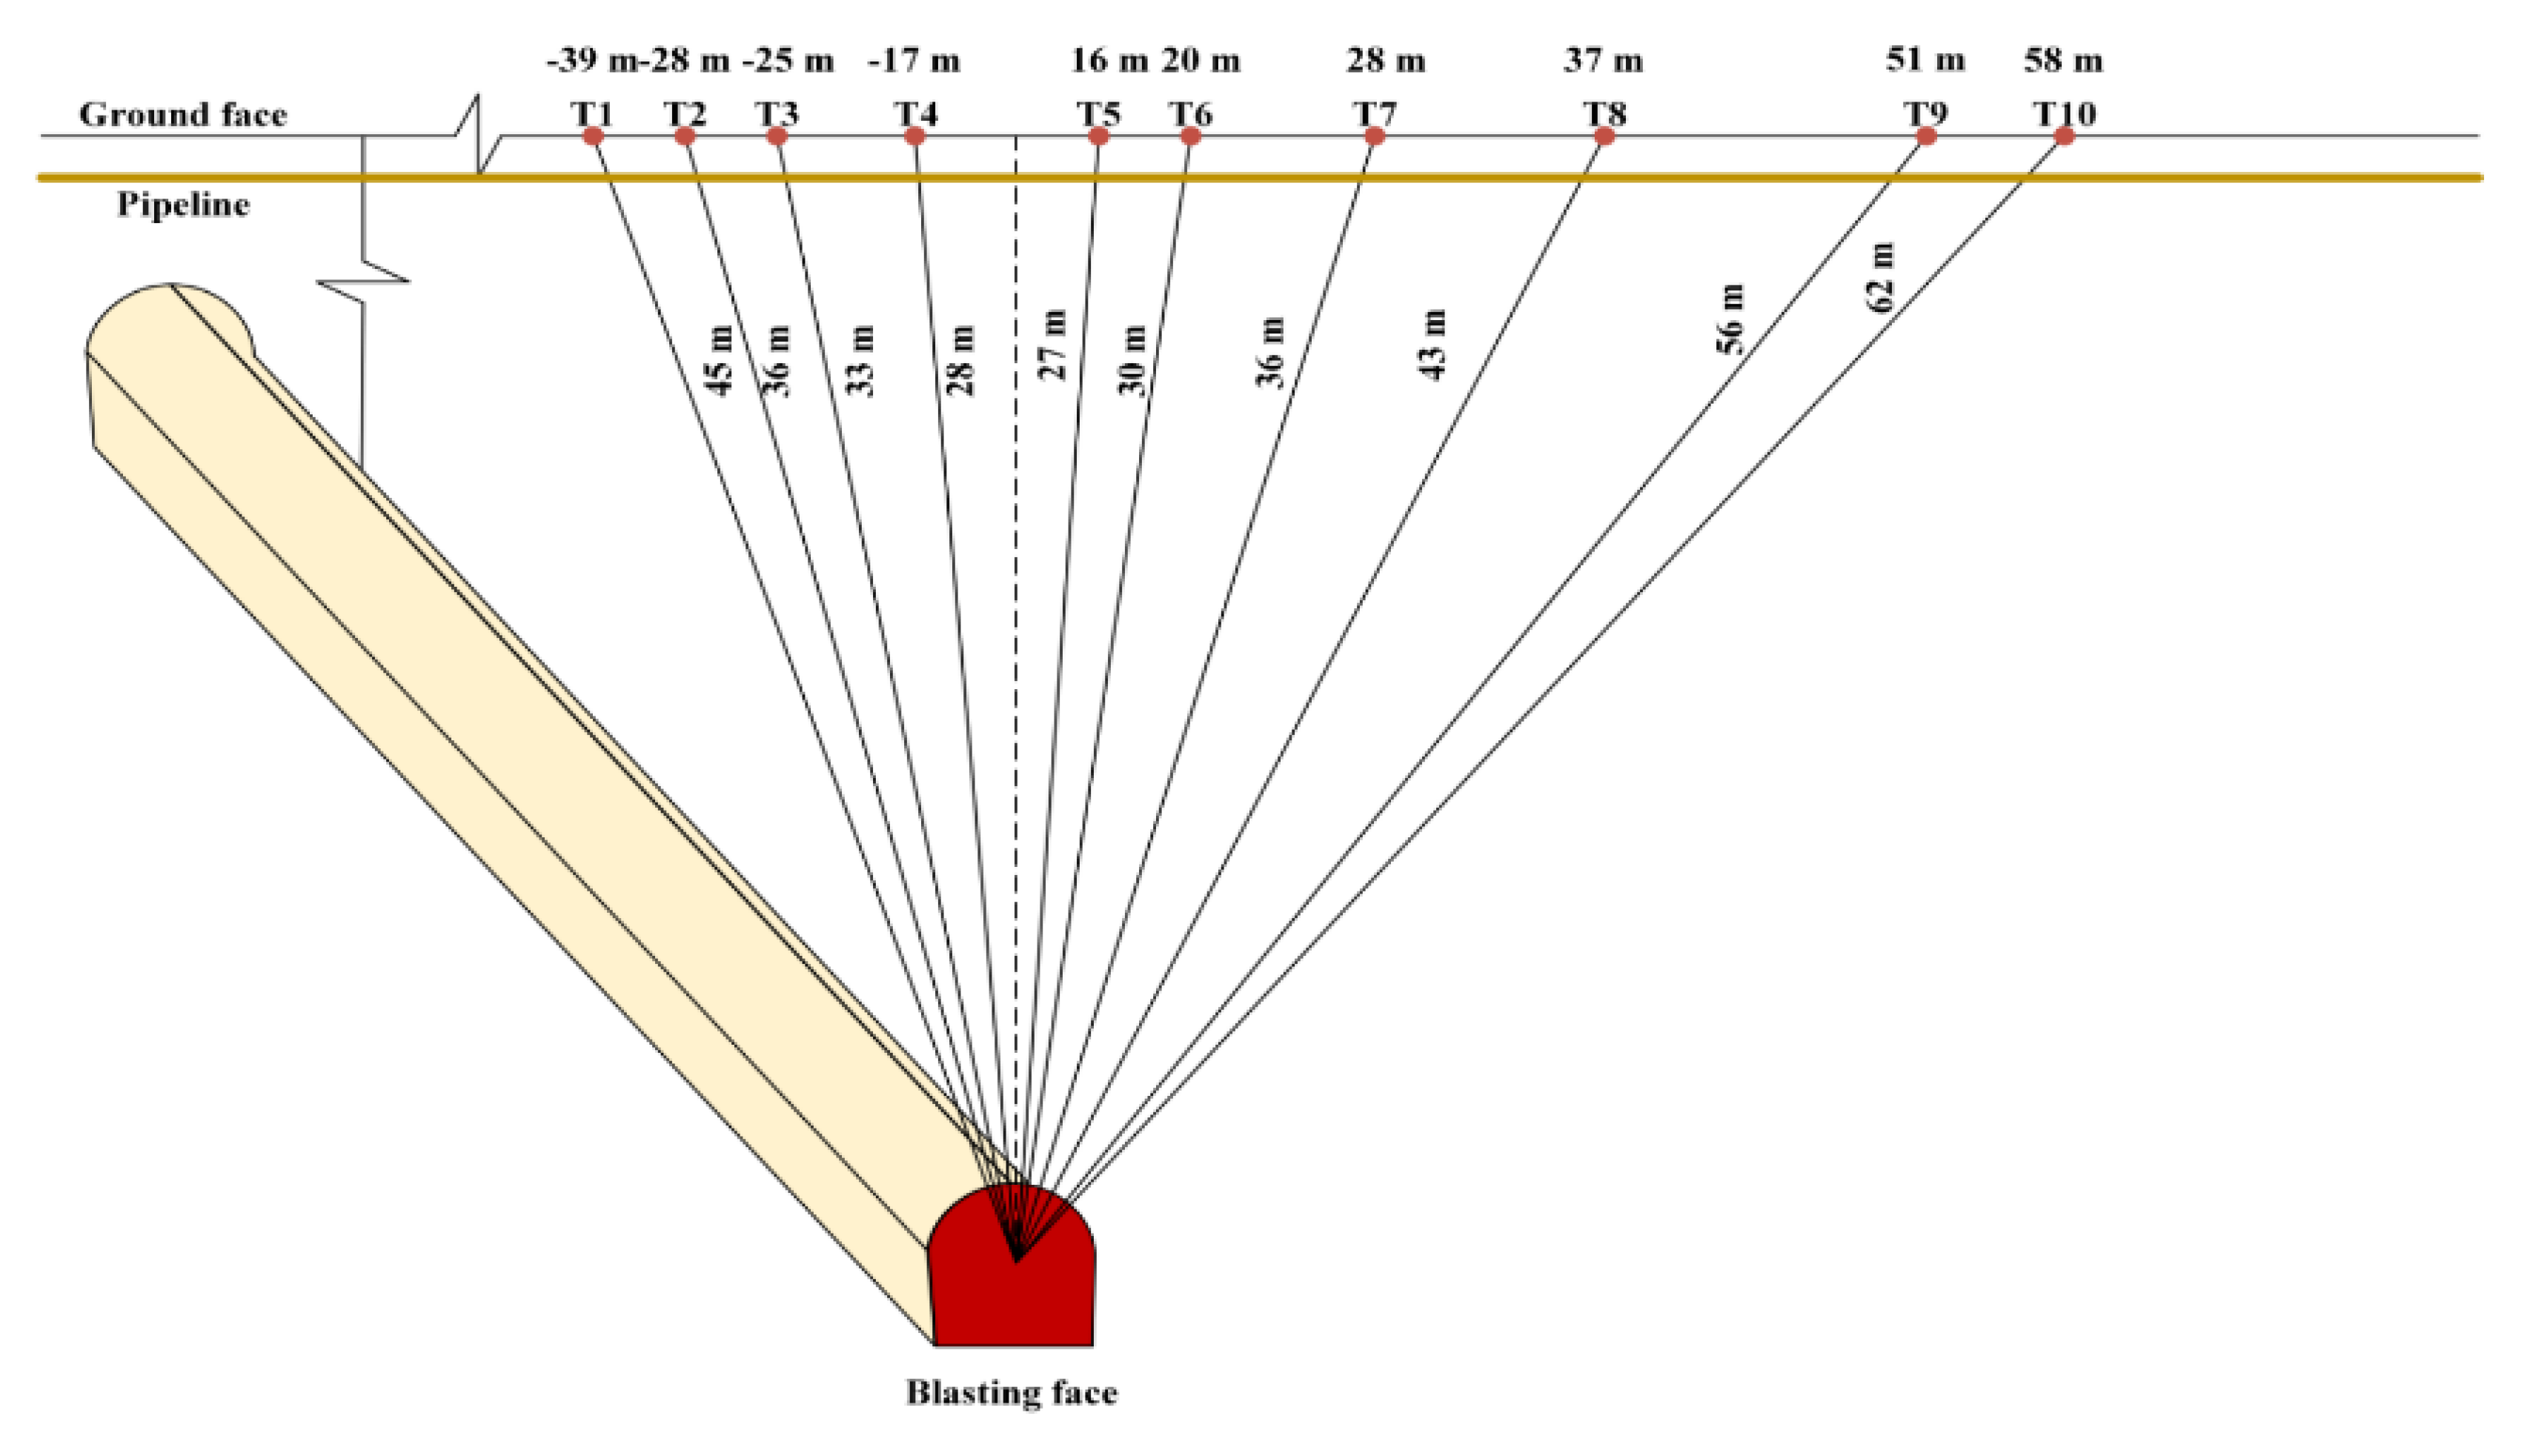
The TC-4850 blast vibration test instrument was used for collecting the vibration signals. This vibration test instrument has recording channels in the horizontal and axial directions, X, Y, and the vertical direction, Z. The recording channels effectively collect the particle vibration waveform, peak particle velocity, main frequency, duration, and other parameters in these three directions. This is an essential operation that connects the vibration test instrument to a PC terminal to transfer and analyze the data. The flow is shown in Figure 3. The vibration instrument takes a sampling frequency of 4000 points each second and has a vibration collection range of 125 mm/s, resolution of 0.012 mm/s, recording frequency in the range of 5–500 Hz, and measurement error of ±5% ±2 digits. During testing, it is necessary to keep the sensor in close contact with the surface of the measuring point, and plaster bonding is required to ensure stability. Because of environmental constraints, the pipeline could not be surveyed directly; thus, ten working points were simultaneously placed directly above the buried pipeline from the blast source of the horizontal distance of the 16–58 m range (Figure 4).

2.3. Monitoring Results Analysis

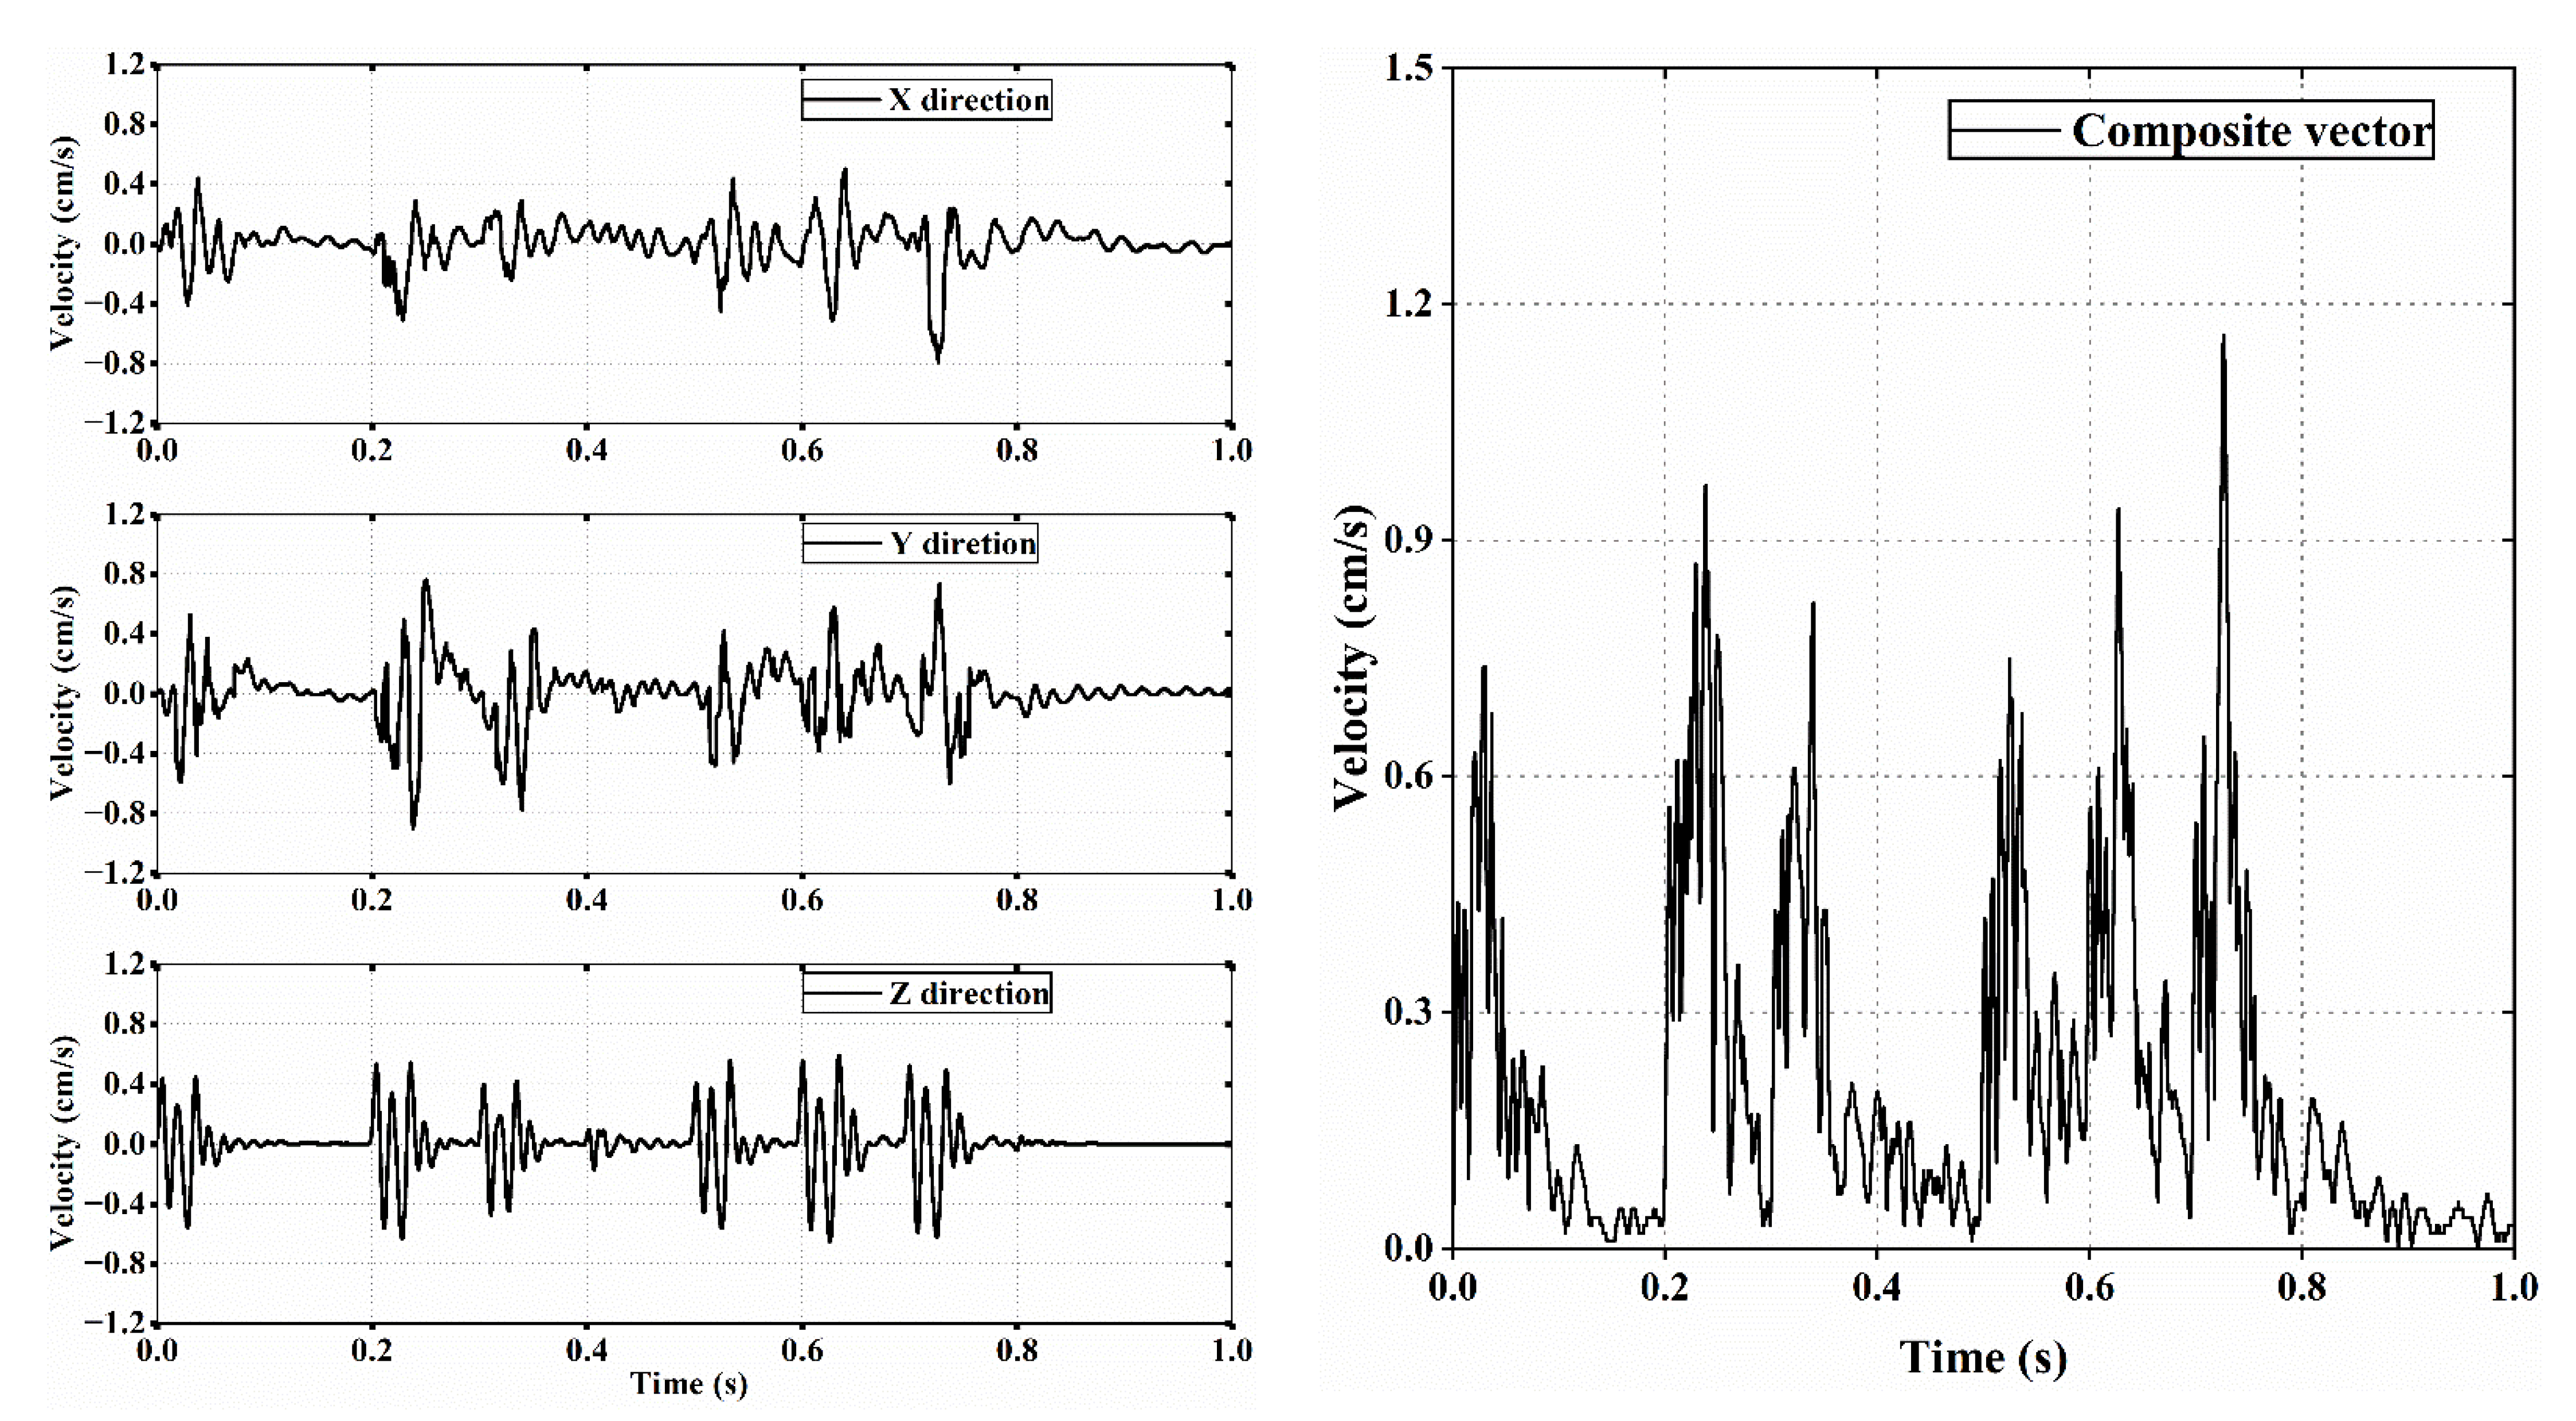
Ten separate blasts were surveyed on-site. Figure 5 shows the recording signal typical waveform at T5. The results are shown in Table 2. It can be observed the maximum PPV occurred at point T5 at 1.36 cm/s, and the minimum occurred at point T10 at 0.72 cm/s. The PPV distribution characteristics on both sides of the blast source show the PPV decreased by 0.15 cm/s, 0.13 cm/s, 0.14 cm/s, and 0.23 cm/s in three directions and composite vectors above the excavated area. In comparison, it decreased by 0.4 cm/s, 0.4 cm/s, 0.3 cm/s, and 0.64 cm/s above the unexcavated area, respectively. The PPV attenuation above the excavated area was significantly lower than the PPV attenuation in the unexcavated area, which indicates that the ground vibration was amplified when the blasting vibration was propagated in the excavated cavity area. Considering the maximum PPV was only 1.36 cm/s, the damage or destruction to the buried pipeline due to blasting excavation was limited.

3. Blast Vibration Attenuation Law

A robust regression analysis method was used to reflect the propagation law of the tunnel blast vibration. First, the classical Sadovski’s PPV empirical formula is introduced as follows.
The PPV ( v ) value is expressed in the following form using mathematical analysis:
v = Φ Q , μ , c , ρ , γ , d , a , f , t
The right side of Equation (1) shows the main variables for attenuating blast vibration propagation on the ground (Table 3). Q, r, and c are independent, and the following equation can be drawn from Buckingham’s pi theorem in dimensional analysis [22]:
π 0 = v Q α 0 r β 0 c γ 0 , π 1 = μ Q α 1 r β 1 c γ 1 , π 2 = ρ Q α 2 r β 2 c γ 2 π 3 = d Q α 3 r β 3 c γ 3 , π 4 = a Q α 4 r β 4 c γ 4 π 5 = f Q α 5 r β 5 c γ 5 , π 6 = t Q α 6 r β 6 c γ 6
Given the dependent variable dimensionless form of π n , where n = 1 , 2 , , 6 , and where the indices, α n , β n , and γ n , are also dimensionless. In addition, given the formula for π n :
π 0 = v c , π 1 = μ r , π 2 = ρ Q r 3 π 3 = d r , π 4 = a r 1 c 2 π 5 = f r 1 c , π 6 = t r c 1
In substituting Equation (3) into Equation (1), we can arrive at the following equation:
v c = Φ μ r , ρ Q r 3 , d r , a r 1 c 2 , f r 1 c , t r c 1
Next, combining the above given, π 2 , π 3 , and π 4 , a new dimensionless parameter π 7 can be derived:
π 7 = π 2 1 3 β 1 π 3 β 2 = ρ r 3 Q 3 β 1 d r β 2
where β 1 and β 2 are the correlation coefficients of π 1 and π 2 . ρ and c can be assumed as constants, and we can analytically conclude the functional relationship between v and 1 Q 1 / 3 r 1 β 1 d v β 2 by Equation (4), which can be written as:
ln v = α 1 + β 1 ln Q 3 r + α 2 + β 2 ln d r
Let ln v 0 = α 1 + β 1 ln Q 3 r ; then, the following equation is derived:
ln v 0 = α 1 + β 1 ln Q / 3 β 1 ln r
where α 1 and α 2 are environmental coefficients related to the geological conditions, and β 1 is the attenuation index related closely to the medium. β 1 ln r represents the PPV attenuation with r rising, and α 1 + β 1 ln Q / 3 reflects the impact of the medium and explosive charges.
In setting ln k 1 = ln α 1 , then
v 0 = k 1 Q 3 r β 1
where k and β are the site coefficients related to the geological conditions, Q is the maximum charge per hole, and r is the length of the blast source.
The above equation is transformed into logarithmic form:
ln v = ln k + β ln ρ ρ = Q 3 r
The above equation is expressed in the form of a binary primary function:
y = a x + b
where y = ln v , x = ln ρ , a = β , and b = ln k .
Table 4 shows the PPV prediction model for each direction of the ground soil and the correlation coefficient. A good fit result was obtained in which all had high-fitting accuracy and where the composite vector, PPV, had the highest correlation coefficient of 0.89. Therefore, it is workable for Equation (11) to reflect the vibration propagation law by using the following model.
P P V = 70.17 Q 1 3 r 1.31

4. Numerical Simulation and Dynamic Response Analysis

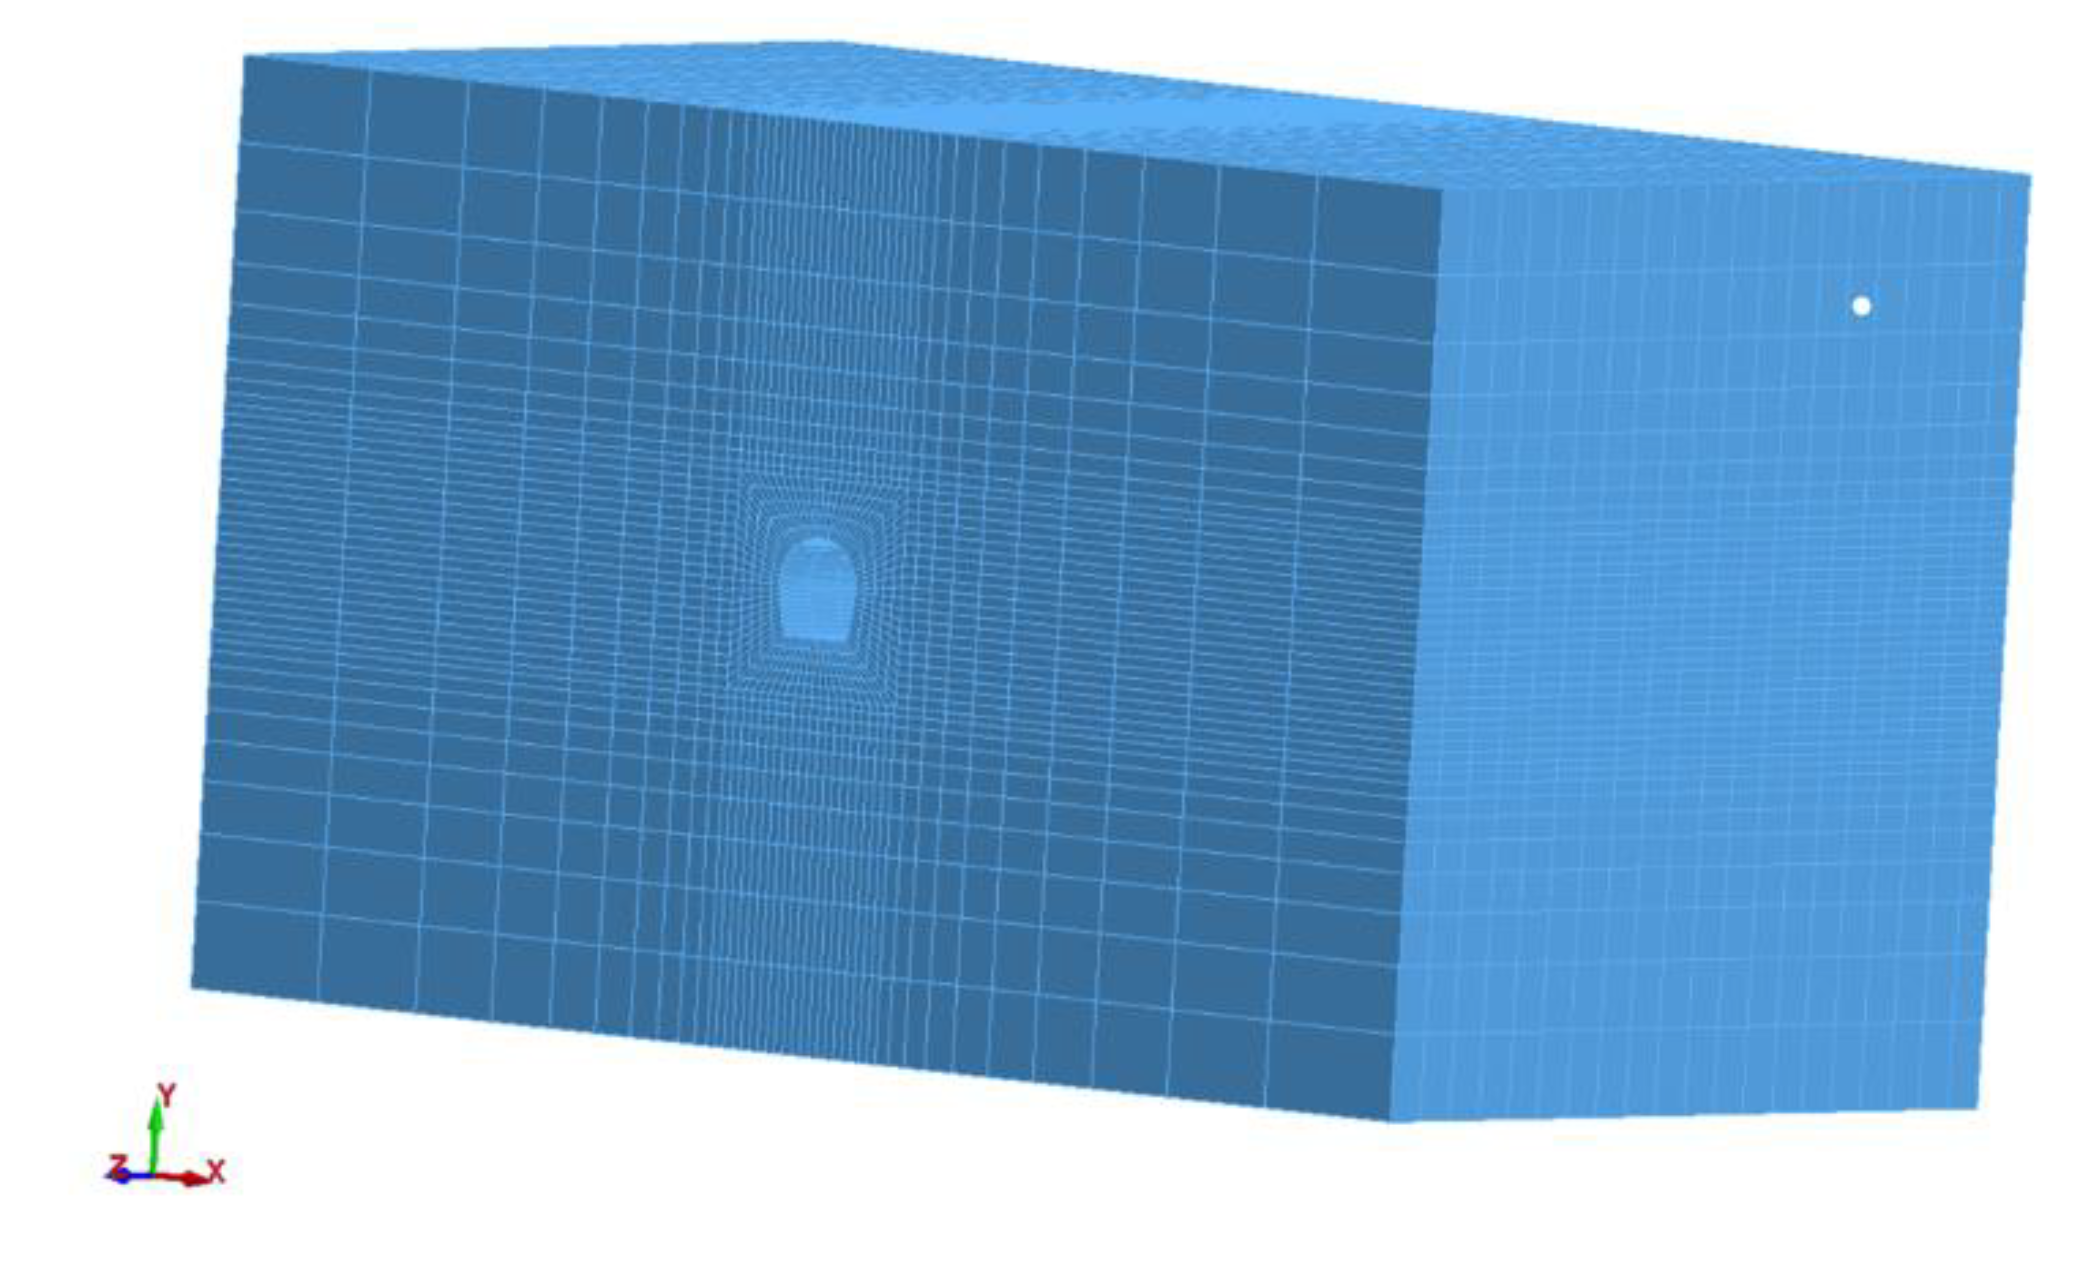
We used the finite element analysis software, ANSYS/LS-DYNA, to reasonably analyze the impact of blast vibration on buried pipes. According to the working conditions at the time of monitoring conducted in Section 2, the distance between the pipe and the blast source was 19 m. A numerical calculation model with a vertical distance of 19 m between the blast source and the pipeline was established (Figure 6).

4.1. Model Parameter and Set Up

The critical parameters of the 3D numerical model, such as tunnel size, height, and loading position, are derived from the construction scheme on-site (Section 2). The length between the tunnel and the bottom of the model should be greater than three times the height of the tunnel, and the distance between the tunnel and the edge of the model should be greater than three times the width of the tunnel to avoid boundary effects [23]. The finite element for dynamic analysis depends on the mesh size and uniformity. According to Kuhlemeyer et al., 8–10 elements per wavelength are required to avoid the distortion of the vibration wave transmission [24]. The model in this study used an eight-node SOLID164 element. Due to the large size of the model, the critical analysis area for blasting construction (the tunnel and the pipeline above it) was grid-encrypted to ensure an accurate representation of the working conditions and computational accuracy in the numerical model. The grid sensitivities of different grid densities (10–25 cm, 25–50 cm, 50–75 cm, 50–100 cm, and 75–100 cm) were compared (Table 5). The results show the 50–100 cm grid density used in this study can guarantee calculation accuracy, and the calculation time was within the acceptable range.
Mechanical tests were used to determine each material parameter. The soil and surrounding rock in the study area were homogeneous, and the effects of faults and soft surfaces were not considered. The ground soil was *MAT_SOIL_AND_FOAM material and sintered tuff, and the buried pipeline was *MAT_PLASTIC_KINEMATIC material. Table 6 shows the relevant material parameters. In addition, the dynamic relaxation technique was applied by adding the *CONTROL_DYNAMIC_RELAXION keyword, and the effects of in situ stress were calculated by defining the loading curve with the body. The in-situ stress was 10 MPa in this test. The specific method utilized refers to a study by Yang et al. (2019) [25]. The model only reflected the study area. Therefore, reflection-free boundary conditions needed to be added to the surroundings and to the bottom of the model to reflect vibration propagation accurately. In addition, the normal phase displacement and controlled rotation angle of the model’s front, left, and top sides in the corresponding directions were constrained to ensure accuracy.

4.2. Blasting Load Application

The test used equivalent blast loads to reflect the blasting process. The equivalent load applied to the elastic boundary reflected the blast effect, and this loading method can effectively save calculation time. The equivalent load was mainly made up of progressive parabolic-type, exponential decay-type, and linear decay-type (triangular loads) loads [26]. The test adopted triangular equivalent blasting.
For uncoupled charges, the initial mean pressure, P 0 , of blast holes is obtained by Equation (12) [27,28,29,30]:
P 0 = ρ e D 2 2 γ + 1 d c d b 2 γ
where ρ e is the density of the explosive, D is the explosive velocity, γ is the isentropic index [31], d c is the explosive diameter, and d b is the blast hole’s diameter.
The load applied equivalently to the elastic boundary in the cluster hole is given by Equation (13):
P 1 = k P 0 r 0 r 1 2 + μ 1 μ r 1 r 2 2 μ 1 μ
where k is the impact factor when the cluster cutting holes are detonated, which is related to the distribution and number of blasting holes, r 0 is the hole’s radius, r 1 is the crushing zone’s radius under the column charge, and r 2 is the fractured zone’s radius [26]. μ is the Poisson’s ratio.
In this paper, the tunnel-blasting explosives used were No. 2 rock emulsion explosives. ρ e = 1.016 g/cm3 and D = 4000 m/s were input into the above formula to calculate the equivalent to the elastic boundary of the load as 156 MPa. The load rise time was 0.4 ms, and the total load time was 3.4 ms [32]. The load curve form is shown in Figure 7. Although empirical equations and some simplifications for calculating the equivalent load method were proposed during the conception of this model, it was found through trial and error that using an equivalent load can improve calculation efficiency and achieve the desired surface vibration calculation accuracy [33,34].

4.3. Numerical Calculation and Verification

Ten monitoring points were arranged to verify the reasonableness of the simulation results on the numerical model according to the actual situation of monitoring deployment in Section 2.
Table 7 shows the error rate of the simulation results compared to that of the field results. It can be observed the maximum value of the simulation results appeared at the T5 monitoring point, being a value of 1.40 cm/s, and the minimum value appeared at the T10 monitoring point, being a value of 0.78 cm/s, which was relatively consistent with the monitoring results. In addition, it was found the numerical simulation results were more significant than the monitoring results, which was caused by the inability to comprehensively consider the impact factors of the weakening vibration of the model. The differences between the results of the simulation and field monitoring at each monitoring point were minor and within a reasonable range [17]. The maximum error rate was 7.69% at monitoring point T10, and the minimum value was 2.86% at monitoring point T5. Although there were some errors, they were within acceptable limits [6]. Using a triangular equivalent load to simulate the effects of explosions can obtain effective results; thus, this method can be used as the basis for subsequent dynamic analysis.

4.4. Pipeline Dynamic Response Analysis

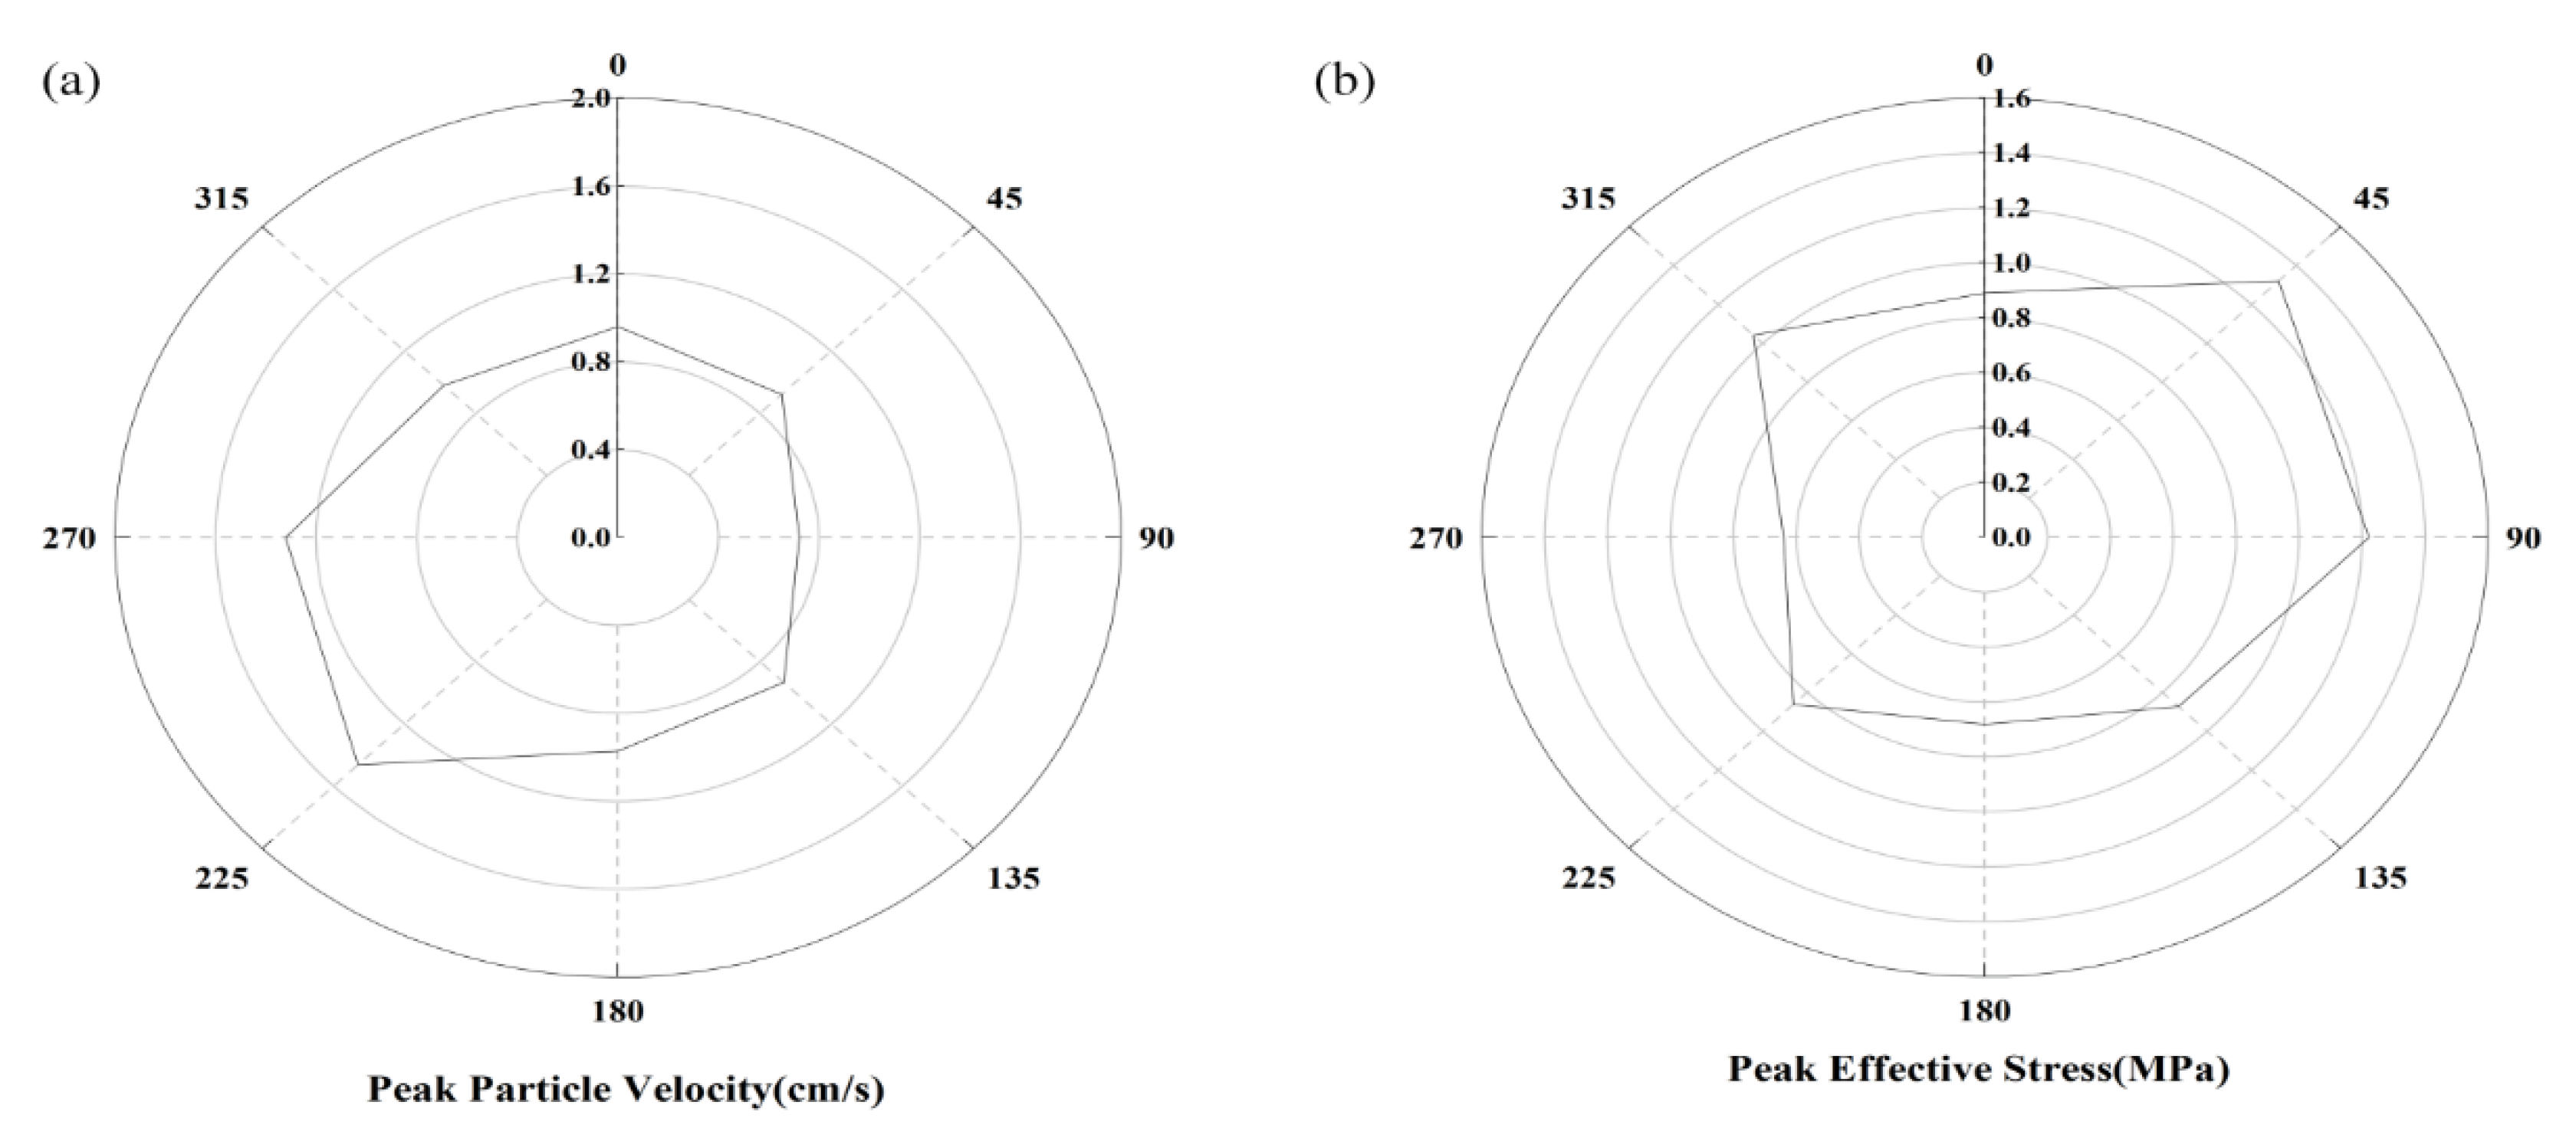
The feasibility of this computational model can be verified by analyzing the error rate of the numerical simulation results compared to that of the field surveying data. The pipeline cross-section at the nearest point from the blast source under the construction conditions at the time was selected to analyze the dynamic response characteristics of the buried pipeline during the blast excavation process and its safety. The 225° point was the closest point to the blast source, and the 45° point was the farthest point from the blast source.
Figure 8 shows the peak particle velocity and peak effective stress (PES) distribution at eight monitoring points in the pipeline’s cross-section under the construction conditions at the time. It can be observed the PPV value at the monitoring point nearest to the explosion source at 225° was the greatest at 1.46 cm/s, while the PPV value farthest from the source at 45° was the smallest at 0.92 cm/s. The PPV at the surveying points 180°–270°, which were facing the oncoming blast side, was much greater than that at the surveying points 0°–90° behind the blast side. In addition, the results show the maximum PES was 1.32 MPa at the 45° monitoring point and the minimum PES was 0.68 MPa at the 180° monitoring point. It can be observed the PES in the lower part of the pipeline cross-section was significantly lower than that in the upper part. According to GB/T13295-2013 [35], the DN500 pipeline’s maximum safety working threshold pressure is 4.6 MPa, which is much higher than the PES from the numerical calculation, which indicates the pipeline was safe under the blast performed in this study.

5. Soil Vibration Response above the Buried Pipeline

As the tunnel is excavated, the horizontal distance of the pipe gets closer and closer to the source of the explosion. The above model was used to establish the blasting construction condition scheme for different locations with horizontal distances of 0, 8, 16, 24, 32, and 40 m to effectively analyze the impact of the different excavation scheme on the buried pipe.

5.1. Soil Vibration Response above the Buried Pipe

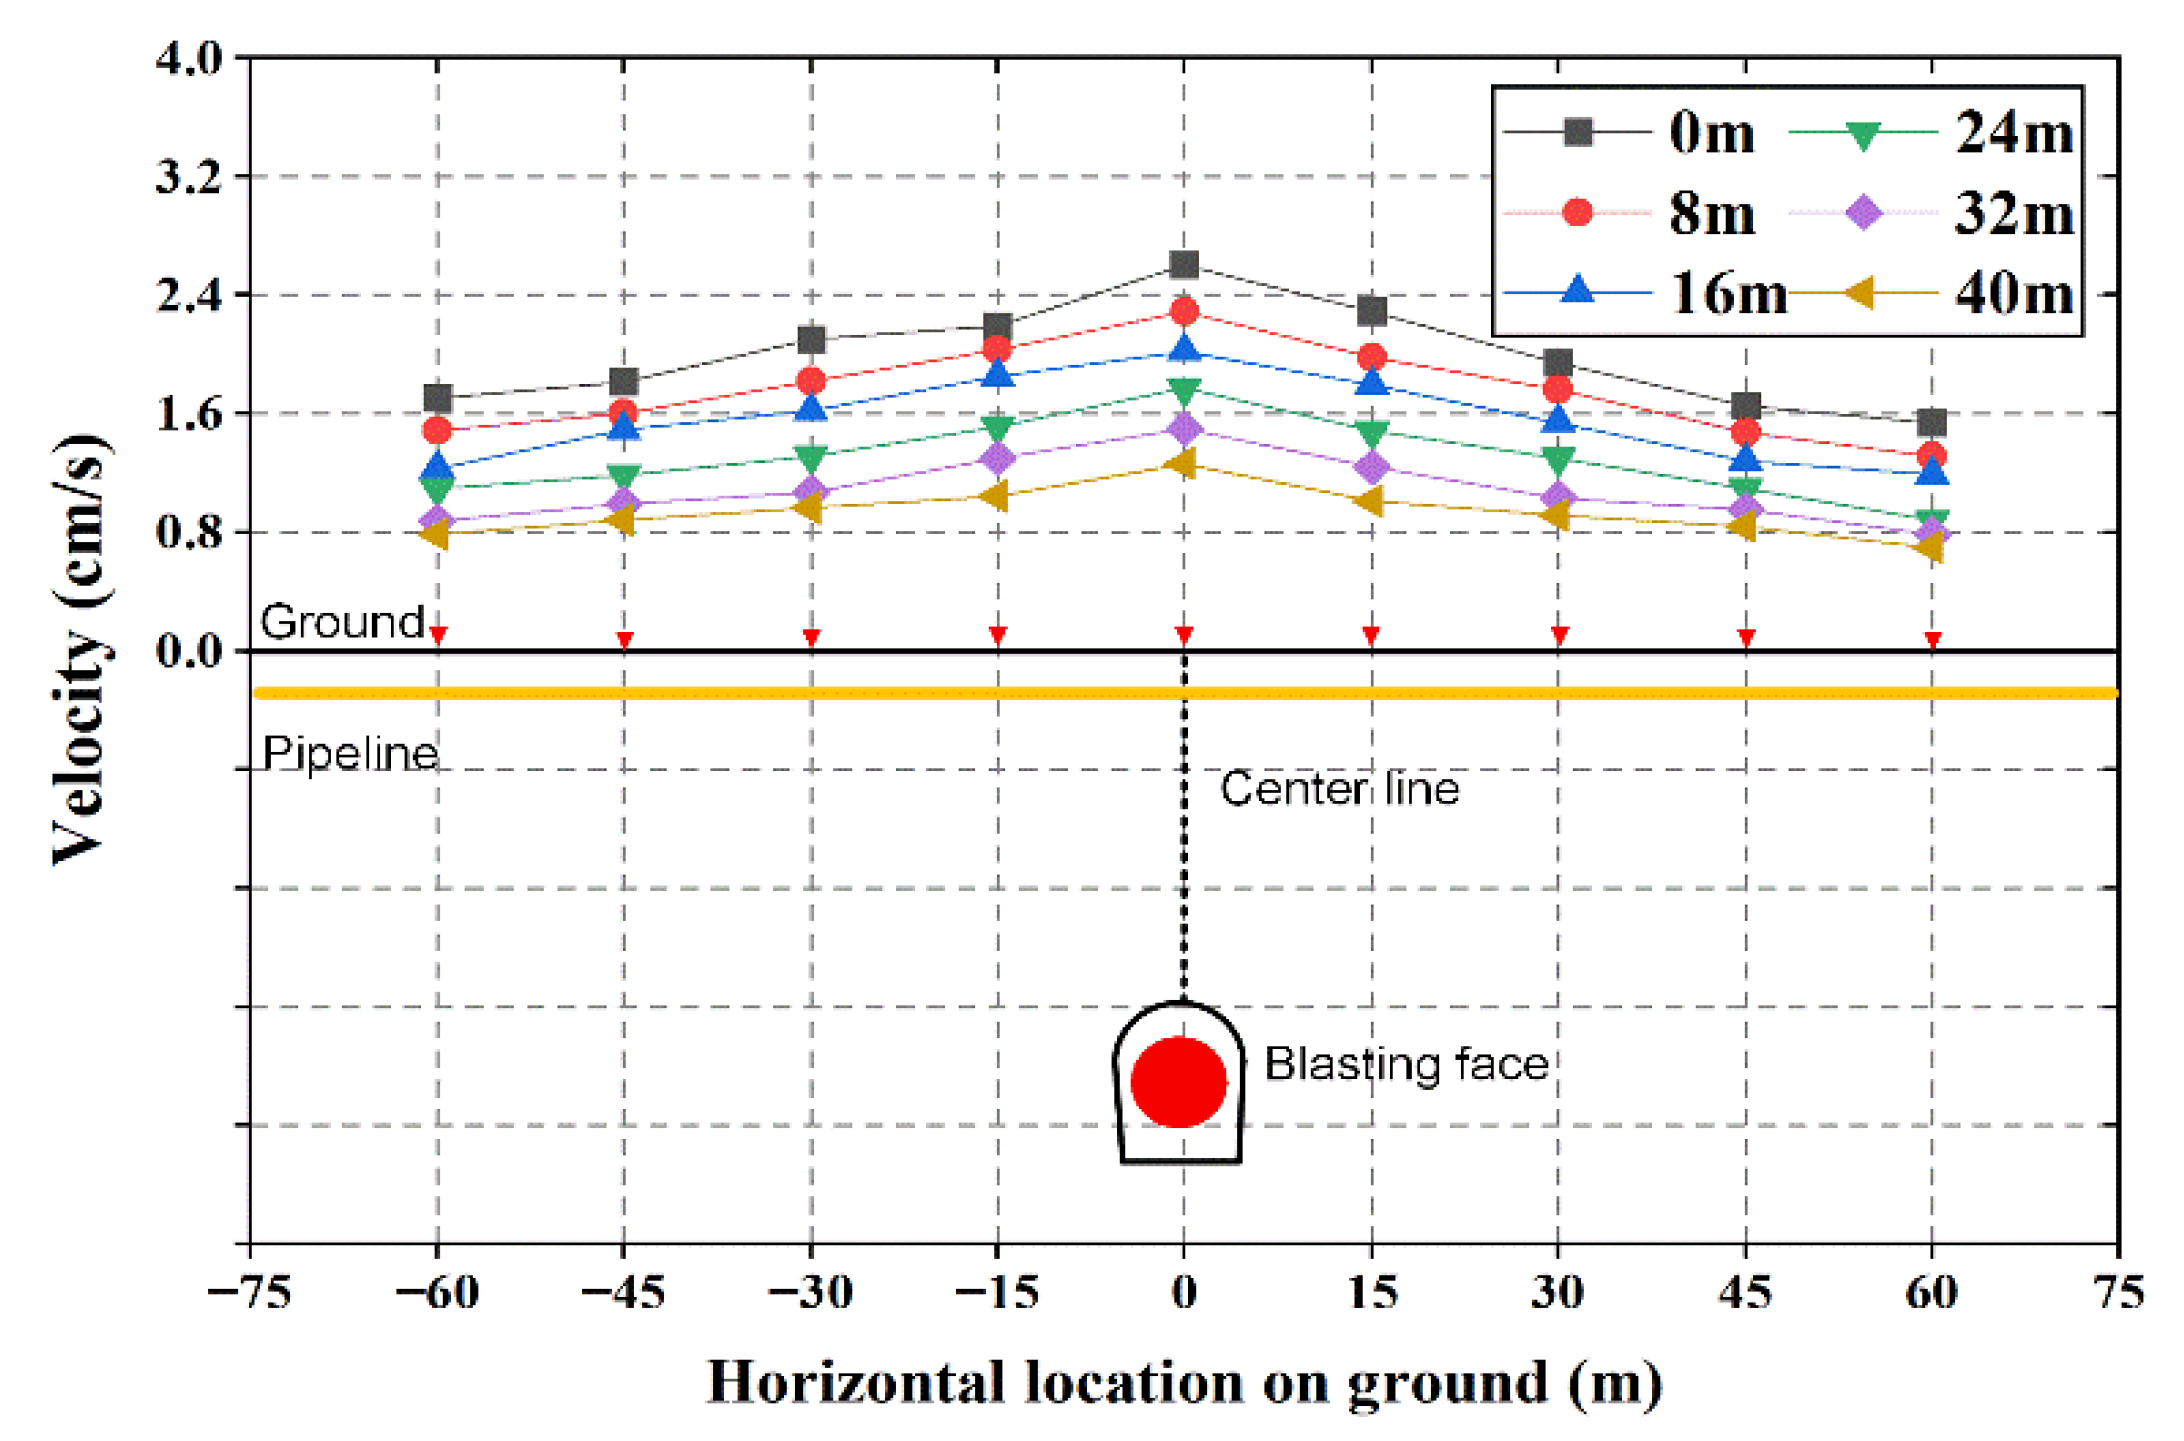
The surveying points were arranged to analyze the axial PPV distribution at 15 m intervals directly above the blast source. Figure 9 shows that as the tunnel and pipeline distance was reduced by the tunnel blasting excavation, the PPV increased. The maximum PPV appeared at the horizontal distance of 0 m from the explosion source when the axial distance was 0 m with a value of 2.6 cm/s. The minimum PPV appeared at the horizontal distance of 60 m from the explosion source when the axial distance was 40 m with a value of 0.7 cm/s. It can be observed in the same horizontal, with increased distance from the blast source, the vibration speed also displayed a decaying trend in a horizontal direction, and the PPV above the blast source was greater than that of the two sides.
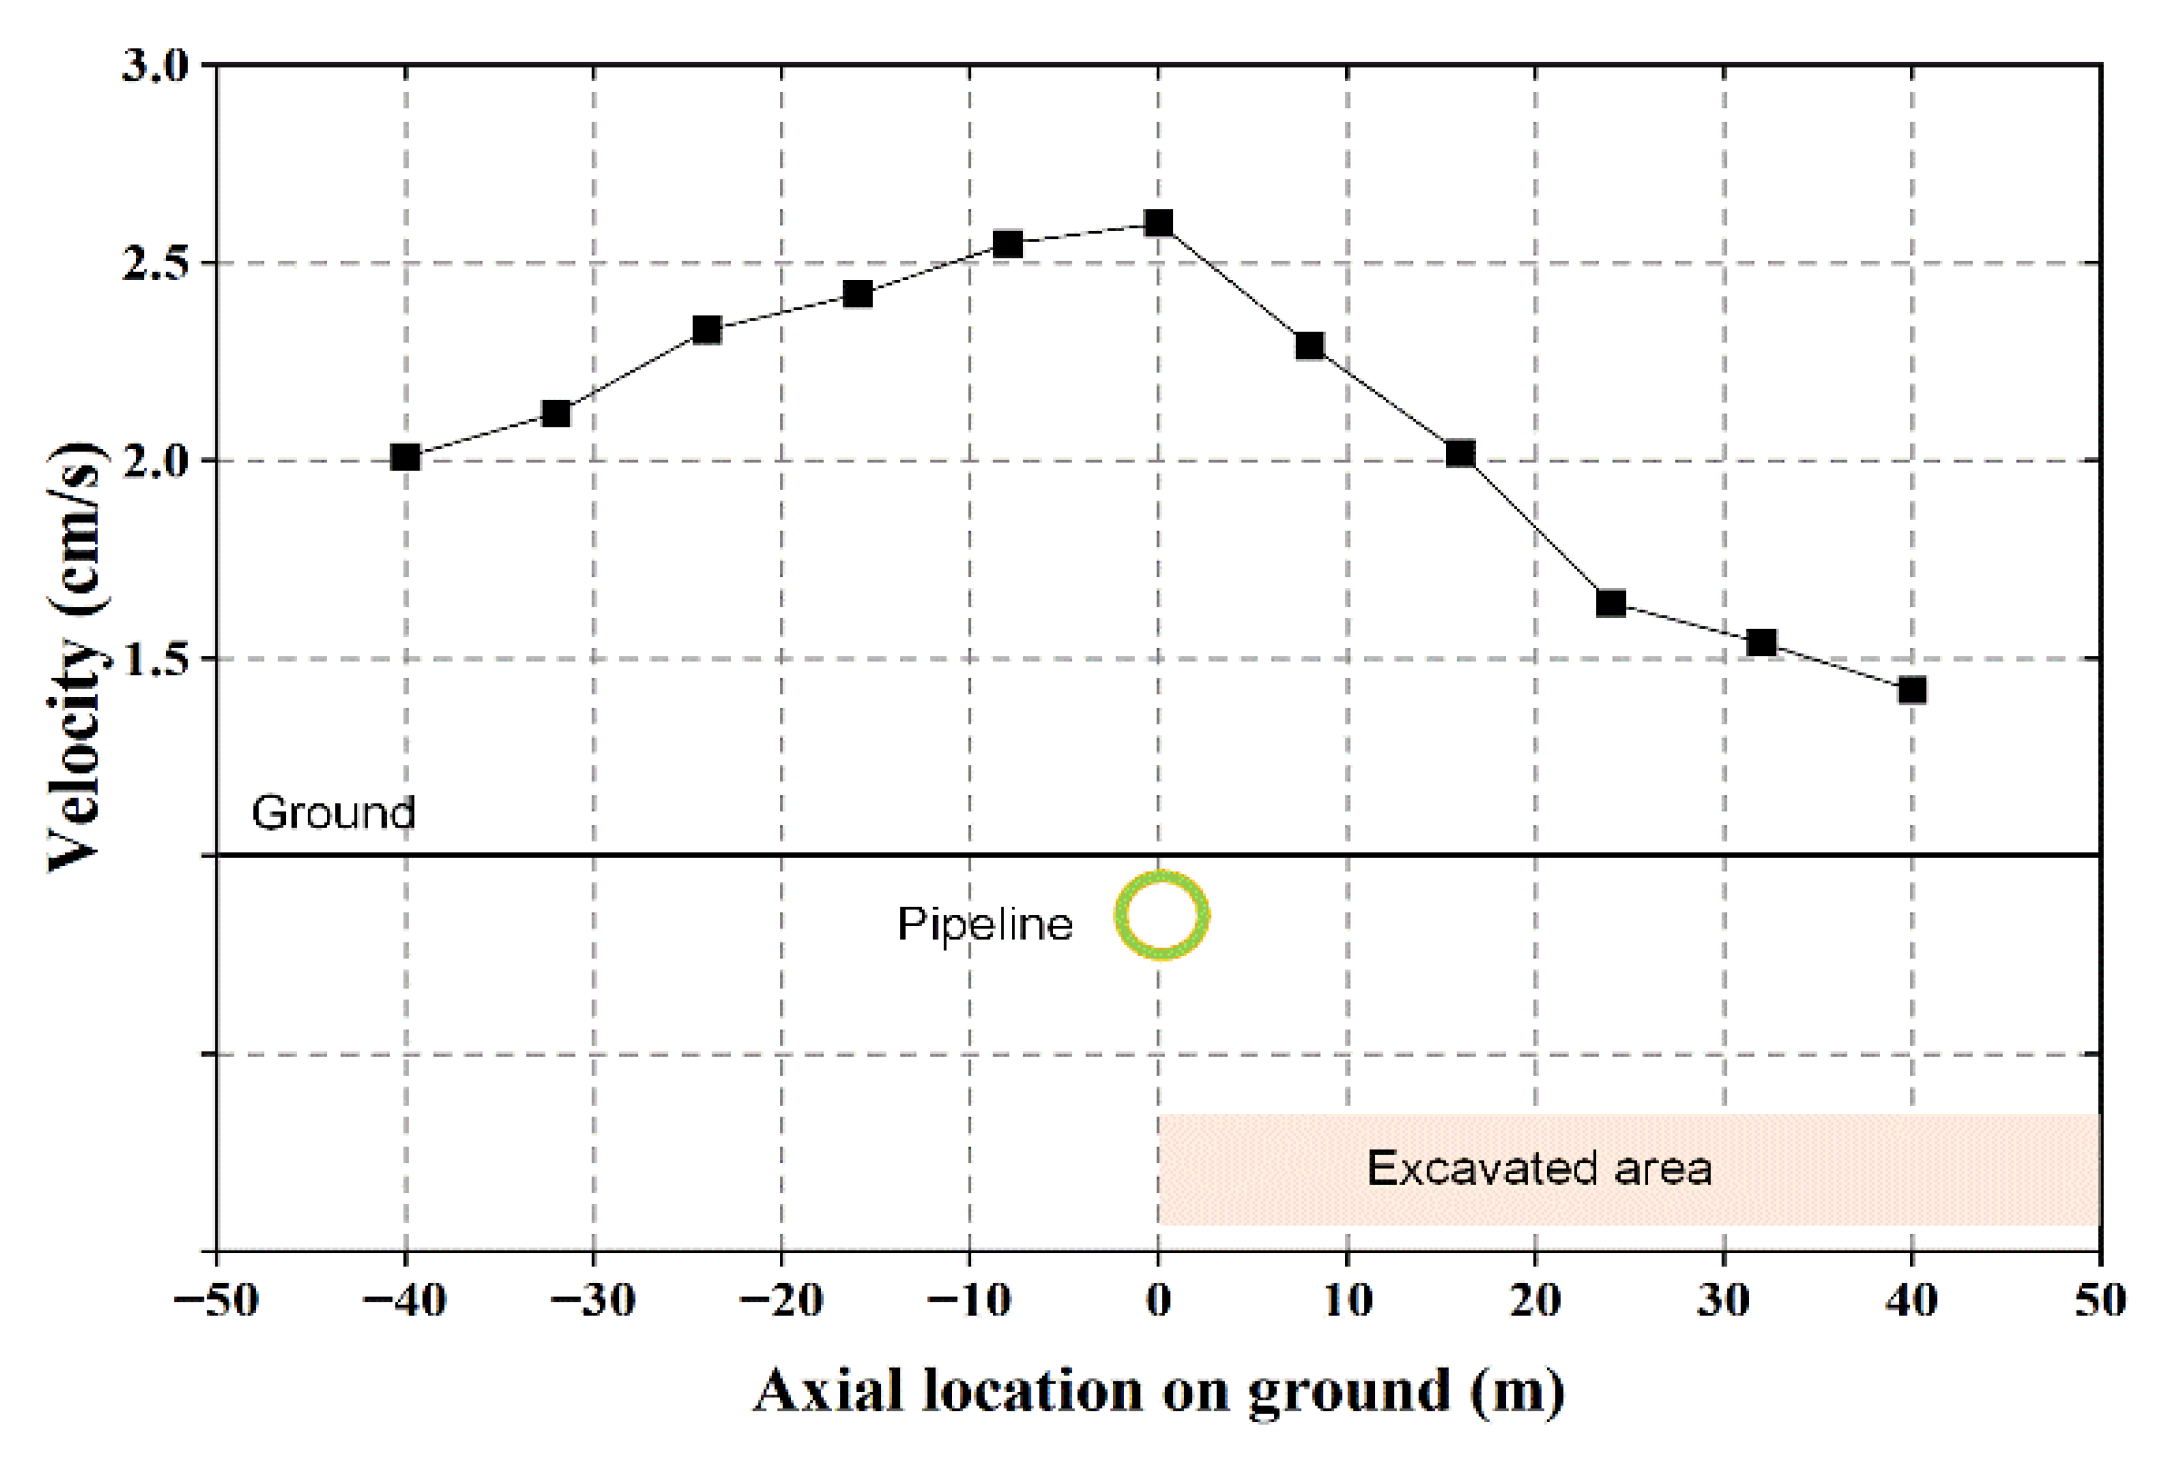
To analyze the PPV distribution of the ground soil directly above the blast source, several surveying points were selected in the surface soil on the tunnel centerline (Figure 10). The maximum PPV appeared directly above the blast source with a value of 2.6 cm/s, and the minimum appeared at 40 m with a value of 1.42 cm/s. As their distance from the blast source increased, the excavation and unexcavated areas had different attenuation amplitudes. The attenuation amplitude of the unexcavated area was greater than that of the excavation area. This is because the latter area was excavated into a cavity as part of the vibration enlargement effect, forming a cavity effect.

5.2. Pipeline Dynamic Response Characteristics

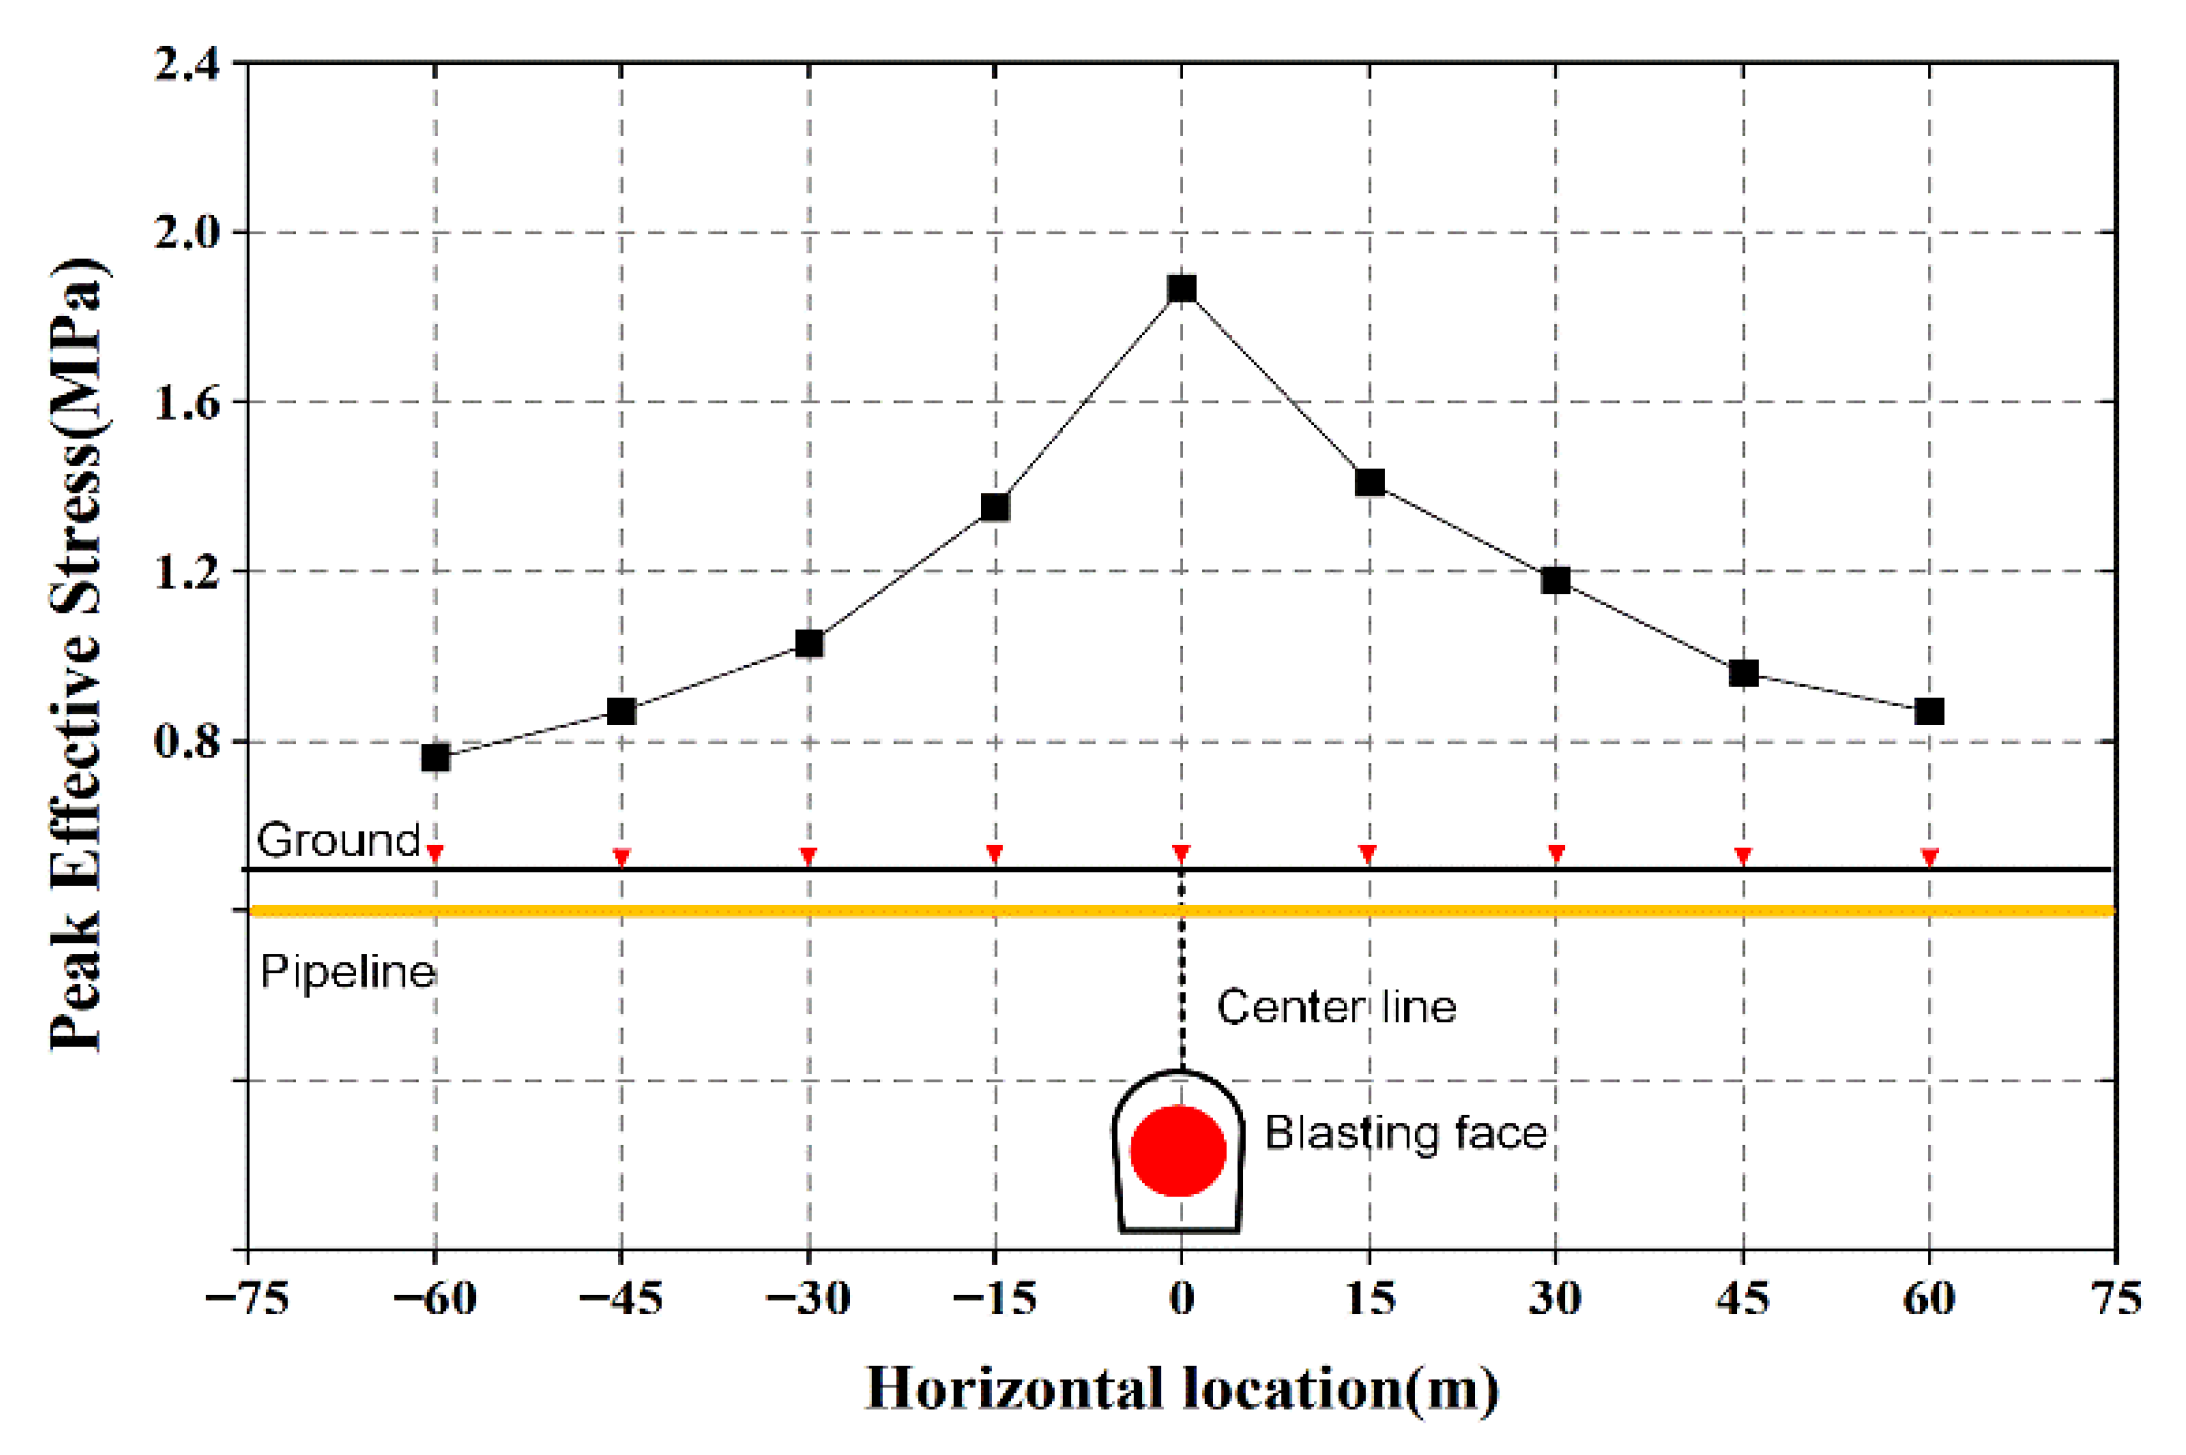
Analysis shows that the maximum impact of the blast source was directly above the pipeline, so the PES values at the corresponding monitoring points were extracted to analyze the dynamic response law (Figure 11). The maximum PES value, 1.87 MPa, appeared directly above the burst source, and the minimum value, 0.87 MPa, appeared at a −60 m horizontal distance. The effective stress on both sides of the burst source decayed exponentially with increasing distance.
The PES values at each monitoring point of the buried pipeline cross-section were extracted to analyze the dynamic response of the buried pipeline under hazardous construction conditions (blast source directly under the pipeline) (Figure 12). The maximum PPV value that occurred at the top of the pipeline was 2.47 cm/s, and the minimum value was 0.89 cm/s, which appeared at the left waistline of the pipeline. This shows that when the blast wave came from directly below, the top of the pipeline was also more affected by the blast due to the influence of the ground soil. In addition, the maximum PES at the pipeline, 1.53 MPa, appeared at the 45° point, and the minimum value, 0.42 MPa, appeared at the 225° point. Stress in the lower part of the pipeline was significantly lower than that in the upperpart. Since the test value of each surveying point was less than the safe working threshold pressure of a DN500 pipe (≤4.6 MPa), the tested blasting vibration did not adversely affect the buried pipeline, and the buried pipeline could work normally.

5.3. Soil Response Characteristics around the Pipeline

The explosion stress wave theory shows when a wave propagates in surrounding rock [28], the propagation medium peak effective stress and peak particle velocity have the following relationship:
σ = ρ c v
where σ is the peak effective stress, ρ is the soil’s density, c is the longitudinal blast velocity, and v is the PPV.
The ratio of pipe to soil is given by the following equation:
σ p σ s = ρ p c p v p ρ s c s v s
Since the topsoil around the pipe vibrates at a similar speed to the pipe’s surface, the above equation is simplified to the following equation:
σ p σ s = ρ p c p ρ s c s
The seismic wave’s propagation velocity is relevant to some of the physical properties of the medium. It can be expressed as the following equation:
c = E 1 μ ρ 1 + μ 1 2 μ
where μ is the Poisson’s ratio of the medium.
Therefore, the value of the pipe-to-soil relationship in this study can be expressed as:
σ p σ s = 341.144
The results gained from simulations were compared with those obtained from empirical formulas to verify the scheme’s feasibility further. Table 8 shows the calculation results. It is clear the calculation results are in agreement with the empirical equation of the blast stress wave theory. This proves the numerical simulation effectively reflects the effects of tunnel blast vibration on the pipe.

5.4. Security Criteria Analysis

To guarantee the subsequent construction will not affect pipeline safety, the buried pipe’s PPV prediction formula and the safety criterion are assessed by an analysis of statistical mathematics based on the numerical calculation and on-site results.
From Table 9, it is clear the numerical simulation results have a minor error compared to the prediction results of the PPV prediction model. The maximum error is 4.52%; hence, it is workable to utilize the PPV prediction model to reflect pipe response characteristics during blasting excavation. Since pipeline is buried underground, it cannot be monitored directly. Therefore, a pipeline PPV prediction model applicable to this study was proposed to reflect the vibration attenuation characteristics of pipelines under blast vibration. Based on the fitting analysis, the PPV linear relationship between the two values in Table 9 was established (Figure 13a). The PPV prediction model of the buried pipe was derived from the following equation:
V p = 68.32 Q 1 / 3 r 1.31 + 0.14
To guarantee the subsequent construction will not adversely affect the pipeline, an empirical formula was derived for the safety criterion based on relations to statistical mathematics (Figure 13b). The safety criterion equation is as follows:
σ p = 0.88 V p 0.39

6. Conclusions

In this study, by utilizing a water diversion tunnel project in Zhejiang, the response characteristics of a buried pipe under blasting construction conditions were explored, pipeline safety was analyzed, and the following conclusions were drawn:
(1)
A three-dimensional numerical model considering in situ stress was established. The triangular equivalent load method was used to reflect the explosion effect. The reasonableness of the model was verified based on a comparative analysis of the field-monitoring results and a solution using the empirical equation of stress wave theory. The results show the error of the PPV is within a reasonable range (≤7.69%) with high simulation accuracy.
(2)
The PPV results for each construction condition show the PPV decays exponentially with increasing horizontal and axial distances. The maximum PPV appeared at the horizontal distance of 0 m from the explosion source when the axial distance was 0 m with a value of 2.6 cm/s. The minimum PPV appeared at the horizontal distance of 60 m from the explosion source when the axial distance was 40 m with a value of 0.7 cm/s. In addition, the axial vibration velocity distribution results indicate a significant cavity amplification effect above the excavation area, which should be seriously considered in future research.
(3)
The PPV distribution results at the pipe cross-section indicate the PPV on the blast side was more significant than that behind the blast side when the blast vibration was transmitted to the pipeline. The maximum PPV value appeared nearest to the source of the explosion, and the minimum value appeared farthest from the blast source.
(4)
The PES occurring had exponential decay on both sides of the blast source with increasing horizontal distance from the blast source. The PES results of the pipe sections under different construction conditions show the PES of the lower part of the pipe section was significantly lower than that of the upper part due to the interaction between the soil and the pipe. In addition, the maximum PES value at the cross-section (1.53 MPa) when in a hazardous situation (pipe directly above the blast source) was less than the safe threshold (≤4.6 MPa). This indicates the blast vibration will not affect the normal service of the buried pipeline.
(5)
This paper effectively reflects blast vibration propagation law by proposing an effective PPV prediction model for pipelines which applies a dimension and composition analysis combined with numerical simulation and field-monitoring results. This prediction model may guide the subsequent development of a reasonable blasting scheme. In addition, this study proposes an empirical safety criteria formula for the scientific implementation of safety assessments for subsequent construction.

Author Contributions

Conceptualization, T.Q. and M.W.; methodology, T.Q. and L.J.; software, T.Q. and M.W.; validation, T.Q., L.X. and L.J.; formal analysis, T.Q. and M.W.; investigation, T.Q. and L.J.; resources, L.W.; data curation, T.Q.; writing—original draft preparation, T.Q.; writing—review and editing, T.Q.; visualization, M.W.; supervision, L.W.; project administration, L.J. All authors have read and agreed to the published version of the manuscript.

Funding

This research received no external funding.

Data Availability Statement

Some or all data, models, or code that support the findings of this study are available from the corresponding author upon reasonable request.

Conflicts of Interest

The author(s) declare no potential conflicts of interest with respect to the research, authorship, and/or publication of this article.

References

  1. Zhang, Z.; Zhou, C.; Remennikov, A.; Wu, T.; Lu, S.; Xia, Y. Dynamic response and safety control of civil air defense tunnel under excavation blasting of subway tunnel. Tunn. Undergr. Space Technol. 2021, 112, 103879. [Google Scholar] [CrossRef]
  2. Yu, H.; Yuan, Y.; Yu, G.; Liu, X. Evaluation of influence of vibrations generated by blasting construction on an existing tunnel in soft soils. Tunn. Undergr. Space Technol. 2014, 43, 59–66. [Google Scholar] [CrossRef]
  3. Singh, P.K.; Roy, M.P. Damage to surface structures due to blast vibration. Int. J. Rock Mech. Min. Sci. 2010, 47, 949–961. [Google Scholar] [CrossRef]
  4. Xia, Y.; Jiang, N.; Zhou, C.; Sun, J.; Luo, X.; Wu, T. Dynamic behaviors of buried reinforced concrete pipelines with gasketed bell-and-spigot joints subjected to tunnel blasting vibration. Tunn. Undergr. Space Technol. 2021, 118, 104172. [Google Scholar] [CrossRef]
  5. Xia, Y.; Jiang, N.; Zhou, C.; Meng, X.; Luo, X.; Wu, T. Theoretical solution of the vibration response of the buried flexible HDPE pipe under impact load induced by rock blasting. Soil Dyn. Earthq. Eng. 2021, 146, 106743. [Google Scholar] [CrossRef]
  6. Xia, Y.; Jiang, N.; Zhou, C.; Luo, X. Safety assessment of upper water pipeline under the blasting vibration induced by Subway tunnel excavation. Eng. Fail. Anal. 2019, 104, 626–642. [Google Scholar] [CrossRef]
  7. Wu, T.; Jiang, N.; Zhou, C.; Luo, X.; Li, H.; Zhang, Y. Experimental and numerical investigations on damage assessment of high-density polyethylene pipe subjected to blast loads. Eng. Fail. Anal. 2022, 131, 105856. [Google Scholar] [CrossRef]
  8. Jiang, N.; Gao, T.; Zhou, C.; Luo, X. Effect of excavation blasting vibration on adjacent buried gas pipeline in a metro tunnel. Tunn. Undergr. Space Technol. 2018, 81, 590–601. [Google Scholar] [CrossRef]
  9. Zhong, D.; Gong, X.; Han, F.; Li, L. Monitoring the Dynamic Response of a Buried Polyethylene Pipe to a Blast Wave: An Experimental Study. Appl. Sci. 2019, 9, 1663. [Google Scholar] [CrossRef] [Green Version]
  10. Abedi, A.S.; Hataf, N.; Ghahramani, A. Analytical solution of the dynamic response of buried pipelines under blast wave. Int. J. Rock Mech. Min. Sci. 2016, 88, 301–306. [Google Scholar] [CrossRef]
  11. Nyman, D.J.; Dowding, C.H.; Oriard, L.L. Evaluation of Close-in Blasting Effects on Welded Steel Pipelines. In Proceedings of the 7th International Pipeline Conference, Calgary, AB, Canada, 29 September–3 October 2008. [Google Scholar]
  12. Kouretzis, G.P.; Bouckovalas, G.D.; Gantes, C.J. Analytical calculation of blast-induced strains to buried pipelines. Int. J. Impact Eng. 2007, 34, 1683–1704. [Google Scholar] [CrossRef] [Green Version]
  13. Esparza, E.D.; Westine, P.S.; Wenzel, A.B. Pipeline Response to Buried Explosive Detonations; American Gas Association: Arlington, VA, USA, 1981. [Google Scholar]
  14. Mokhtari, M.; Alavi Nia, A. A parametric study on the mechanical performance of buried X65 steel pipelines under subsurface detonation. Arch. Civ. Mech. Eng. 2015, 15, 668–679. [Google Scholar] [CrossRef]
  15. Mokhtari, M.; Alavi Nia, A. The application of CFRP to strengthen buried steel pipelines against subsurface explosion. Soil Dyn. Earthq. Eng. 2016, 87, 52–62. [Google Scholar] [CrossRef]
  16. Almahakeri, M.; Moore, I.D.; Fam, A. Numerical Study of Longitudinal Bending in Buried GFRP Pipes Subjected to Lateral Earth Movements. J. Pipeline Syst. Eng. Pract. 2017, 8, 04016012. [Google Scholar] [CrossRef]
  17. Jiang, N.; Zhu, B.; Zhou, C.; Luo, X.; Li, H.; Wu, T.; Lyu, G. Safety criterion of gas pipeline buried in corrosive saturated soft soil subjected to blasting vibration in a coastal metro line. Thin-Walled Struct. 2022, 180, 109860. [Google Scholar] [CrossRef]
  18. Zhu, B.; Jiang, N.; Zhou, C.; Luo, X.; Li, H.; Chang, X.; Xia, Y. Dynamic interaction of the pipe-soil subject to underground blasting excavation vibration in an urban soil-rock stratum. Tunn. Undergr. Space Technol. 2022, 129, 104700. [Google Scholar] [CrossRef]
  19. Qu, Y.; Li, Z.; Zhang, R.; Qin, Y.; Zhang, D. Dynamic performance prediction and influencing factors analysis of buried polyethylene pipelines under subsurface localized explosion. Int. J. Press. Vessel. Pip. 2021, 189, 104252. [Google Scholar] [CrossRef]
  20. Giannaros, E.; Kotzakolios, T.; Kostopoulos, V. Blast response of composite pipeline structure using finite element techniques. J. Compos. Mater. 2015, 50, 3459–3476. [Google Scholar] [CrossRef]
  21. Parviz, M.; Aminnejad, B.; Fiouz, A. Numerical simulation of dynamic response of water in buried pipeline under explosion. KSCE J. Civ. Eng. 2017, 21, 2798–2806. [Google Scholar] [CrossRef]
  22. Langhaar, H.L. Dimensional Analysis and Theory of Models; Wiley: New York, NY, USA, 1951. [Google Scholar]
  23. Jiang, N.; Zhou, C.; Lu, S.; Zhang, Z. Propagation and prediction of blasting vibration on slope in an open pit during underground mining. Tunn. Undergr. Space Technol. 2017, 70, 409–421. [Google Scholar] [CrossRef]
  24. Kuhlemeyer, R.L.; Lysmer, J. Finite element method accuracy for wave propagation problems. J. Soil Mech. Found. Div. 1973, 99, 421–427. [Google Scholar] [CrossRef]
  25. Yang, J.-C.; Liu, K.-W.; Li, X.-D.; Liu, Z.-X. Stress initialization methods for dynamic numerical simulation of rock mass with high in-situ stress. J. Cent. South Univ. 2020, 27, 3149–3162. [Google Scholar] [CrossRef]
  26. Lyu, G.; Zhou, C.; Jiang, N. Experimental and Numerical Study on Tunnel Blasting Induced Damage Characteristics of Grouted Surrounding Rock in Fault Zones. Rock Mech. Rock Eng. 2022. [Google Scholar] [CrossRef]
  27. Fickett, W.; Davis, W.C. Detonation; University of California Press: Berkeley, CA, USA, 1979. [Google Scholar]
  28. Henrych, J.; Major, R. The Dynamics of Explosion and Its Use; Elsevier Scientifific Pub. Co.: Amsterdam, The Netherlands, 1979. [Google Scholar]
  29. Wang, W.L. Drilling Blasting; Coal Industry Press: Beijing, China, 1984. (In Chinese) [Google Scholar]
  30. Yang, S.Y. Foundations of Dynamics in Rock Blasting; China Coal Industry Publishing House: Beijing, China, 1991. (In Chinese) [Google Scholar]
  31. Persson, P.A.; Holmberg, R.; Lee, J. Rock Blasting and Explosives Engineering; CRC Press: Boca Raton, FL, USA, 1993. [Google Scholar]
  32. Lu, W.; Yang, J.; Yan, P.; Chen, M.; Zhou, C.; Luo, Y.; Jin, L. Dynamic response of rock mass induced by the transient release of in-situ stress. Int. J. Rock Mech. Min. Sci. 2012, 53, 129–141. [Google Scholar] [CrossRef]
  33. Ji, L.; Zhou, C.; Lu, S.; Jiang, N.; Li, H. Modeling study of cumulative damage effects and safety criterion of surrounding rock under multiple full-face blasting of a large cross-section tunnel. Int. J. Rock Mech. Min. Sci. 2021, 147, 104882. [Google Scholar] [CrossRef]
  34. Ji, L.; Zhou, C.; Lu, S.; Jiang, N.; Gutierrez, M. Numerical Studies on the Cumulative Damage Effects and Safety Criterion of a Large Cross-Section Tunnel Induced by Single and Multiple Full-Scale Blasting. Rock Mech. Rock Eng. 2021, 54, 6393–6411. [Google Scholar] [CrossRef]
  35. GB/T13295-2013; Ductile Iron Pipes, Fittings and Accessories for Water or Gas Applications. AQSIQ: Beijing, China, 2013.
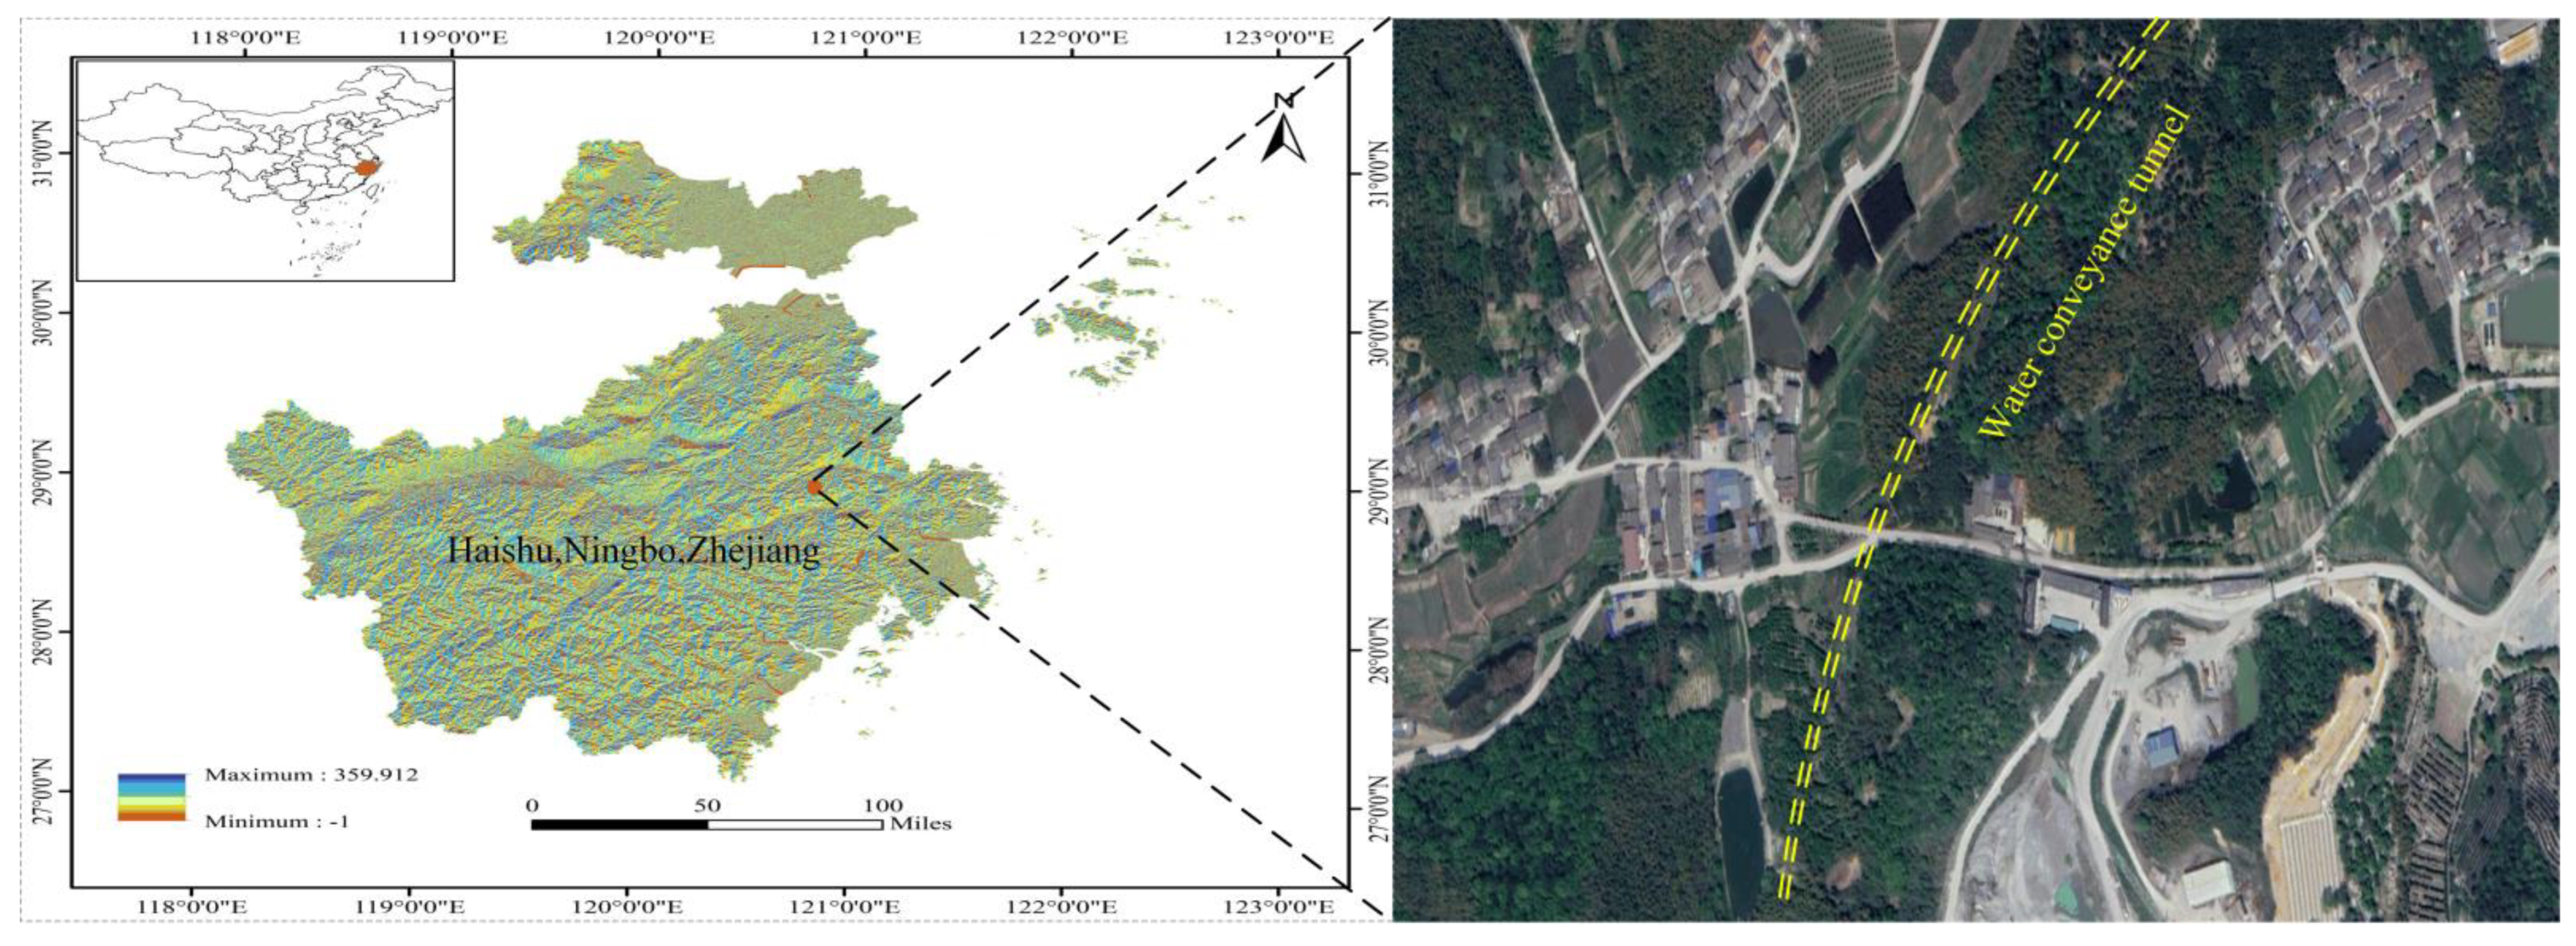
Figure 1. Geographic location map.
Applsci 13 00121 g001
Figure 2. Layout of the blasting hole.
Applsci 13 00121 g002
Figure 3. Monitoring system.
Applsci 13 00121 g003
Figure 4. Monitoring locations.
Applsci 13 00121 g004
Figure 5. Vibration velocity curve in each direction at ground-soil-monitoring point T5.
Applsci 13 00121 g005
Figure 6. Numerical model.
Applsci 13 00121 g006
Figure 7. Curve of blasting load.
Applsci 13 00121 g007
Figure 8. Pipeline cross-section dynamic response characteristics under this study’s construction conditions: (a) peak particle velocity; (b) peak effective stress.
Applsci 13 00121 g008
Figure 9. Distribution of the surface soil’s PPV.
Applsci 13 00121 g009
Figure 10. Distribution of the axial surface soil’s PPV.
Applsci 13 00121 g010
Figure 11. Distribution of PES on the pipeline.
Applsci 13 00121 g011
Figure 12. Pipeline cross-section dynamic response characteristics under hazardous construction conditions: (a) peak particle velocity; (b) peak effective stress.
Applsci 13 00121 g012
Figure 13. Statistical relationship: (a) PPV prediction model; (b) PES safety criterion.
Applsci 13 00121 g013
Table 1. Blasting parameters.
Hole TypeHole NumberBlasting Segment NumberHole Depth
(cm)
Charge per Hole
(kg/hole)
Total Charge
(kg)
Empty hole1 210
Cut hole411902.49.6
Relief hole421901.87.2
Auxiliary hole123, 41701.821.6
Perimeter hole155, 61700.913.5
Bottom hole471701.87.2
Sum39 59.1
Table 2. Data monitored from the pipeline vibration levels survey.
PointsHorizontal DistanceDistance from the Source (m)PPV (cm/s)
XYZResultant
T1−39450.620.730.541.10
T2−28360.690.790.571.20
T3−25330.730.840.621.27
T4−17280.770.860.681.33
T516270.790.900.651.36
T620300.710.830.591.24
T728360.660.770.521.15
T837430.590.710.461.03
T951560.420.540.400.79
T1058620.390.500.360.72
Table 3. Variables associated with surface PPV affected by the blasting excavation of the water conveyance tunnel.
VariablesSymbolDimension
Displacement μL
Peak particle velocityvLT−1
Particle vibration accelerationaLT−2
Main frequencyfT−1
ChargesQM
Distance from blast sourcerL
Depth of blast sourcedL
Density of surrounding rockρML−3
Phase velocitycLT−1
TimetT
Note: L is the dimension of length, M is the dimension of mass, and T is the dimension of time.
Table 4. PPV prediction model for each direction of the ground soil and correlation coefficient.
Direction Correlation Coefficient
X P P V = 66.96 Q 1 / 3 r 0.91 0.82
Y P P V = 60.34 Q 1 / 3 r 0.74 0.85
Z P P V = 52.98 Q 1 / 3 r 0.80 0.83
Resultant P P V = 70.17 Q 1 / 3 r 1.31 0.89
Table 5. Calculation accuracy for different grid sizes.
Size of the Grid
(cm)
T3T4T5T6-
Velocity
(cm/s)
Velocity
(cm/s)
Velocity
(cm/s)
Velocity
(cm/s)
Time
(h)
10–251.161.271.281.1258
25–501.211.251.321.2129
50–751.261.291.351.1714
50–1001.241.311.341.205
75–1001.291.281.411.191.2
Results of field monitoring1.271.331.361.24-
Table 6. Material parameters.
ParametersUnitsType
PipelineSurface SoilSintered Tuff
Densityg/cm37.621.642.712
Elastic modulusGPa2000.0753.56
Shear modulusGPa606.37 × 10−318.34
CohesionMPa 0.086.4
Tensile stressMPa2750.022.7
Poisson’s ratio 0.280.300.28
Frictional angle° 3747
Table 7. Error rate comparison between simulation and field results.
PointsPPV of Numerical Simulation (cm/s)PPV of Monitoring (cm/s)Error Rate
%
XYZXXYZResultant
T10.650.760.571.150.620.730.541.104.35
T20.710.840.591.250.690.790.571.204.00
T30.760.870.651.330.730.840.621.274.51
T40.790.890.721.390.770.860.681.334.32
T50.810.920.681.400.790.900.651.362.86
T60.740.870.631.300.710.830.591.244.62
T70.710.820.561.220.660.770.521.155.74
T80.620.750.491.090.590.710.461.035.50
T90.460.580.420.850.420.540.400.797.06
T100.420.530.390.780.390.500.360.727.69
Table 8. PES ratio of buried pipe and its attached soil.
Angle (°) PES   of   Soil   ( σ s ) / MPa PES   of   Pipe   ( σ p ) / MPa σ p σ s
02.463 × 10−30.72292.341
455.008 × 10−31.53305.514
902.745 × 10−30.94342.475
1351.476 × 10−30.57386.271
1803.569 × 10−31.25350.233
2251.393 × 10−30.42301.486
2701.938 × 10−30.63325.158
3153.532 × 10−31.16328.453
Average 328.991
Table 9. Simulation data and predicted results.
Horizontal DistancePES of Simulation (MPa)PPV of Simulation (cm/s)PPV Predicted by Equation (11)Error Rate of PPV
(%)
01.872.602.580.77
81.482.292.310.87
161.202.022.030.50
241.051.771.694.52
320.841.501.481.33
400.651.261.223.17
Disclaimer/Publisher’s Note: The statements, opinions and data contained in all publications are solely those of the individual author(s) and contributor(s) and not of MDPI and/or the editor(s). MDPI and/or the editor(s) disclaim responsibility for any injury to people or property resulting from any ideas, methods, instructions or products referred to in the content.