
Effect of Loading Conditions on the Shear Behaviors of Rock-like Materials Containing Circular Holes, with the CZM Method


Abstract
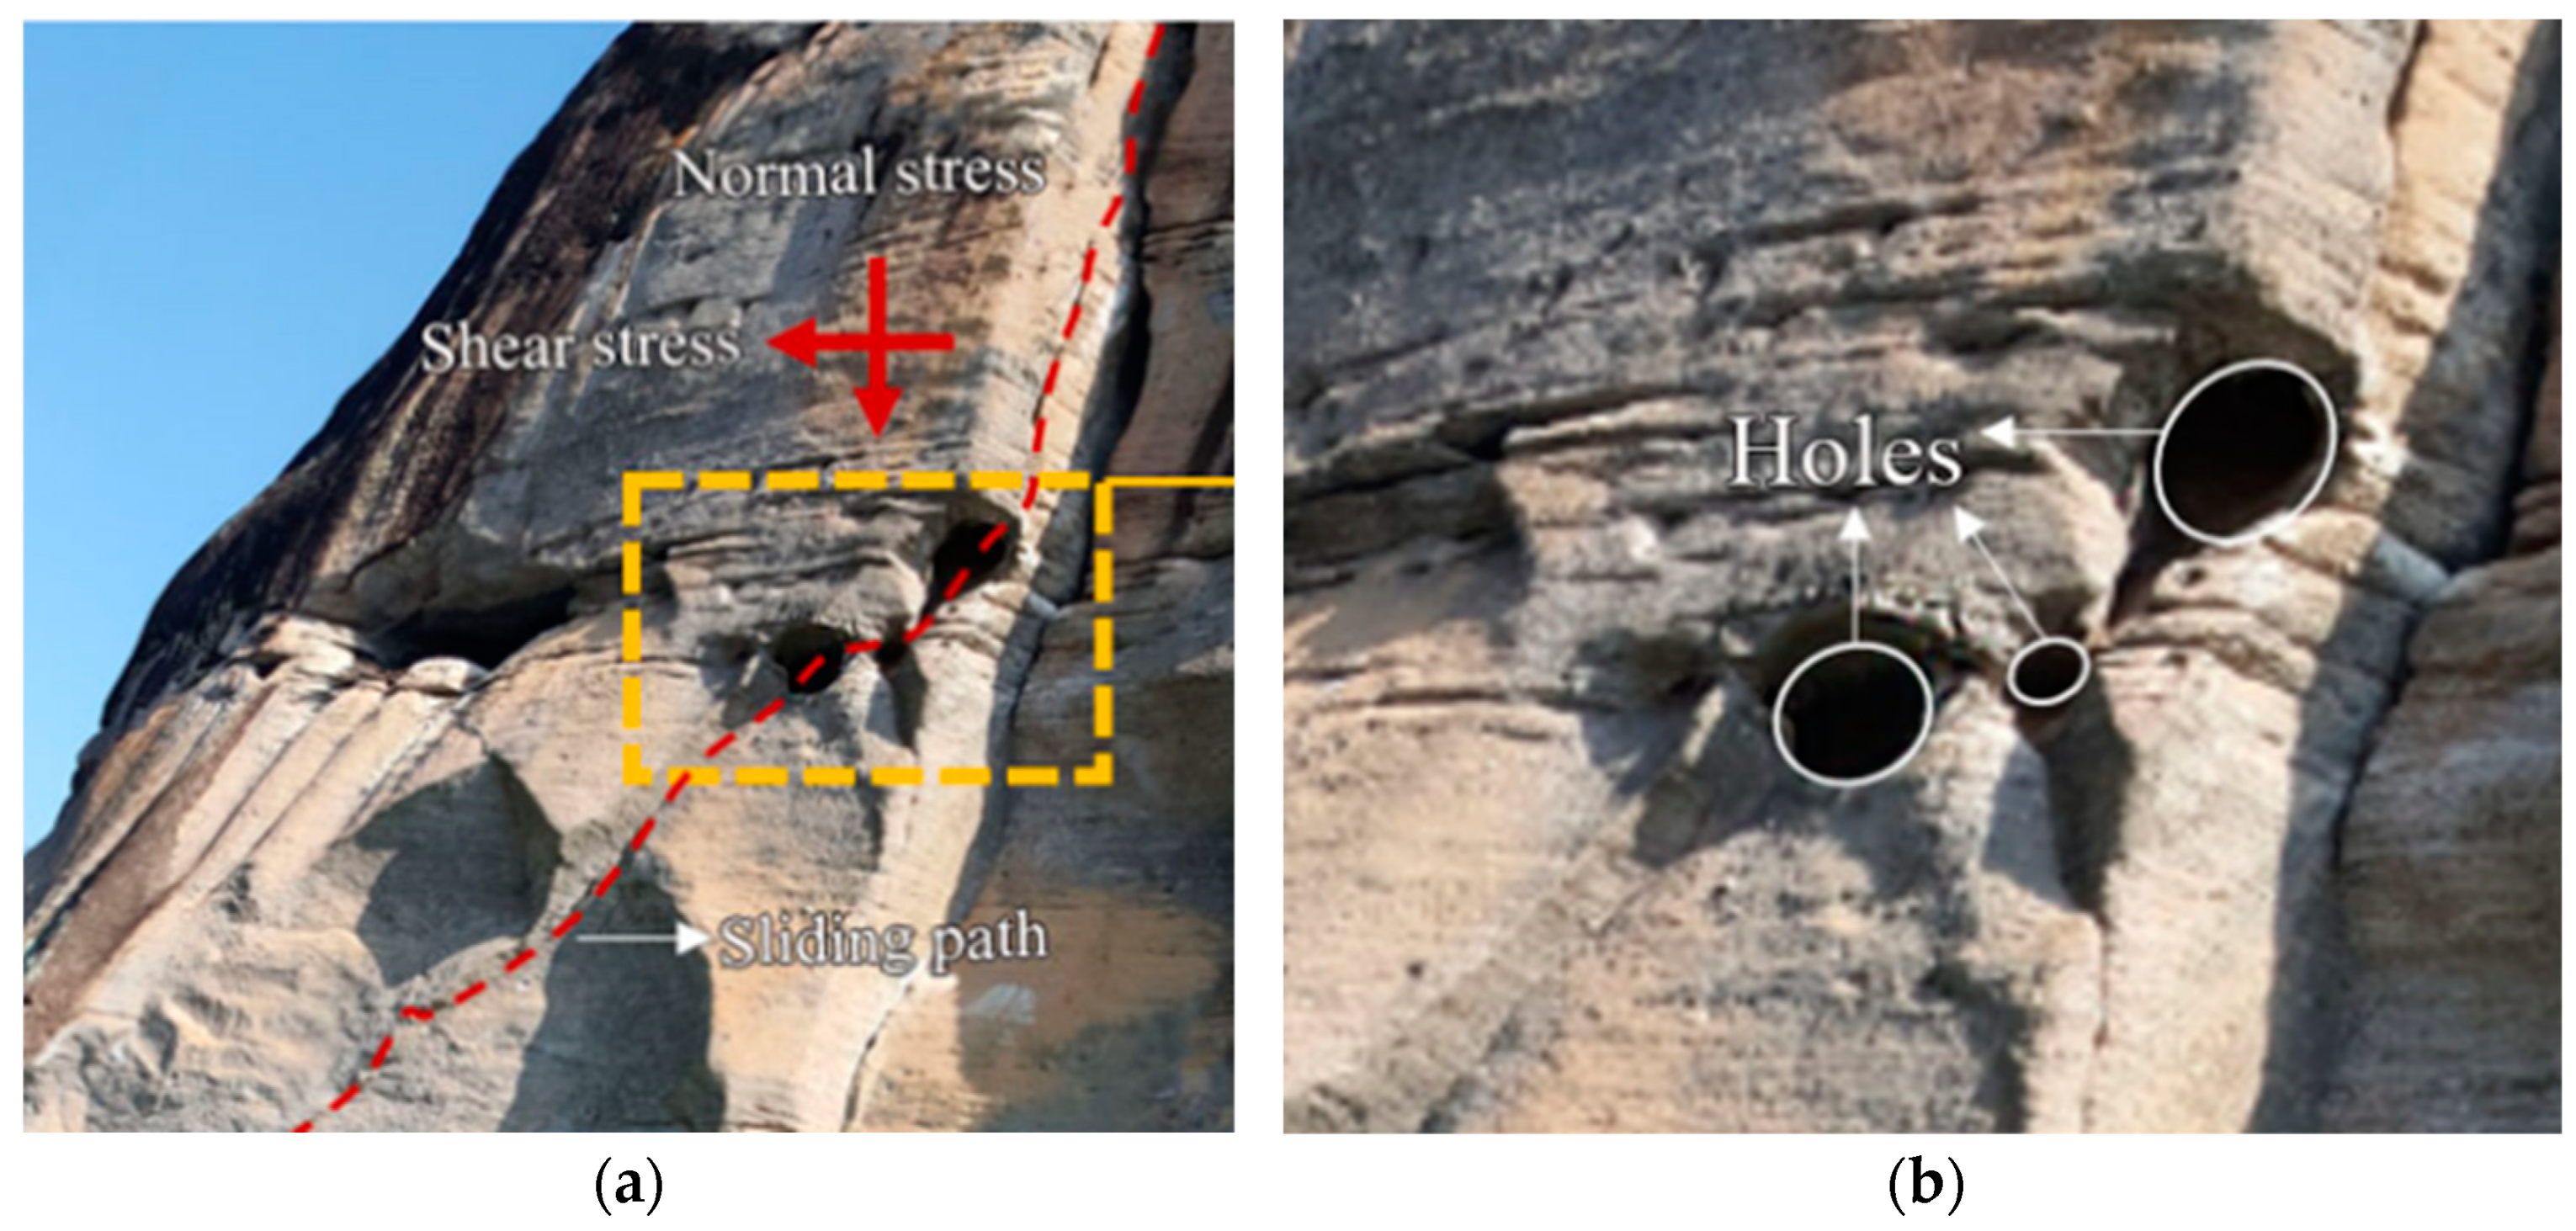
:1. Introduction
2. Materials and Methods
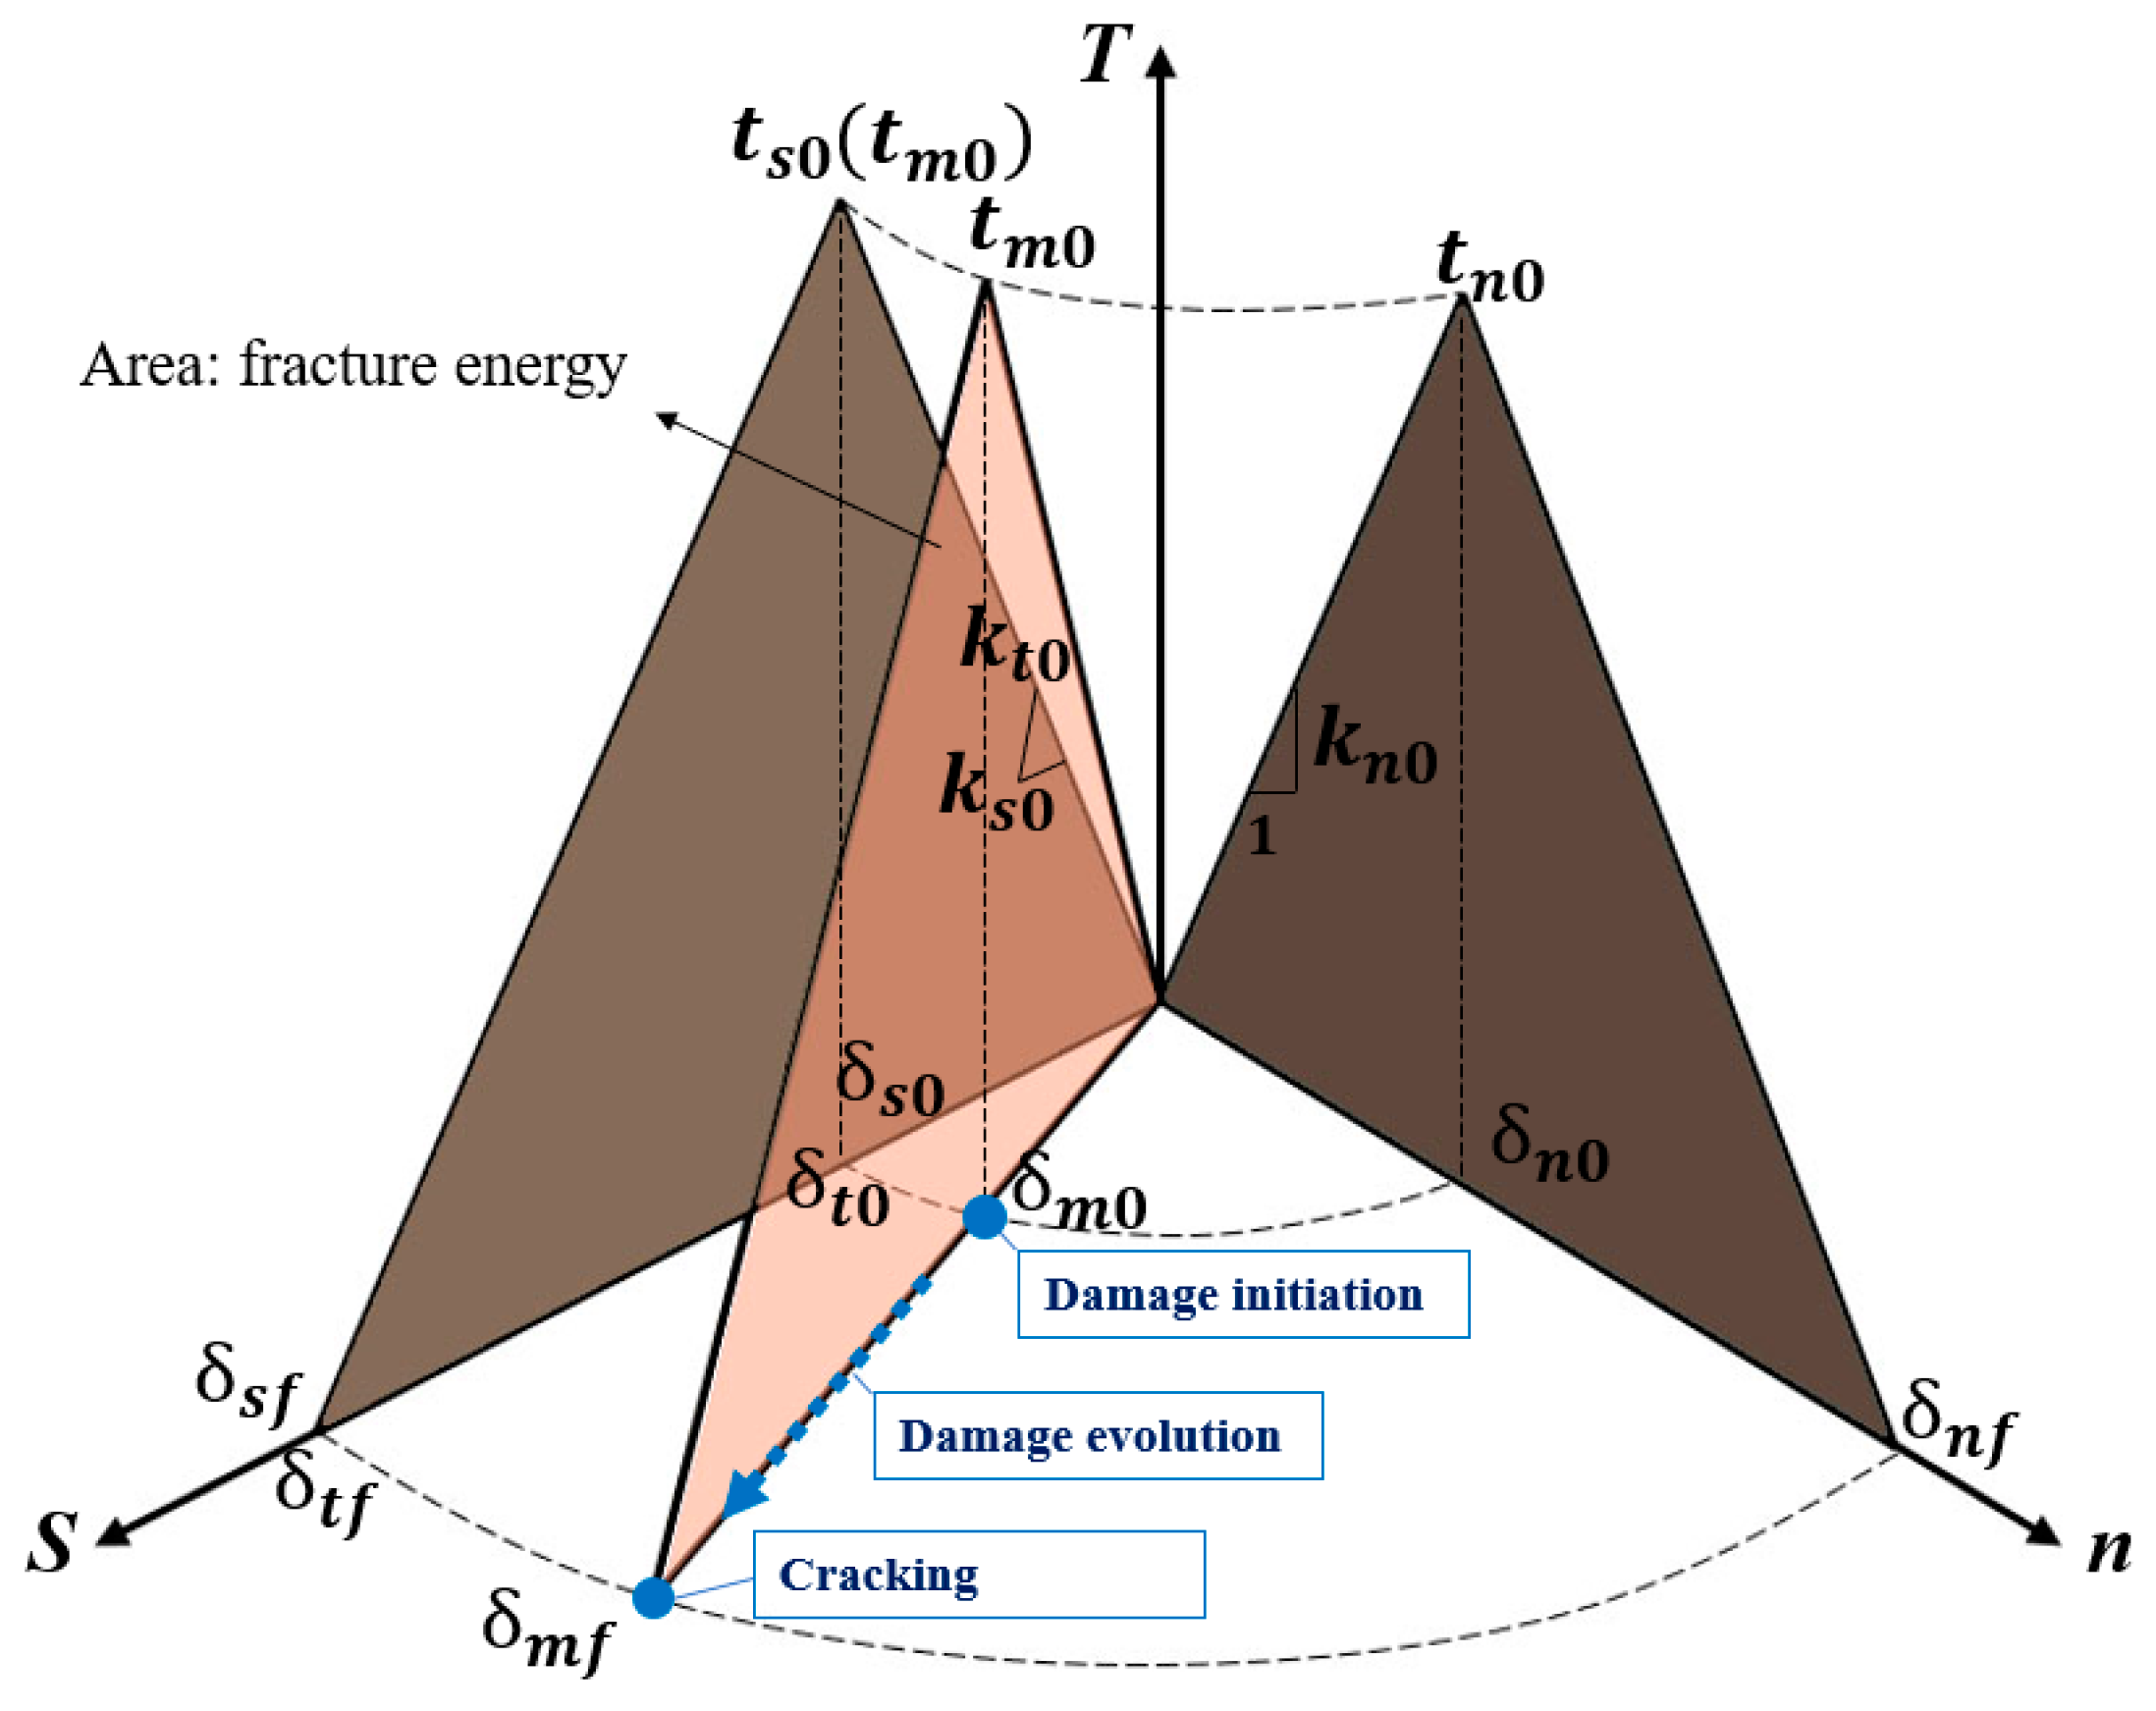
2.1. Traction Separation Criterion
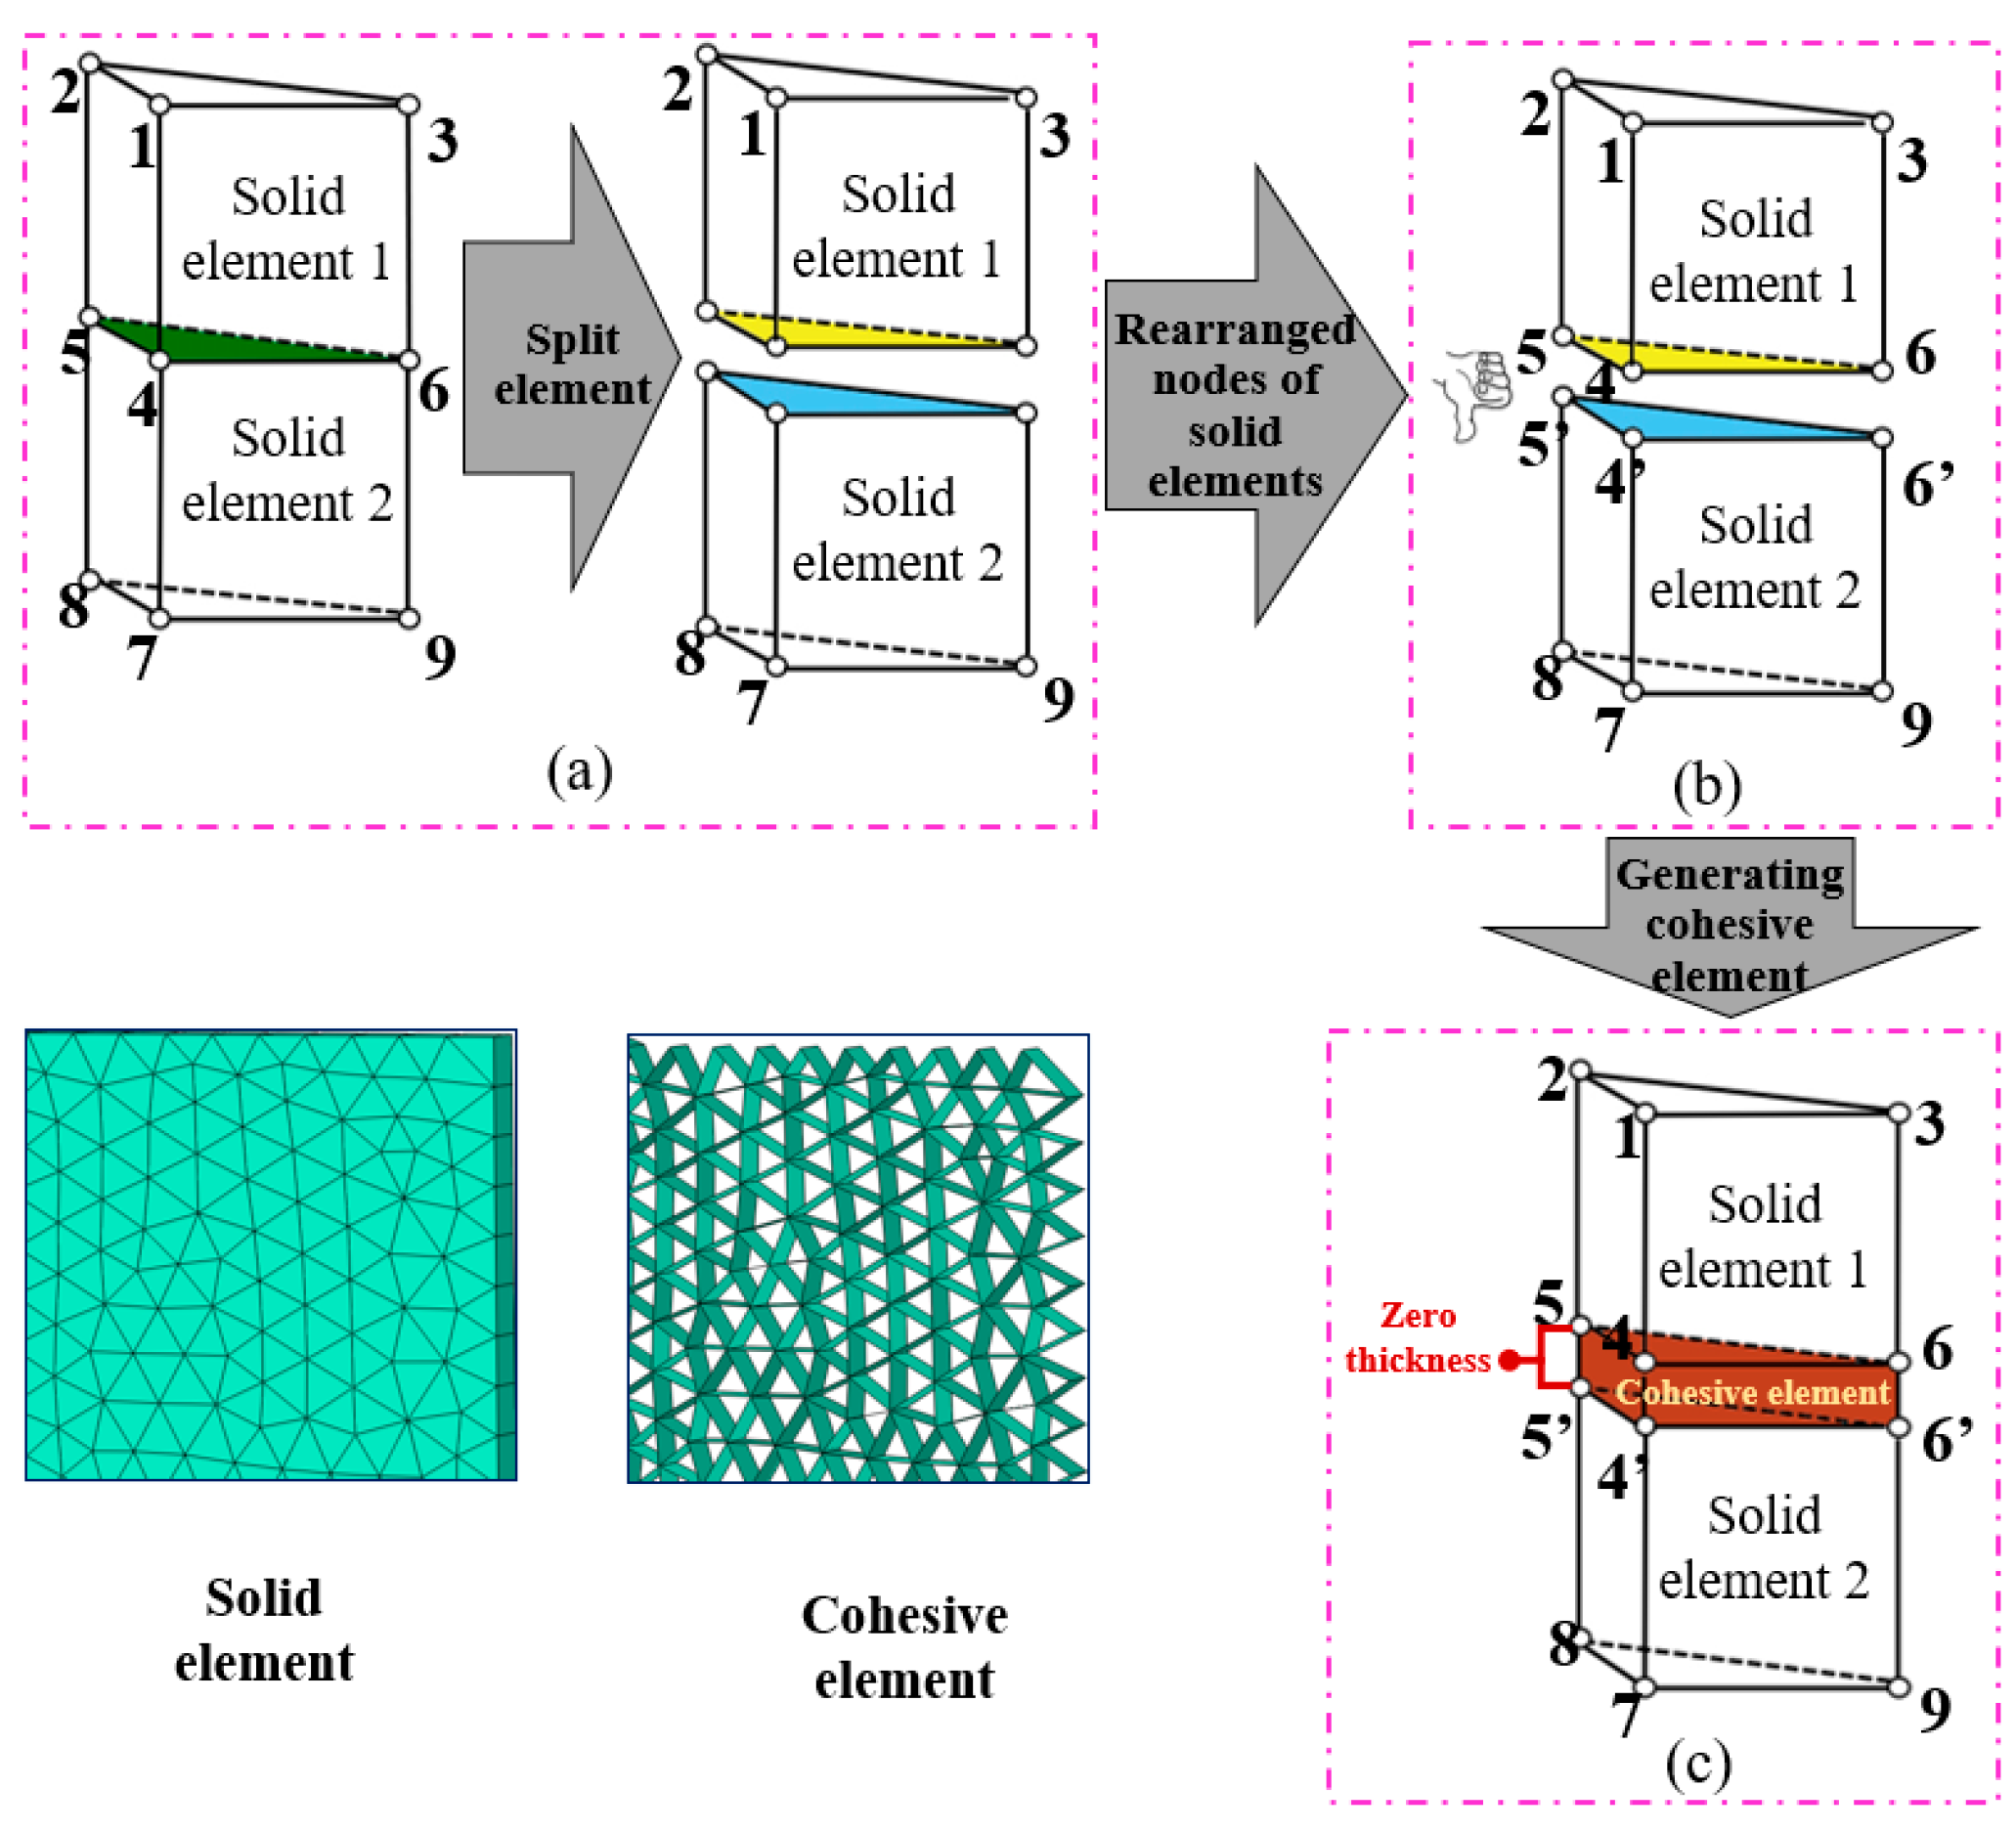
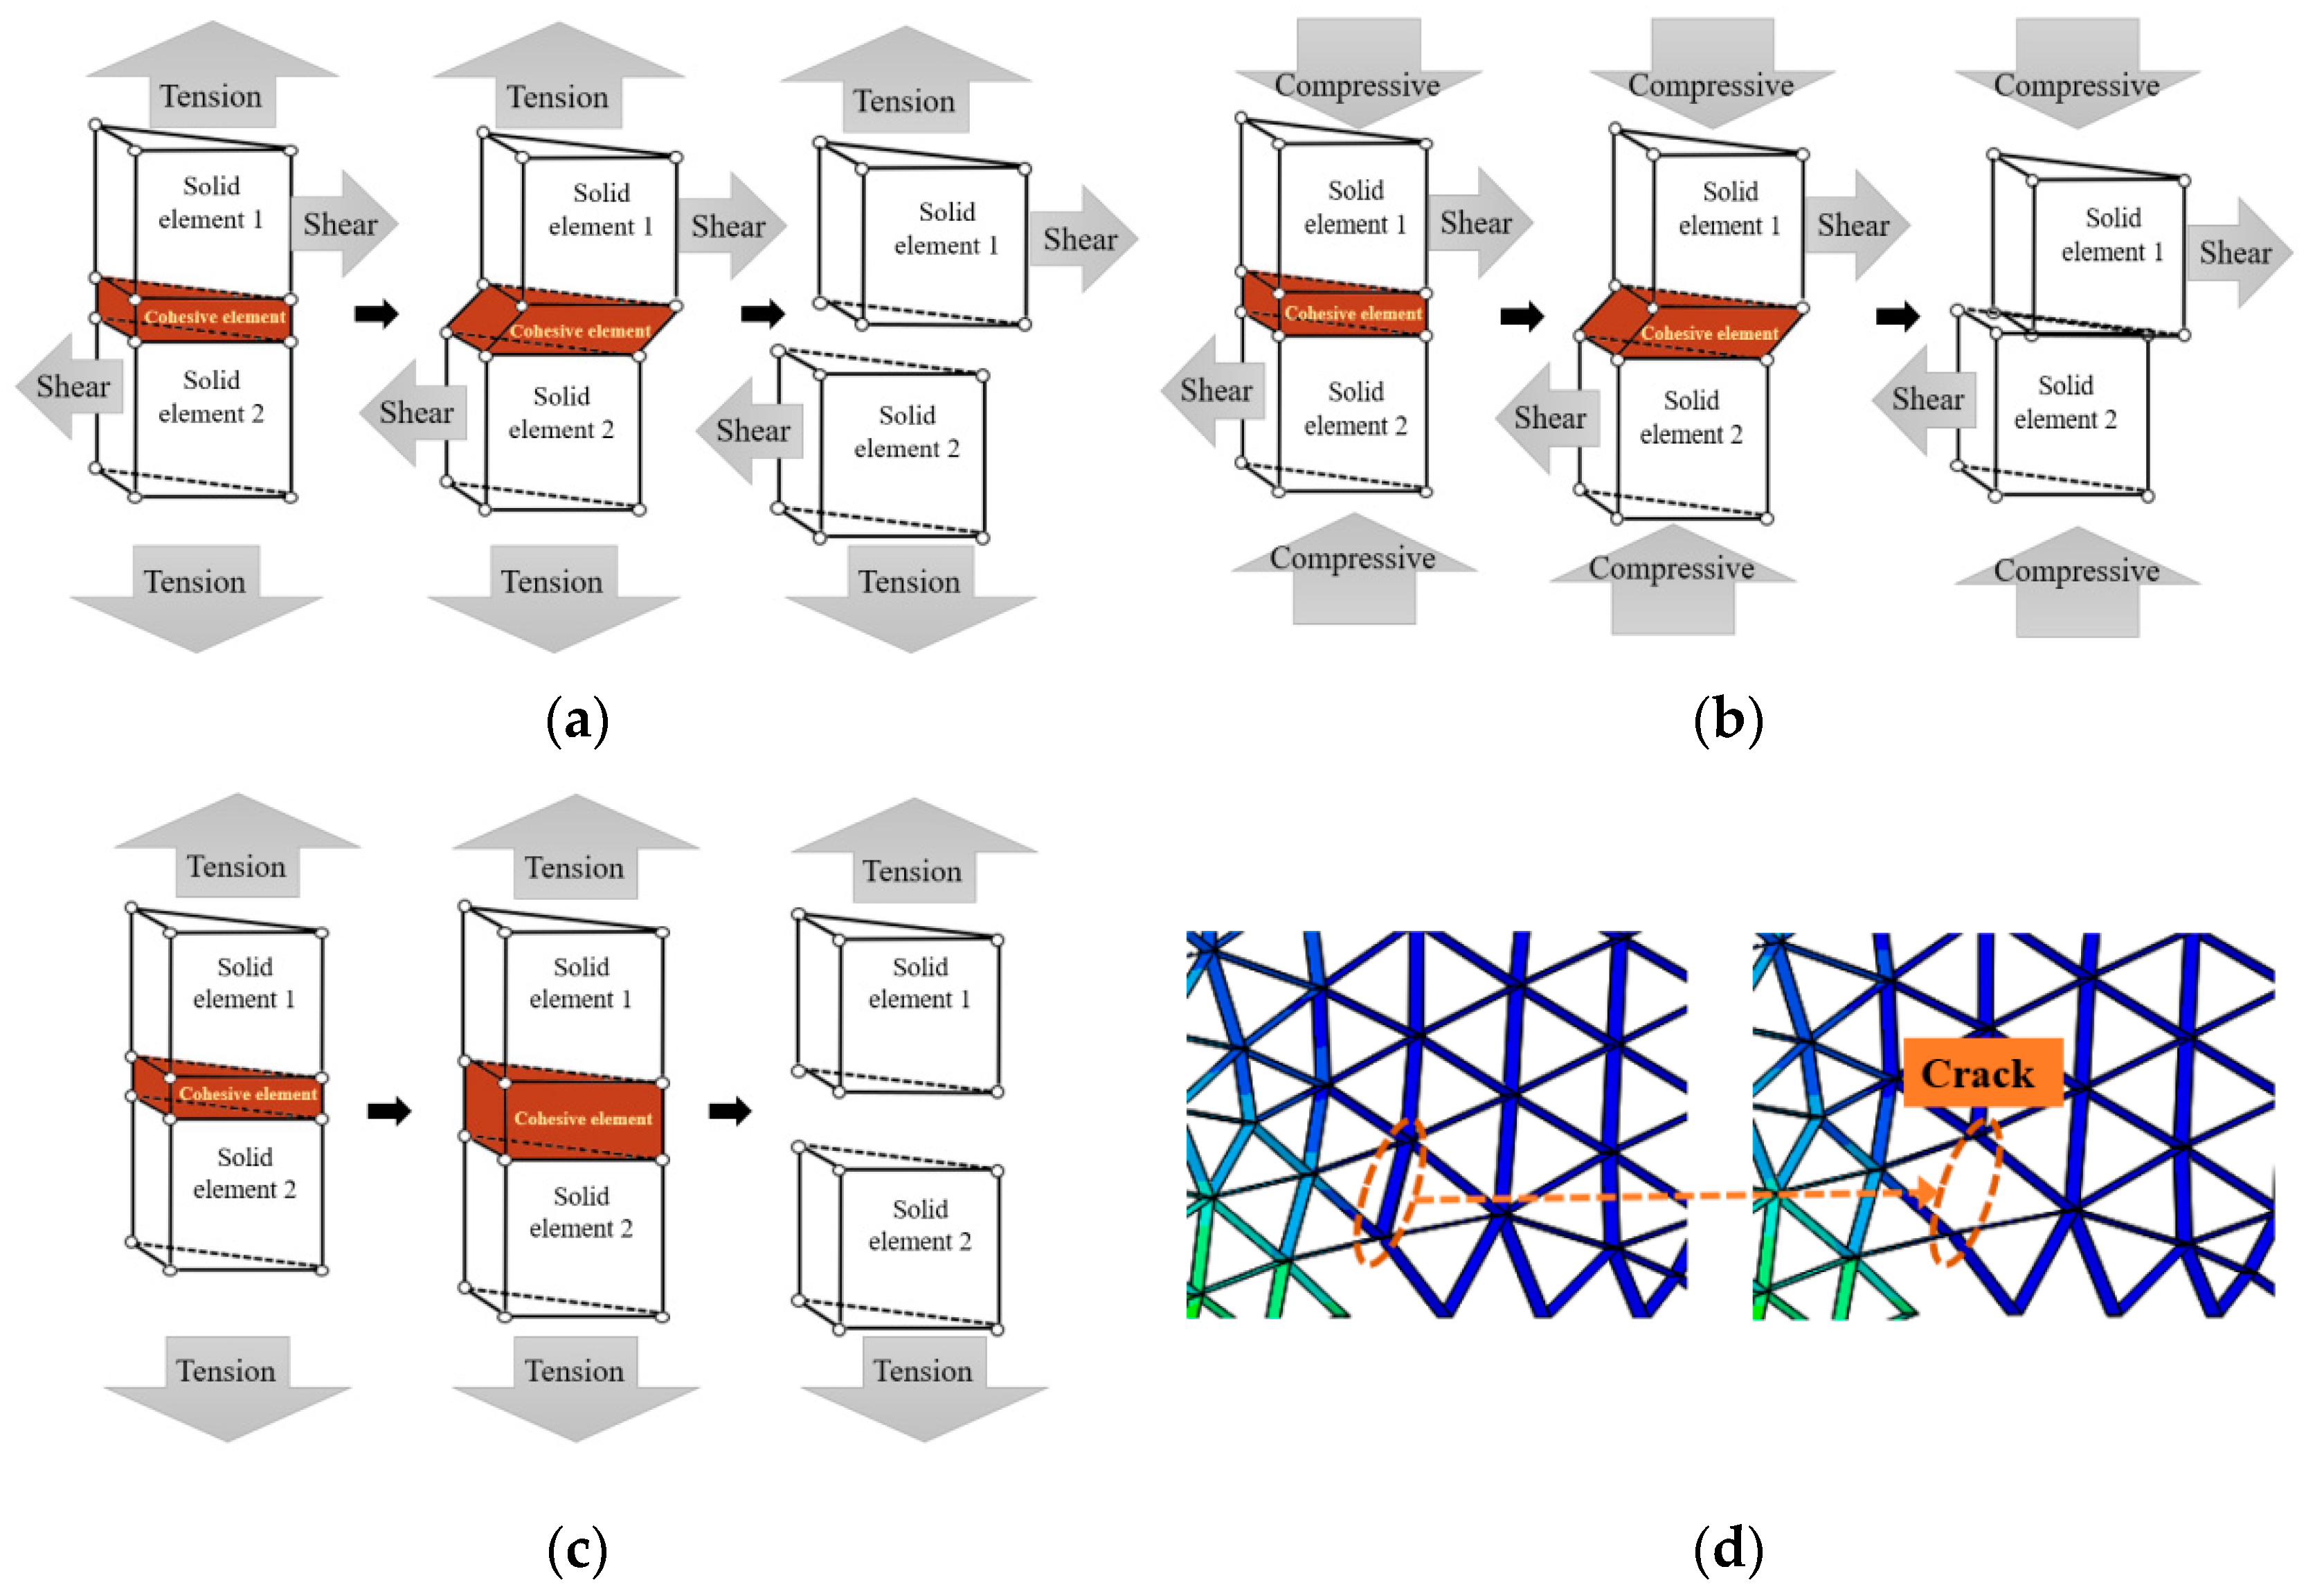
2.2. The Inserting Process of Zero-Thickness Cohesive Elements
3. Model Establishment
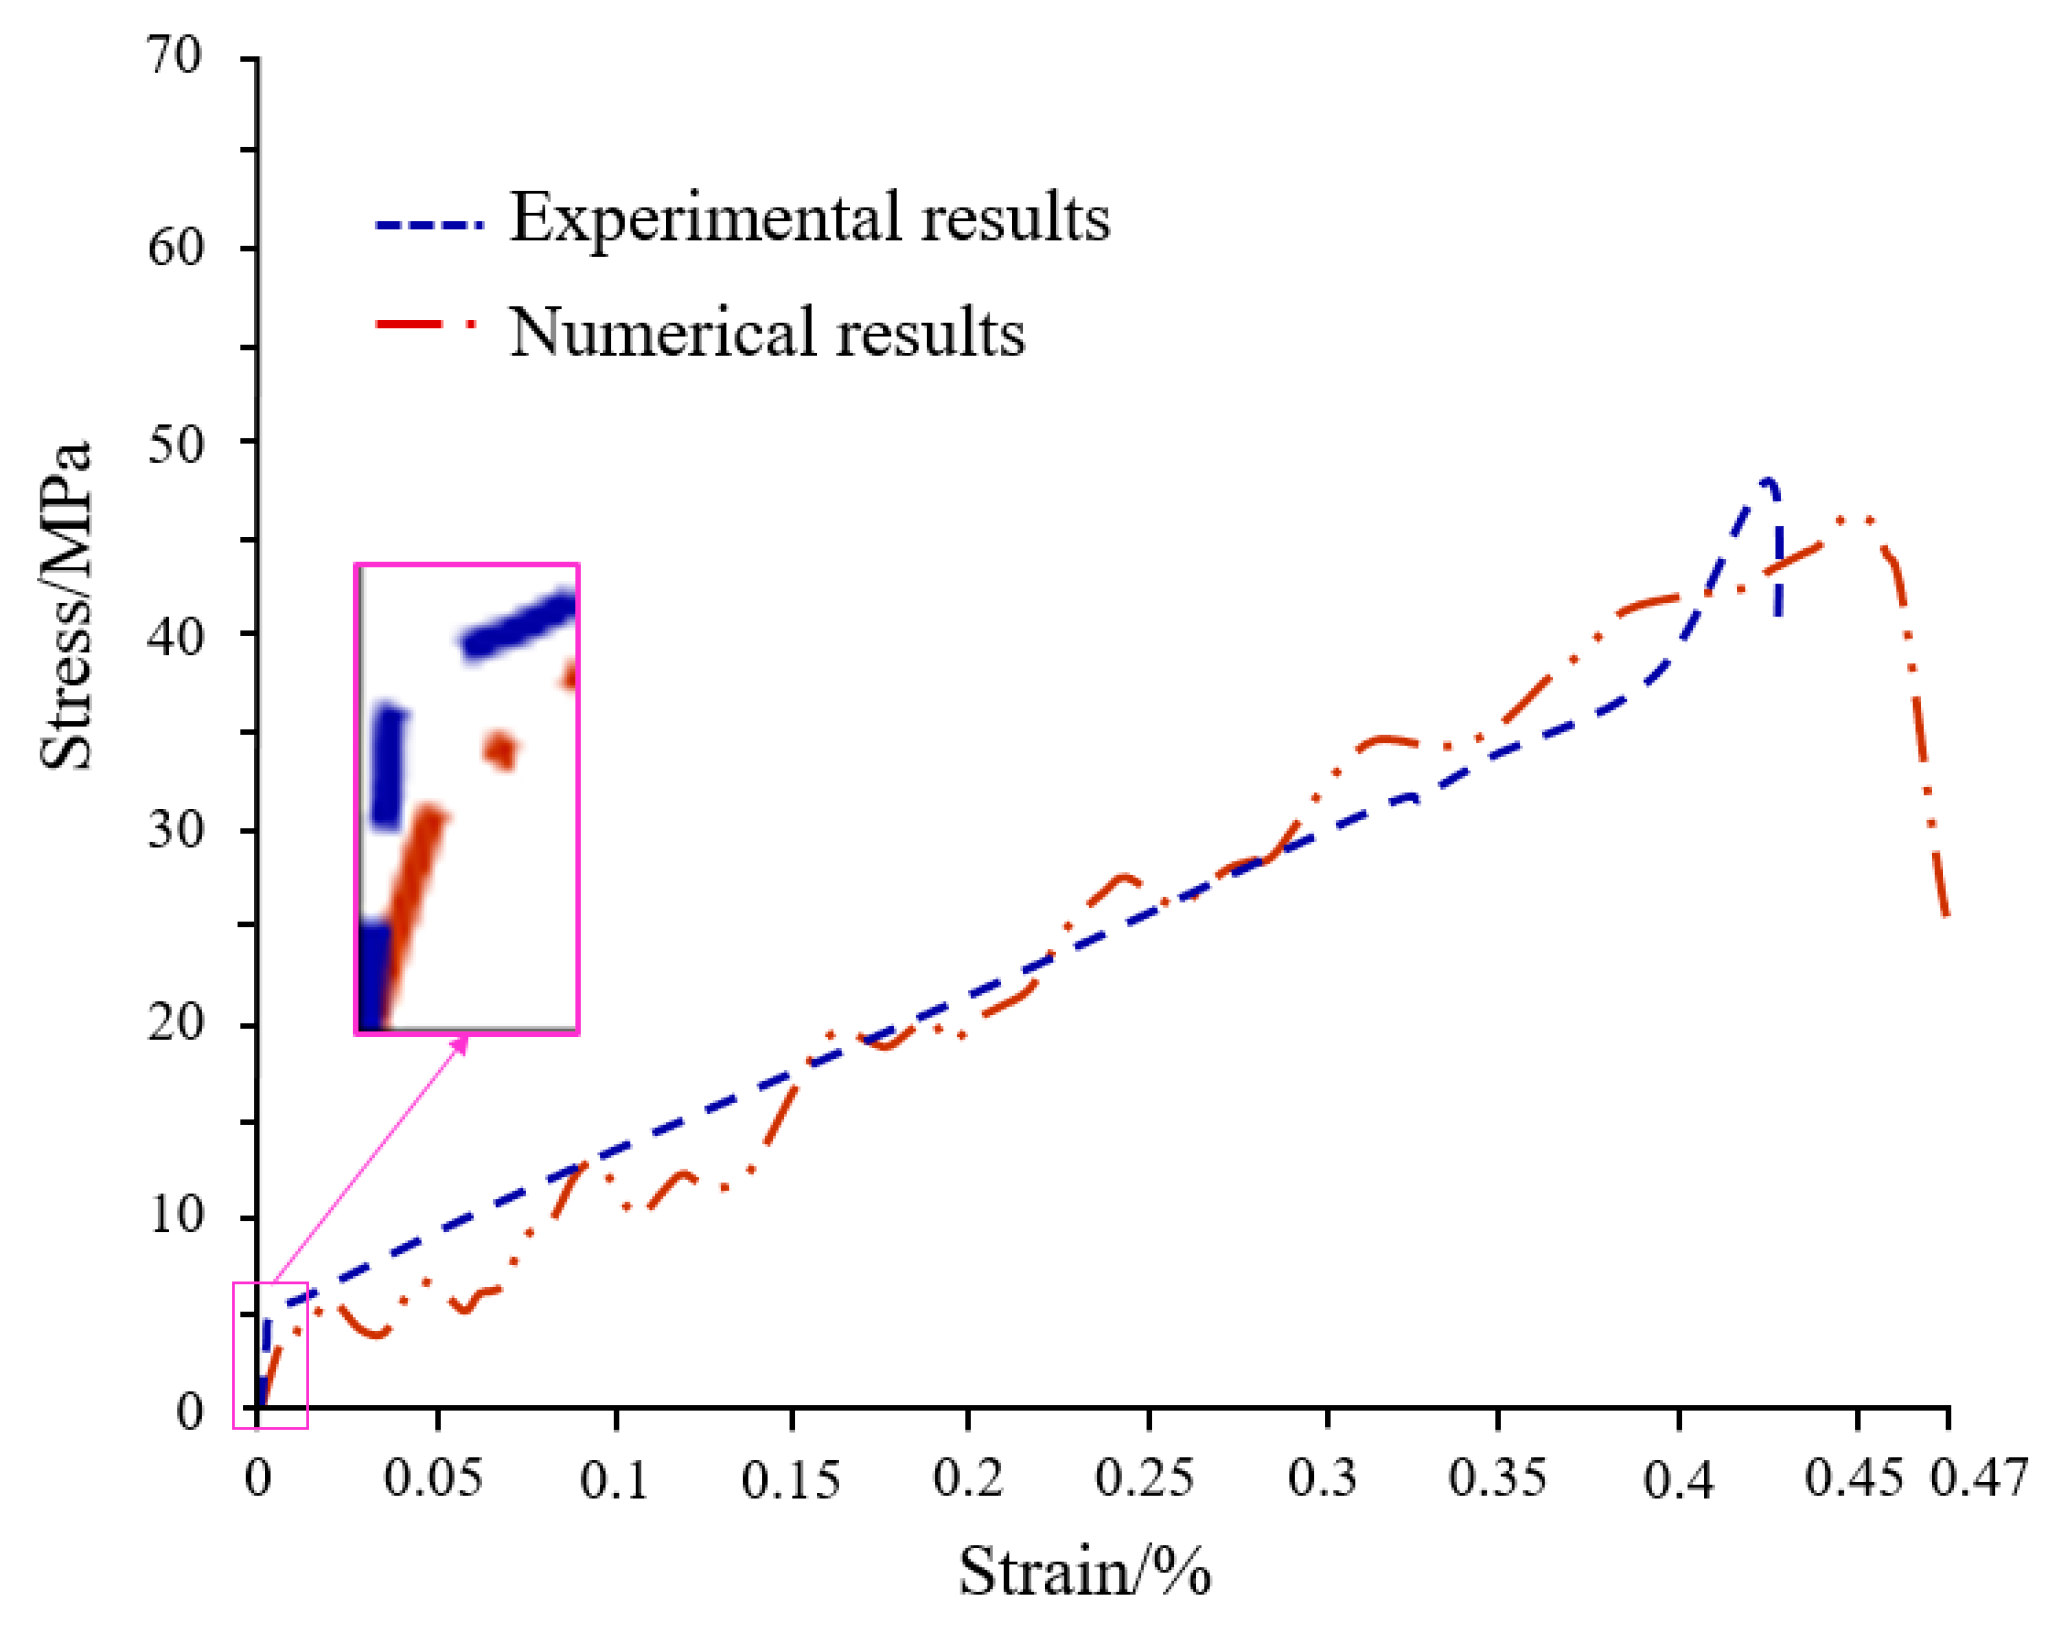
3.1. Determination of Parameters
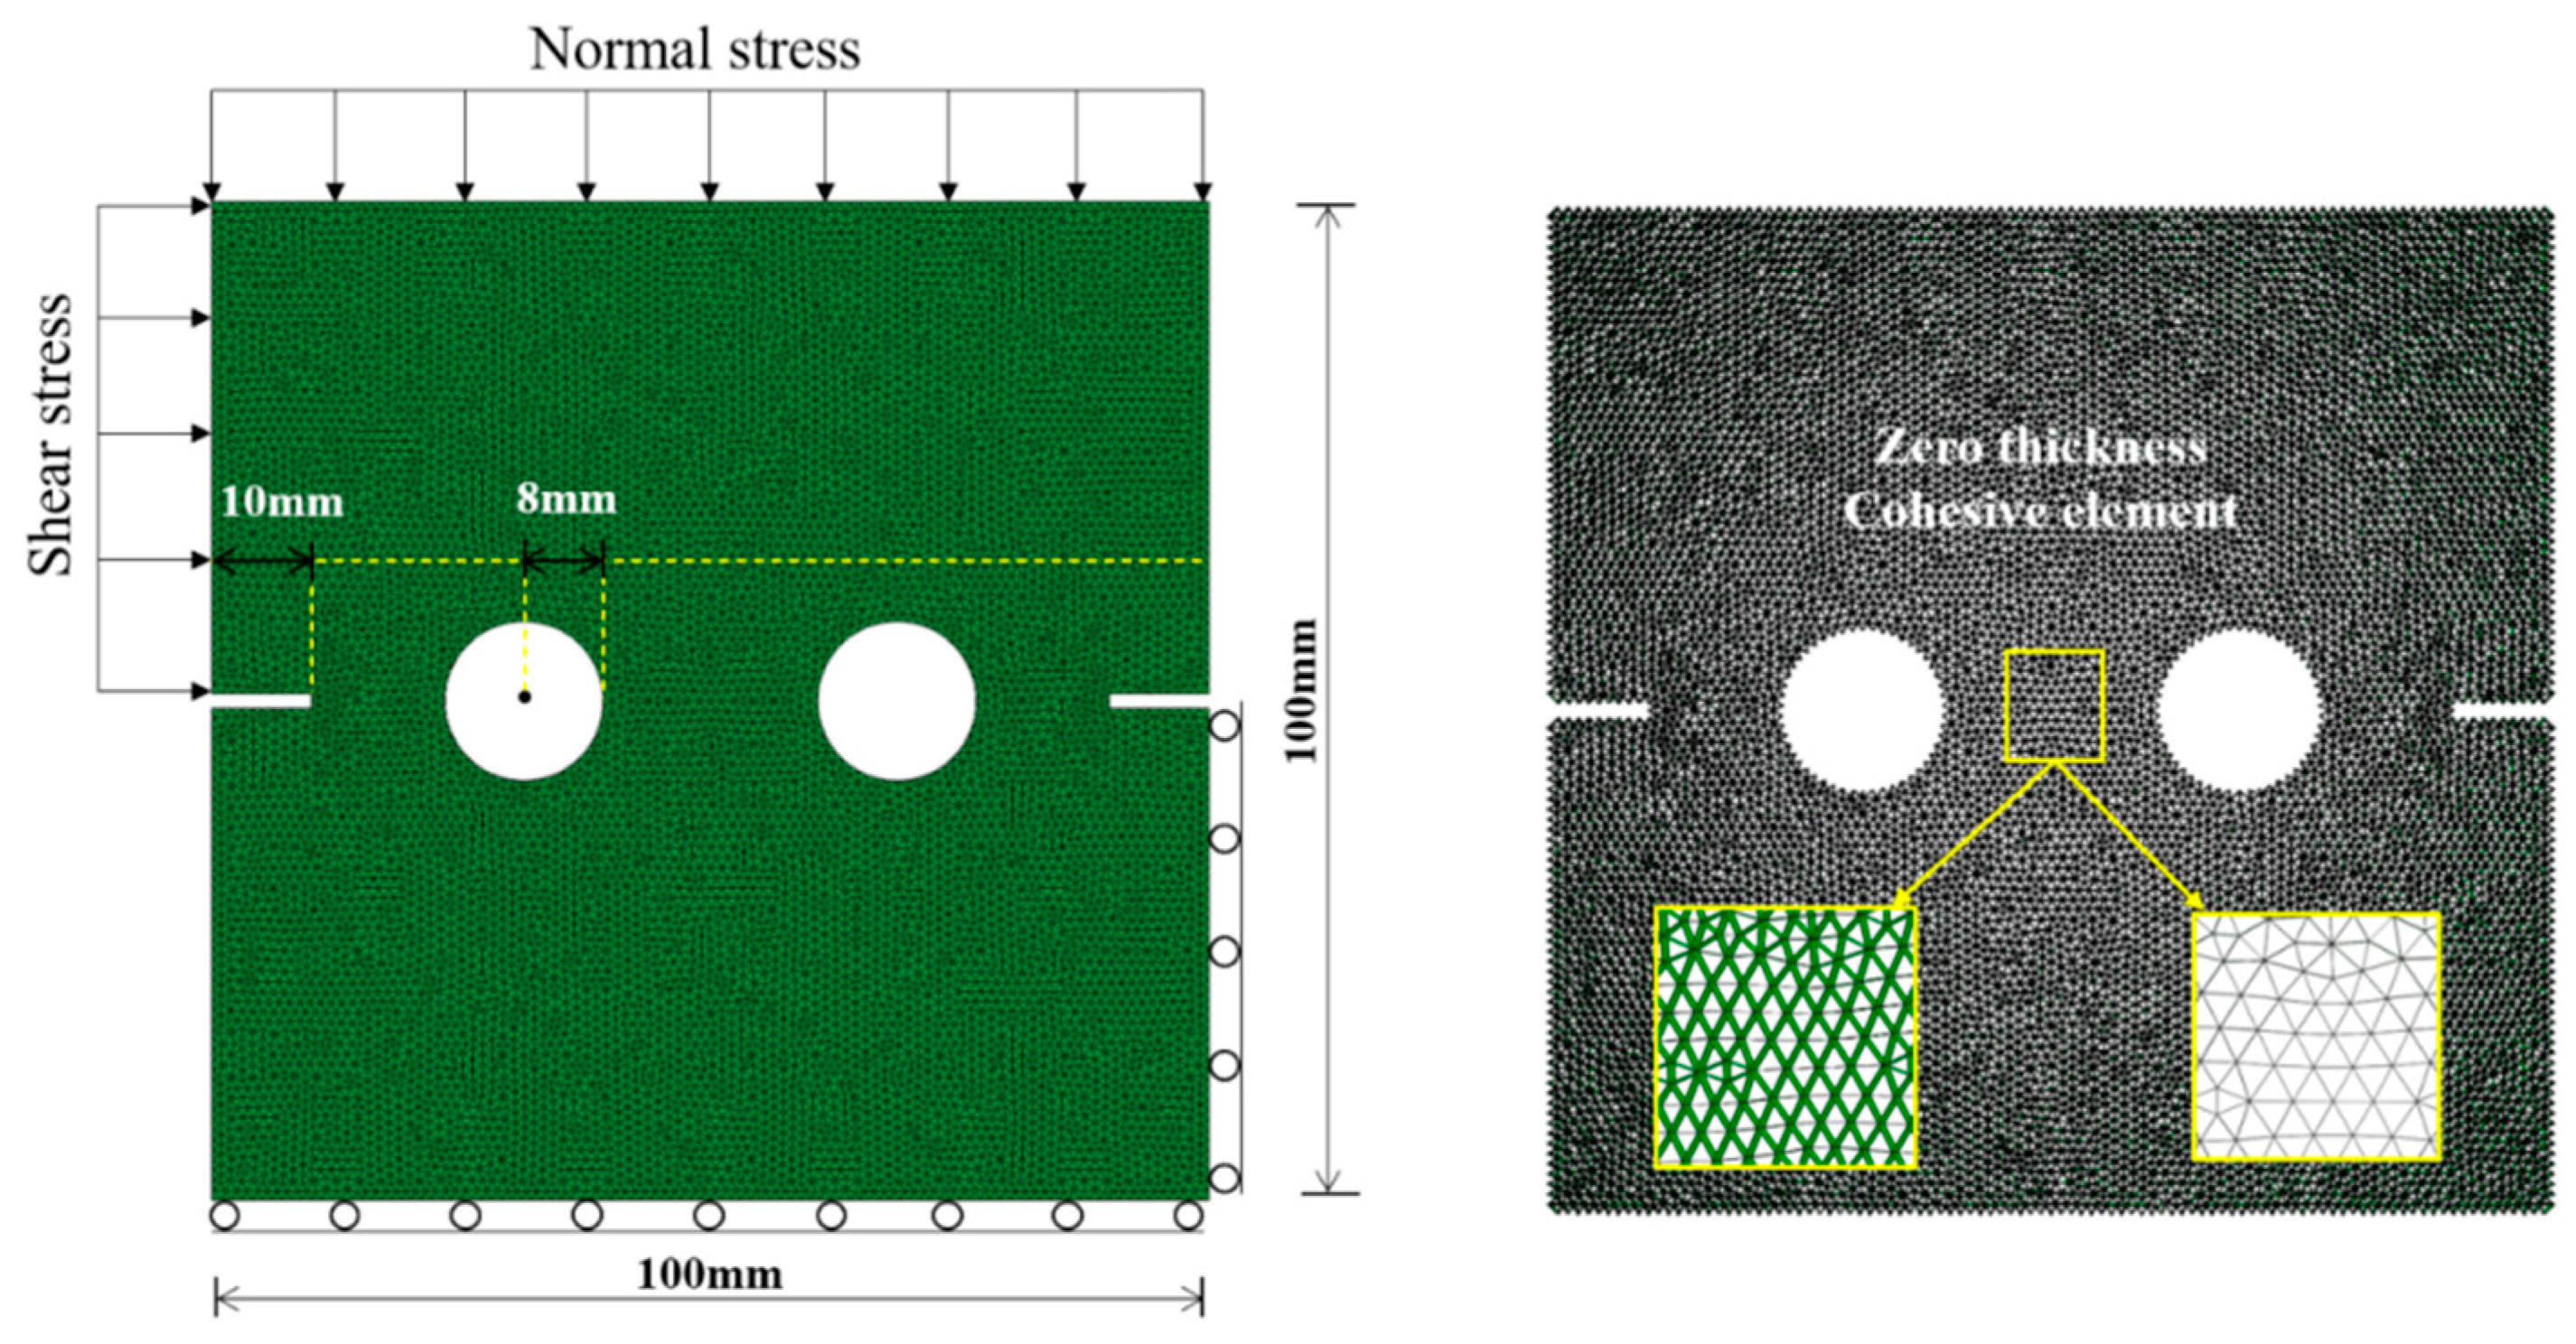
3.2. Establishment of the Direct Shear Test Model
4. Results of Numerical Simulation
4.1. Mechanical Properties
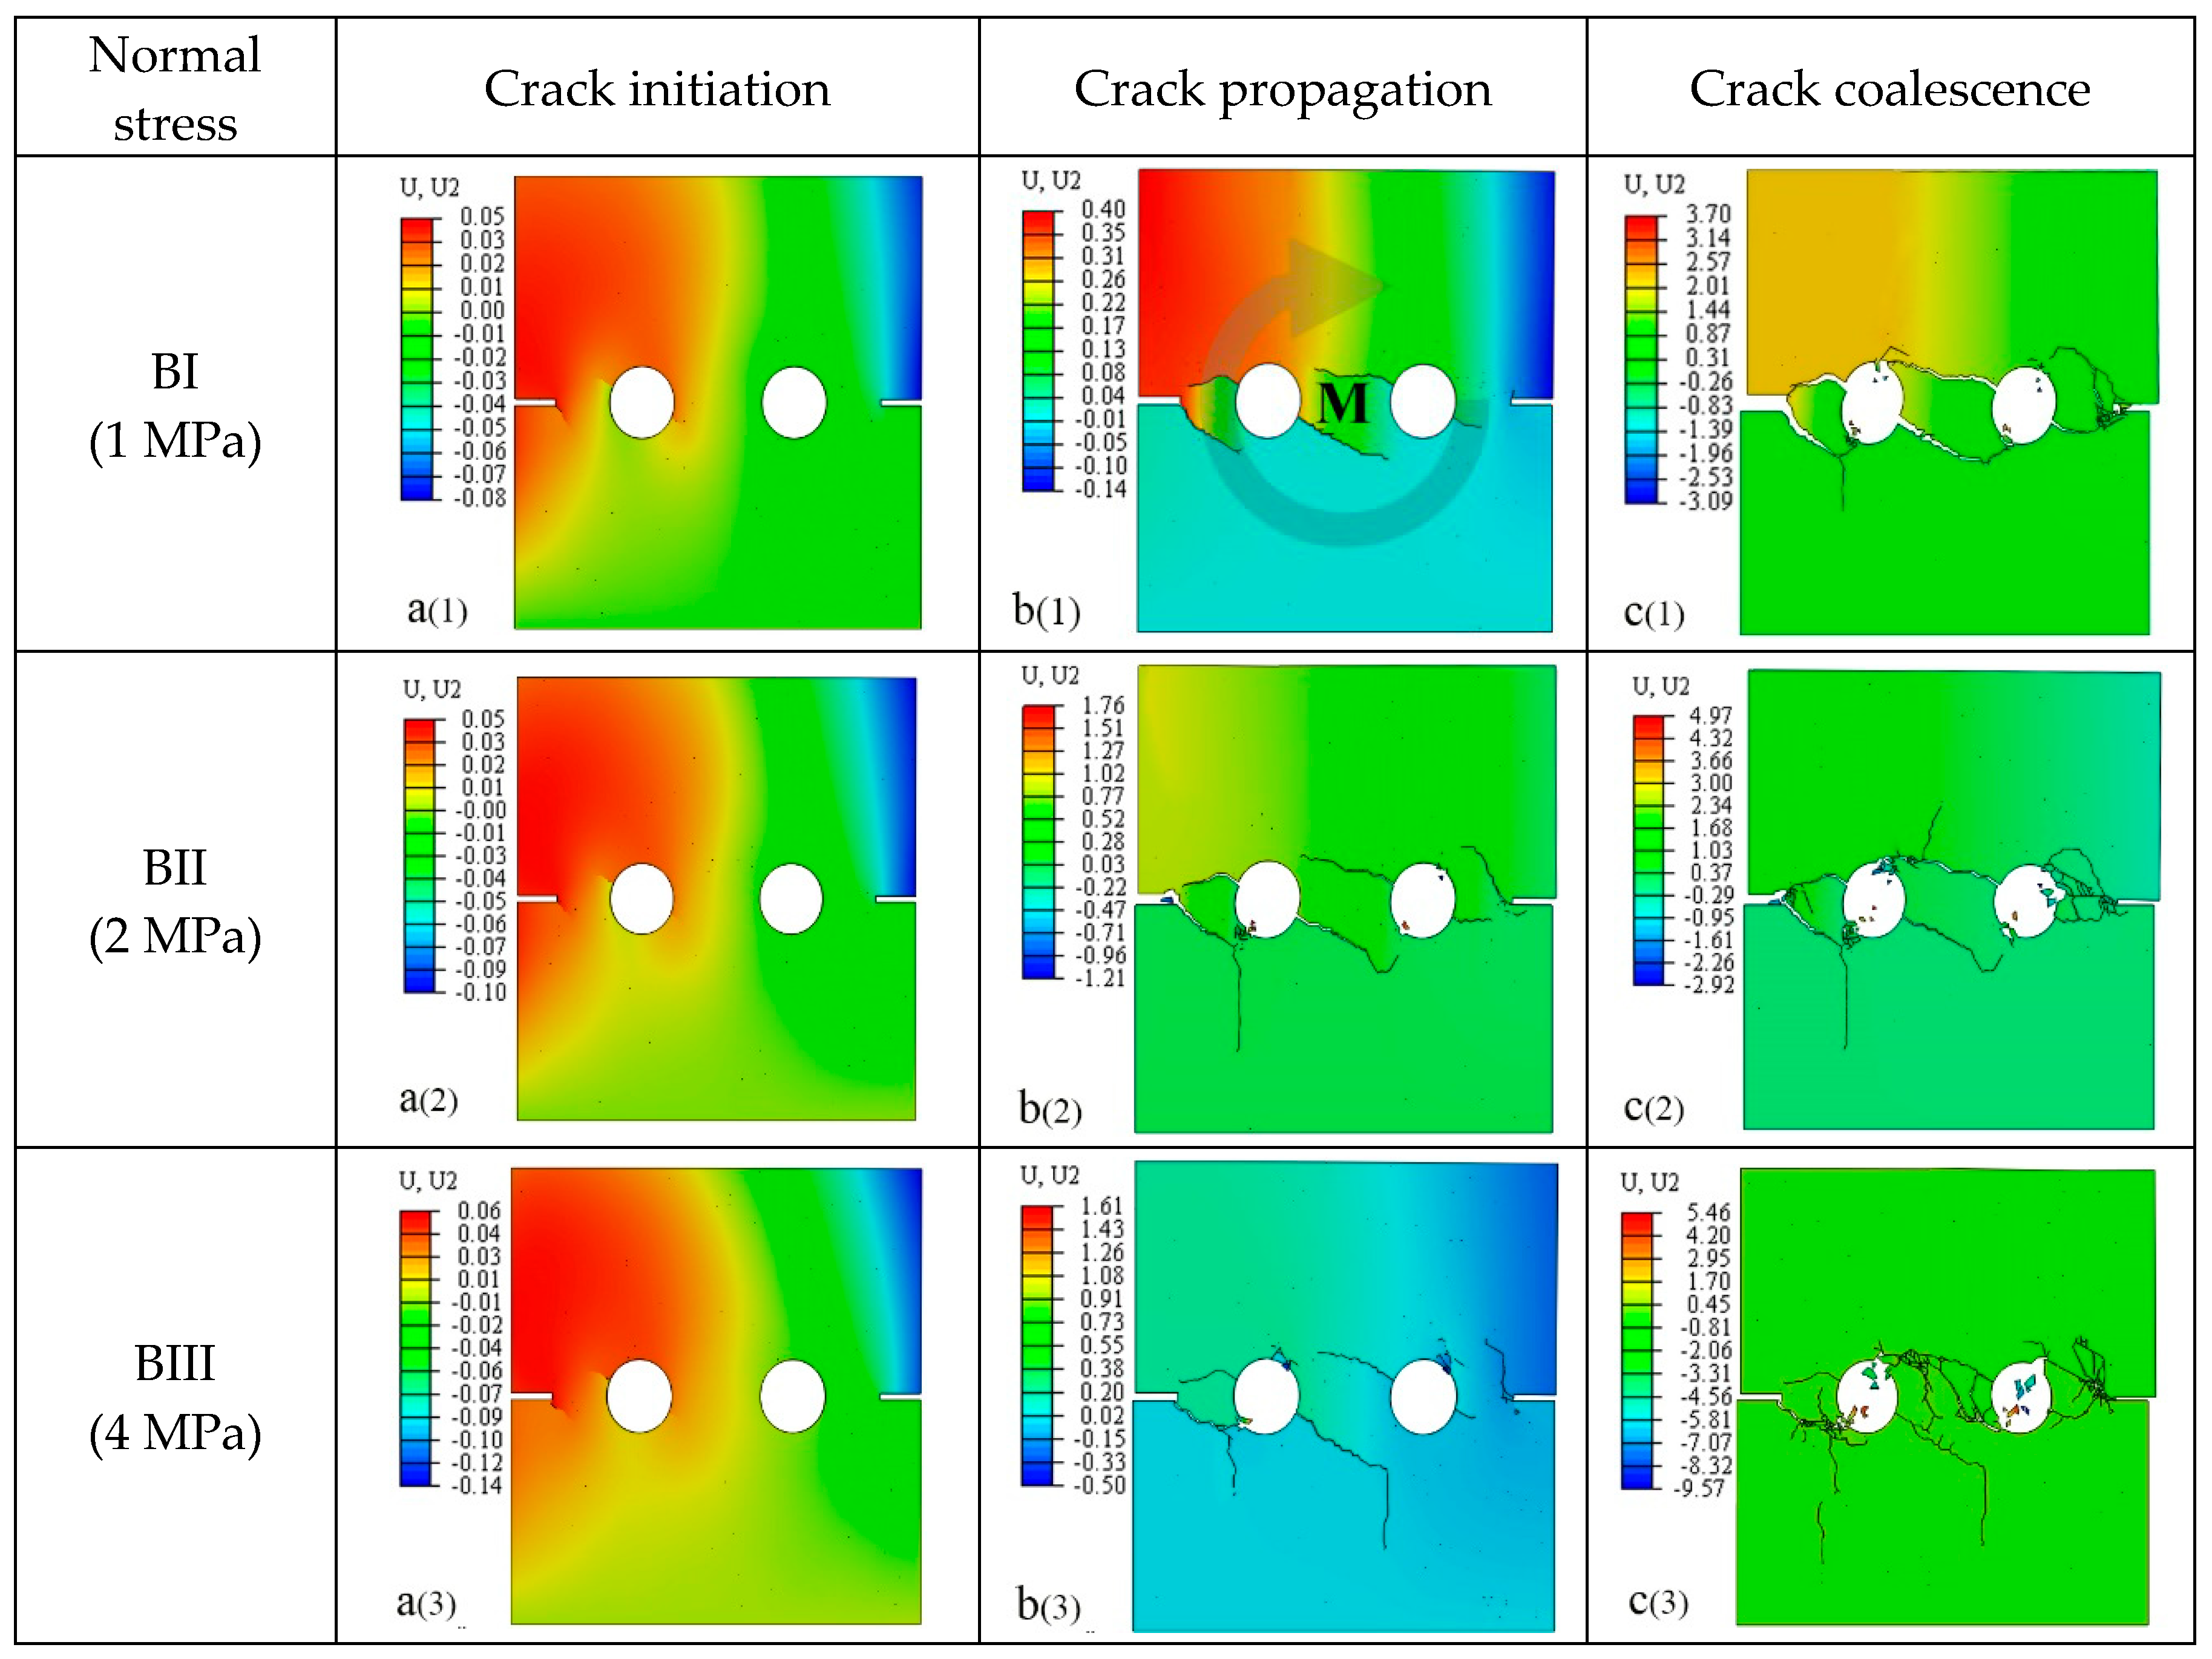
4.2. Normal Displacement Characteristics
4.3. Description of Cracking Behavior
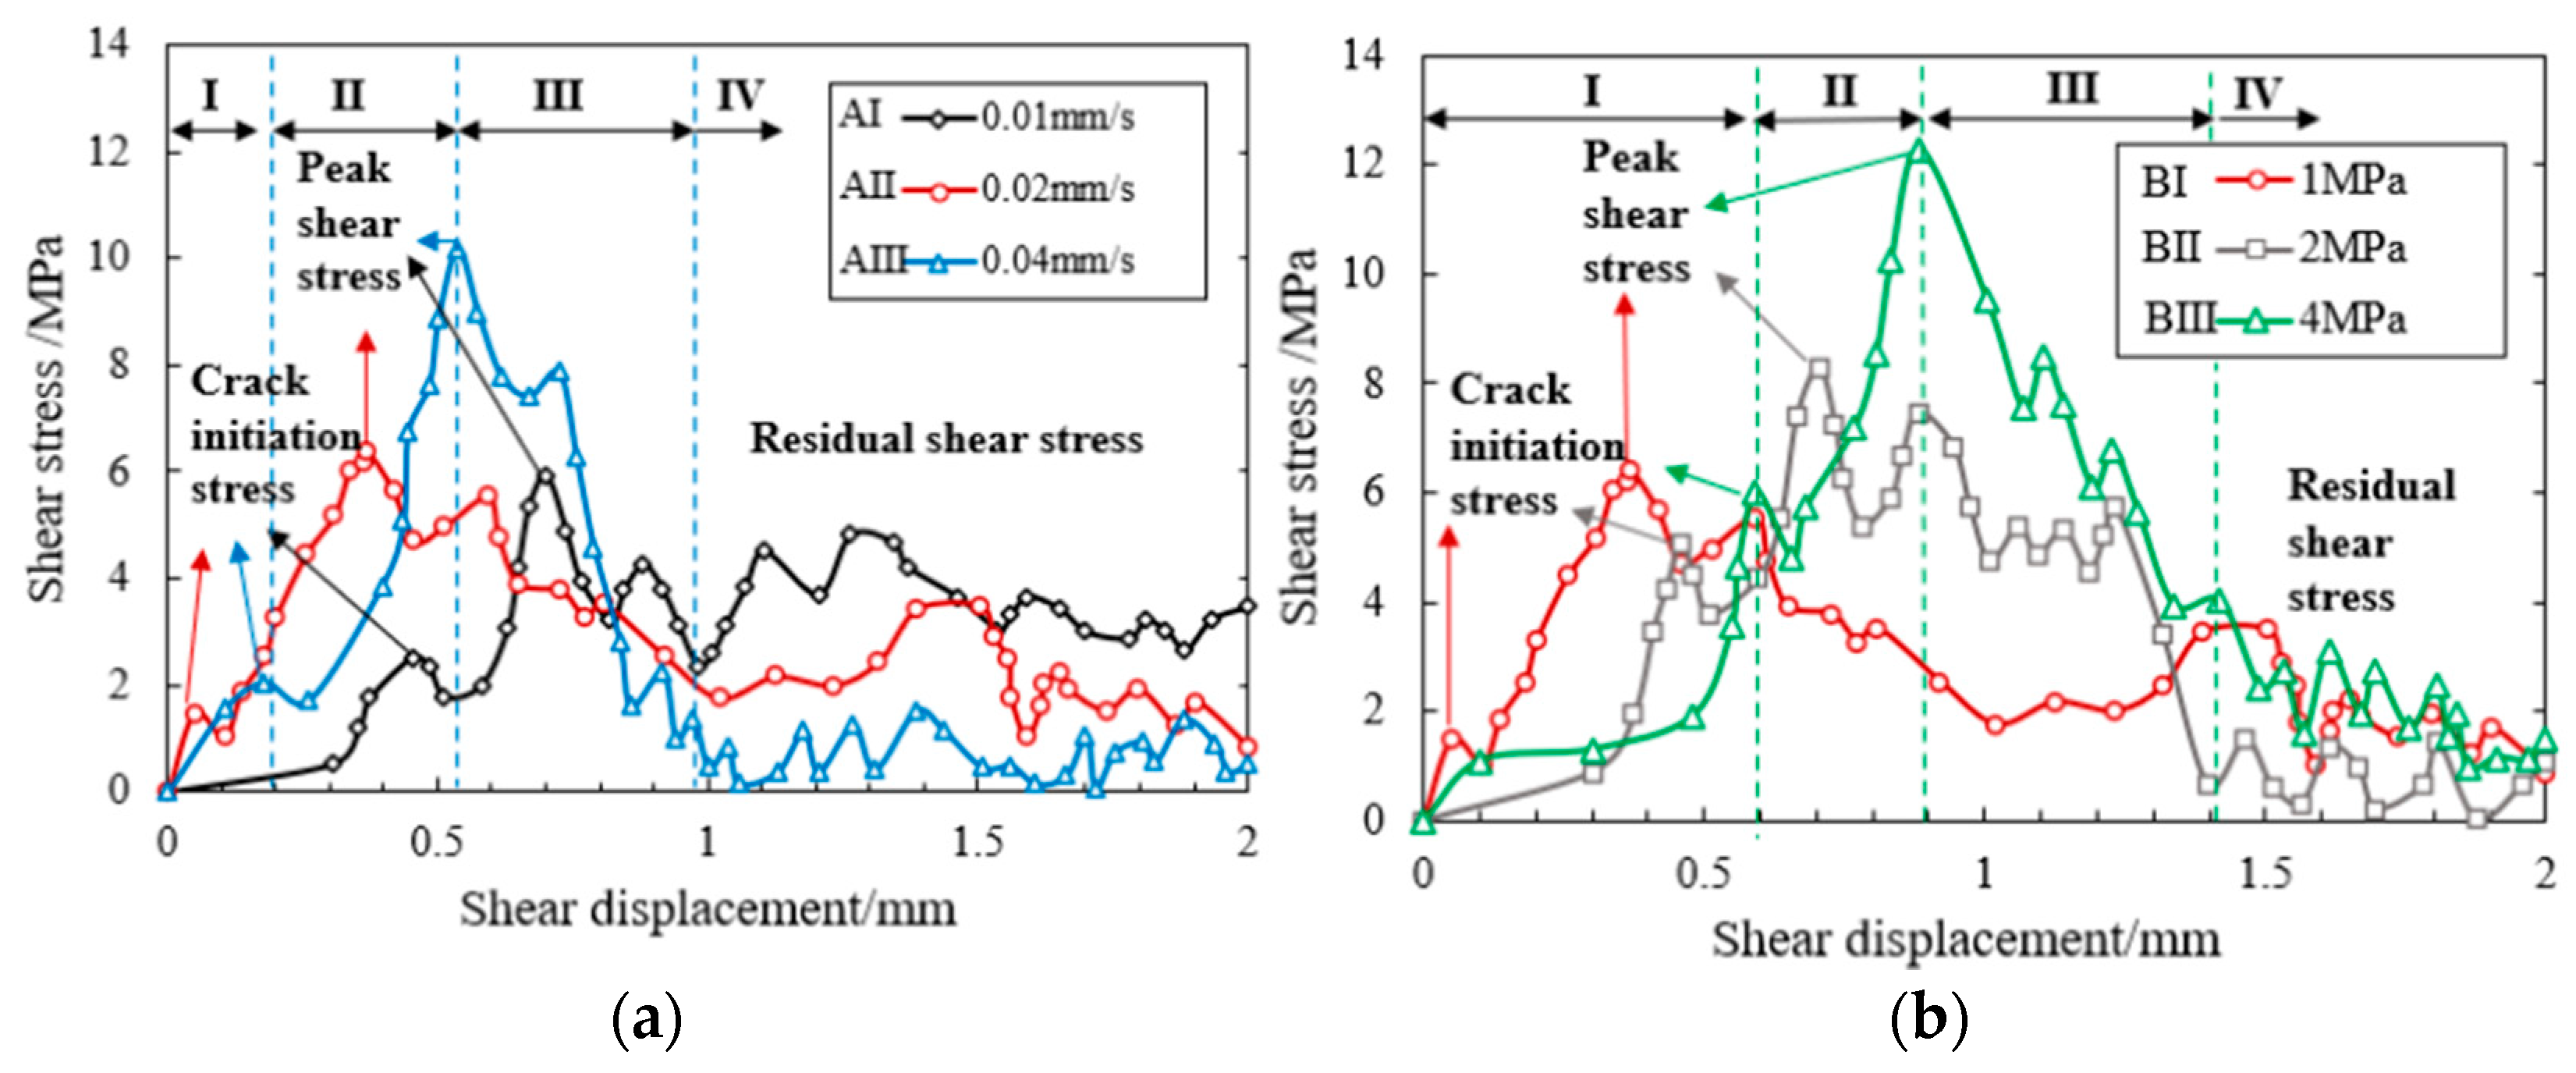
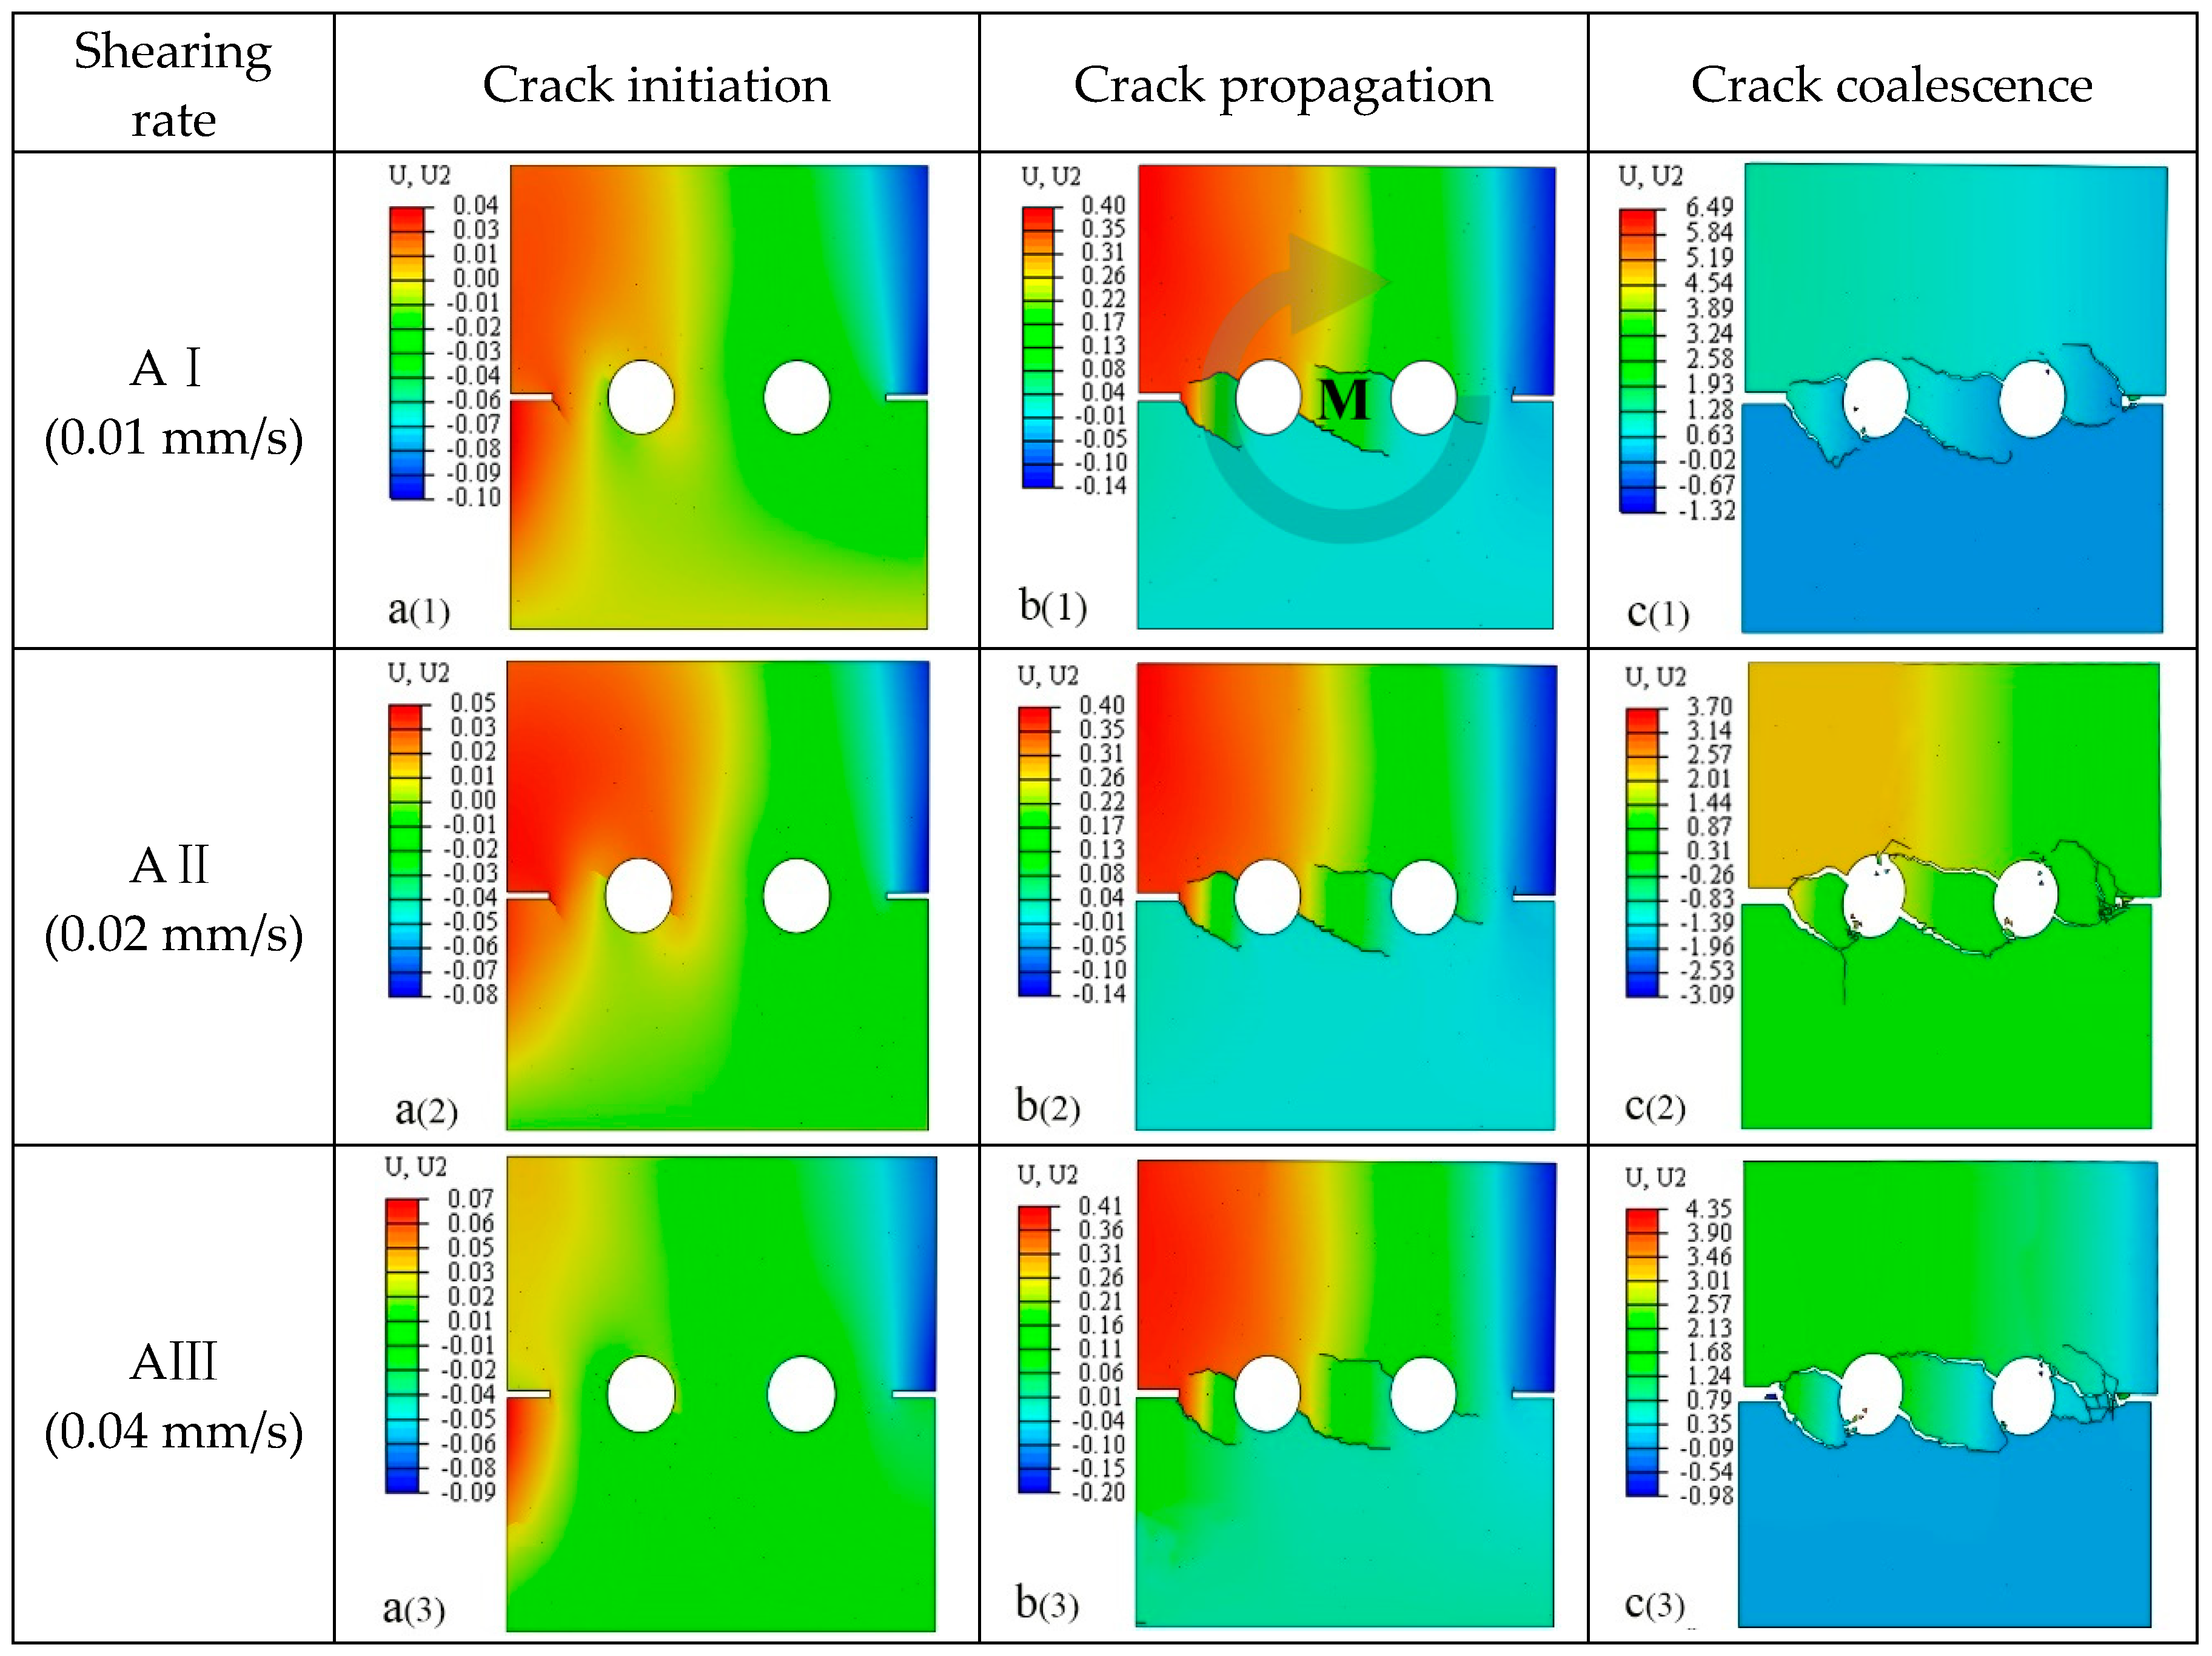
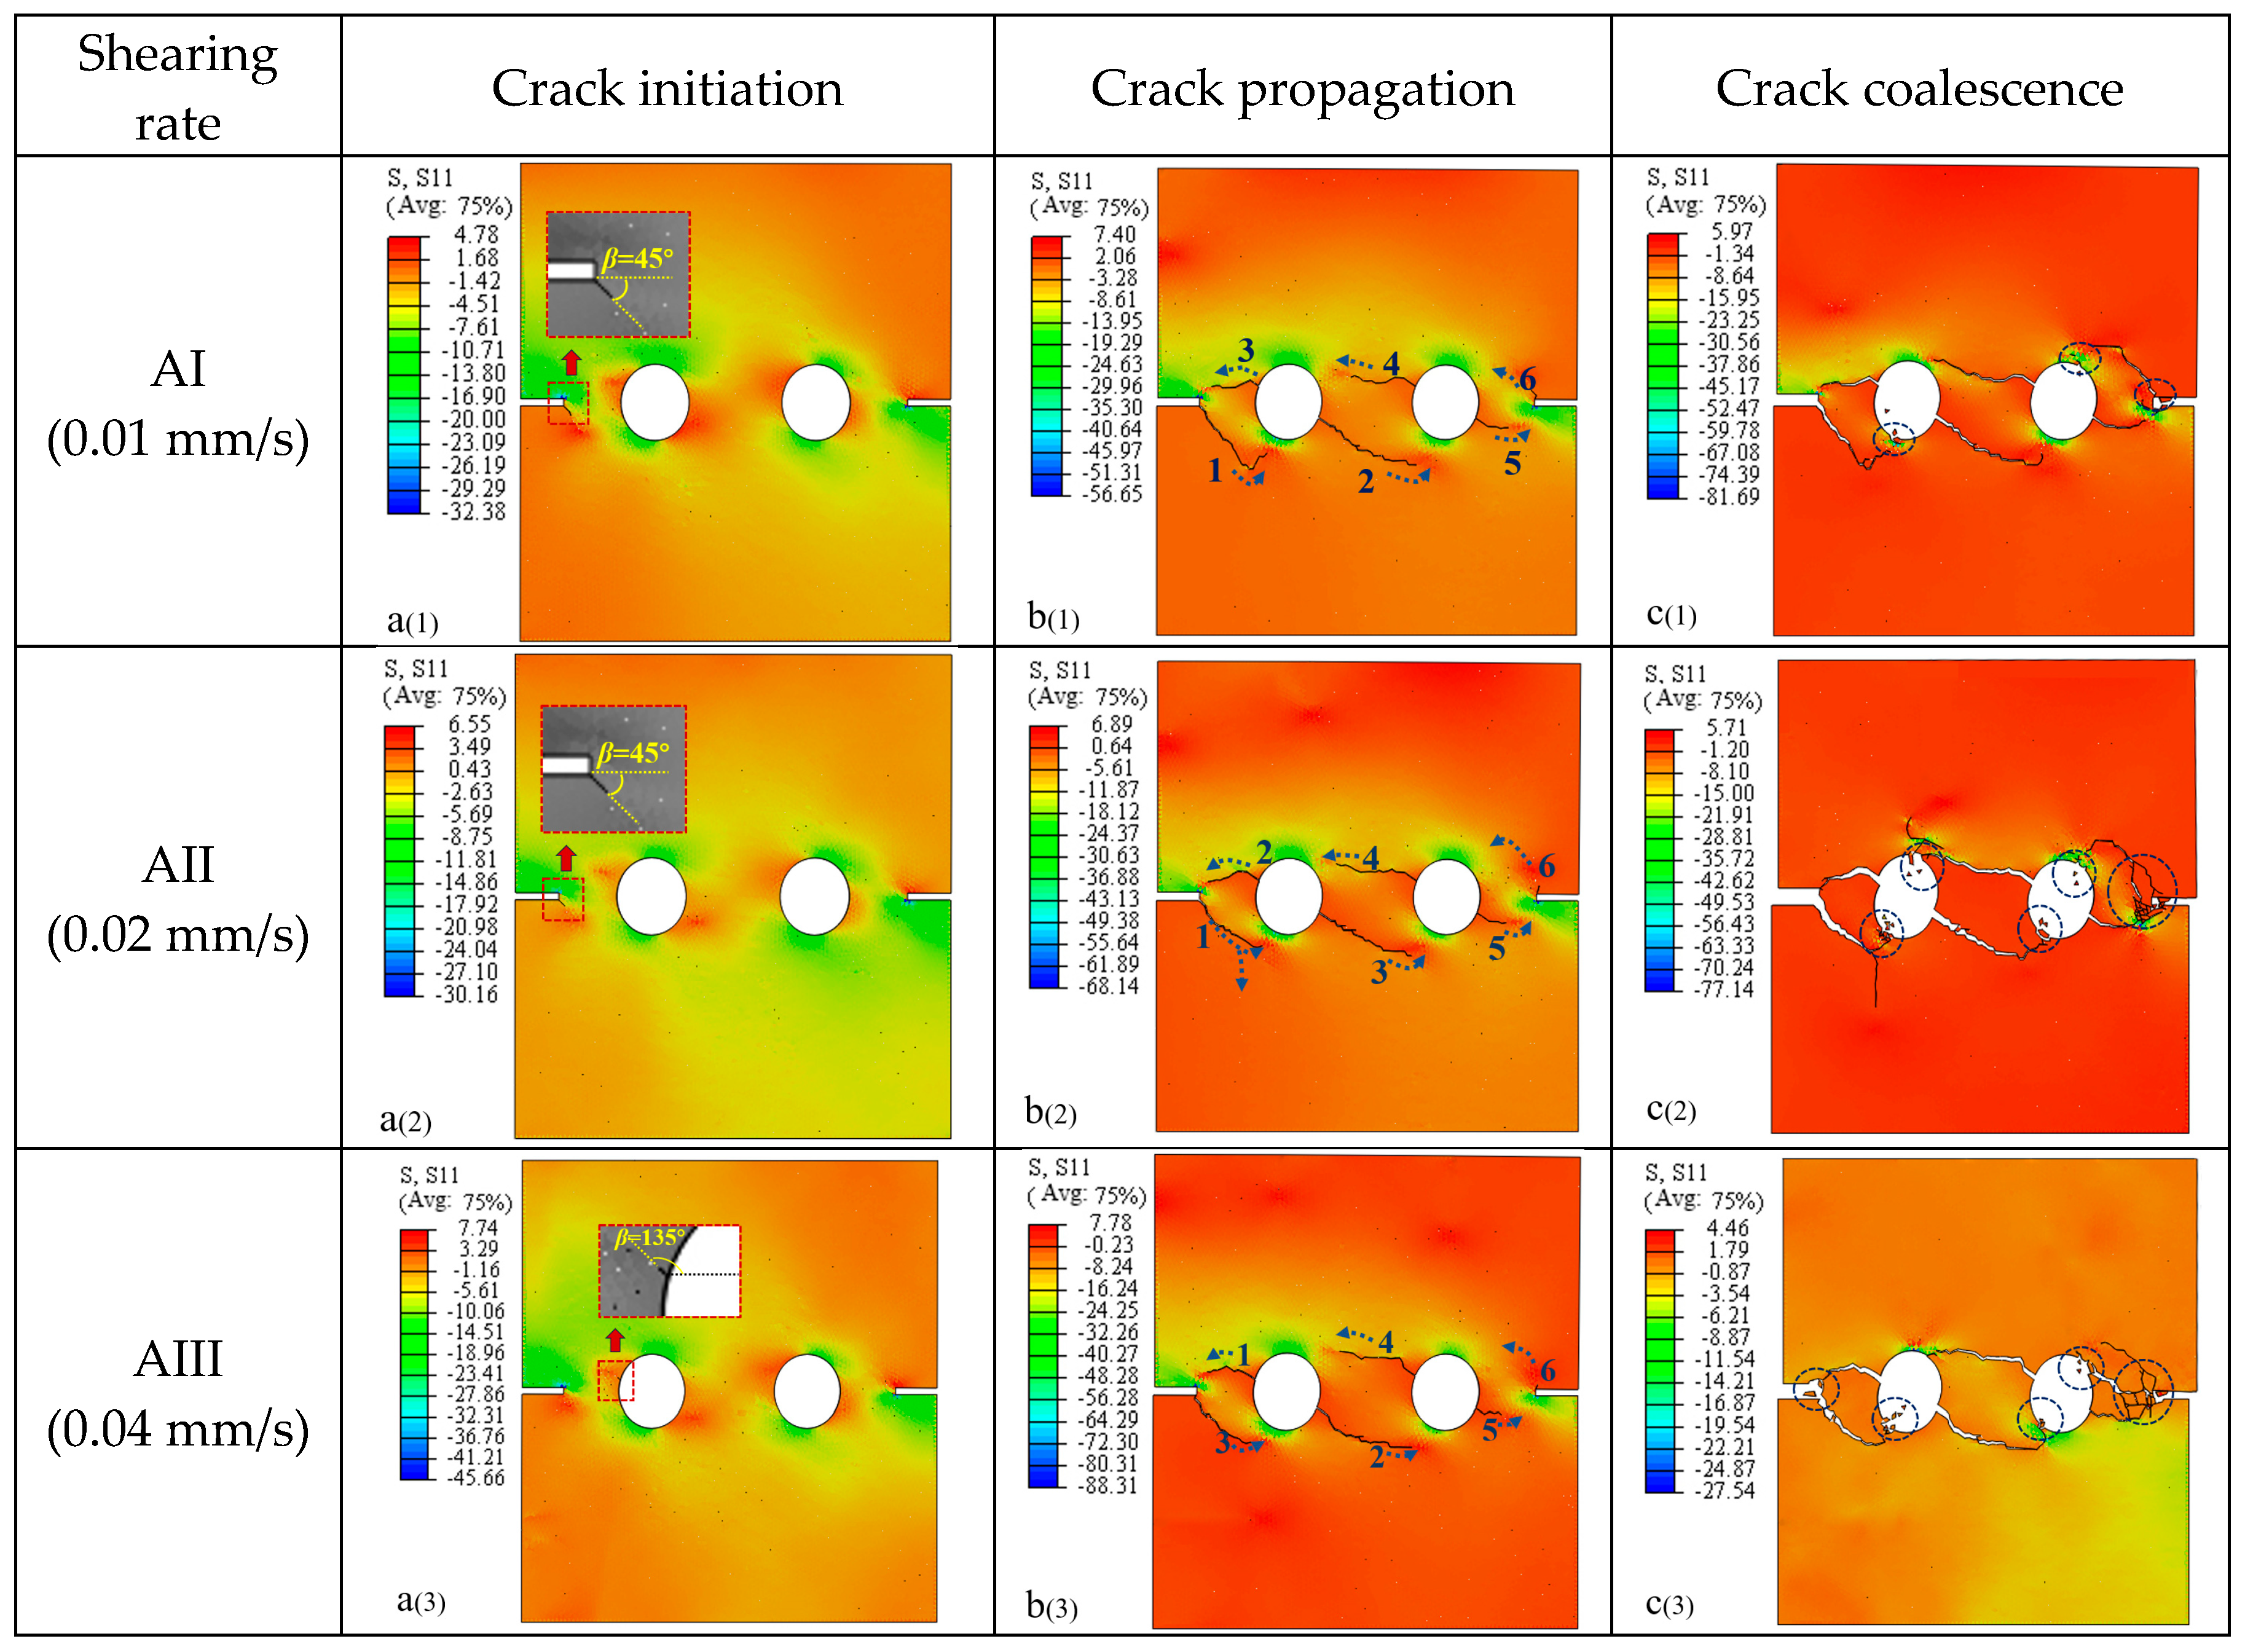
4.3.1. Effect of Loading Rate
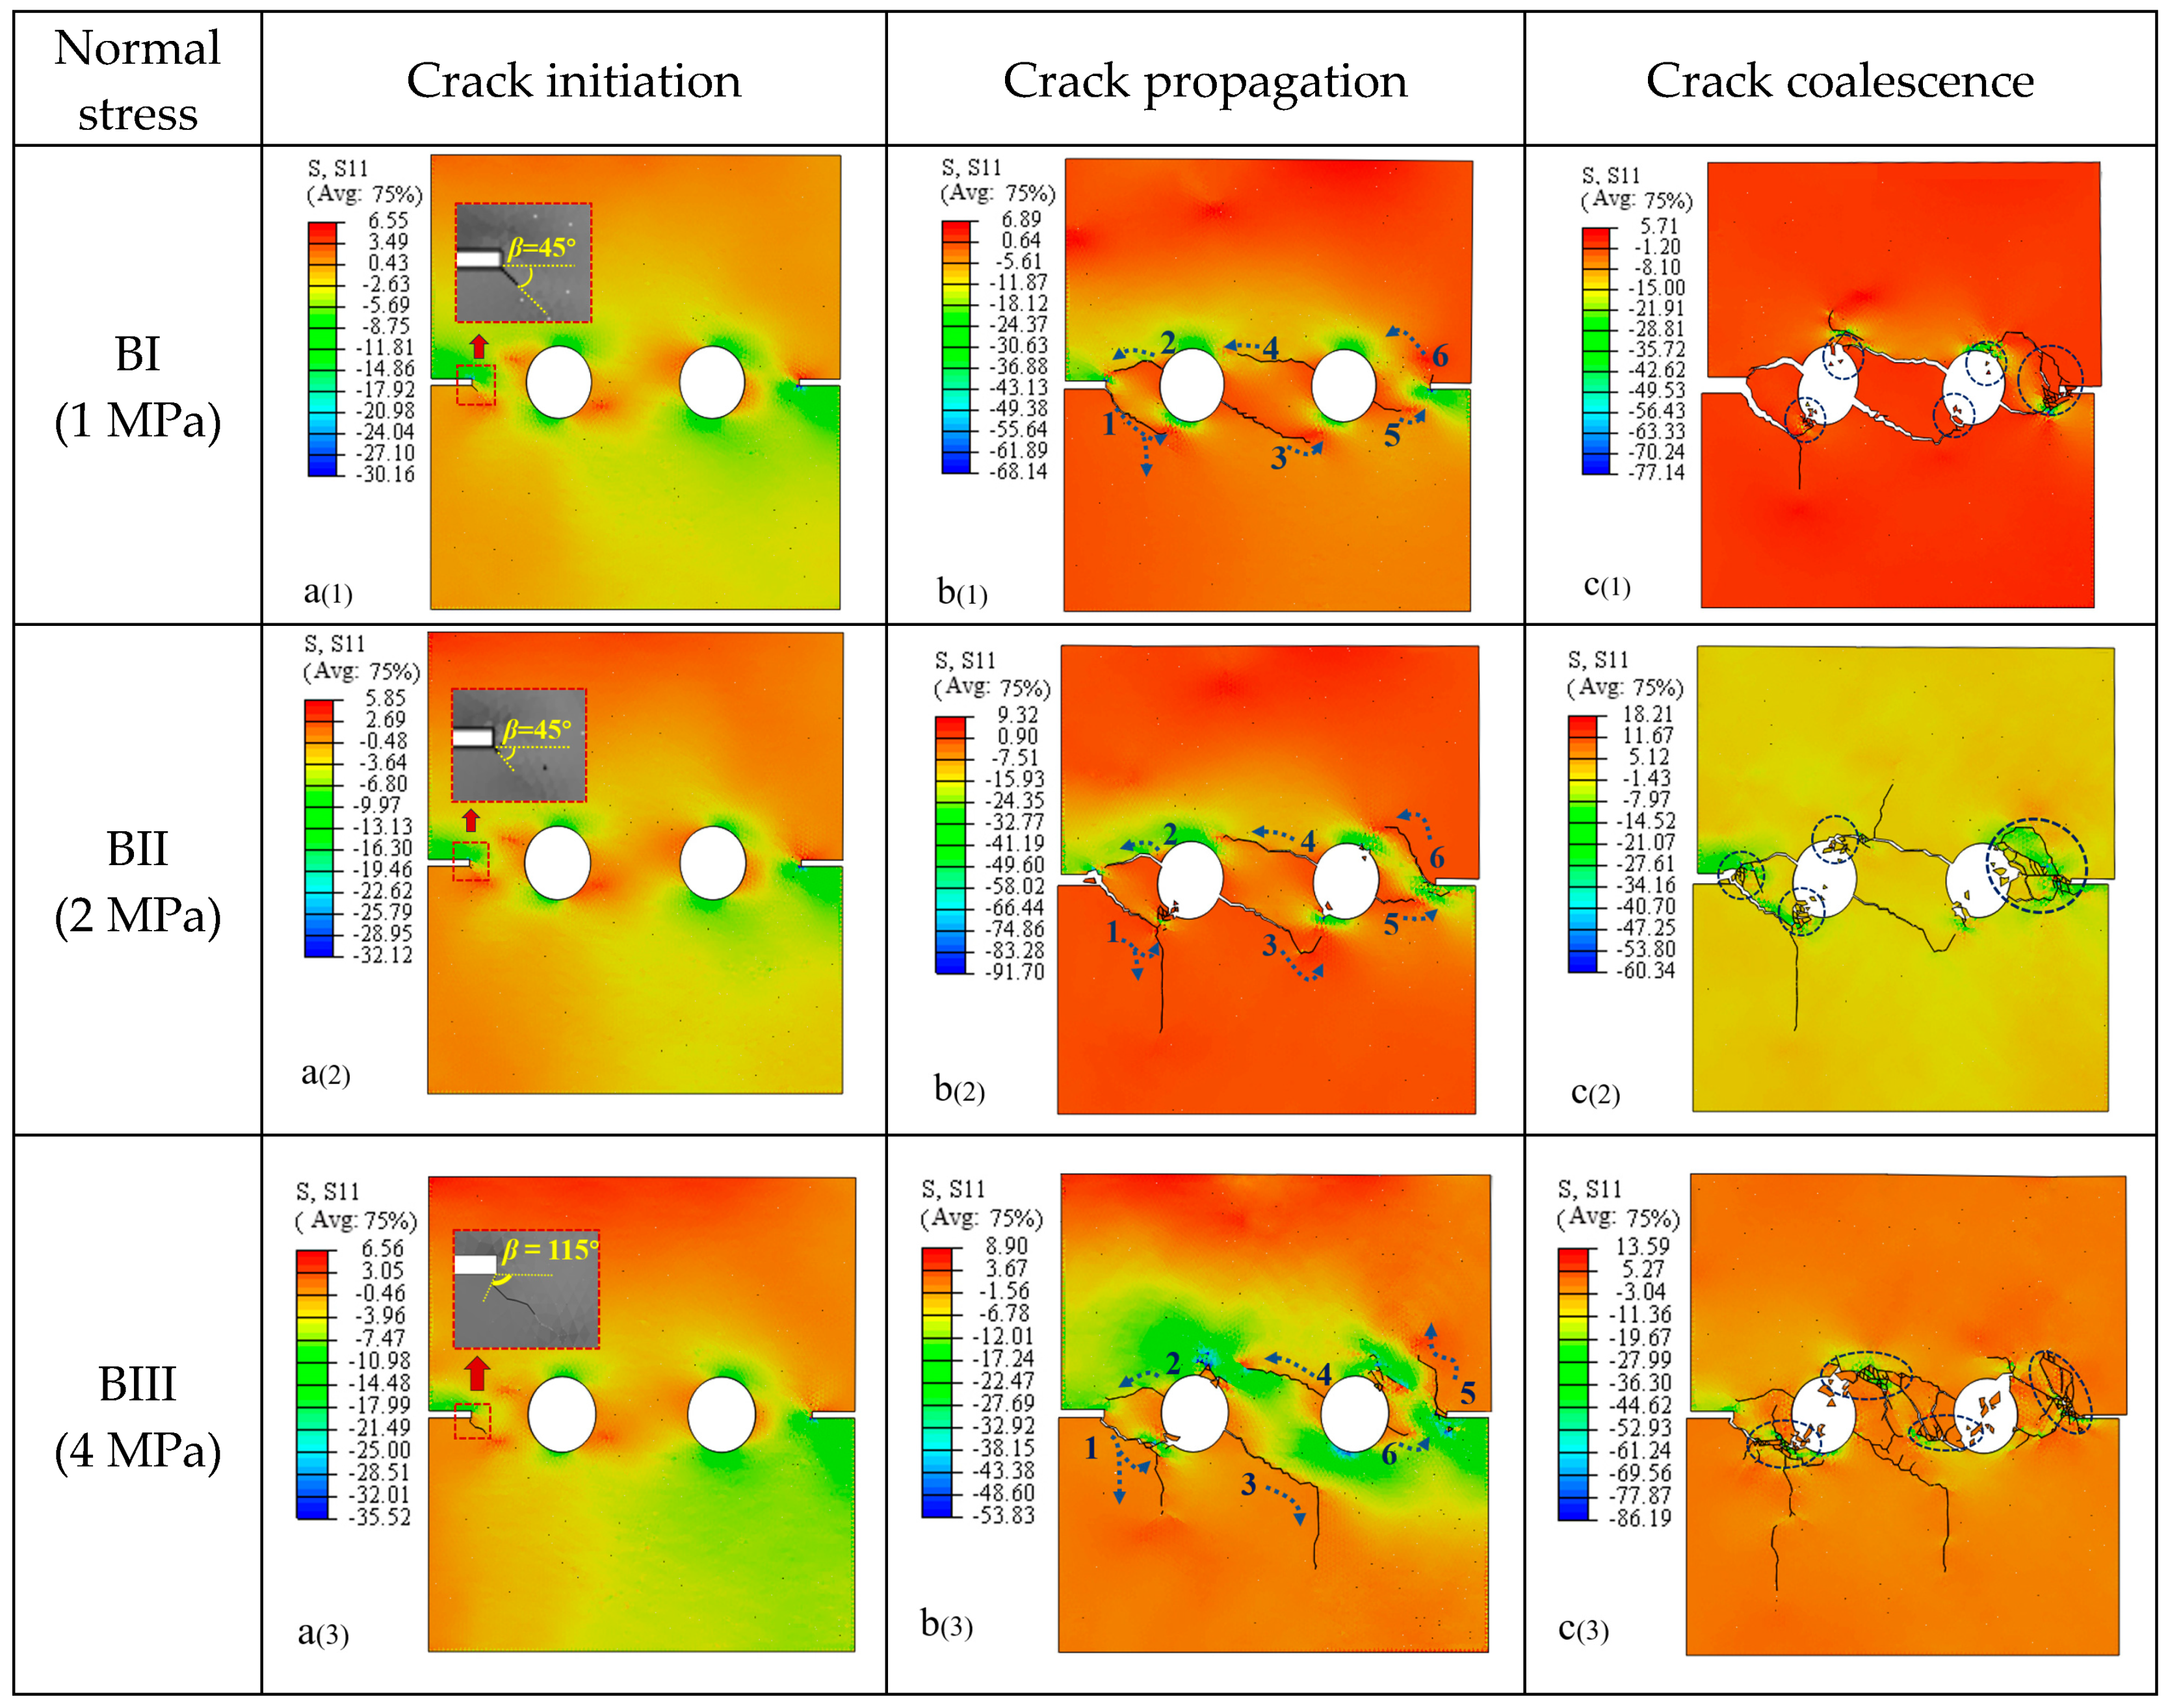
4.3.2. Effect of Normal Stress
5. Conclusions
- (1)
- The results exhibit that the shear process in this research could be determined and identified as the elastic, strengthening, plastic, and residual stress stages, respectively. The cracks’ initiation at the beginning of the crack strengthening stage gradually gathered and penetrated, mainly at the rock bridge.
- (2)
- It was observed that the crack initiation stress and the peak shear strength were significantly affected by the shearing rate and normal stress. The shear rate and normal stress were positively related to the peak shear strength. When the shear rate was 0.02 mm/s and the normal stress was 2 MPa, the crack initiation stress was the smallest, and it was easier than it was in the other conditions to bring about the crack initiation. This point should be considered in engineering practice.
- (3)
- The shear rate and normal stress significantly influenced rock masses’ cracking behavior and the mechanical properties of those with holes. Specifically, the maximum shear dilatancy was positively related to the shear rate, but negatively related to normal stress. The rock bridge played a reinforcing role in the load transfer process, as the vertical displacement near the load end was larger than that far from the load side. Hence, the displacement field of the specimen was non-centrosymmetric.
- (4)
- In this paper, a detailed analysis of the crack initiation, propagation, and coalescence behavior was carried out, and it was found that the shear rate and normal stress have significant effects on crack initiation, propagation, and coalescence. Under the load, the cohesive element at the end of the artificial crack in the edge-notched cracks were more likely to reach the damage evolution stage. The crack always started from the edge-notched, artificial crack tip, near the shear load end, and the stress concentration was more pronounced at the tip of the crack.
Author Contributions
Funding
Institutional Review Board Statement
Informed Consent Statement
Data Availability Statement
Conflicts of Interest
References
- Gui, Y.L.; Zhao, Z.Y.; Zhang, C.; Ma, S.Q. Numerical investigation of the opening effect on the mechanical behaviors in rocks under uniaxial loading using hybrid continuum-discrete element method. Comput. Geotech. 2017, 90, 55–72. [Google Scholar] [CrossRef]
- Zhou, Z.; Tan, L.; Cao, W.; Zhou, Z.; Cai, X. Fracture evolution and failure behavior of marble specimens containing rectangular cavities under uniaxial loading. Eng. Fract. Mech. 2017, 184, 183–201. [Google Scholar] [CrossRef]
- Ghazvinian, A.; Sarfarazi, V.; Schubert, W.; Blumel, M. A study of the failure mechanism of planar non-persistent open joints using PFC2D. Rock Mech. Rock Eng. 2012, 45, 677–693. [Google Scholar] [CrossRef]
- Huang, D.; Gu, D.; Yang, C.; Huang, R.; Fu, G. Investigation of mechanical behaviors of sandstone with two pre-existing flaws under triaxial compression. Rock Mech. Rock Eng. 2016, 49, 375–399. [Google Scholar] [CrossRef]
- Ali, S.; Kamran, E.; Bibhu, M. Degradation of a discrete infilled joint shear strength subjected to repeated blast-induced vibrations. Int. J. Min. Sci. Technol. 2018, 28, 561–571. [Google Scholar] [CrossRef]
- Yang, X.X.; Kulatilake, P.H.S.W. Laboratory investigation of mechanical behavior of granite samples containing discontinuous joints through direct shear tests. Arab. J. Geosci. 2019, 12, 79. [Google Scholar] [CrossRef]
- Zhang, S.; Wang, G.; Jiang, Y.; Wu, X.; Li, G.; He, P.; Yu, J.; Sun, L. Study on shear mechanism of bolted jointed rocks: Experiments and CZM-based FEM simulations. Appl. Sci. 2020, 10, 62. [Google Scholar] [CrossRef] [Green Version]
- Wu, Y.; Yang, X.X.; Sun, D.K. Experimental investigation of the mechanical behaviors of brittle rock materials containing en echelon boreholes. Arab. J. Geosci. 2020, 13, 425. [Google Scholar] [CrossRef]
- Wang, P.T.; Ren, F.H.; Cai, M.F. Influence of joint geometry and roughness on the multiscale shear behaviour of fractured rock mass using particle flow code. Arab. J. Geosci. 2020, 13, 165. [Google Scholar] [CrossRef]
- Ban, L.; Du, W.; Jin, T.; Qi, C.; Li, X. A roughness parameter considering joint material properties and peak shear strength model for rock joints. Int. J. Min. Sci. Technol. 2021, 31, 413–420. [Google Scholar] [CrossRef]
- Cao, K.; Ma, L.; Wu, Y. Statistical damage model for dry and saturated rock under uniaxial loading based on infrared radiation for possible stress prediction. Eng. Fract. Mech. 2021, 260, 108134. [Google Scholar] [CrossRef]
- Li, Y.P.; Wang, Y.H.; Chen, L.Z.; Yu, F.; Li, L.H. Experimental research on pre-existing cracks in marble under compression. Chin. J. Geotech. Eng. 2004, 26, 120–124. [Google Scholar]
- Zhu, T.T.; Jing, H.W.; Su, H.J.; Yin, Q.; Du, M.R. Study on mechanical behavior of sandstone containing double circular cavities under uniaxial compression. Chin. J. Geotech. Eng. 2015, 37, 1047–1056. [Google Scholar] [CrossRef]
- Wong, R.H.C.; Lin, P. Numerical Study of stress distribution and crack coalescence mechanisms of a solid containing multiple holes. Int. J. Rock Mech. Min. 2015, 79, 41–54. [Google Scholar] [CrossRef]
- Zhao, X.D.; Zhang, H.X.; Zhu, W.C. Fracture evolution around pre-existing cylindrical cavities in brittle rocks under uniaxial compression. Trans. Nonferrous Met. Soc. China 2014, 24, 806–815. [Google Scholar] [CrossRef]
- Yin, Q.; Jing, H.W.; Ma, G.W. Experimental study on mechanical properties of sandstone specimens containing a single hole after high-temperature exposure. Geotech. Lett. 2015, 5, 43–48. [Google Scholar] [CrossRef]
- Yang, S.Q.; Huang, Y.H.; Jing, H.W.; Liu, X.R. Discrete element modelling on fracture coalescence behavior of red sandstone containing two unparallel fissures under uniaxial compression. Eng. Geol. 2014, 178, 28–48. [Google Scholar] [CrossRef]
- Lisjak, A.; Tatone, B.S.; Grasselli, G.; Vietor, T. Numerical modelling of the anisotropic mechanical behavior of opalinus clay at clay at the laboratory scale using FEM/DEM. Rock Mech. Rock Eng. 2014, 47, 187–206. [Google Scholar] [CrossRef]
- Altiero, N.Y.; Gioda, G. An integral equation approach to fracture propagation in rock. Riv. Ital. Geotech. 1982, 16, 55–69. [Google Scholar]
- Aliabadi, M.H.; Brebbia, C.A. Advances in Boundary Element Methods for Fracture Mechanics; Elsevier: Amsterdam, The Netherlands, 1993. [Google Scholar]
- Zhou, X.P.; Yang, H.Q. Multiscale numerical modeling of evolution and coalescence of multiple cracks in rock masses. Int. J. Rock Mech. Min. Sci. 2012, 55, 15–27. [Google Scholar] [CrossRef]
- Khosravani, M.R.; Silani, M.; Weinberg, K. Fracture studies of ultra-high performance concrete using dynamic Brazilian tests. Theor. Appl. Fract. Mech. 2018, 93, 302–310. [Google Scholar] [CrossRef]
- Chang, X.; Guo, T.; Zhang, S. Cracking behaviors of layered specimen with an interface crack in Brazilian tests. Eng. Fract. Mech. 2020, 228, 106904. [Google Scholar] [CrossRef]
- Valoroso, N.; Debruyne, G.; Laverne, J. A cohesive zone model with rate-sensitivity for fast crack propagation. Mech. Res. Commun. 2014, 58, 8–13. [Google Scholar] [CrossRef]
- Jiang, H.; Meng, D. 3D numerical modelling of rock fracture with a hybrid finite and cohesive element method. Eng. Fract. Mech. 2018, 199, 280–293. [Google Scholar] [CrossRef]
- Wu, X.L.; Wang, G.; Li, G.; Han, W.; Sun, S.Q.; Zhang, S.B.; Bi, W. Research on Shear Behavior and Crack Evolution of Symmetrical Discontinuous Rock Joints Based on FEM-CZM. Symmetry 2020, 12, 1314. [Google Scholar] [CrossRef]


| Materials | Parameters | Value |
|---|---|---|
| Solid element | Density/kg·m−3 | 2500 |
| Young’s modulus/GPa | 15 | |
| Poisson’s ratio | 0.3 | |
| Cohesive element | Initial tensile stiffness/GPa·m−1 | 15 |
| Initial shear stiffness/GPa·m−1 | 5.28 | |
| Normal traction force/MPa | 6 | |
| Tangential traction force/MPa | 22 | |
| Model-I fracture energy/N·mm−1 | 0.06 | |
| Model-II fracture energy/N·mm−1 | 0.165 | |
| Plate | Density/kg·m−3 | 7800 |
| Young’s modulus/GPa | 210 | |
| Poisson’s ratio | 0.3 |
| Numerical Number | Shear Rate (mm/s) | Normal Stress (MPa) |
|---|---|---|
| AI | 0.01 | 1 |
| AII | 0.02 | 1 |
| AIII | 0.04 | 1 |
| BI | 0.02 | 1 |
| BII | 0.02 | 2 |
| BIII | 0.02 | 4 |
Publisher’s Note: MDPI stays neutral with regard to jurisdictional claims in published maps and institutional affiliations. |
© 2022 by the authors. Licensee MDPI, Basel, Switzerland. This article is an open access article distributed under the terms and conditions of the Creative Commons Attribution (CC BY) license (https://creativecommons.org/licenses/by/4.0/).
Share and Cite
Zhu, Y.; Chen, H.; Li, A.; Wu, Y.; Zhang, X. Effect of Loading Conditions on the Shear Behaviors of Rock-like Materials Containing Circular Holes, with the CZM Method. Appl. Sci. 2022, 12, 4708. https://doi.org/10.3390/app12094708
Zhu Y, Chen H, Li A, Wu Y, Zhang X. Effect of Loading Conditions on the Shear Behaviors of Rock-like Materials Containing Circular Holes, with the CZM Method. Applied Sciences. 2022; 12(9):4708. https://doi.org/10.3390/app12094708
Chicago/Turabian StyleZhu, Yinge, Huiyuan Chen, Anqi Li, Yue Wu, and Xiaoli Zhang. 2022. "Effect of Loading Conditions on the Shear Behaviors of Rock-like Materials Containing Circular Holes, with the CZM Method" Applied Sciences 12, no. 9: 4708. https://doi.org/10.3390/app12094708
APA StyleZhu, Y., Chen, H., Li, A., Wu, Y., & Zhang, X. (2022). Effect of Loading Conditions on the Shear Behaviors of Rock-like Materials Containing Circular Holes, with the CZM Method. Applied Sciences, 12(9), 4708. https://doi.org/10.3390/app12094708