Article

New Method to Determine Dynamic Meshing Force for Spur Gears Considering the Meshing State of Multiple Pairs of Teeth

1
School of Mechanical Engineering, Anhui Polytechnic University, Wuhu 241000, China
2
Wuhu Ahpu Robot Technology Research Institute Co., Ltd., Wuhu 241000, China
3
Automotive New Technology Anhui Engineering and Technology Research Center, Anhui Polytechnic University, Wuhu 241000, China
4
Zhejiang Shuanghuan Driveline Co., Ltd., Yuhuan 317600, China
5
School of Mechanical Engineering, Zhejiang University, Hangzhou 310058, China
*
Author to whom correspondence should be addressed.
Appl. Sci. 2022, 12(9), 4690; https://doi.org/10.3390/app12094690
Submission received: 30 March 2022 / Revised: 1 May 2022 / Accepted: 3 May 2022 / Published: 6 May 2022

Abstract

:
The determination of meshing force and the load sharing ratio of gear teeth is critical to predict the dynamic behavior or the load capacity of gear transmissions. In the previous literature, the dynamic meshing force is usually calculated based on the traditional dynamic model, which ignores the different effects of the meshing characteristics of each pair of teeth on the dynamic behavior of the gear system. In this work, a new calculation method of dynamic meshing force is proposed based on the new dynamic model considering the meshing state of multiple pairs of teeth. The difference between the traditional calculation method and the new calculation method of dynamic meshing force is analyzed. Based on the new dynamic model and new calculation method of dynamic meshing force, the influence of different factors on dynamic response and dynamic meshing force are further discussed. The results show that, compared with the traditional calculation method, this new method can be used to effectively calculate the dynamic meshing force and the load sharing ratio of each pair of teeth with different meshing characteristics. The presented method for the calculation of the dynamic meshing force and the load sharing ratio provides an important reference for analyzing and predicting the dynamic behavior or the load capacity of spur gears, especially the high contact ratio (HCR) gears with contact ratio more than two.

1. Introduction

Gear transmissions have extensive applications in various mechanical systems. Due to the technical advantages and importance of gear transmissions, a lot of researchers have carried out in-depth exploration in the various fields of gears and obtained very rich results. For example, Litvin [1,2,3,4,5,6], Simon [7], Lin [8] and Vivet [9] et al., simulated and analyzed the meshing characteristics of different types of gear pairs based on the tooth contact analysis (TCA) method by constructing the tooth surface models. Kubo [10,11], Kahraman [12,13,14,15], Mucchi [16], Fernández [17] and Chen [18] et al., conducted a series of theoretical and experimental studies on the gear system dynamics. Suh [19], Bouzakis [20], Pasternak [21] and Gołebski [22,23,24] et al. have done a lot of valuable work in gear machining, which provides important methods to improve the performance of gear machining and production of new types of gears. With the increase of transmission torque and speed, higher requirements are put forward for the performance of gear transmission systems, which largely depend on the design level of gears. As we all know, the calculation of load capacity is a very important work in gear design [25,26], which is closely related to the meshing state of gear teeth. In the process of gear transmission, the gear teeth of the driven wheel bear the meshing force from the teeth of the driving wheel and vice versa. With the meshing position varying, the meshing force between a pair of teeth will change, resulting in the change of load sharing ratio among mating gear teeth in simultaneous contact. The determination of meshing force and the load sharing ratio of gear teeth is critical to predict the dynamic behavior or the load capacity of gear transmissions. In some literatures, several calculation models for meshing force and load sharing ratio can be found. Pimsarn and Kazerounian [27] presented a new method, pseudo-interference stiffness estimation (PISE), for evaluating the equivalent mesh stiffness and the mesh load in gear system. Fernández del Rincon et al. [28] developed an advanced model for the analysis of contact forces and deformations in spur gear transmissions. Li [29] analyzed the effects of misalignment error of gear shafts on the plane of action, tooth lead crowing and transmitted torque on tooth meshing stiffness and the load sharing ratio. Ye and Tsai [30] studied the shared loads and contact stress of a high contact ratio (HCR) spur gear pair with lead crowning and relieved profiles. Marimuthu and Muthuveerappan [25,31] investigated the load carrying capacity of asymmetric normal contact ratio (NCR) and HCR spur gears based on load sharing. Sánchez et al. [32] developed a model of load distribution for external gears based on the minimum elastic potential energy criterion and further studied the approximate equations for the meshing stiffness and the load sharing ratio of spur gears including hertzian effects. These literatures provide important methods for the calculation of meshing force and load sharing ratio.
In addition to stiffness, the speed and damping will also have an impact on meshing force and load sharing ratio, due to the dynamic meshing process of a pair of gears. To construct the dynamic model of a gear system, some scholars have discussed the dynamic meshing force of mating gears. Chen et al. [33], based on the formula of dynamic meshing force, deduced the calculation formula of the friction force and then developed a multi-degree of freedom nonlinear dynamic gear transmission system with friction, time varying stiffness and dynamic backlash caused by central distance error. Similarly, Xiang et al. [34] derived the calculation formula of the friction force by analyzing the expression of the dynamic meshing forces and constructed a six degree of freedom nonlinear dynamic model of a spur gear pair with time varying stiffness, gear backlash and surface friction based on the period expansion method. Considering the sliding friction force under single-tooth and double-tooth meshing regions, Xia et al. [35] further proposed a nonlinear dynamic model for a spur gear pair. Li et al. [36] established a coupled tribo-dynamic model based on the effect of both the combined mesh stiffness under the dynamic meshing forces and the nonlinear backlash. Doan et al. [37] formulated the equations of motions of a dynamic model, in which the dynamic force between two teeth was defined, taking into account profile errors, and investigated the effects of basic gear parameters on gear instantaneous mesh stiffness and dynamic forces. Liu et al. [38] presented a nonlinear dynamics model of spur gear pair with pitch deviations under multi-state meshing and analyzed the variation laws of dynamic meshing forces and the influence of main parameters on nonlinear dynamics of the spur gear pair with pitch deviations.
These literatures also provide important methods and valuable conclusions for calculating dynamic meshing force and constructing dynamic models of gear systems. However, in many previous literatures, to simplify the computational model, the dynamic model of a single pair of teeth was used to characterize the dynamic behavior of all meshing teeth in the whole meshing cycle. In these models, the comprehensive transmission error, comprehensive meshing stiffness and comprehensive damping are employed. In fact, in the process of gear transmission, the dynamic behavior of each pair of teeth may be different due to the influence of different factors such as tooth surface modification, manufacturing error, backlash and so on. In some of the above literatures, to deal with the dynamic meshing forces and friction forces, the meshing states of two pairs of teeth in the double-tooth meshing region were considered. However, the difference of meshing states of each pair of teeth was not fully considered, especially the difference of actual meshing positions of two pairs of teeth caused by transmission error. On this issue, some scholars have carried out relevant research work. Amabili et al. [39] extended a pair of teeth in the spur gear dynamic model to two pairs of teeth and established a nonlinear dynamic model including meshing stiffness and transmission error of the two pairs of teeth. Shi et al. [40] studied the gear dynamic model based on gear pair integrated error. The model includes the excitation function of three pairs of teeth involved in the meshing process, which can effectively reflect the actual meshing state of each pair of teeth. Previously, the authors [41] have studied the dynamic model of a gear system considering the meshing state of multiple pairs of teeth.
This paper will further propose a calculation model for calculating the dynamic meshing force and load sharing ratio for spur gears based on the proposed dynamic model. In this paper, the differences between the dynamic meshing force and load sharing ratio based on the traditional dynamic model and the new dynamic model proposed by authors are considered and the effects of different factors, including different deviations, speeds, loads and damping ratio, on the dynamic meshing force and load sharing ratio are also discussed. The new calculation model for the dynamic meshing force proposed in this paper can lay a foundation for the calculation of dynamic meshing force, load sharing ratio and load capacity of the gears (especially the HCR gears with contact ratio more than two) when considering the characteristics of the tooth surface.

2. Dynamic Model Analysis

2.1. Dynamic Model of Spur Gear Pair Considering the Meshing State of Multiple Pairs of Teeth

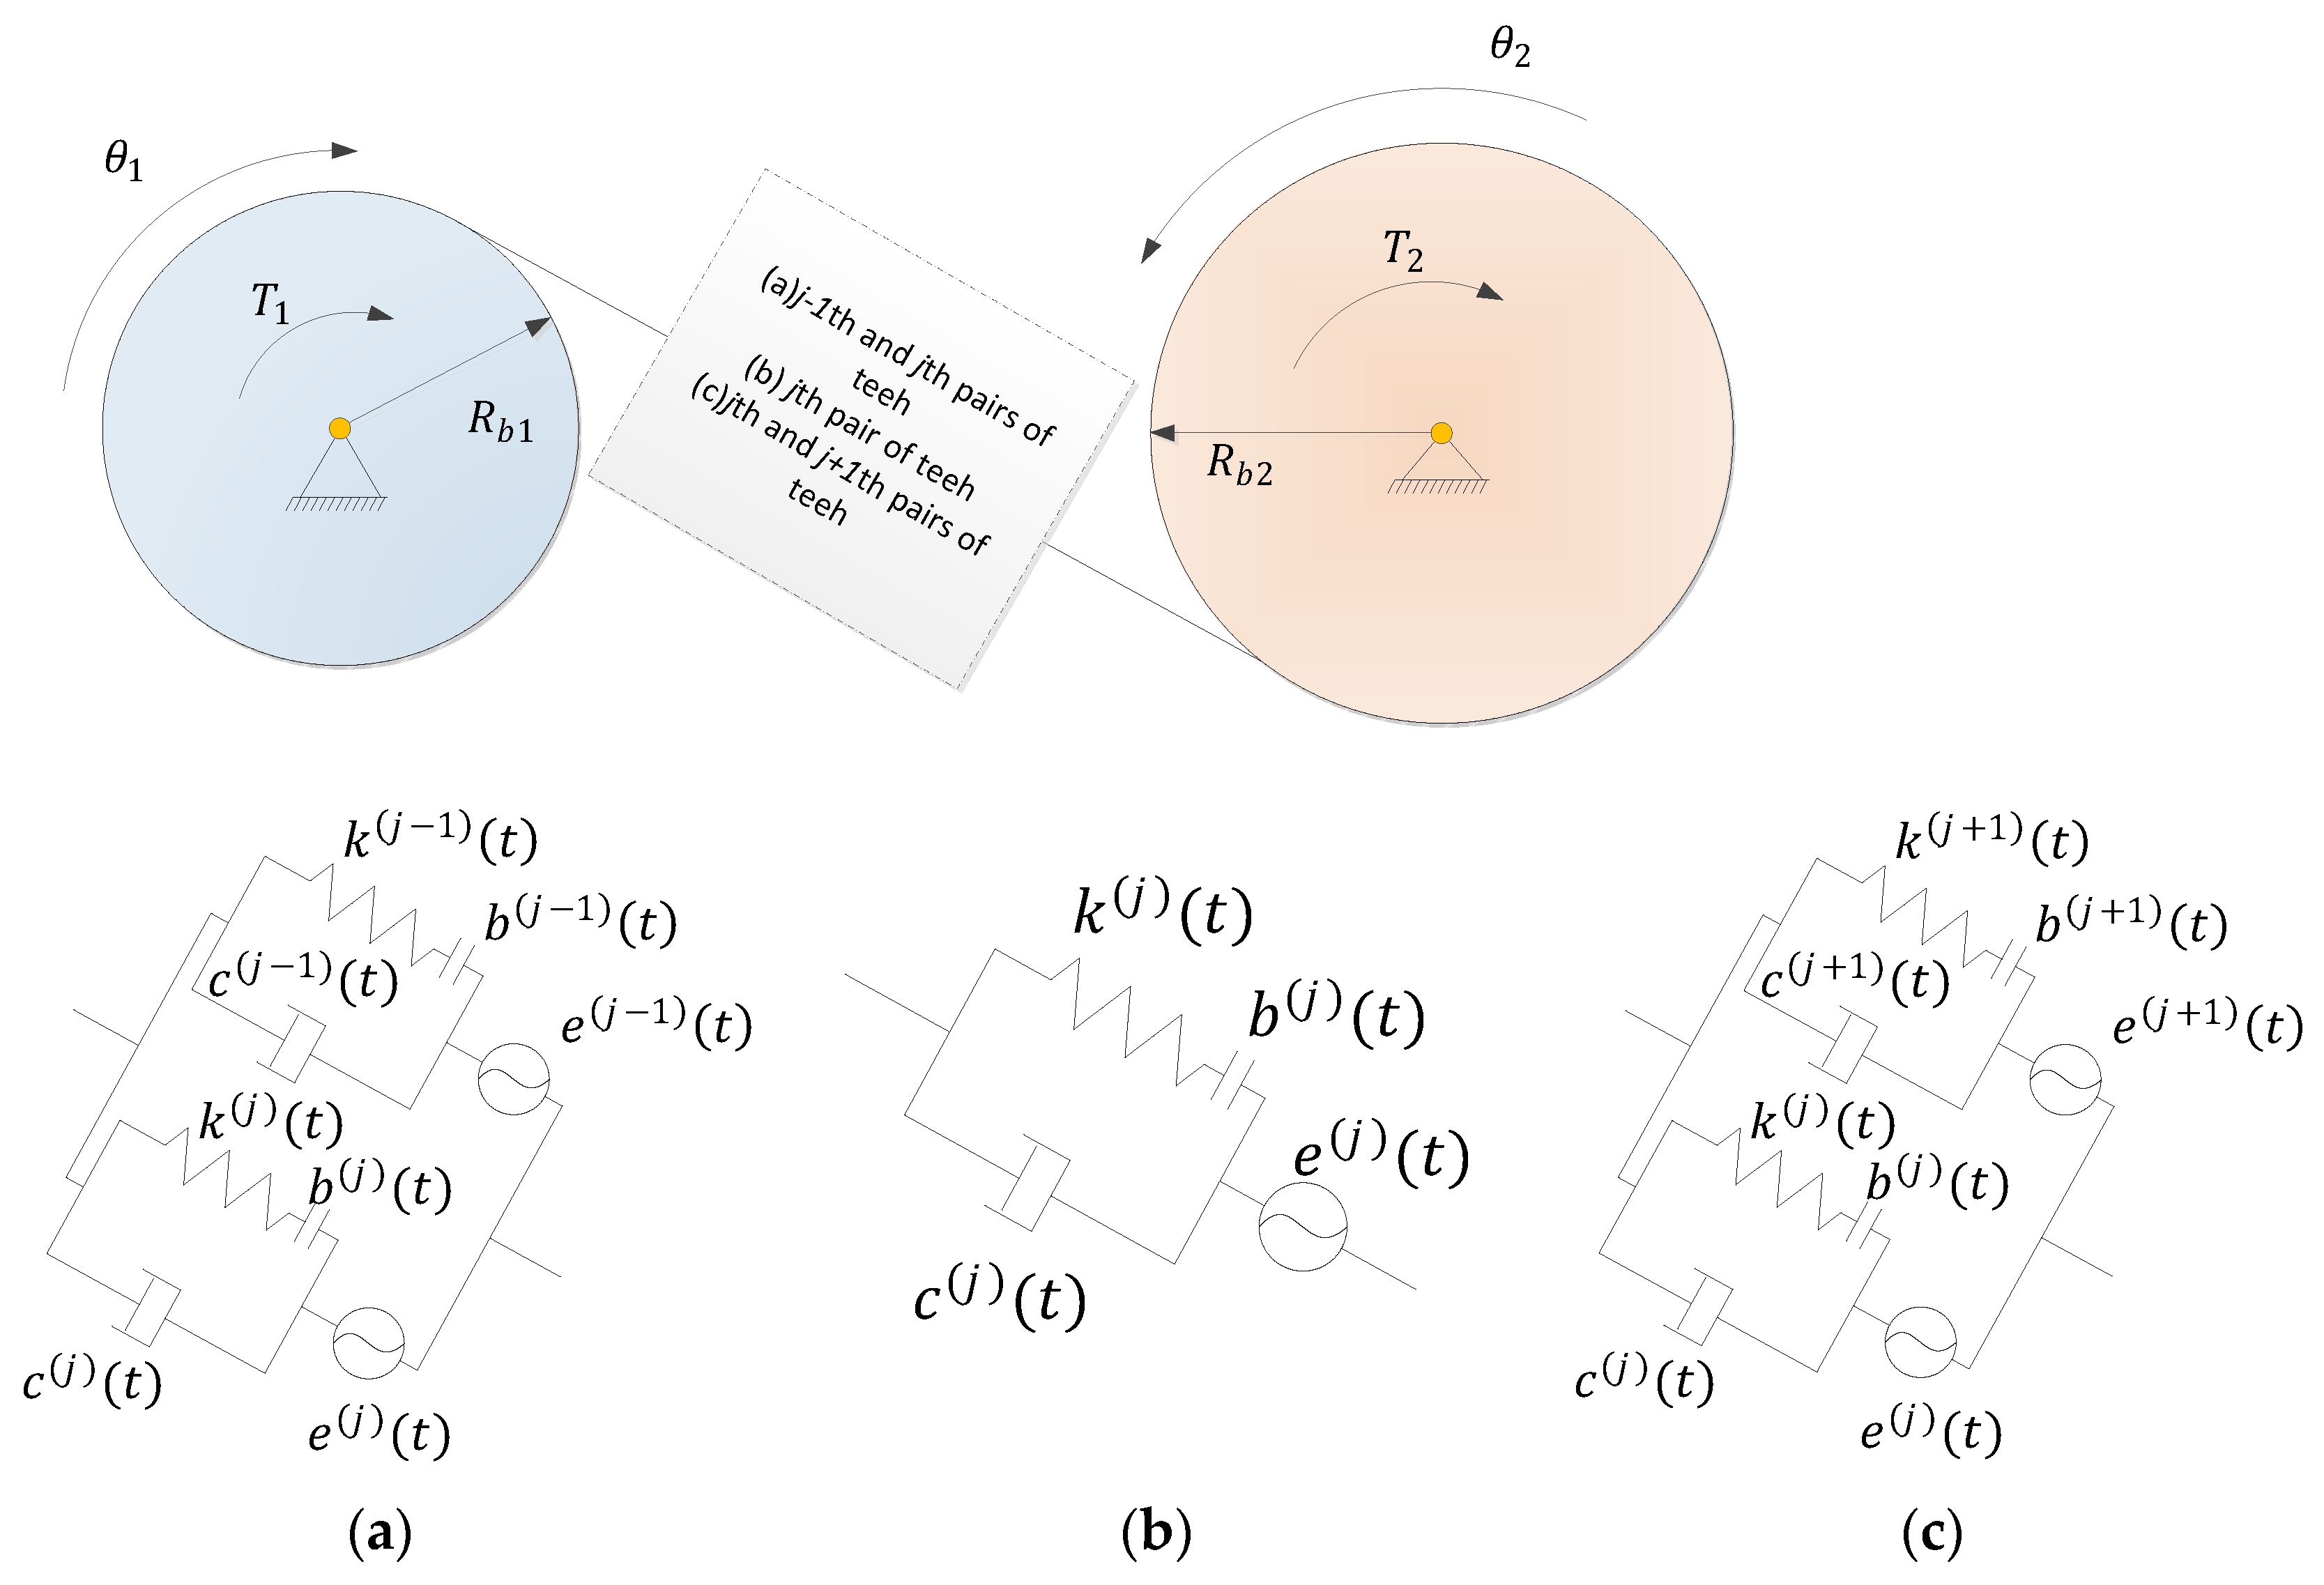
In this work, the dynamic transmission system consists of a pair of gears installed on properly aligned shafts. In many previous literatures, the dynamic model of a single pair of teeth was usually used to describe the dynamic behavior of teeth in the whole meshing cycle, as shown in Figure 1. Here,   θ 1 and θ 2 are the rotation angles of the driving and driven wheels, respectively; R b 1 and R b 2 are the radius of the base circle of driving and driven wheels, respectively;   T 1 and T 2 are torques of driving and driven wheels, respectively;   k ( t ) is comprehensive meshing stiffness   ( N / m ) ;   c m ( t ) is comprehensive damping ( N · s / m );   e ( t ) is comprehensive transmission error (comprehensive meshing error)   ( m ) ; b ( t ) is comprehensive backlash   ( m ) .
In the process of gear transmission, the meshing state of each pair of teeth may be different due to the influence of tooth surface modification, manufacturing error, backlash and so on. When two or more pairs of teeth participate in meshing at the same time, the established dynamic model with all teeth being treated as a pair of teeth will not fully reflect the meshing state of each pair of teeth in the meshing process. Therefore, by analyzing the dynamic behavior of each pair of teeth involved in meshing, the authors developed a single degree of freedom nonlinear dynamic model considering the meshing state of multiple pairs of teeth [41], as shown in Figure 2. Here, we set the   j 1 th , j th   and   j + 1 th pairs of teeth participating in meshing and the meshing stiffness, meshing damping, meshing error and backlash of each pair of teeth are functions of time. For example, the meshing stiffness, meshing damping, meshing error and backlash of the j th pair of teeth are k ( j ) ( t ) ,   c ( j ) ( t ) , e ( j ) ( t ) and b ( j ) ( t ) , respectively.
Assuming that three pairs of gear teeth participate in meshing at the same time, the corresponding dynamic equations can be obtained as follows:
I 1 θ ¨ 1 + c ( j 1 ) ( t ) R b 1 ( θ 1 ˙ R b 1 θ 2 ˙ R b 2 e ˙ ( j 1 ) ( t ) ) + c ( j ) ( t ) R b 1 ( θ 1 ˙ R b 1 θ 2 ˙ R b 2 e ˙ ( j ) ( t ) ) + c ( j + 1 ) ( t ) R b 1 ( θ 1 ˙ R b 1 θ 2 ˙ R b 2 e ˙ ( j + 1 ) ( t ) ) + k ( j 1 ) ( t ) R b 1 f ( j 1 ) ( θ 1 R b 1 θ 2 R b 2 e ( j 1 ) ( t ) ) + k ( j ) ( t ) R b 1 f ( j ) ( θ 1 R b 1 θ 2 R b 2 e ( j ) ( t ) ) + k ( j + 1 ) ( t ) R b 1 f ( j + 1 ) ( θ 1 R b 1 θ 2 R b 2 e ( j + 1 ) ( t ) ) = T 1 I 2 θ ¨ 2 c ( j 1 ) ( t ) R b 2 ( θ 1 ˙ R b 1 θ 2 ˙ R b 2 e ˙ ( j 1 ) ( t ) ) c ( j ) ( t ) R b 2 ( θ 1 ˙ R b 1 θ 2 ˙ R b 2 e ˙ ( j ) ( t ) ) c ( j + 1 ) ( t ) R b 2 ( θ 1 ˙ R b 1 θ 2 ˙ R b 2 e ˙ ( j + 1 ) ( t ) ) k ( j 1 ) ( t ) R b 2 f ( j 1 ) ( θ 1 R b 1 θ 2 R b 2 e ( j 1 ) ( t ) ) k ( j ) ( t ) R b 2 f ( j ) ( θ 1 R b 1 θ 2 R b 2 e ( j ) ( t ) ) k ( j + 1 ) ( t ) R b 2 f ( j + 1 ) ( θ 1 R b 1 θ 2 R b 2 e ( j + 1 ) ( t ) ) = T 2
Let dynamic transmission error x ( t ) = θ 1 R b 1 θ 2 R b 2 , we can obtain:
m e x ¨ + ( c ( j 1 ) ( t ) + c ( j ) ( t ) + c ( j + 1 ) ( t ) ) x ˙ + k ( j 1 ) ( t ) f ( j 1 ) ( x e ( j 1 ) ( t ) ) + k ( j ) ( t ) f ( j ) ( x e ( j ) ( t ) ) + k ( j + 1 ) ( t ) f ( j + 1 ) ( x e ( j + 1 ) ( t ) ) c ( j 1 ) ( t ) e ˙ ( j 1 ) ( t ) c ( j ) ( t ) e ˙ ( j ) ( t ) c ( j + 1 ) ( t ) e ˙ ( j + 1 ) ( t ) = F m
where I 1 and I 2 are rotary inertia of driving and driven wheels, respectively ( kg · m 2 ) ;   m e is the equivalent mass   ( kg ) ,   m e = I 1 I 2 / ( I 1 R b 2 2 + I 2 R b 1 2 ) ;   F m is the equivalent applied load ( N ) ,   F m = T 1 / R b 1 = T 2 / R b 2 .
Considering the actual meshing state of a pair of gears, the above dynamic equations can be sorted as follows:
m e x ¨ + c m ( t ) x ˙ + W m ( t ) = F m
Here, c m ( t ) is comprehensive meshing damping, which can be described as:
c m ( t ) = { c ( j 1 ) ( t ) + c ( j ) ( t ) n t z t < n t z + ( t h t z ) c ( j ) ( t ) n t z + ( t h t z ) t < n t z + t z         c ( j ) ( t ) + c ( j + 1 ) ( t ) n t z + t z t < n t z + t h   n = 0 , 1 , 2 ,
where   t z is the meshing period ( s ) , which is related to the number of teeth z 1 and speed n 1 of driving wheel, namely t z = 60 / z 1 n 1 ; t h is the meshing time of a pair of teeth from engagement to disengagement ( s ) .
W m ( t ) is the comprehensive internal incentive and we can write its expression as follows:
W m ( t ) = { k ( j 1 ) ( t ) f ( j 1 ) ( x e ( j 1 ) ( t ) ) + k ( j ) ( t ) f ( j ) ( x e ( j ) ( t ) ) c ( j 1 ) ( t ) e ˙ ( j 1 ) ( t ) c ( j ) ( t ) e ˙ ( j ) ( t ) n t z t < n t z + ( t h t z ) k ( j ) ( t ) f ( j ) ( x e ( j ) ( t ) ) c ( j ) ( t ) e ˙ ( j ) ( t ) n t z + ( t h t z ) t < n t z + t z k ( j ) ( t ) f ( j ) ( x e ( j ) ( t ) ) + n t z + t z t < n t z + t h k ( j + 1 ) ( t ) f ( j + 1 ) ( x e ( j + 1 ) ( t ) ) c ( j ) ( t ) e ˙ ( j ) ( t ) c ( j + 1 ) ( t ) e ˙ ( j + 1 ) ( t ) n = 0 , 1 , 2 ,
Here, f ( j 1 ) ( x e ( j 1 ) ( t ) ) , f ( j ) ( x e ( j ) ( t ) ) , f ( j + 1 ) ( x e ( j + 1 ) ( t ) ) is the backlash function of   j 1 th , j th   and   j + 1 th pair of teeth, respectively. For example, the expression of the backlash function of the j th pair of teeth is:
f ( j ) ( x e ( j ) ( t ) ) = { x e ( j ) ( t ) b ( j ) ( t ) x > e ( j ) ( t ) + b ( j ) ( t ) 0 e ( j ) ( t ) b ( j ) ( t ) x e ( j ) ( t ) + b ( j ) ( t ) x e ( j ) ( t ) + b ( j ) ( t ) x < e ( j ) ( t ) b ( j ) ( t )

2.2. Comparative Analysis of Simulation Results and Experimental Results

Let nominal frequency ω n = k m / m e ( k m is the average meshing stiffness), dimensionless displacement   q = x / l ( l is the nominal dimension), dimensionless time   τ = ω n t , dimensionless frequency Ω h = ω / ω n ( ω is meshing frequency), damping ratio   ζ = c m ( τ ) / 2 m e ω n . The Equation (3) can be nondimensionalized as follows:
q ¨ ( τ ) + 2 ζ q ˙ ( τ ) + W m ¯ ( τ ) k m = F m k m l
where W m ¯ ( τ ) is dimensionless comprehensive internal incentive.
For the convenience of analysis, it is assumed that the meshing damping of each pair of teeth is the same and constant. Hence, Equation (7) can be written as:
q ¨ ( τ ) + 2 ζ ¯ ρ ¯ ( τ ) q ˙ ( τ ) + W m ¯ ( τ ) k m = F m k m l
where
ρ ¯ ( τ ) = { 2 w n n t z τ < w n [ n t z + ( t h t z ) ] 1 w n [ n t z + ( t h t z ) ] τ < w n ( n t z + t z )     2 w n ( n t z + t z ) τ < w n ( n t z + t h )   n = 0 , 1 , 2 ,
To verify the correctness of the above dynamic model, the simulation results are analyzed based on the experimental data in Reference [14]. In this literature, Kahraman et al., carried out a series of dynamic experiments based on a pair of gears with basic parameters as shown in Table 1 and obtained the equivalent root-mean-square amplitude A r m s of dynamic transmission error varying with frequency Ω h under a certain torque. According to the References [14,15], the expression of A r m s can be written as follows:
A r m s = r = 1 3 A r 2
where A r is r th mesh harmonic amplitude of dynamic transmission error, which can be determined from the resulting Fourier spectra according to
A r = s i = N i B W / 2 N i + B W / 2 W ( r s i )
Here, W is the one-sided discrete autopower spectra of dynamic transmission error, s i is a shaft order index, N i is the number of teeth on gear i and B W is the analysis bandwidth in shaft orders.
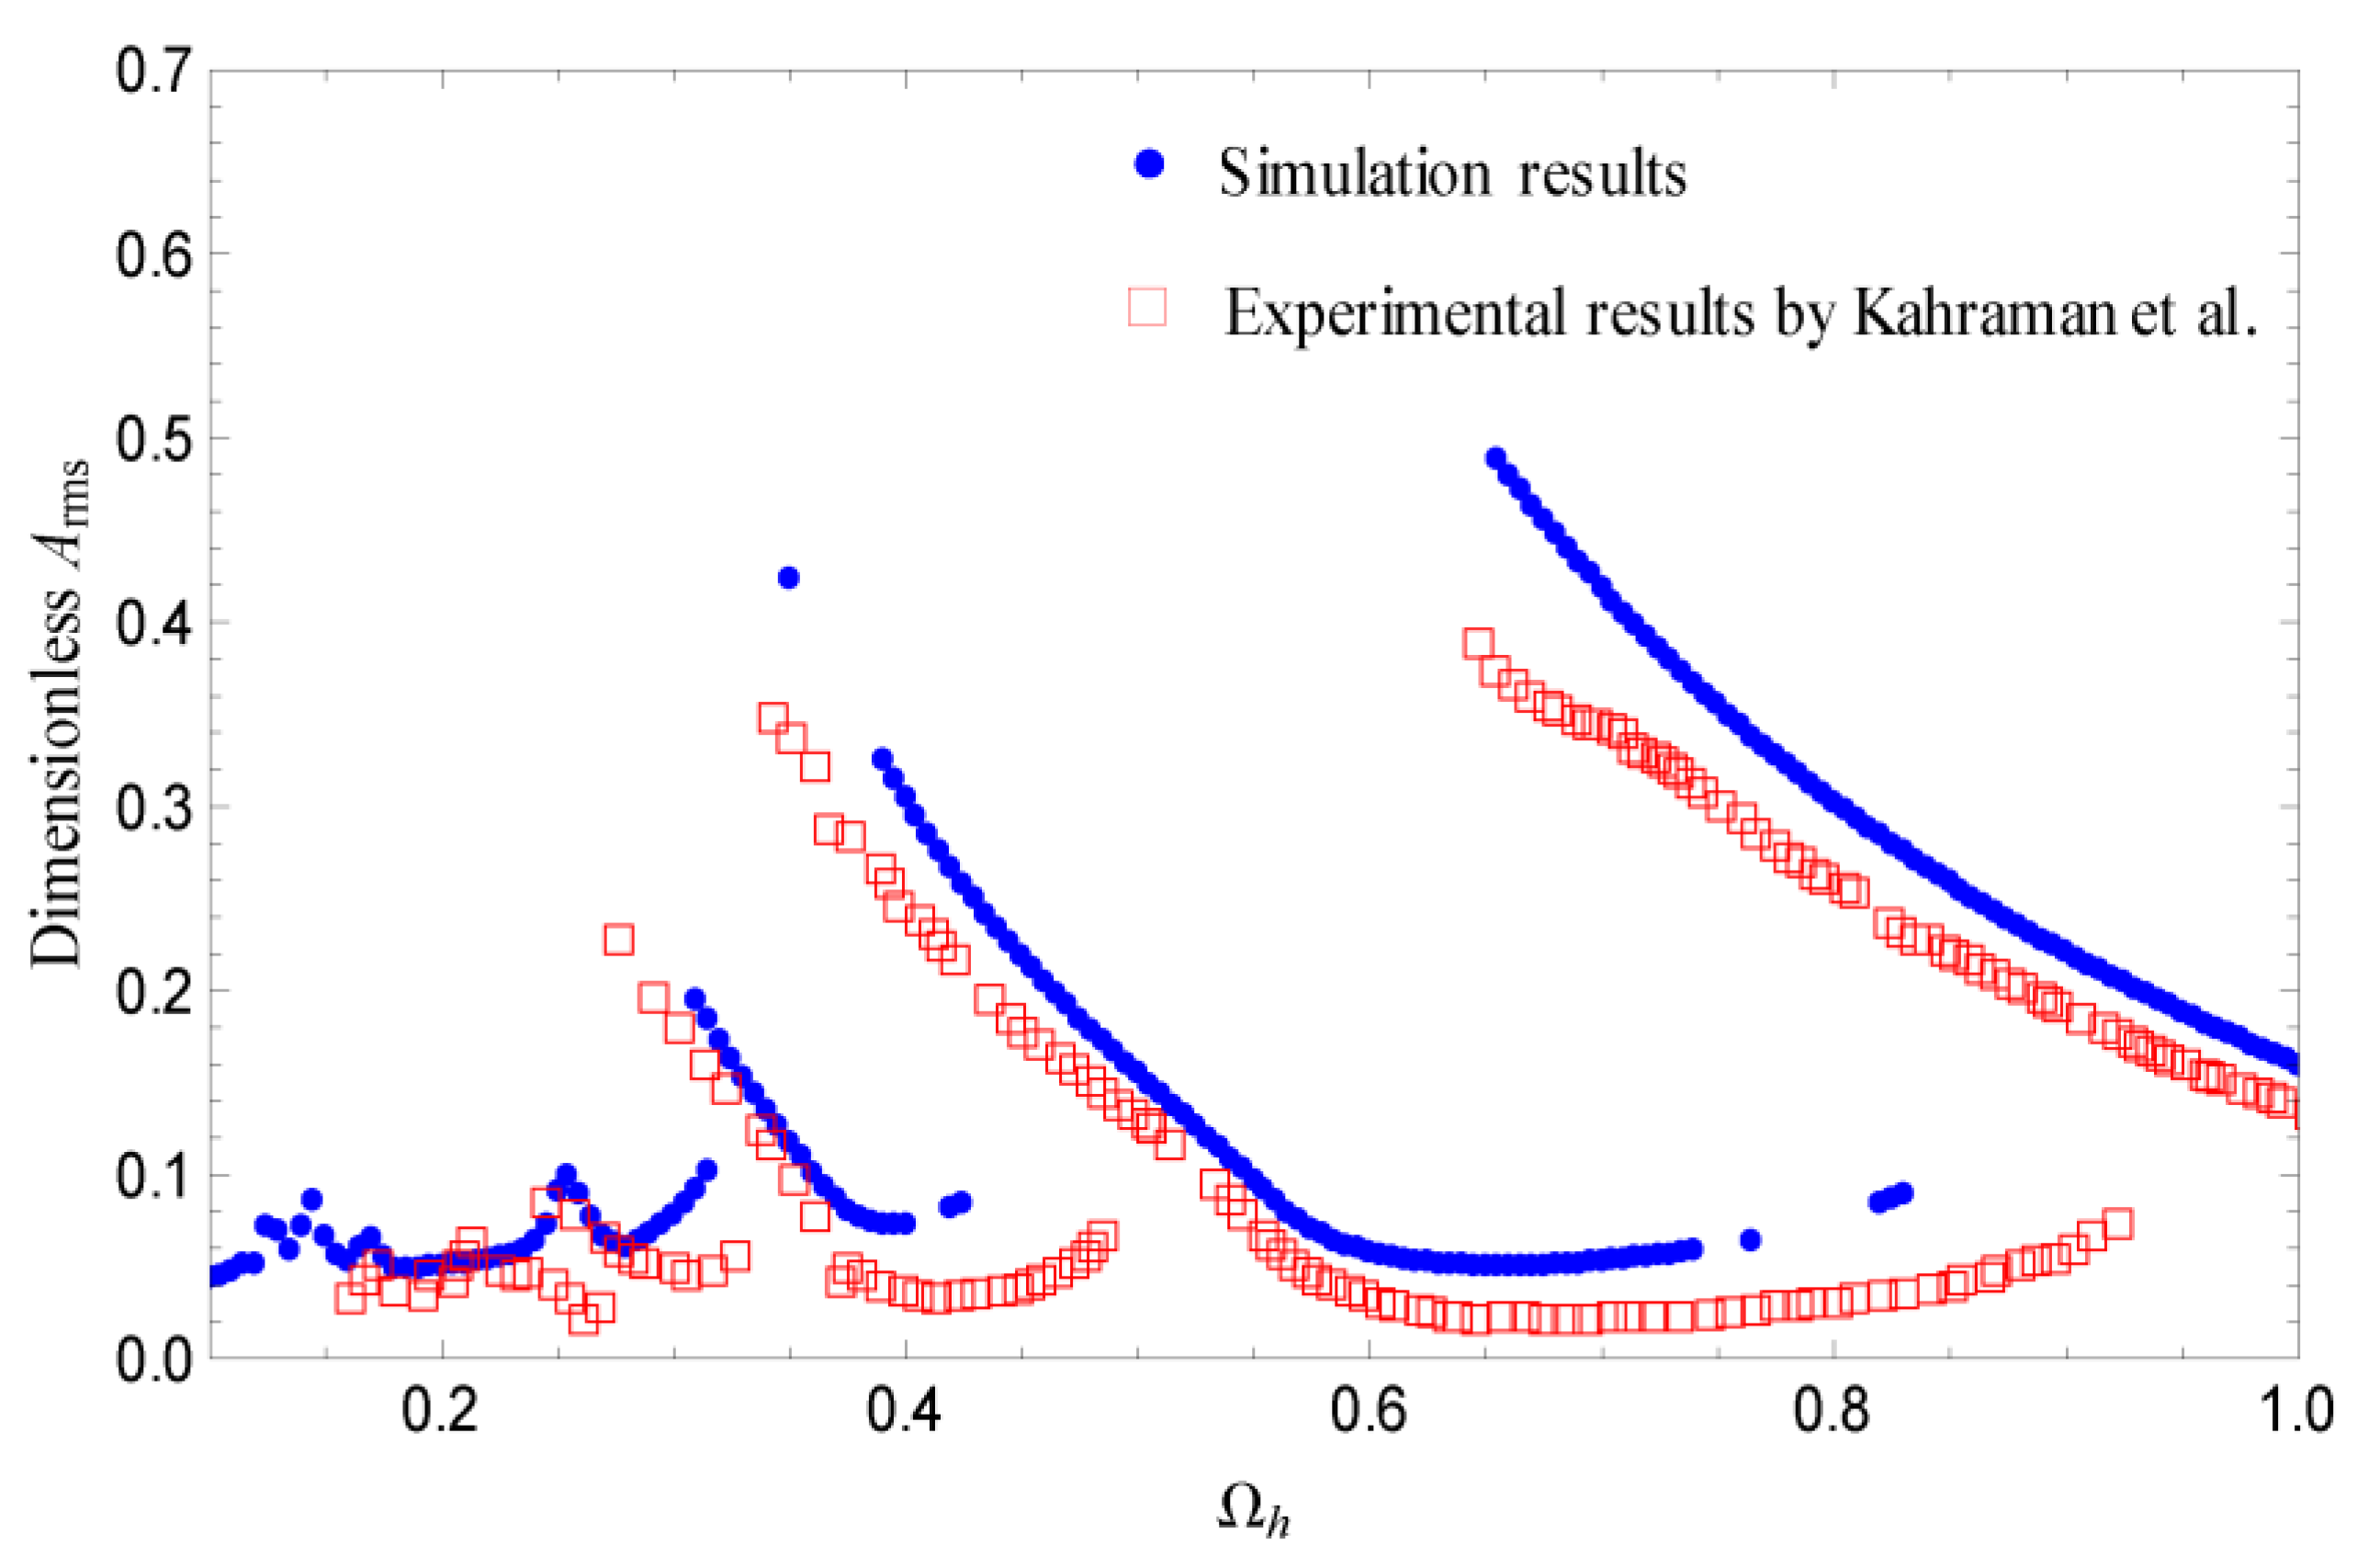
Based on the Reference [14], let ζ ¯ = 0.02 , T = 340 N · m , e ¯ ( τ ) = 0 , the equivalent root-mean-square amplitude A r m s with frequency Ω h can be obtained. The comparison between the simulation results and the experimental results is shown in Figure 3. When Ω h changes from 0.18 to 0.23 , the simulation result is compatible with the experimental result. When   Ω h > 0.25 , the dynamic model can effectively reflect the change trend of the equivalent root-mean-square amplitude A r m s with frequency Ω h . With Ω h varying from 0.25 to 0.32 , 0.3 to 0.43 ,   0.37 to 0.83 , A r m s decreases sharply and then increases slowly. In the whole region, the value of A r m s obtained by the simulation is very close to that of the experiment, especially in the decline stage. The frequency of each inflection point (near Ω h = 0.28 , 0.38 and 0.6 , respectively) reflected by the simulation results and the experimental results is almost consistent. Additionally, the simulation results can accurately predict the transition frequencies where the jump of A r m s occurs. It can be seen that though there are some differences between the simulation results and the experimental results due to the neglect of the influence of some factors such as elastic deformation of shaft and bearing, lubrication, friction, etc., we can obtain a great similarity between them. Therefore, the dynamic model established in this paper is reasonable.

3. Comparative Analysis of Dynamic Meshing Force

The dynamic meshing force is composed of contact force and damping force. For the traditional single degree of freedom dynamic model, the formula of dynamic meshing force can be described as:
F m e s h = k ( t ) f ( x ( t ) e ( t ) ) + c m ( t ) ( x ˙ ( t ) e ˙ ( t ) )
For the new model (the dynamic model considering the meshing state of multiple pairs of teeth), the formula of dynamic meshing force for NCR gears is:
F m e s h = { F m e s h ( j 1 ) + F m e s h ( j ) n t z t < n t z + ( t h t z ) F m e s h ( j ) n t z + ( t h t z ) t < n t z + t z F m e s h ( j ) + F m e s h ( j + 1 ) n t z + t z t < n t z + t h
where
{ F m e s h ( j 1 ) = k ( j 1 ) ( t ) f ( x ( t ) e ( j 1 ) ( t ) ) + c ( j 1 ) ( t ) ( x ˙ ( t ) e ˙ ( j 1 ) ( t ) ) F m e s h ( j ) = k ( j ) ( t ) f ( x ( t ) e ( j ) ( t ) ) + c ( j ) ( t ) ( x ˙ ( t ) e ˙ ( j ) ( t ) ) F m e s h ( j + 1 ) = k ( j + 1 ) ( t ) f ( x ( t ) e ( j + 1 ) ( t ) ) + c ( j + 1 ) ( t ) ( x ˙ ( t ) e ˙ ( j + 1 ) ( t ) )
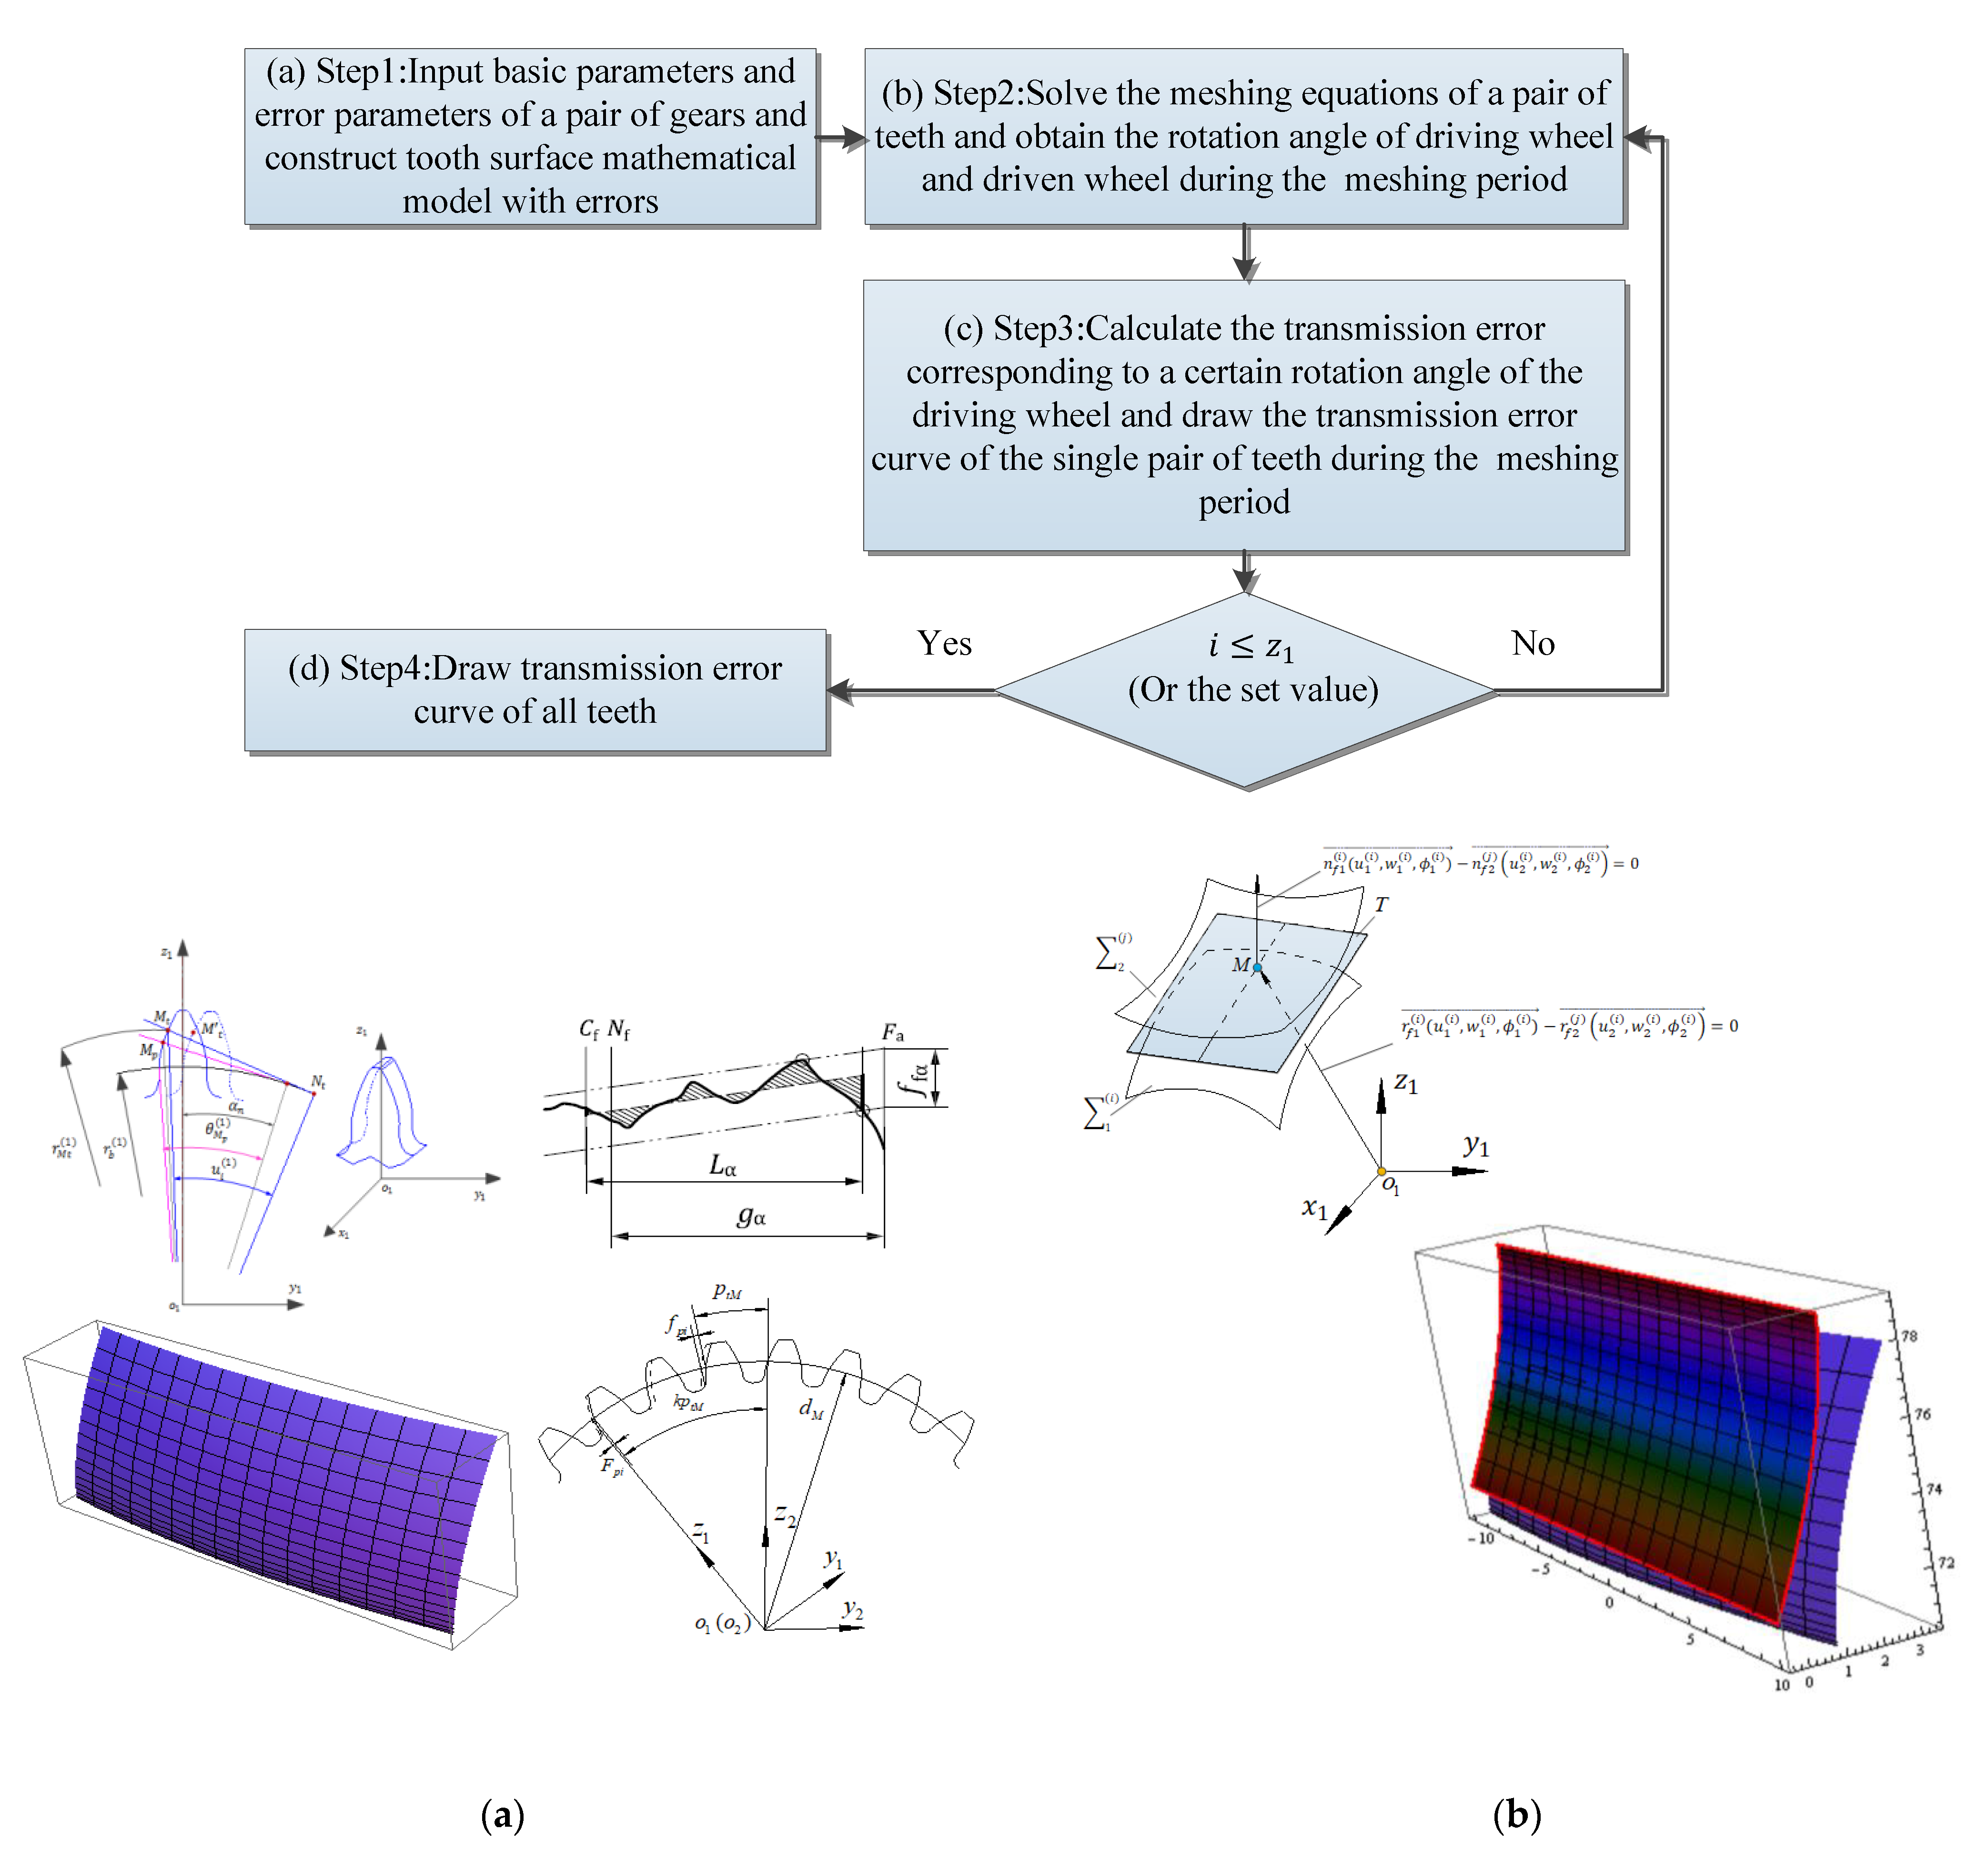
HCR gears have at least two tooth pairs in contact at all times, i.e., contact ratios of 2.0 or more, which can be obtained mainly by adding the addendum and lowering the pressure angle. Compared with NCR gears, the machining process of HCR gears may be more complicated due to the increase of addendum. In addition to traditional machining methods, some new machining methods [22,24] can also be used to ensure the accuracy of the tooth profile. Obviously, for HCR gears, the dynamic meshing force involves five pairs of teeth, i.e.,   F m e s h ( j 2 ) , F m e s h ( j 1 ) , F m e s h ( j ) , F m e s h ( j + 1 ) , F m e s h ( j + 2 ) . Here, we will mainly take NCR gears as the object for discussion. It can be seen from Formula (12) that e ( t ) used in the traditional model is the comprehensive meshing error, which reflects the overall error of the meshing teeth in the meshing process. In many previous literatures, simple harmonic function is often used to express the transmission (meshing) error. However, there are many kinds of deviation parameters in the gear system and the shape and amplitude of transmission error caused by different deviation parameters are often different. Therefore, the use of simple harmonic function may not fully express the specific characteristics of transmission error. In fact, the tooth contact analysis method (TCA) can be used to obtain the meshing (transmission) error [4] and the solution steps are shown in Figure 4. After constructing the tooth surface mathematical model considering different deviations (errors), by solving the tooth surface meshing equation, the meshing error data at each meshing position in the meshing process can be acquired, and then the single pair of teeth meshing error curve can be drawn. By successively calculating the meshing error of each pair of meshing teeth, we can obtain the meshing error curves of all tooth pairs. If the influence of contact ratio is considered, the comprehensive meshing error curve will be obtained by extracting the superior envelope of the meshing error curve of the former and the latter pair of teeth in the double-tooth meshing region.
Here, taking the tooth profile deviation as an example, the difference between comprehensive meshing error and tooth meshing error of a single pair will be analyzed. According to References [16,17], the tooth profile deviation can be described as:
e α ( s ) = e f ( s ) + e H ( s ) = f f α 2 sin ( 2 π f r s s o s f s o ) + f H α s s o s f s o ( s o s s f )
where f f α and f H α are profile form deviation and profile slope deviation, respectively   ( mm ); f r is the number of sine periods over the profile evaluation range; s is the involute rolling path length over the profile evaluation range   ( mm ); s o and s f are the minimum and maximum values of s over the profile evaluation range, respectively.
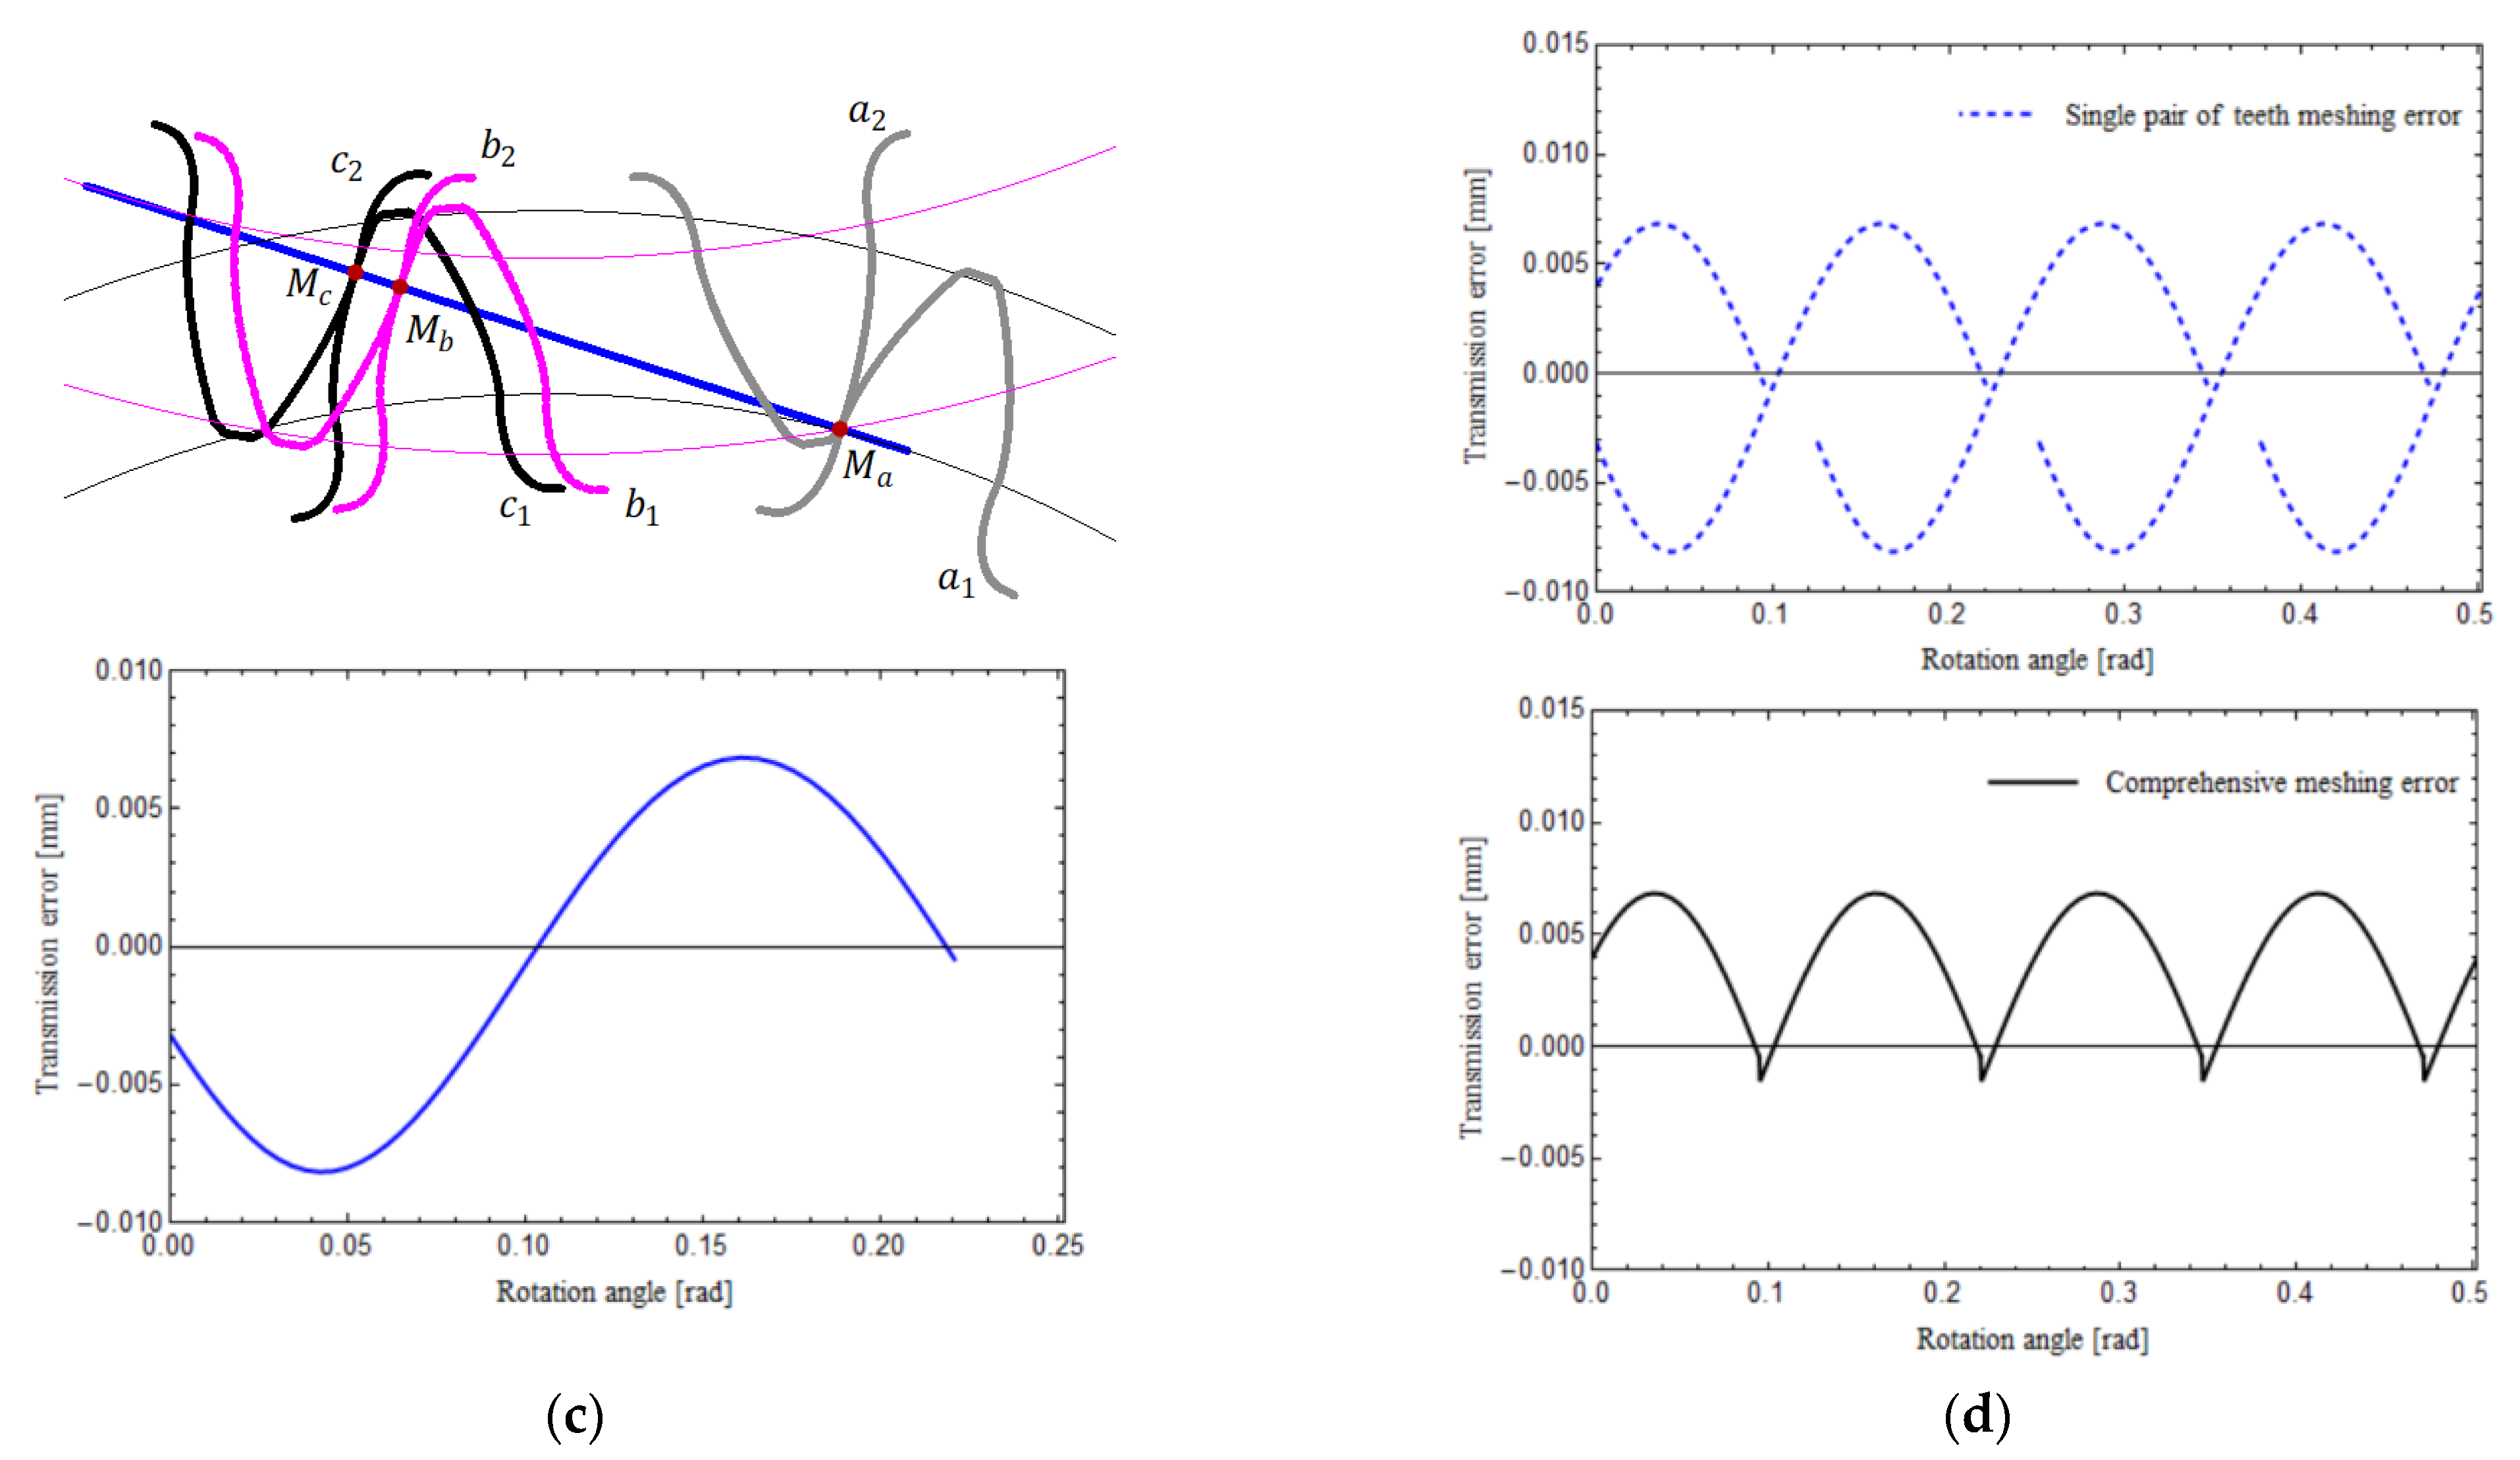
Figure 5 shows the single pair of teeth meshing error curve and comprehensive meshing error curve obtained by the TCA method under different contact ratio ε with f f α = + 0.015   mm , f r = 2 . As can be seen from Figure 5, the two error curves are coincident in the single-tooth meshing region; however, there is difference between them in the double-tooth meshing region, because the comprehensive meshing error curve only reflects the meshing state of the tooth pair with the larger meshing error. Moreover, with the increase of contact ratio, the double-tooth meshing region gradually expands and the difference between the two curves will become more and more obvious. For example, Figure 5c,d show the single pair of teeth meshing error and comprehensive meshing error obtained under different tooth profile deviations when contact ratio ε = 1.92 , respectively. It should be noted that Figure 5d shows another single pair of tooth meshing error curve obtained by adjusting the tooth profile deviation during the double-tooth meshing region. By comparing Figure 5c,d, we can observe that although the single pair of teeth meshing errors in the two cases are obviously different, the corresponding comprehensive meshing errors curve are the same. It can be predicted that the dynamic performance and dynamic meshing force obtained by the traditional model (based on comprehensive meshing error) and the new model (based on a single pair of teeth meshing error) are likely to be different.
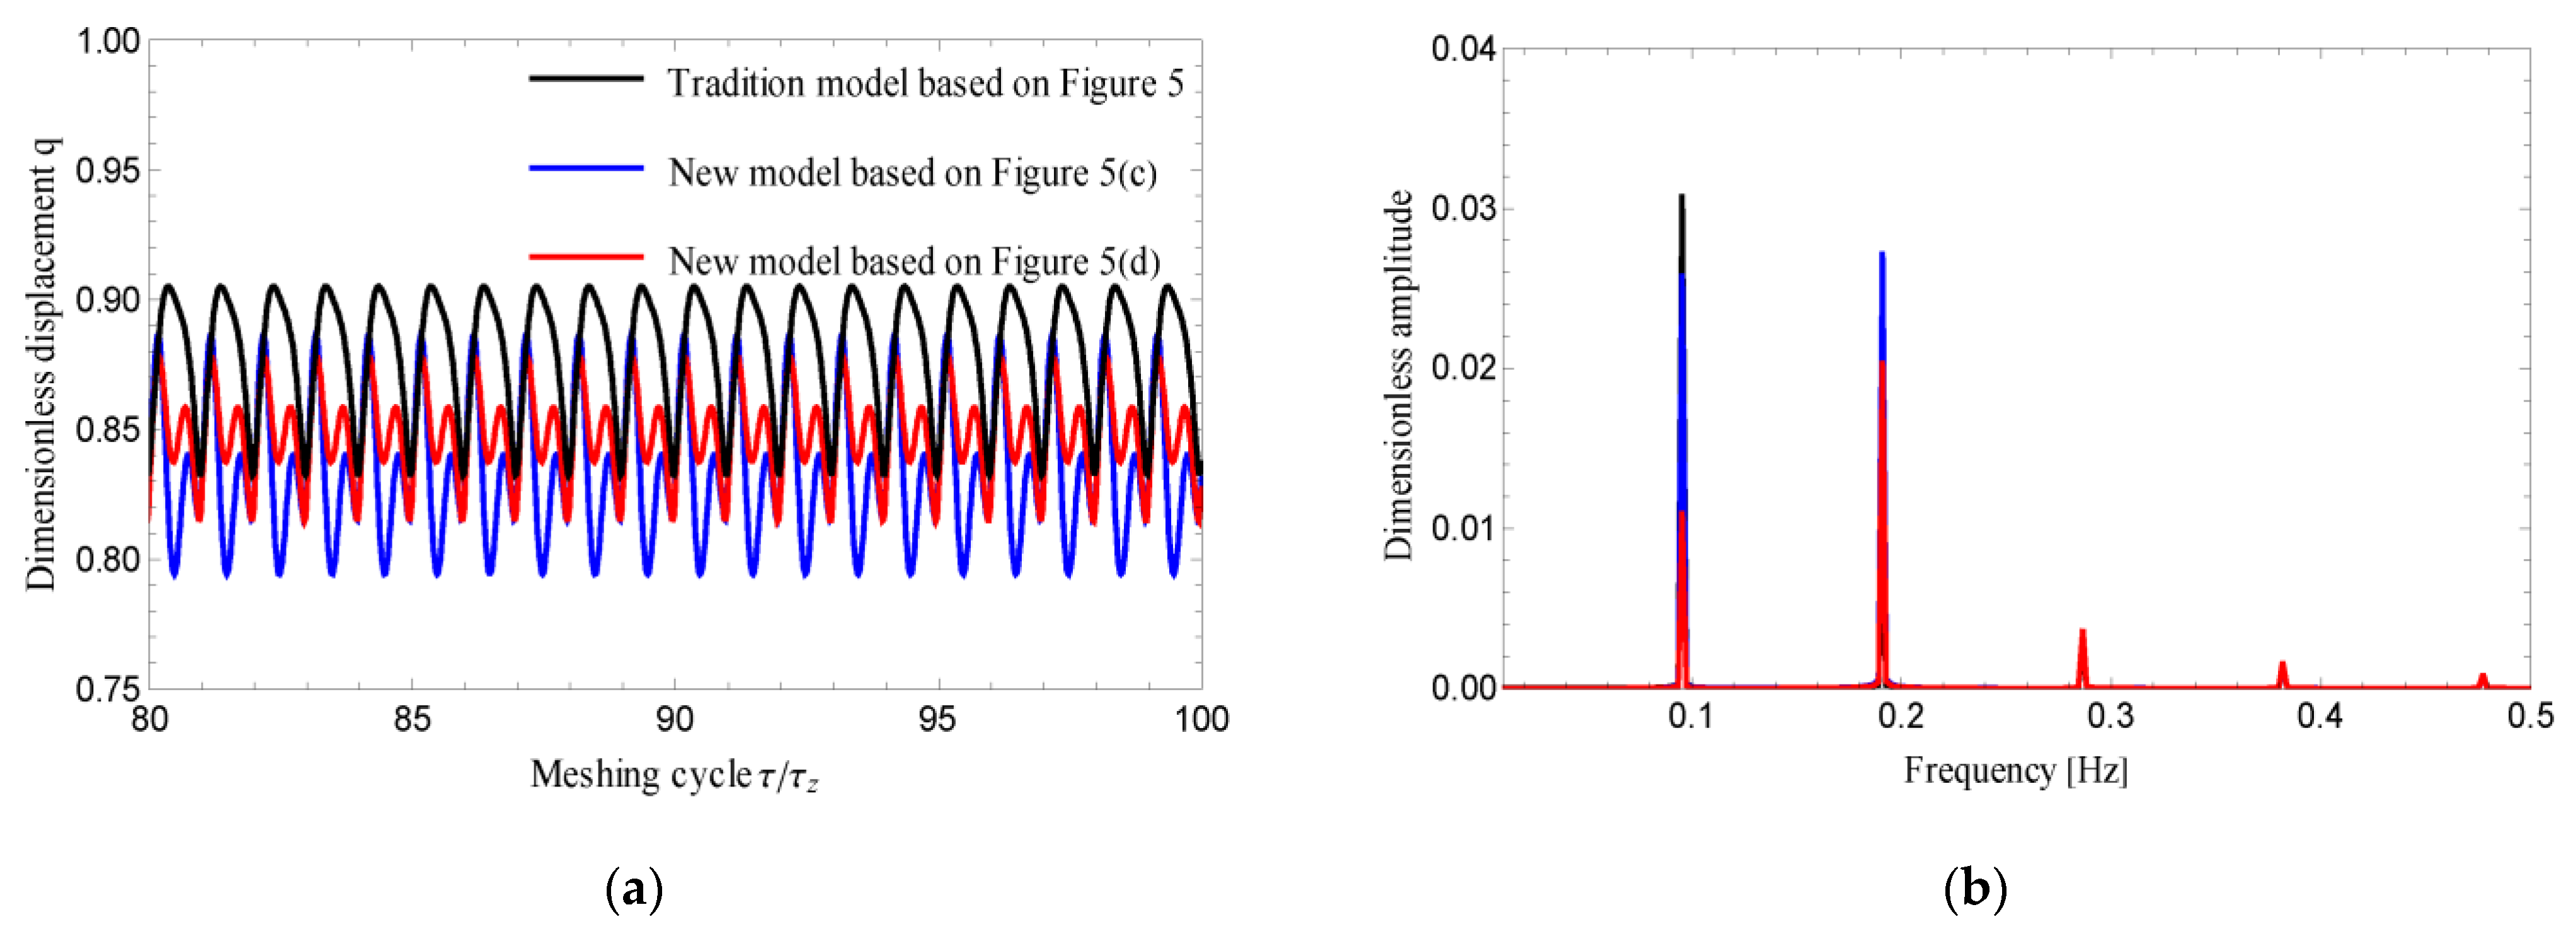
To illustrate the difference of dynamic response and dynamic meshing force obtained by the two dynamic models, we take the meshing state reflected in Figure 5c,d as an example for analysis. Let ζ ¯ = 0.04 , T = 500   N · m , Ω h = 0.6 . The single pair of teeth meshing error and comprehensive meshing error in Figure 5c,d are successively brought into the corresponding dynamic models and the time-history data of gear dynamic characteristics can be obtained by solving the dynamic equations. Figure 6 shows the time history diagram (only the variation of displacement from 80 to 100 meshing cycles is shown for saving space) and FFT spectrogram obtained by the traditional model and the new model. Here, in order to clearly show the change of dynamic transmission error in a meshing cycle, select τ / τ z as the abscissa, where τ z is dimensionless period. It can be seen from Figure 6 that the dynamic responses obtained by the new model based on Figure 5c,d are different due to the difference of meshing state, but corresponding dynamic responses obtained by the traditional model are the same. In addition, we can see that there is an obvious difference between the dynamic responses obtained by the new model and by the traditional model. Therefore, compared with the traditional dynamic model, the new model can effectively reflect the influence of different meshing errors on the dynamic performance in the whole meshing stage.
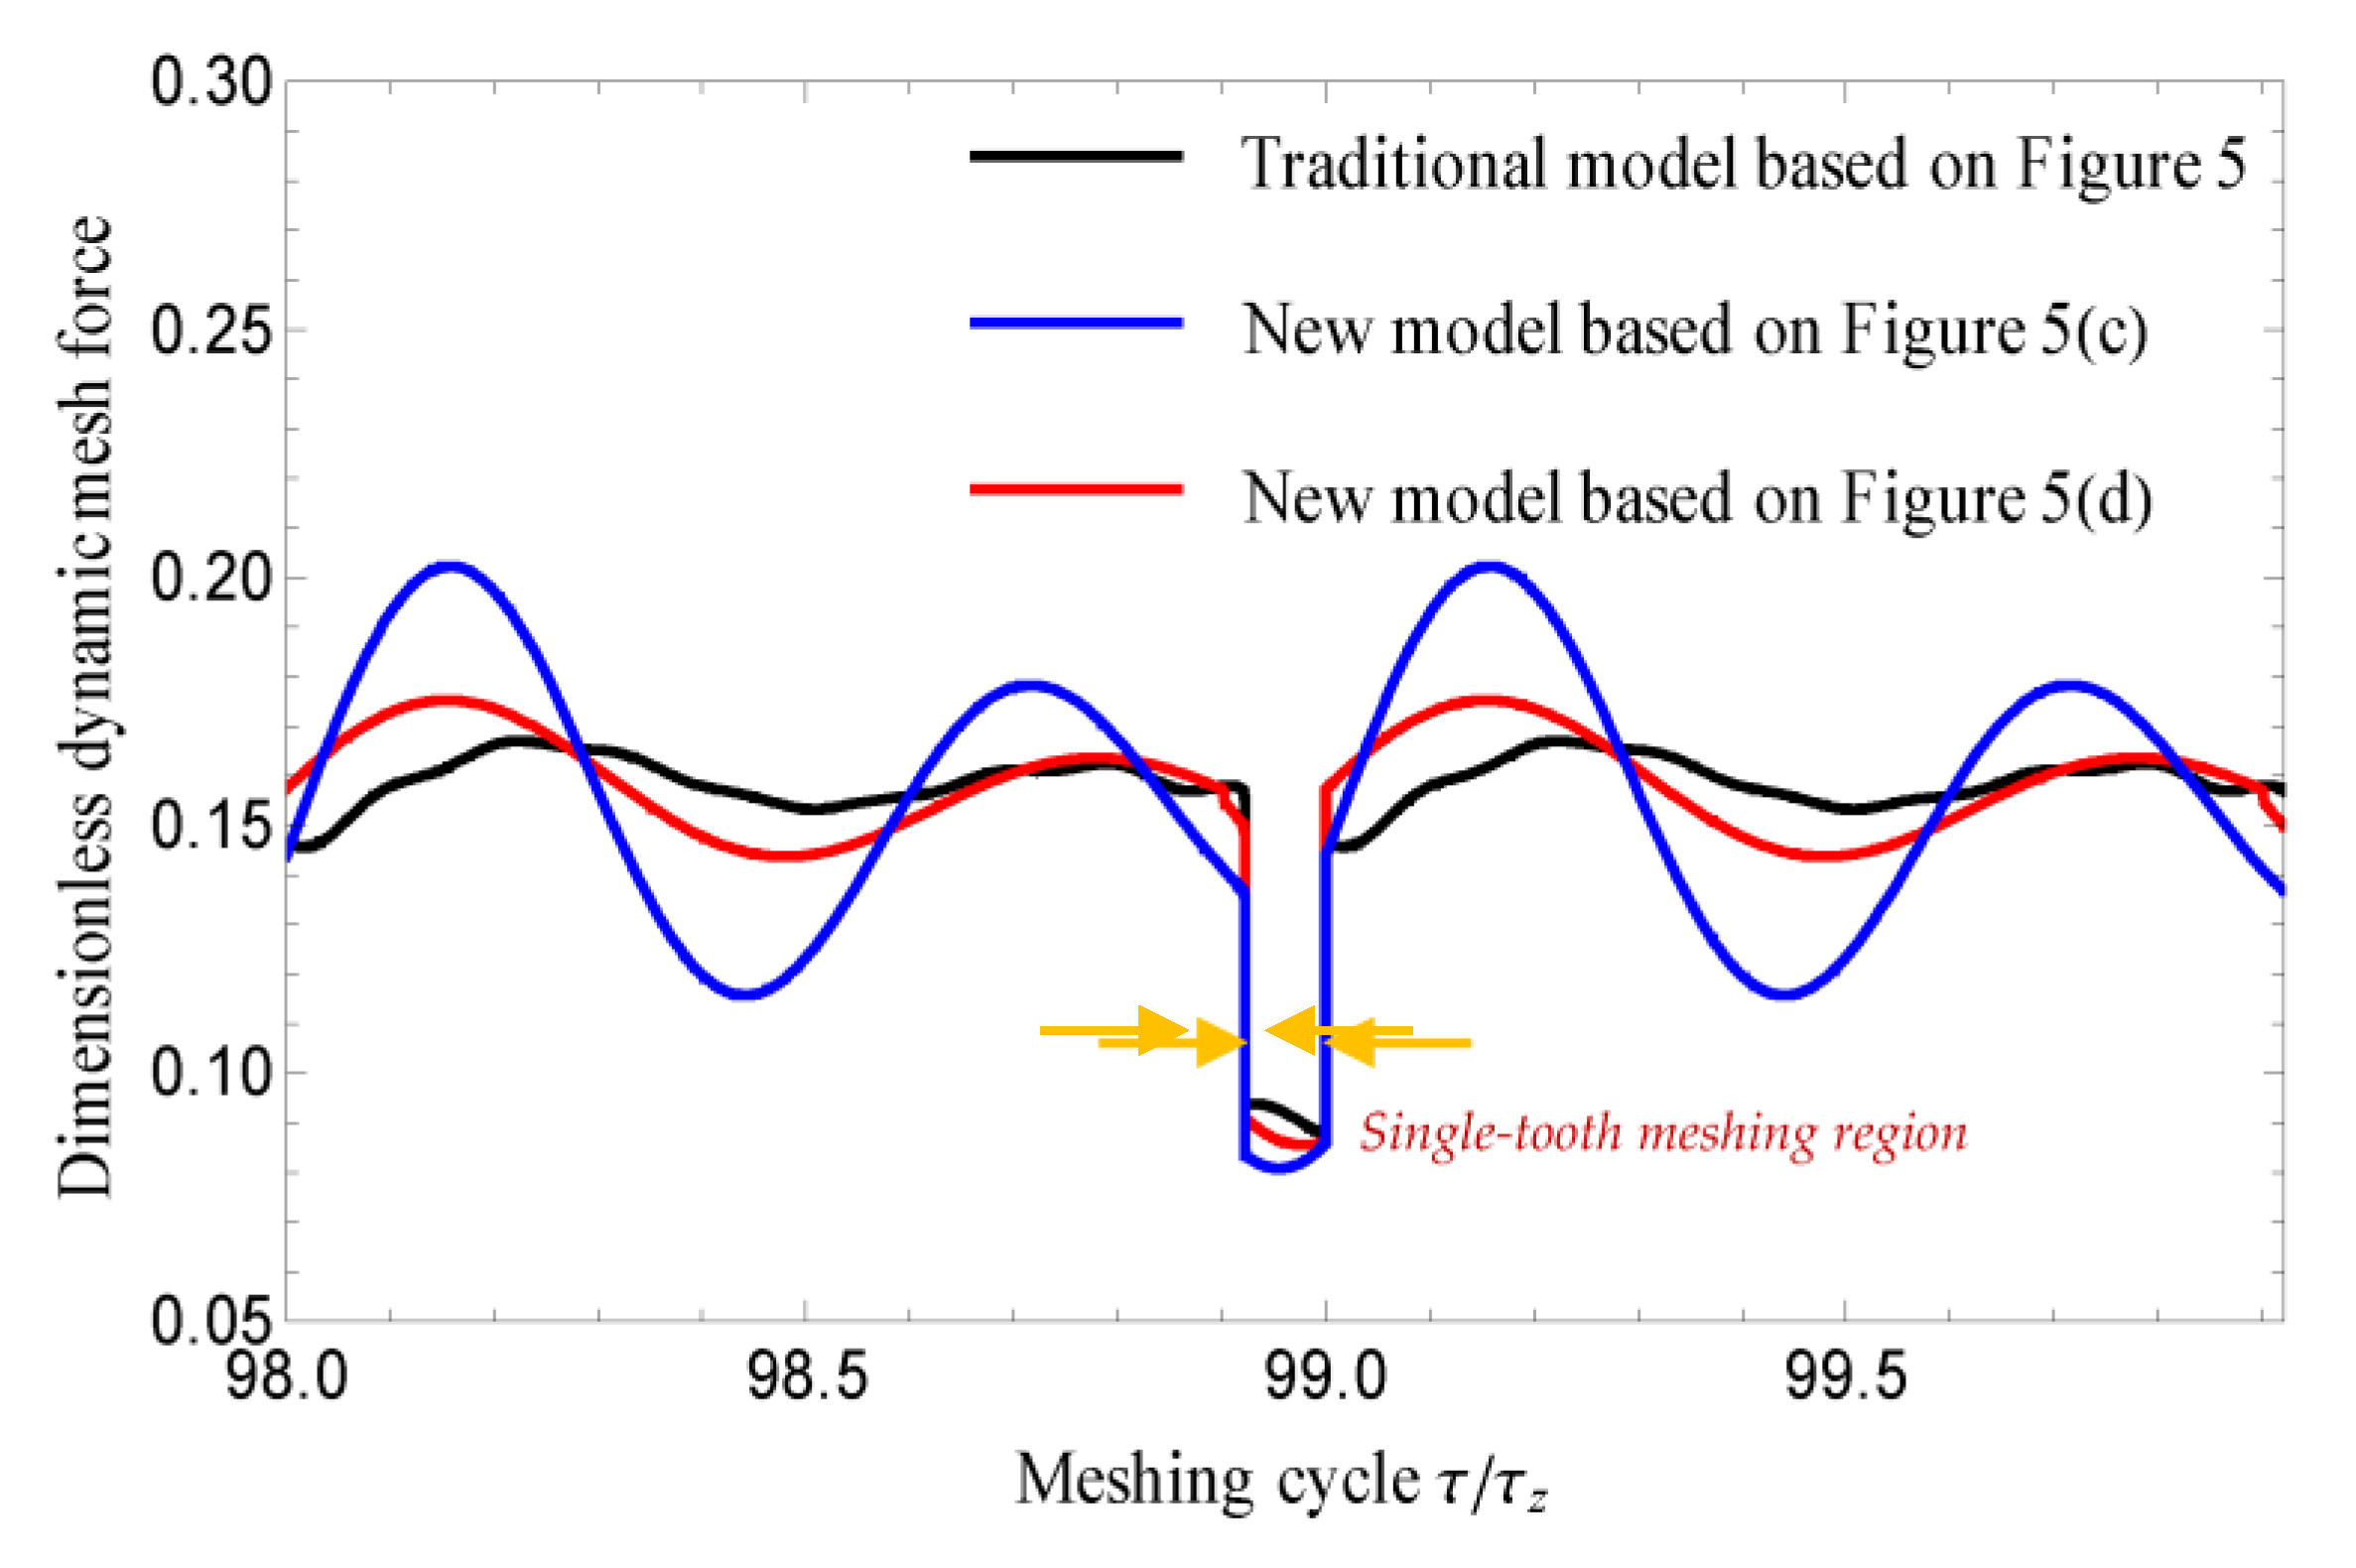
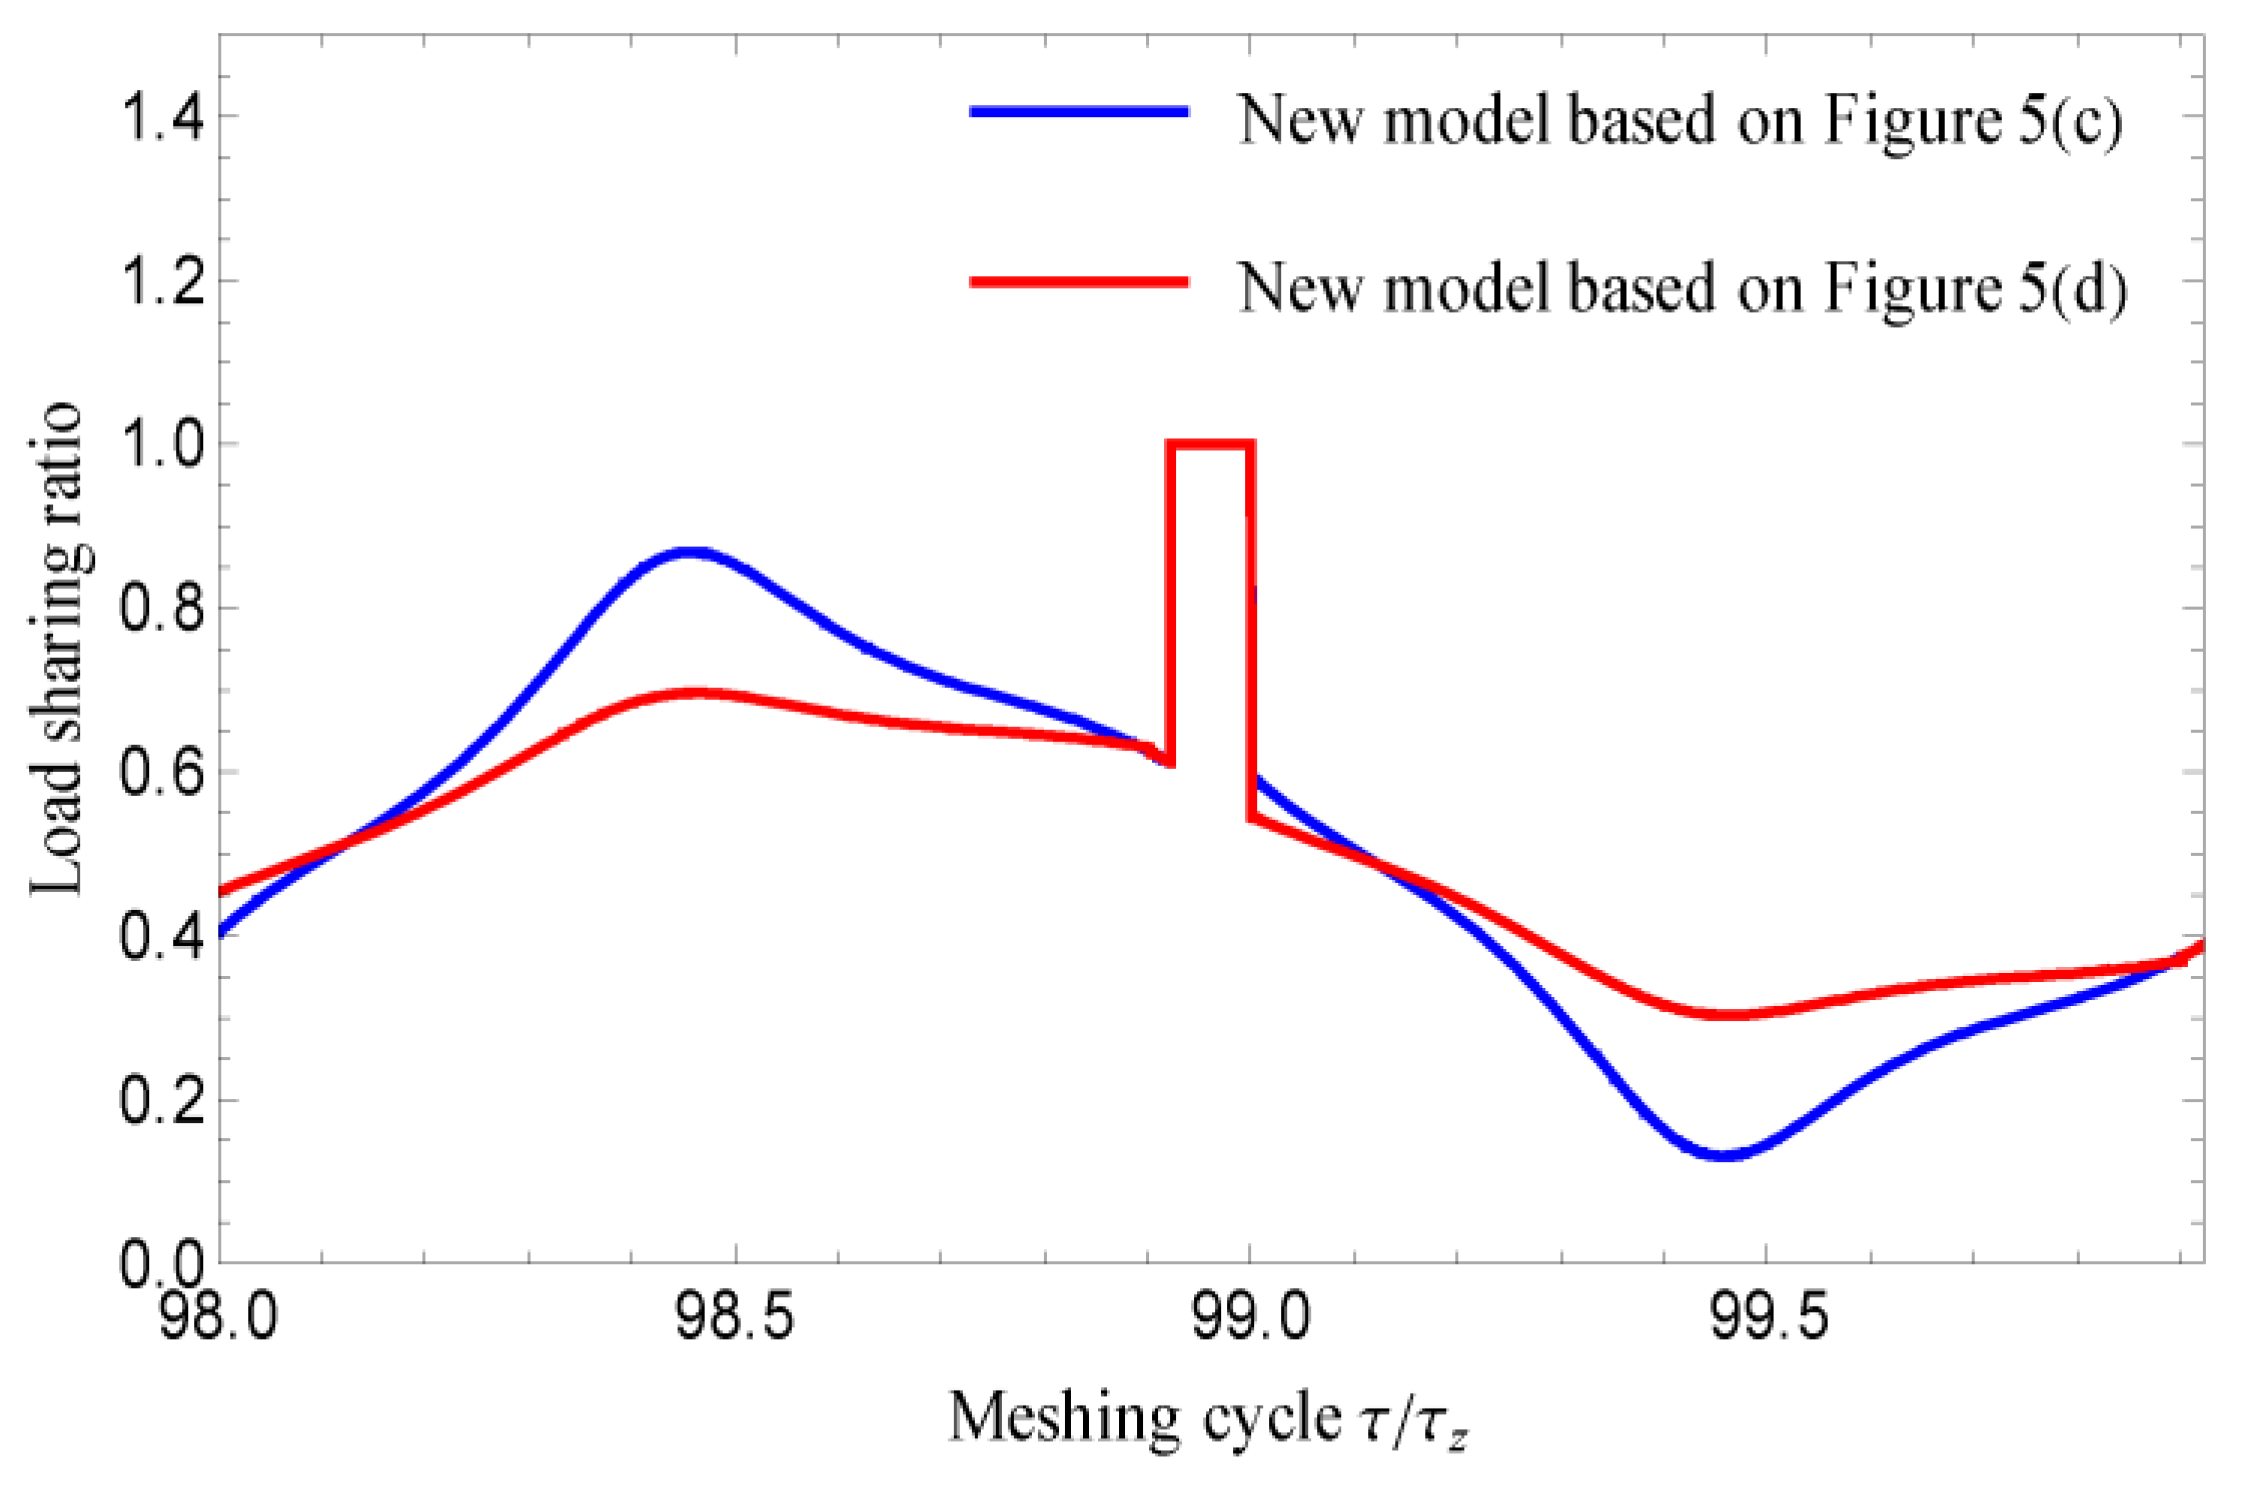
By further bringing the solution results of the dynamic equation into Formulas (12) and (13), the total dynamic meshing force, which is the sum of the dynamic meshing forces of each pair of meshing teeth participating in meshing during different meshing regions, varying with the meshing cycle can be obtained, as shown in Figure 7. We can see that, the overall change trends of dynamic meshing force based on the two models are the same, but the amplitudes fluctuation of dynamic meshing force between them are quite different, especially in the double-tooth meshing region. Since the new model adopts the single pair of teeth meshing error, the meshing force and the load sharing ratio of each pair of teeth under different meshing errors can be analyzed as shown in Figure 8 and Figure 9. Comparing Figure 8a,b, it can be seen that the fluctuation trends of the dynamic meshing forces of a single pair of teeth under the two meshing errors with the meshing cycle are similar, but their fluctuation amplitudes are obviously different. Figure 9 also reflects the difference of load sharing ratio under the two meshing errors. We can see that the meshing error of a pair of teeth may have an important impact on the dynamic meshing force and load distribution in the meshing process. The above analysis indicates that the calculation method of the dynamic meshing force based on the new model can be used to calculate the dynamic meshing force of each pair of teeth considering their meshing errors, which is helpful for the analysis dynamic behavior or calculation of dynamic load capacity of gears, especially HCR gears with contact ratio more than two.

4. Effects of Different Factors on Dynamic Meshing Force

In this part, based on the new model and the corresponding calculation method of the dynamic meshing force, the influence of different factors on the dynamic response and the dynamic meshing force will be analyzed.

4.1. Influence of Different Deviations on Dynamic Meshing Force

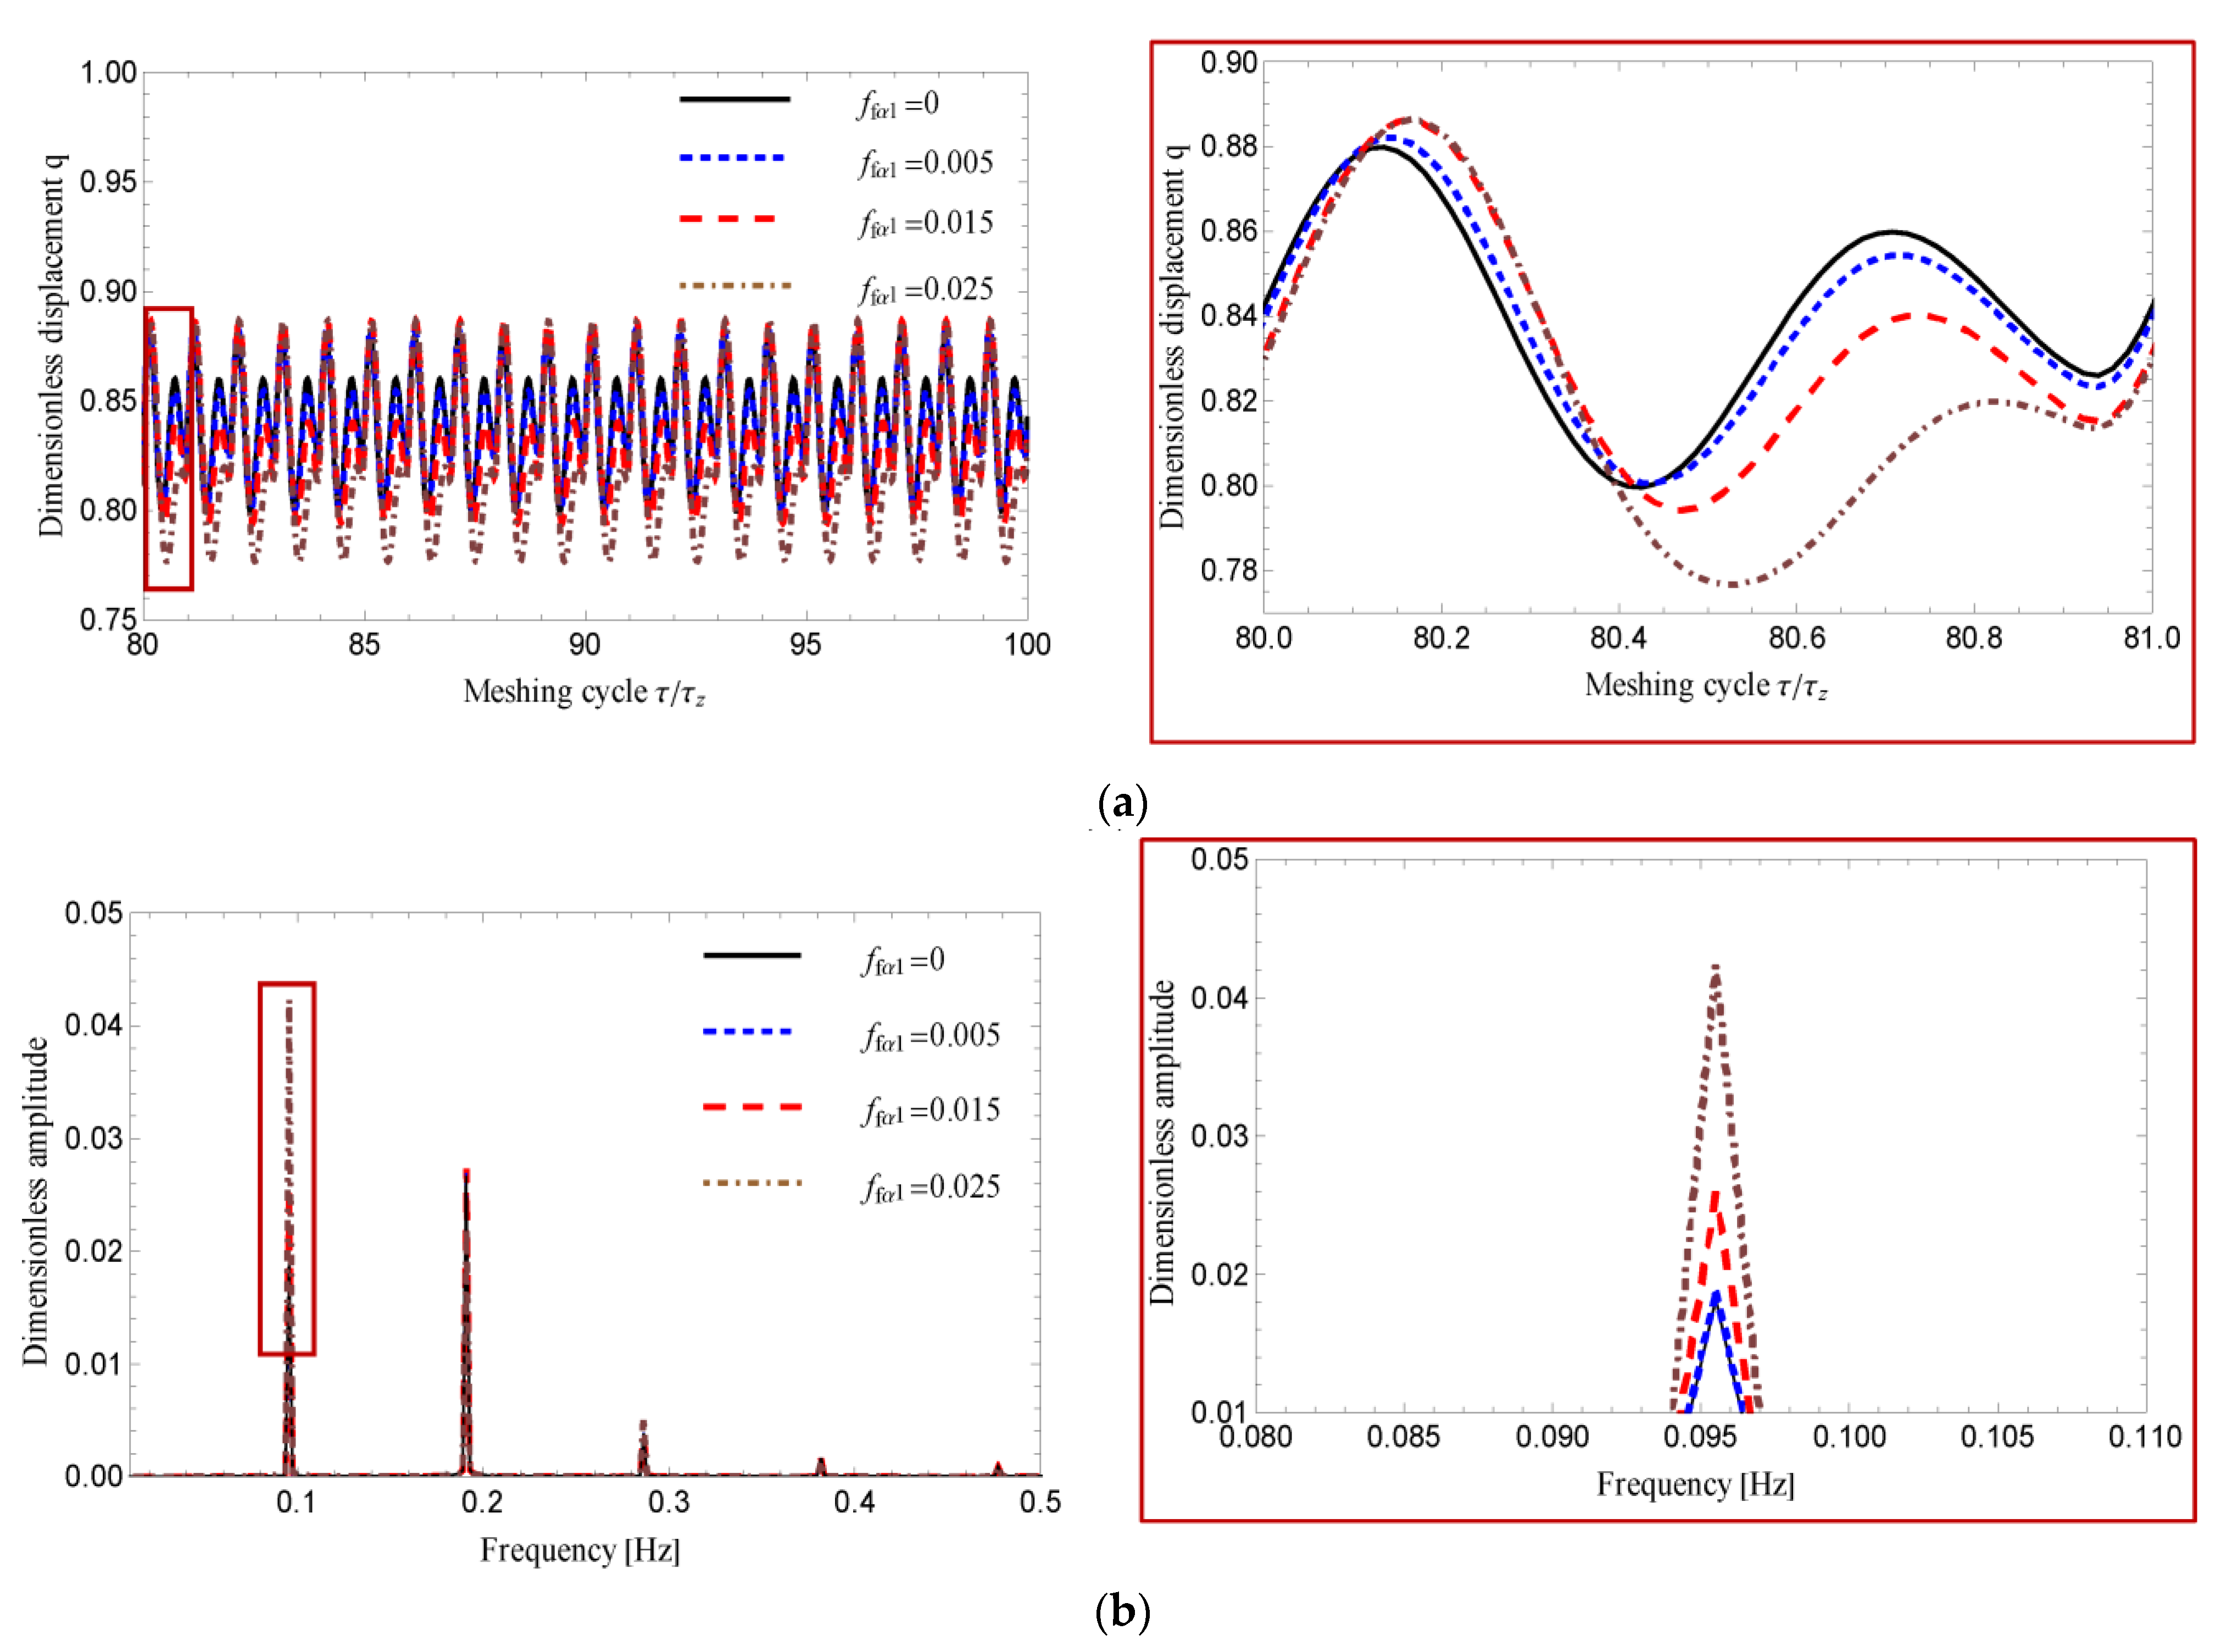
Here, we still take the tooth profile deviation as an example to analyze the changes of the dynamic response and the dynamic meshing force under different profile form deviations and profile slope deviations. Let the profile form deviation f f α 1 be 0 ,   0.005 ,   0.015 ,   0.025   mm , respectively, and the corresponding meshing errors can be obtained based on the meshing error solution algorithm. Substitute them into the dynamic equation and let ζ ¯ = 0.04 , T 1 = 500   N · m , Ω h = 0.6 . By solving the dynamic equations, we can obtain the time history diagram and the FFT spectrogram when f f α 1 is 0 , 0.005 , 0.015 , 0.025   mm , respectively, as shown in Figure 10. When f f α 1 increases from 0 to 0.005   mm , the change of dynamic response is not obvious. With f f α 1 increasing from 0.005 , 0.015 to 0.025   mm , the amplitude of dynamic transmission error (displacement) q and the dominant frequency increase obviously, which shows that the increase of f f α 1 leads to the aggravation of vibration of the whole system.
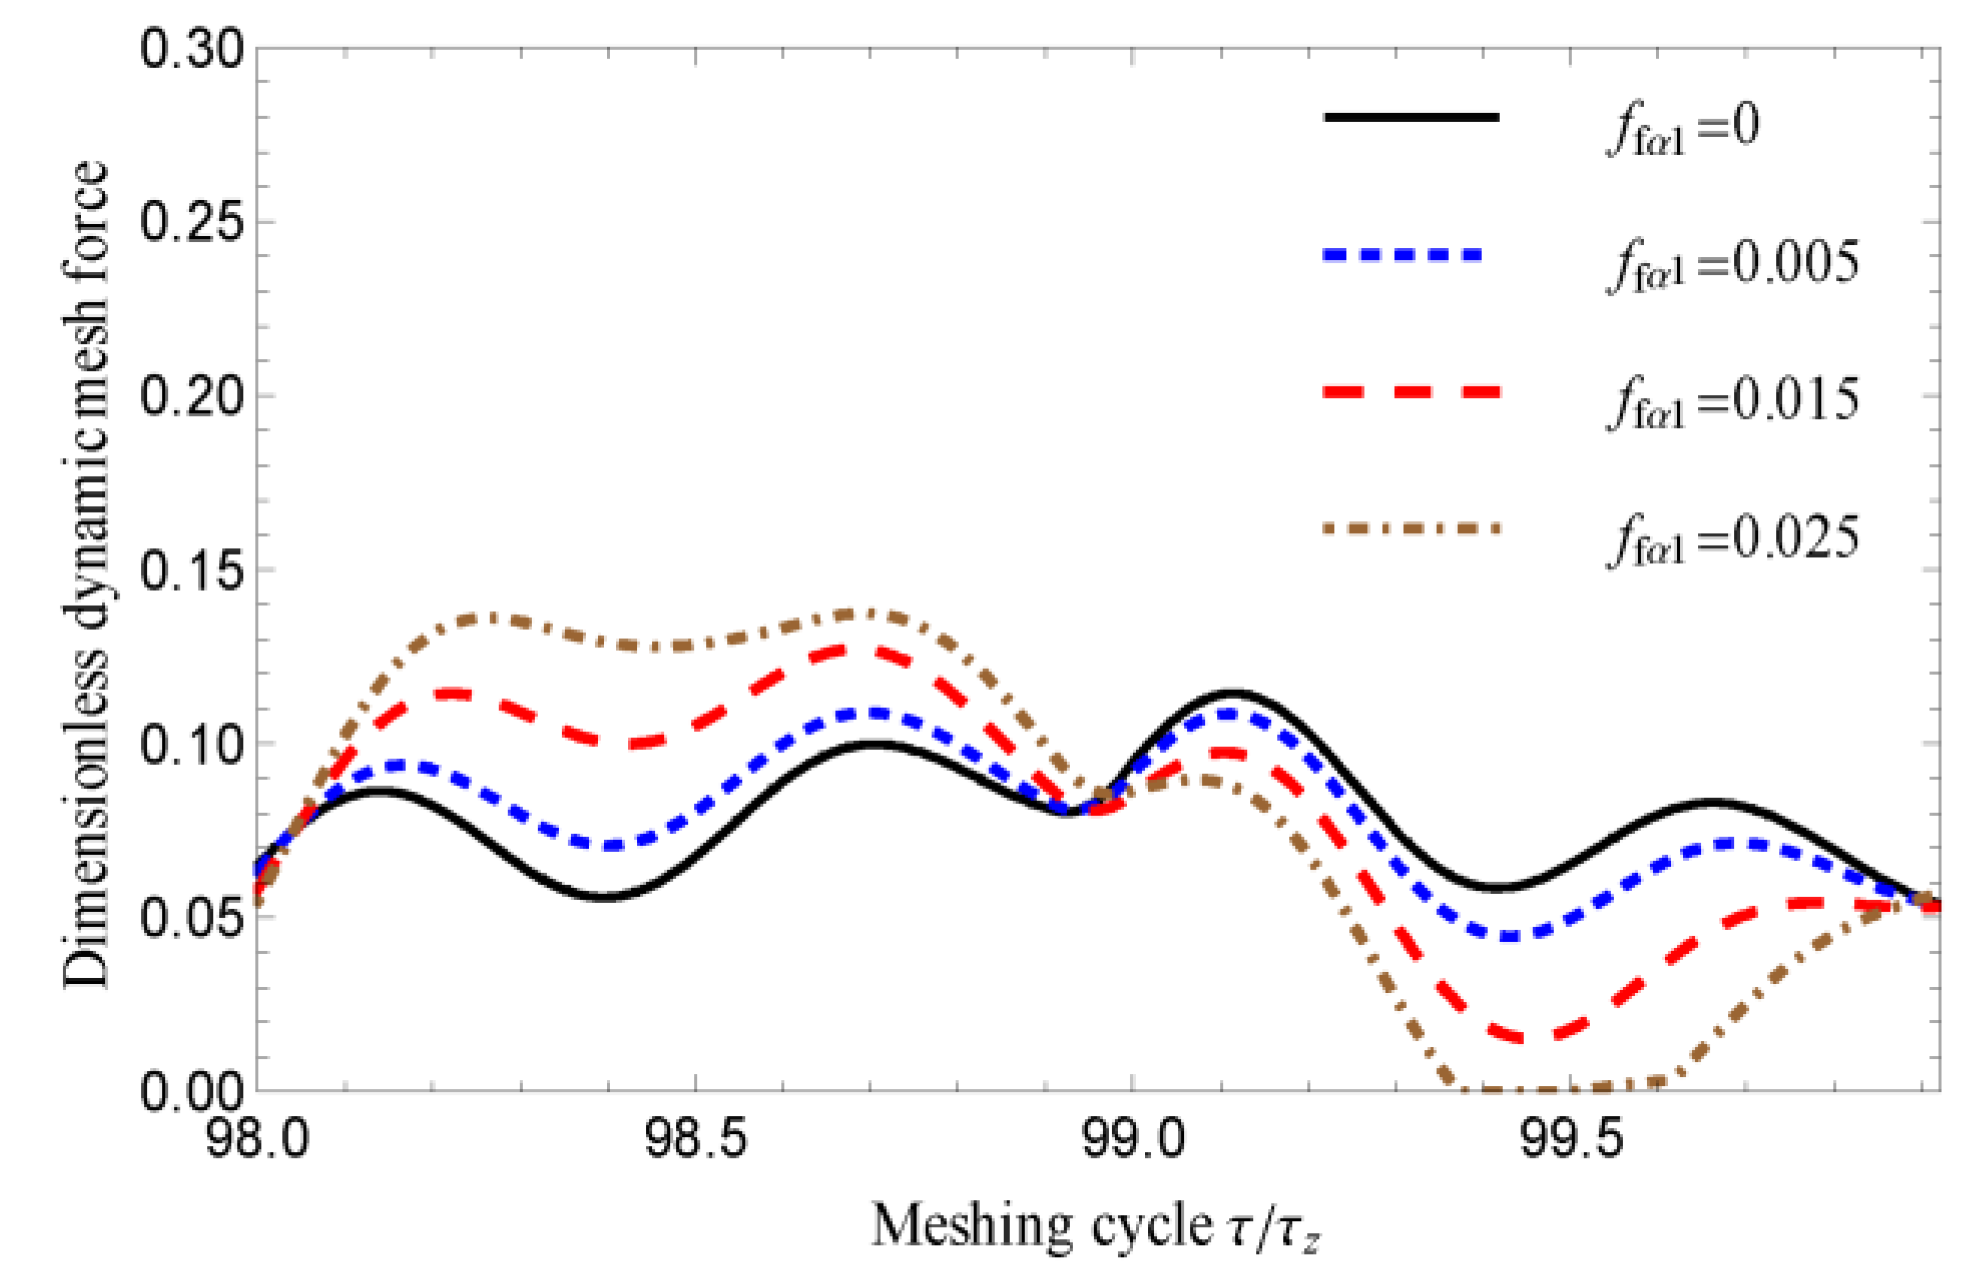
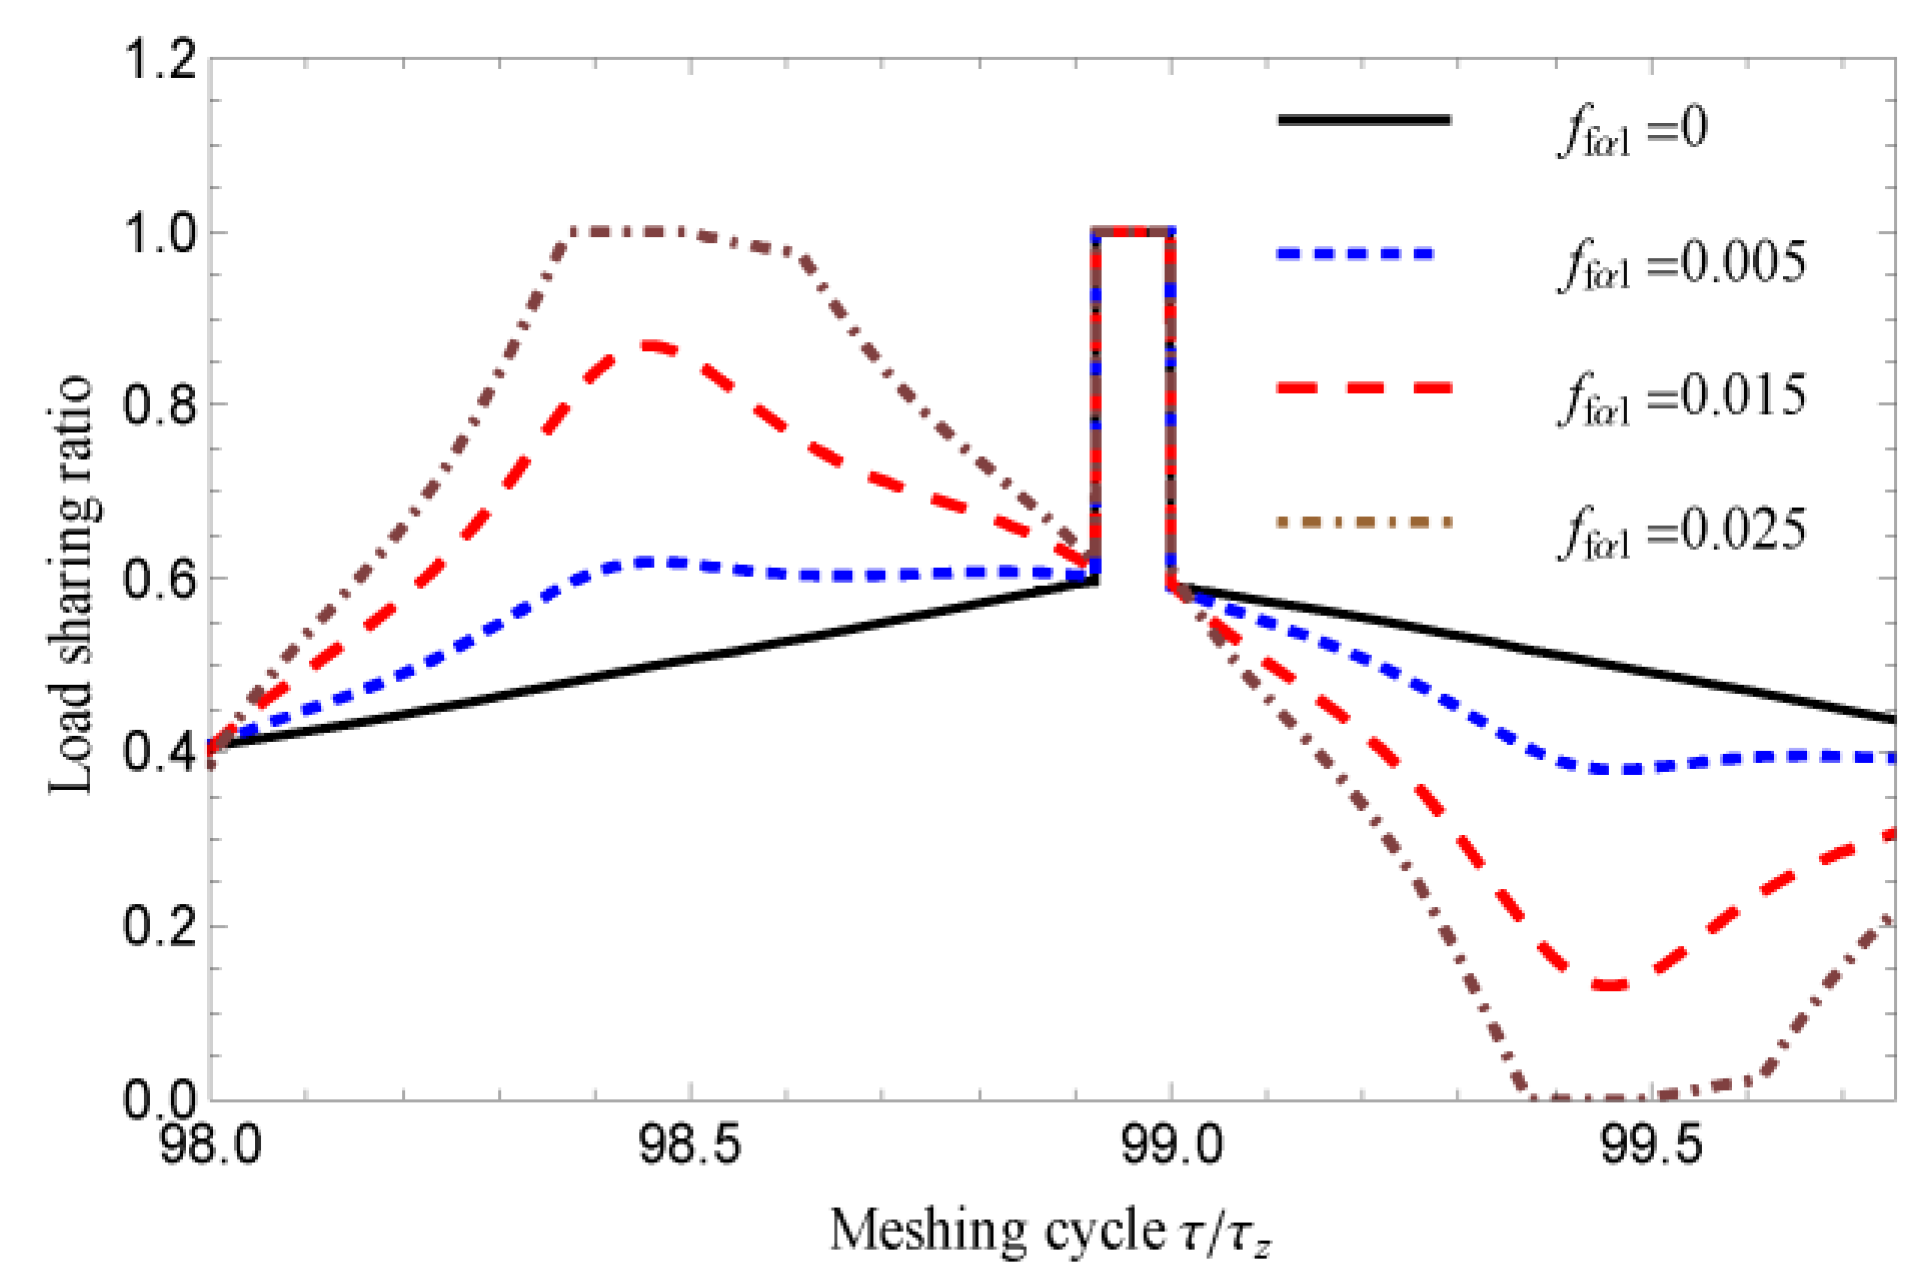
By bringing the solution results of the dynamic equation into the formula of the dynamic meshing force, the variation of the total dynamic meshing force and the single pair of teeth meshing force with the meshing cycle can be obtained when f f α 1 is equal to 0 ,   0.005 ,   0.015 ,   0.025   mm , respectively, as shown in Figure 11 and Figure 12. As can be seen from Figure 11, with different f f α 1 , the total dynamic meshing force will be different due to the different meshing state of each pair of teeth, which can be seen more clearly from Figure 12. It shows the change of dynamic meshing force of a single pair of teeth from meshing in to meshing out. It can be seen that as the profile form deviation f f α 1 increases from 0.005 ,   0.015 to 0.025   mm , the difference between the corresponding dynamic meshing force curve and the dynamic meshing force curve with f f α 1 = 0   mm becomes more and more obvious. It should be noted that, in the rear double-tooth meshing region, the dynamic meshing force of the pair of teeth is reduced to 0 when f f α 1 is 0.025   mm , which means that the pair of teeth are in the state of tooth disengagement and the load is completely borne by the other pair of teeth. To further illustrate the load distribution of a single pair of teeth in a meshing cycle, the curve of the load sharing ratio varying with the meshing cycle is drawn, as shown in Figure 13. When f f α 1 = 0   mm , in the front and rear double-tooth meshing regions, the load sharing ratio increases or decreases smoothly with the change of meshing cycle and the load sharing ratio curves in the two double-tooth meshing regions are symmetrically distributed relative to the middle single-tooth meshing region. When f f α 1 = 0.005   mm , the load sharing ratio curve fluctuates to a certain extent, the fluctuation state of which mainly depends on the shape of tooth profile deviation. As f f α 1 increases from 0.005 , 0.015 to 0.025   mm , the amplitude of the fluctuation of the load sharing ratio curve increases gradually. When f f α 1 is 0.025   mm , a section of meshing region with the load sharing ratio equaling to one appears in the front double-tooth meshing region, which indicates that another pair of teeth are out of meshing at this time and the load is completely borne by the pair of teeth. It can be seen that the profile form deviation can affect the meshing state of gear teeth, resulting in the change of dynamic transmission performance and dynamic meshing force to a certain extent. Moreover, if the profile form deviation is too large, the phenomenon of tooth disengagement will occur, which should be paid attention to in gear design and processing.
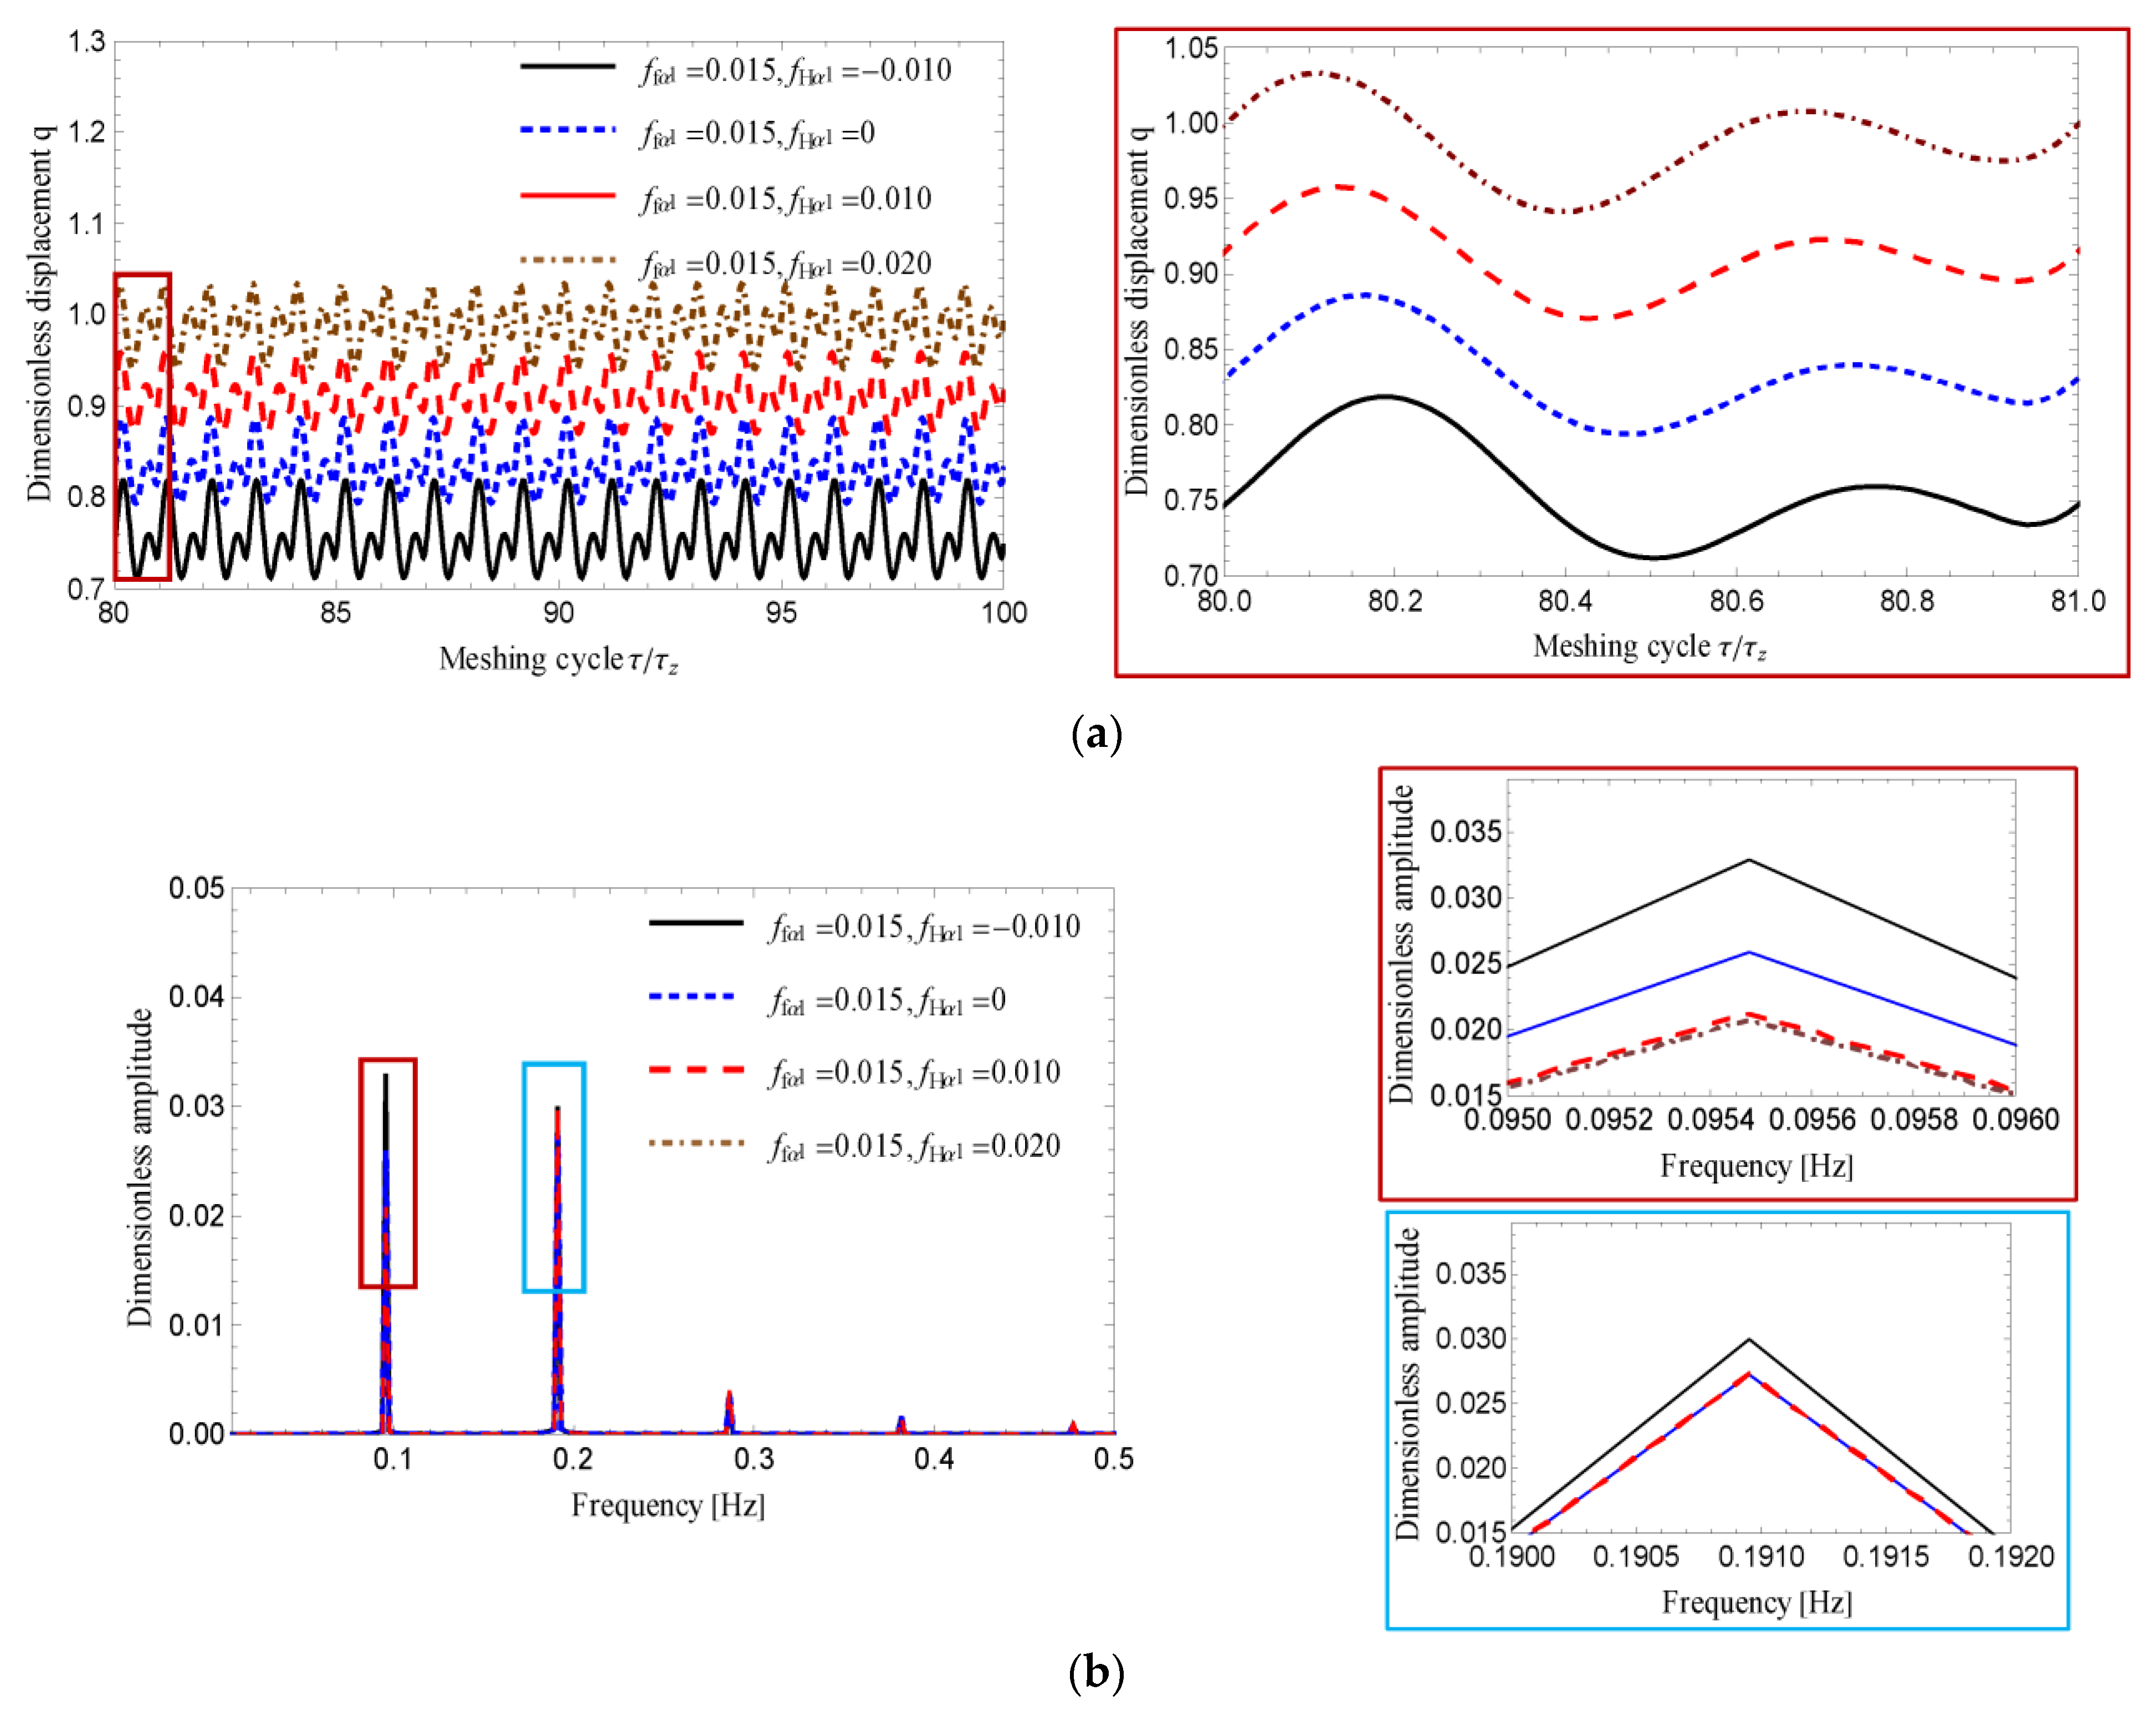
In order to analyze the influence of profile slope deviation on dynamic response and dynamic meshing force, we select f f α 1 = 0.015   mm and let f H α 1 be 0.010 , 0 , 0.01   mm and 0.020   mm ,   respectively. Similarly, after calculating the meshing error, the corresponding time history diagram and FFT spectrogram can be obtained when f H α 1 varies from 0.010 , 0 , 0.010 to 0.020   mm , as shown in Figure 14. We can see from Figure 14a that, when f H α 1 is different, the curve of displacement q with the meshing cycle will deviate to a certain extent, but the overall fluctuation trend of each curve is similar. In Figure 14b, as f H α 1 increases from 0.010 , 0 , 0.010 to 0.020   mm , the amplitude of the dominant frequency increases to some extent. However, when f H α 1 continues to increase, the amplitude of the dominant frequency does not increase significantly. It can be seen that the vibration and noise can be reduced by properly adjusting profile slope deviation.
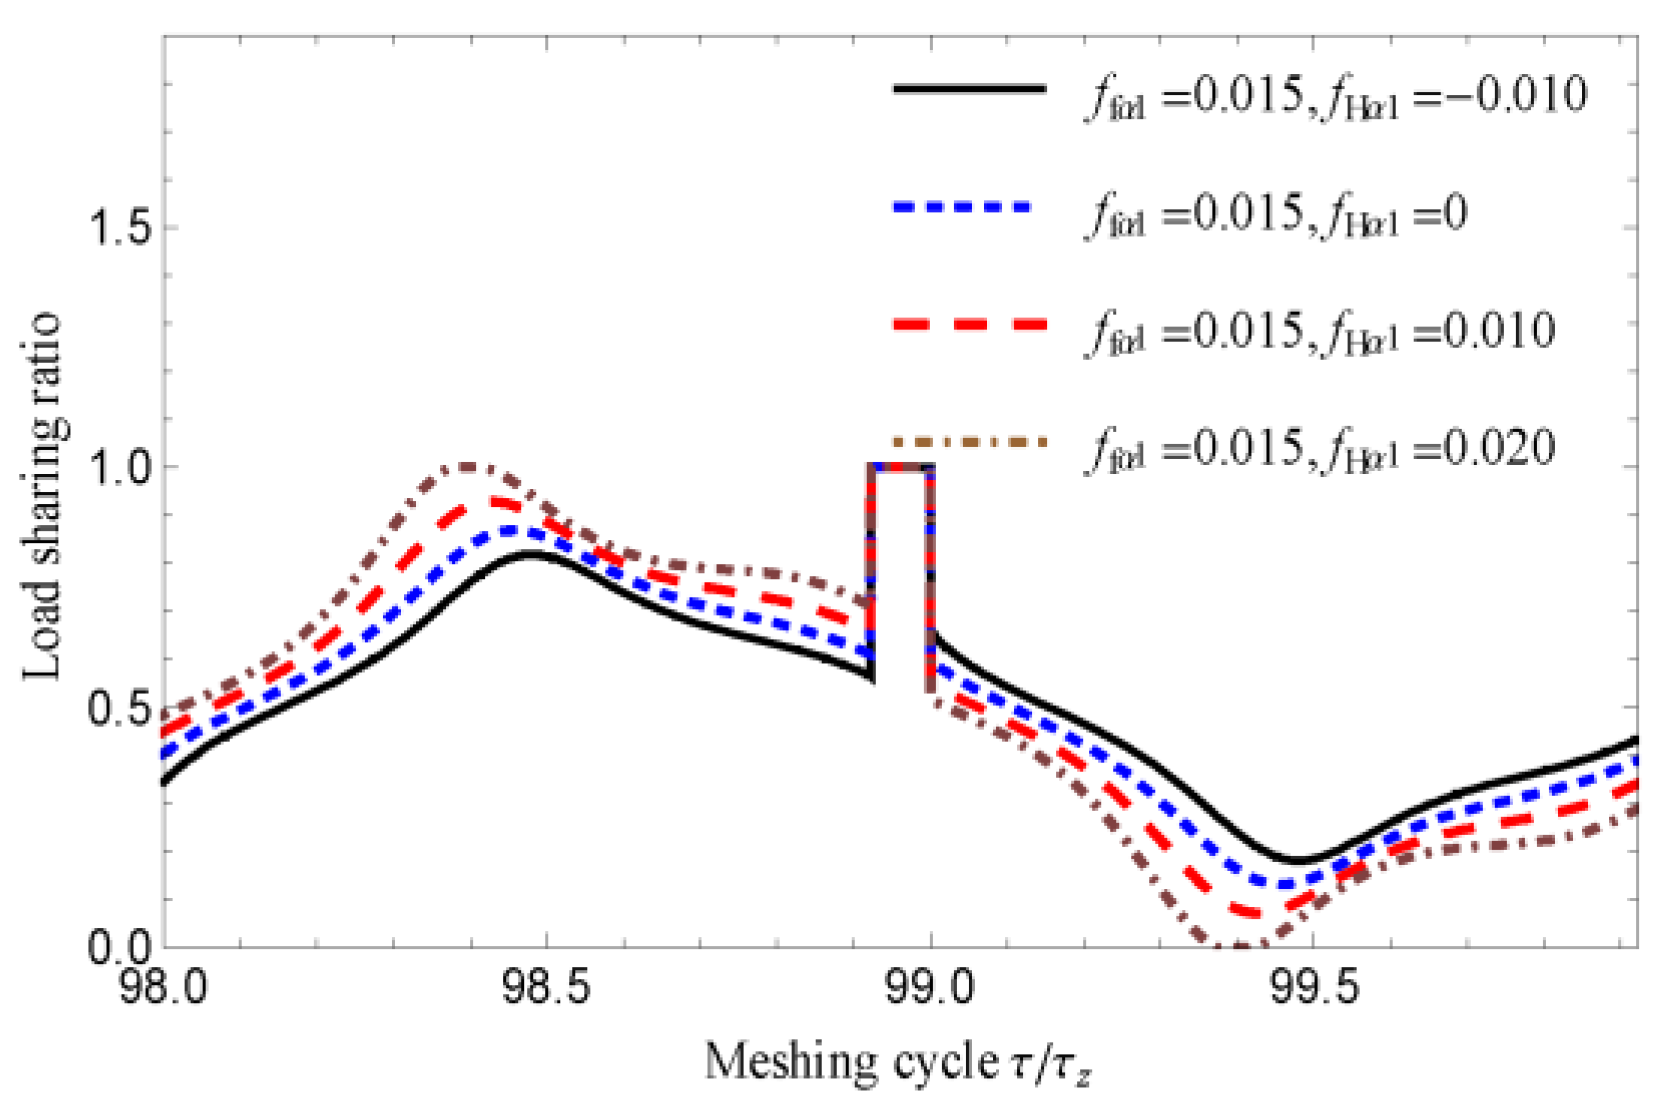
By bringing the solution results of the dynamic equation into the formula of the dynamic meshing force, the variation of the total dynamic meshing force and the single pair of teeth meshing force with the meshing cycle can be obtained when f H α 1 is equal to 0.010 ,   0 ,   0.010 ,   0.020   mm , respectively, as shown in Figure 15 and Figure 16. From Figure 15, we can observe that, with different f H α 1 , the total dynamic meshing force will be different due to the different meshing state of each pair of teeth. With the increase of f H α 1 from 0 to 0.010 , 0.020   mm , the fluctuation amplitude of the total dynamic meshing force increases accordingly, and the fluctuation curve gradually moves to the left. When f H α 1 changes from 0 to 0.010   mm , the amplitude of the total dynamic meshing force will also increase, but the fluctuation curve moves to the right. As can be seen from Figure 16, as f H α 1 increases from 0 to 0.010 ,   0.020   mm , the dynamic meshing force of a single pair of teeth increases in the front double-tooth meshing region and decreases in the rear double-tooth meshing region. Moreover, when f H α 1 = 0.020   mm , the dynamic meshing force of a single pair of teeth decreases to 0 near τ / τ z = 99.4 , that is, the pair of teeth are in the state of disengagement at this time. When f H α 1 changes from 0 to 0.010   mm , the single tooth dynamic meshing force gradually decreases, and increases in the rear double-tooth meshing region. However, when f H α 1 is equal to a different value, the fluctuations of the corresponding dynamic meshing force of a single pair of teeth are very similar. Figure 17 shows the curve of the load sharing ratio varying with the meshing cycle. In the whole double-tooth meshing region, especially in the meshing in and meshing out positions, the load sharing ratio curves under different f H α 1 have a certain offset, which is different from that reflected in Figure 13.
It can be seen that both the profile form deviation and the profile slope deviation will have a certain effect on the dynamic characteristics and dynamic meshing force, but their effects are different. Therefore, in order to accurately analyze the dynamic response and dynamic meshing force under different deviations, the characteristics of meshing errors caused by these deviations need to be considered.

4.2. Influence of Different Speeds on Dynamic Meshing Force

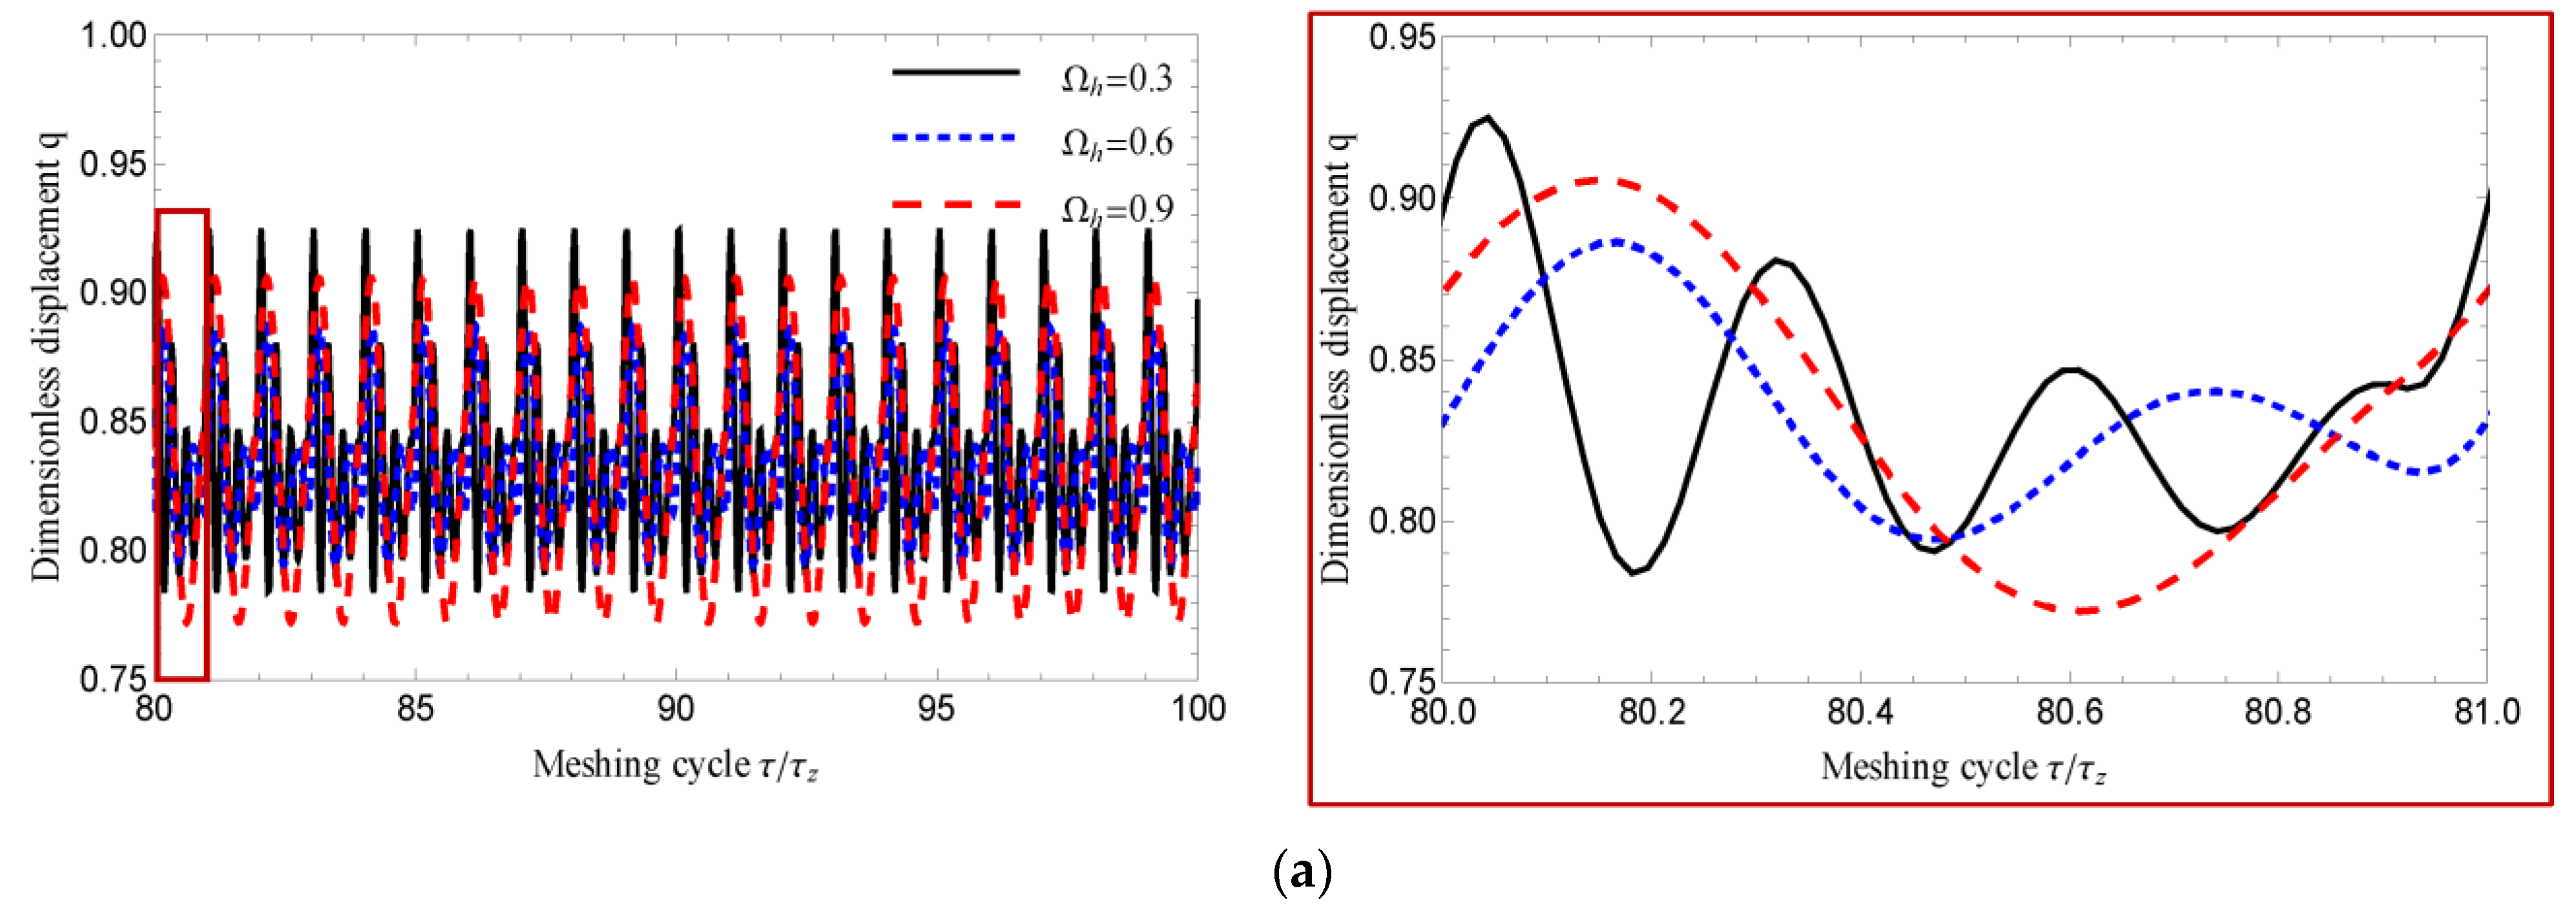
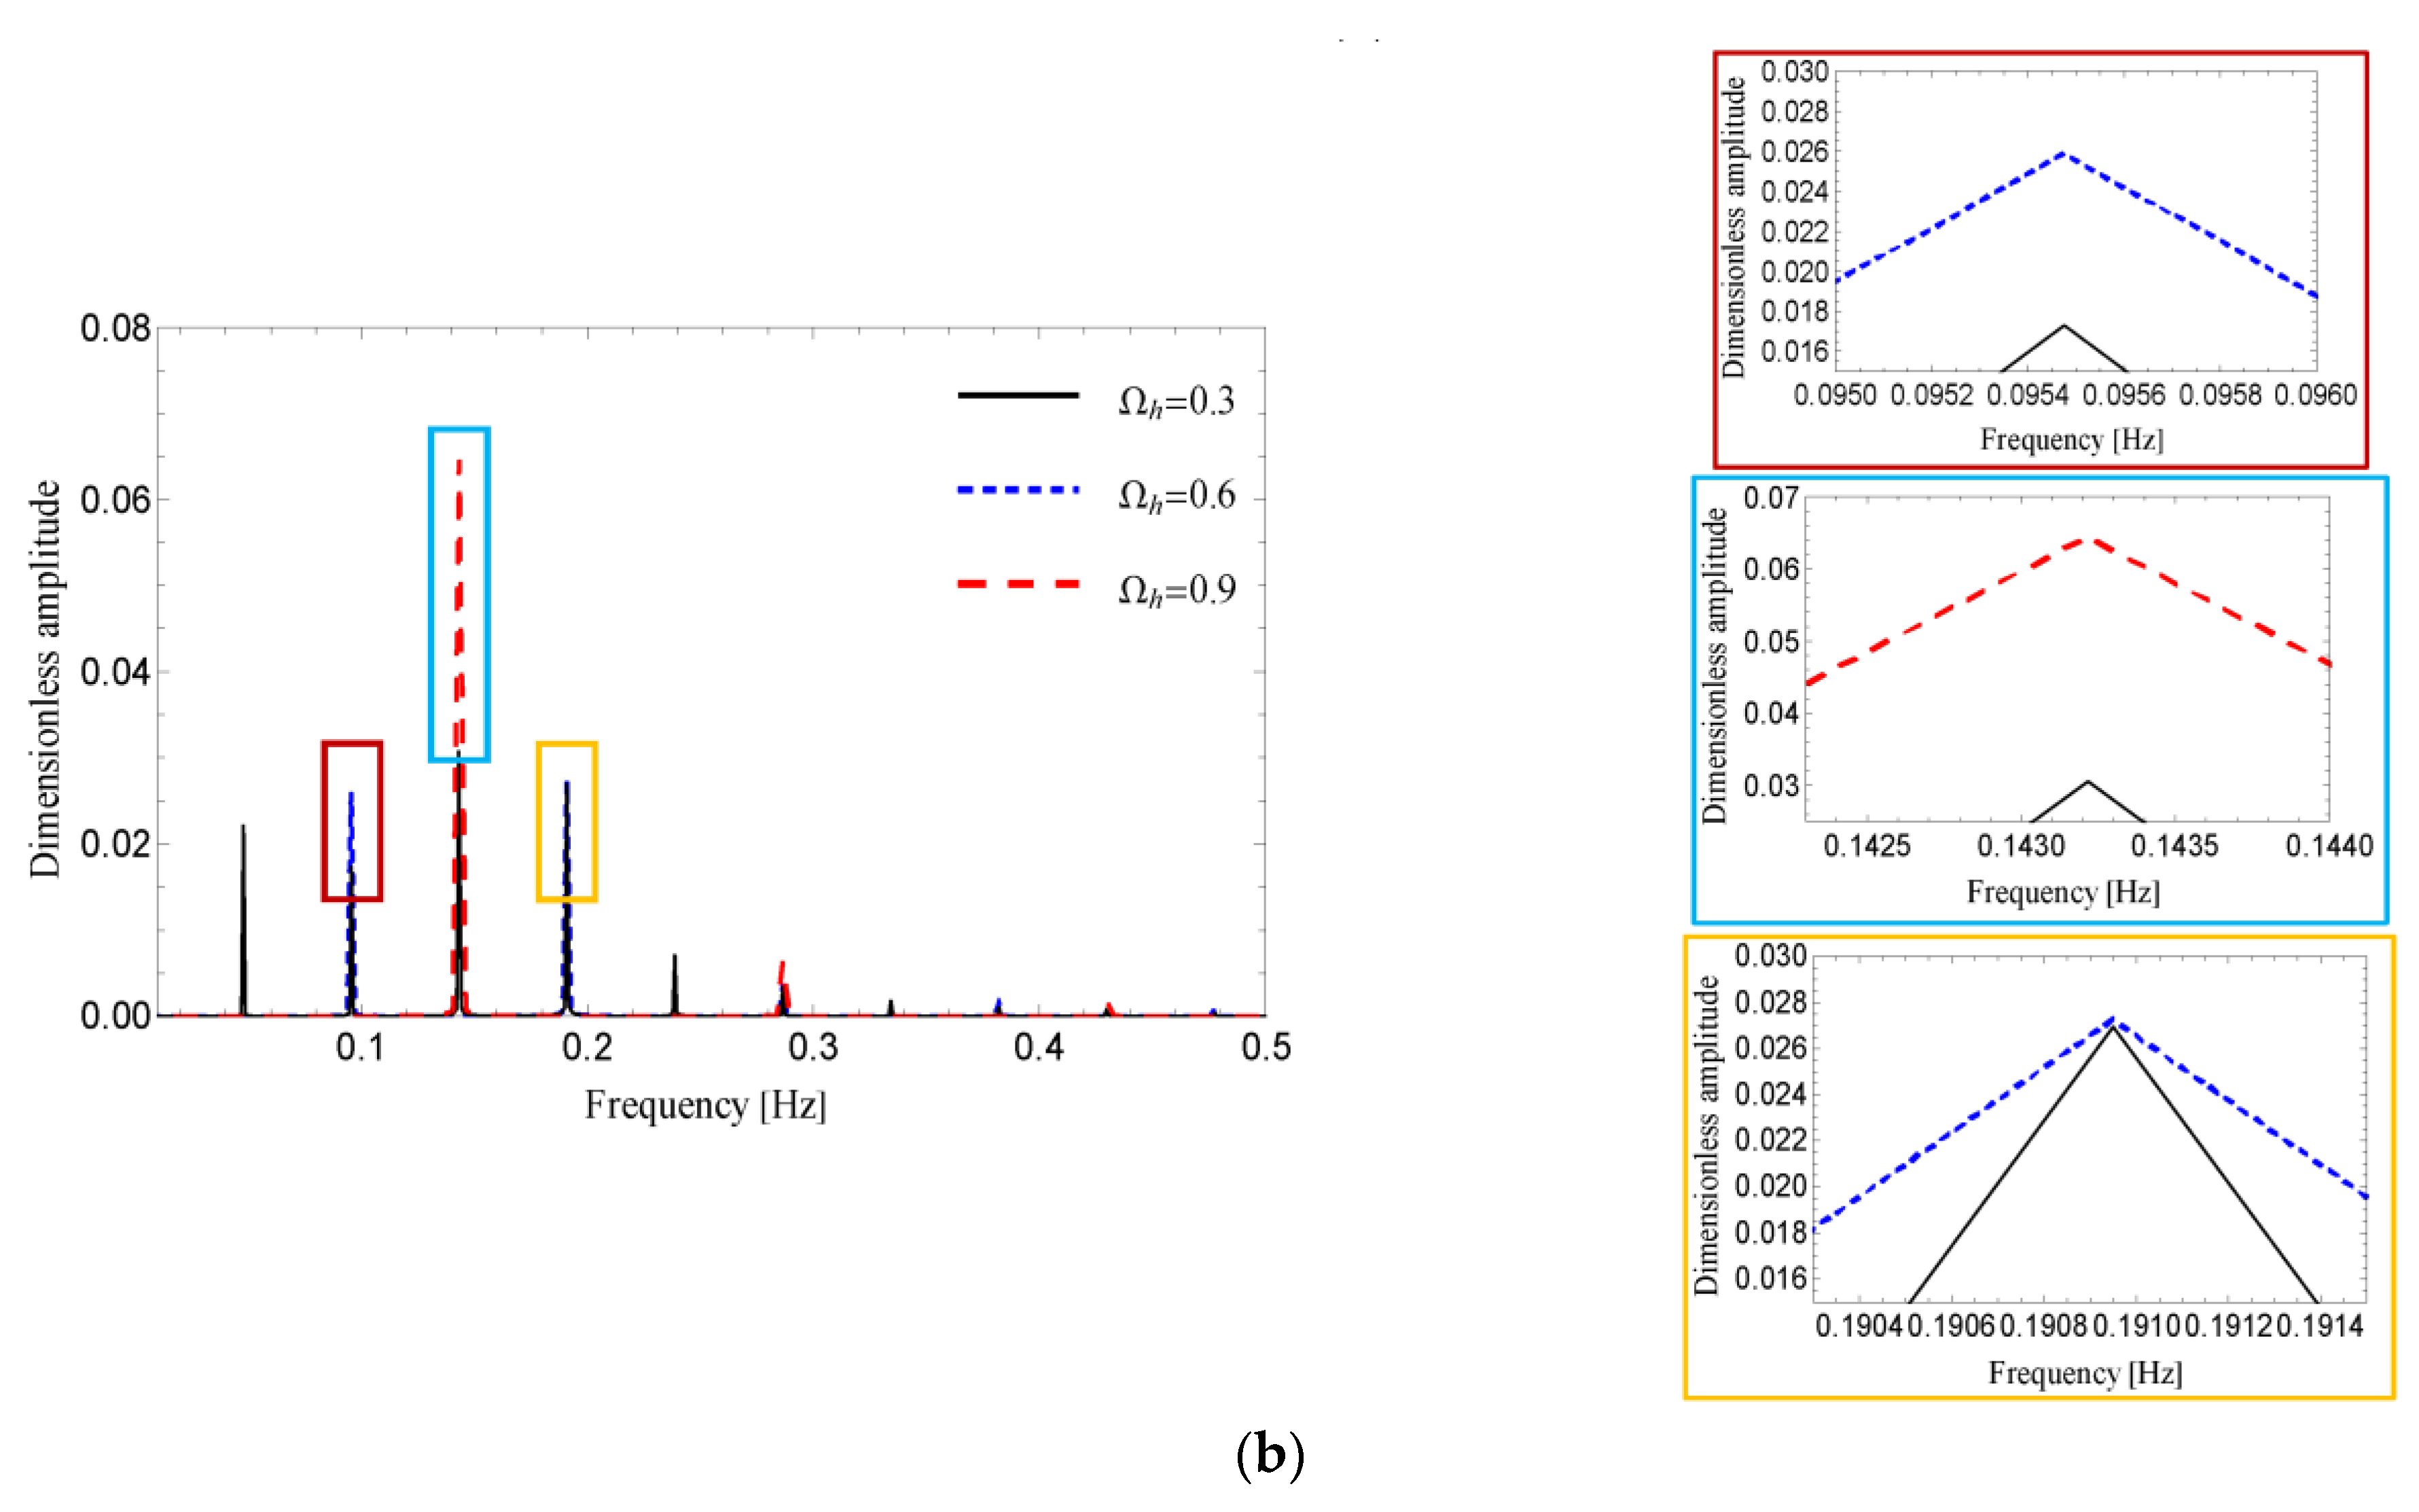
Let f f α 1 = 0.015   mm , ζ ¯ = 0.04 , T 1 = 500   N · m . Based on the calculated meshing errors, we can obtain the corresponding time history diagram and FFT spectrogram by solving the dynamic equation when Ω h is 0.3 ,   0.6 ,   0.9 , respectively, as shown in Figure 18. As can be seen from Figure 18a, as Ω h increases from 0.3 ,   0.6 to 0.9, the fluctuation amplitude of displacement q changes to a certain extent and its harmonic order gradually decreases. From Figure 18b, when Ω h = 0.3 the harmonic components are rich, mainly composed of the first four harmonics, because when the speed is low, the stiffness excitation is dominant, which will cause certain fluctuations in the process of alternating meshing of single and double teeth. When Ω h increases from 0.3 to 0.6, the amplitude of the first (fundamental harmonic) and second harmonics increases to a certain extent, but the amplitude of the other harmonics decreases, especially the amplitude of the third and fourth harmonics. When Ω h increases to 0.9, the amplitude of the first harmonic increases greatly, while the second harmonic decreases greatly (it should be noted that the frequency of the first harmonic changes due to the change of Ω h , as shown in Figure 18b), that is, at this time, the vibration and noise of the system is mainly determined by the amplitude of the first harmonic.
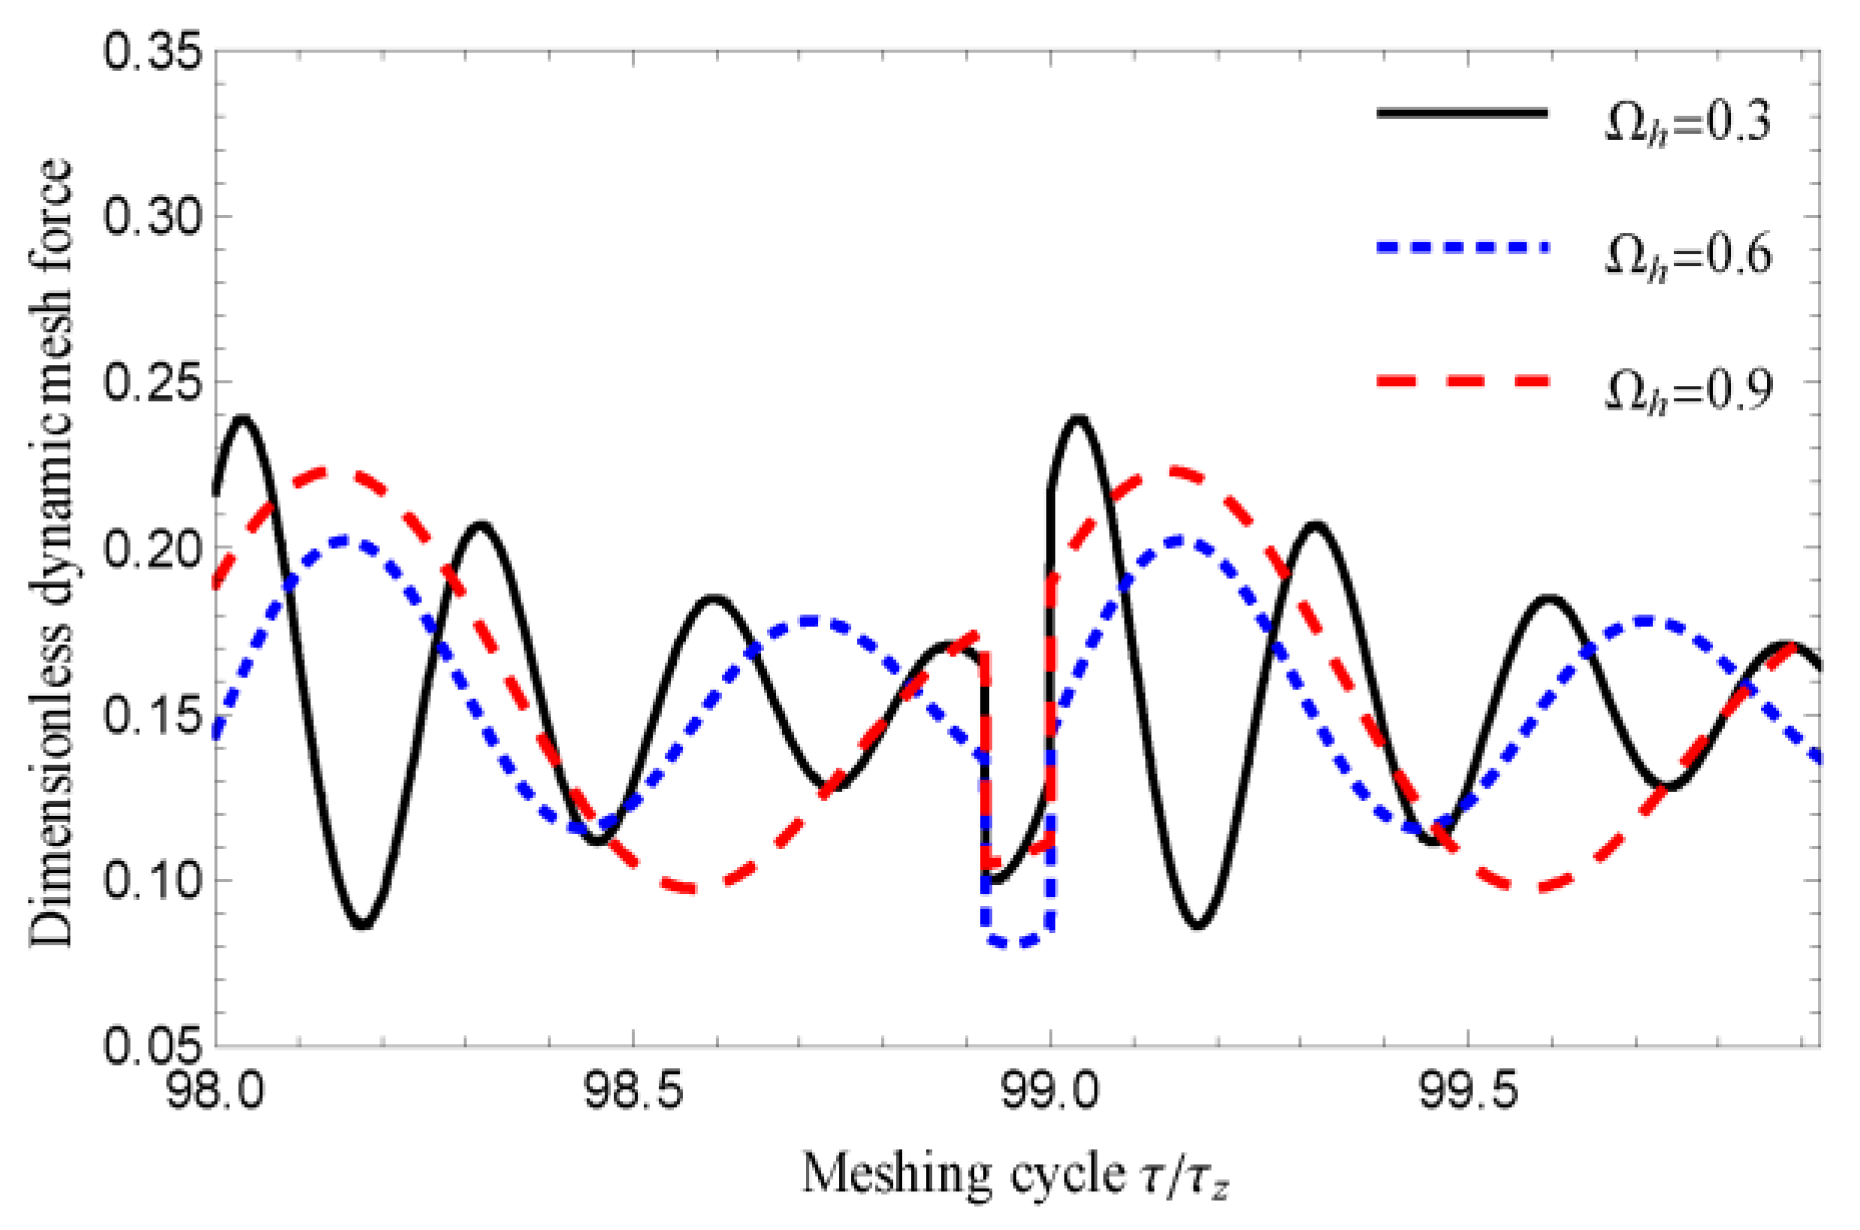
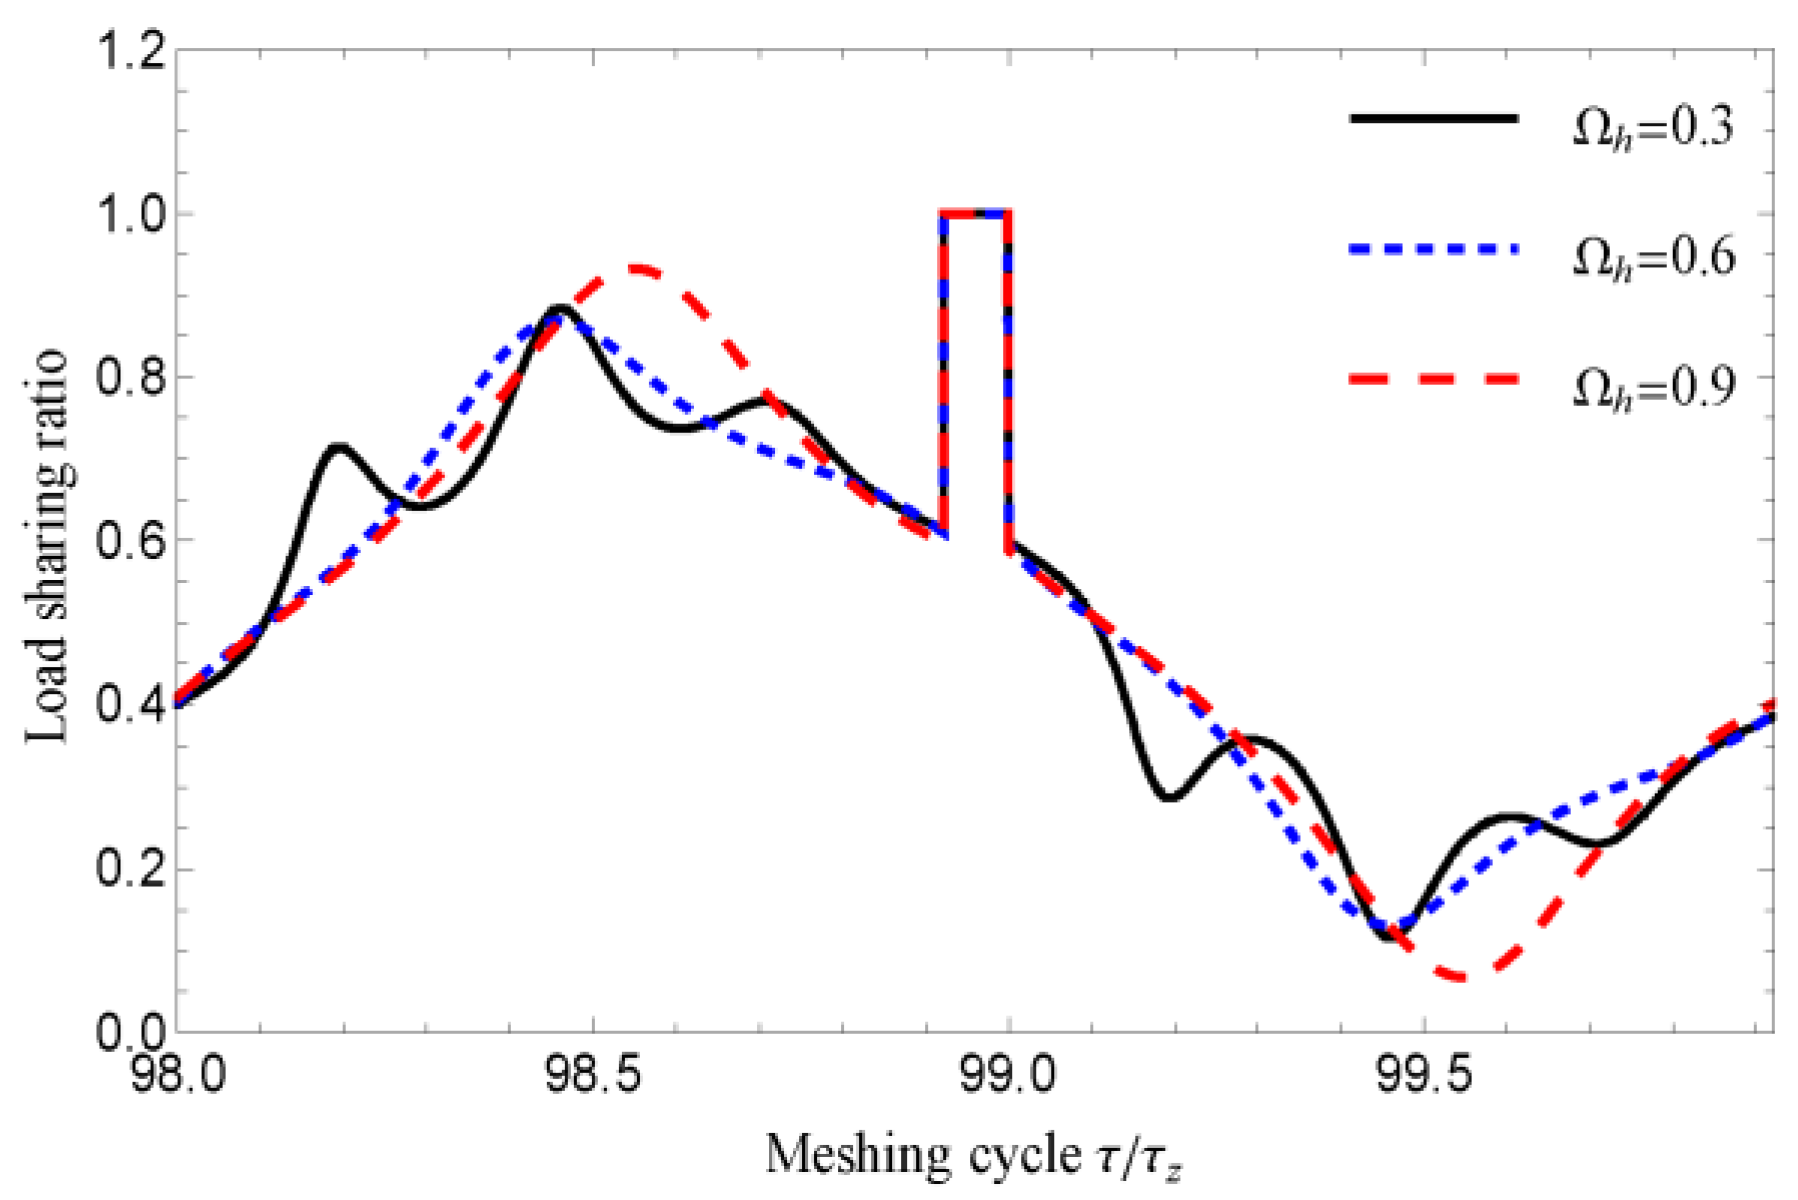
By bringing the solution results of the dynamic equation into the formula of the dynamic meshing force, the variation of the total dynamic meshing force and the single pair of teeth meshing force with the meshing cycle can be obtained when Ω h is equal to 0.3 , 0.6 , 0.9 , respectively, as shown in Figure 19 and Figure 20. We can see that, the corresponding fluctuation curves of the total dynamic meshing force and the single pair of teeth meshing force are different when Ω h equals a different value. With the increase of Ω h , the dynamic meshing force curve of a single pair of teeth will become more gentle, but its minimum value gradually approaches 0 near τ / τ z = 99.5 , which means that when the speed reaches a certain value, the teeth may disengage from meshing. Similarly, as can be seen from Figure 21, with the increase of Ω h , the fluctuation of the load sharing ratio curve of a single pair of teeth will become more gentle, but the maximum value of the load distribution ratio increases gradually close to one or the minimum value decreases gradually close to zero.

4.3. Influence of Different Loads on Dynamic Meshing Force

Let f f α 1 = 0.015   mm , ζ ¯ = 0.04 , Ω h = 0.6 . Based on the calculated meshing errors, we can obtain the corresponding time history diagram and FFT spectrogram by solving the dynamic equation when T 1 is 200 ,   500 ,   800   N · m , respectively, as shown in Figure 22. As can be seen from Figure 22a, when T 1 changes from 200 ,   500 to 800   N · m , the displacement curve shifts upward to a large extent and its waveform also changes, the fluctuation amplitude of which increases from 0.9 to 1.4 . In Figure 22b, when T 1 = 200   N · m , the system vibration is dominated by the first harmonic and the amplitude of the second harmonic is very small. As T 1 increases from 200 ,   500 to 800   N · m , the excitation effect of tooth stiffness gradually increases, the amplitude of the first harmonic decreases accordingly and the amplitude of the second harmonic will continue to increase. When T 1 equals 800   N · m , the amplitude of the second harmonic exceeds the amplitude of the first harmonic, that is, when the torque increases to a certain extent, the system vibration can be dominated by the second harmonic.
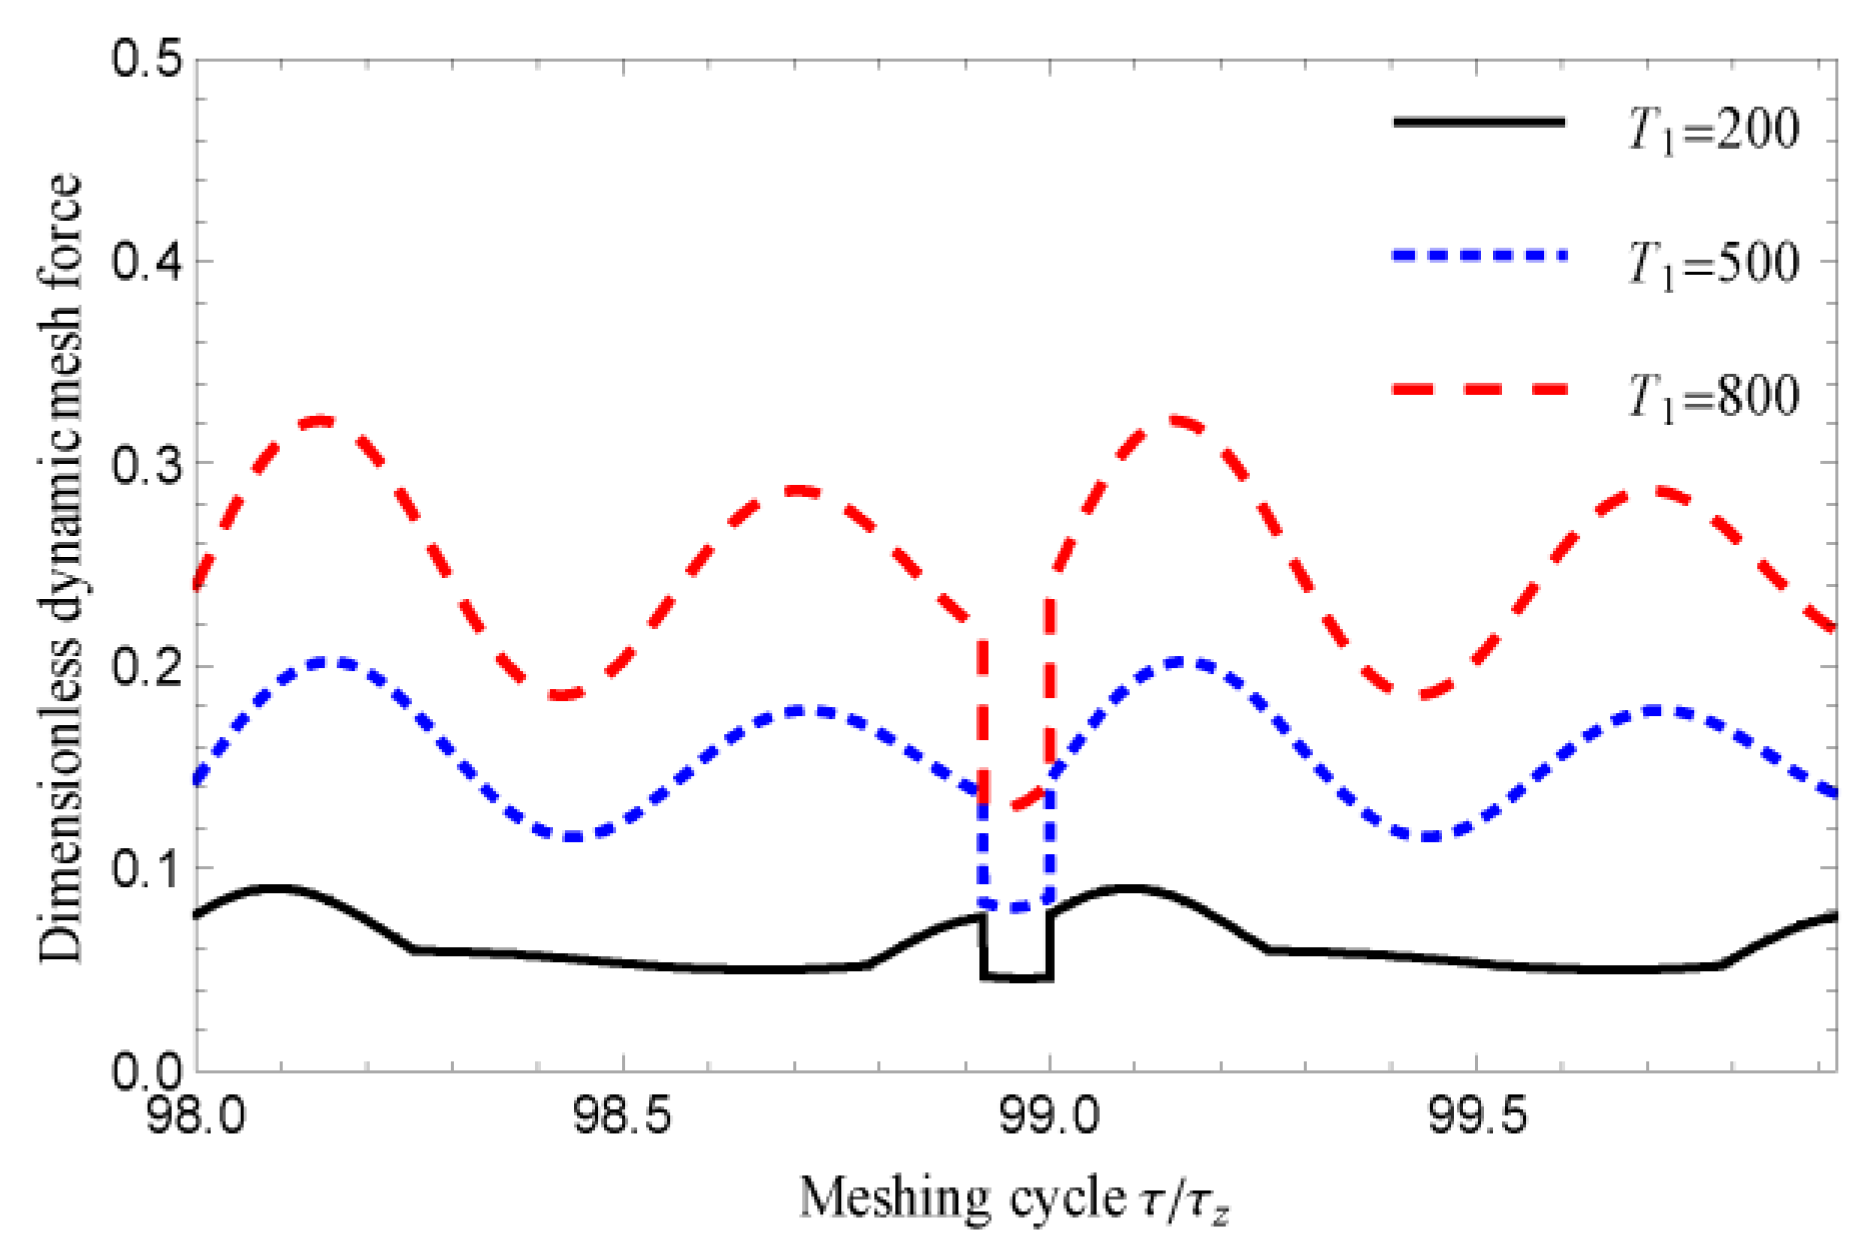
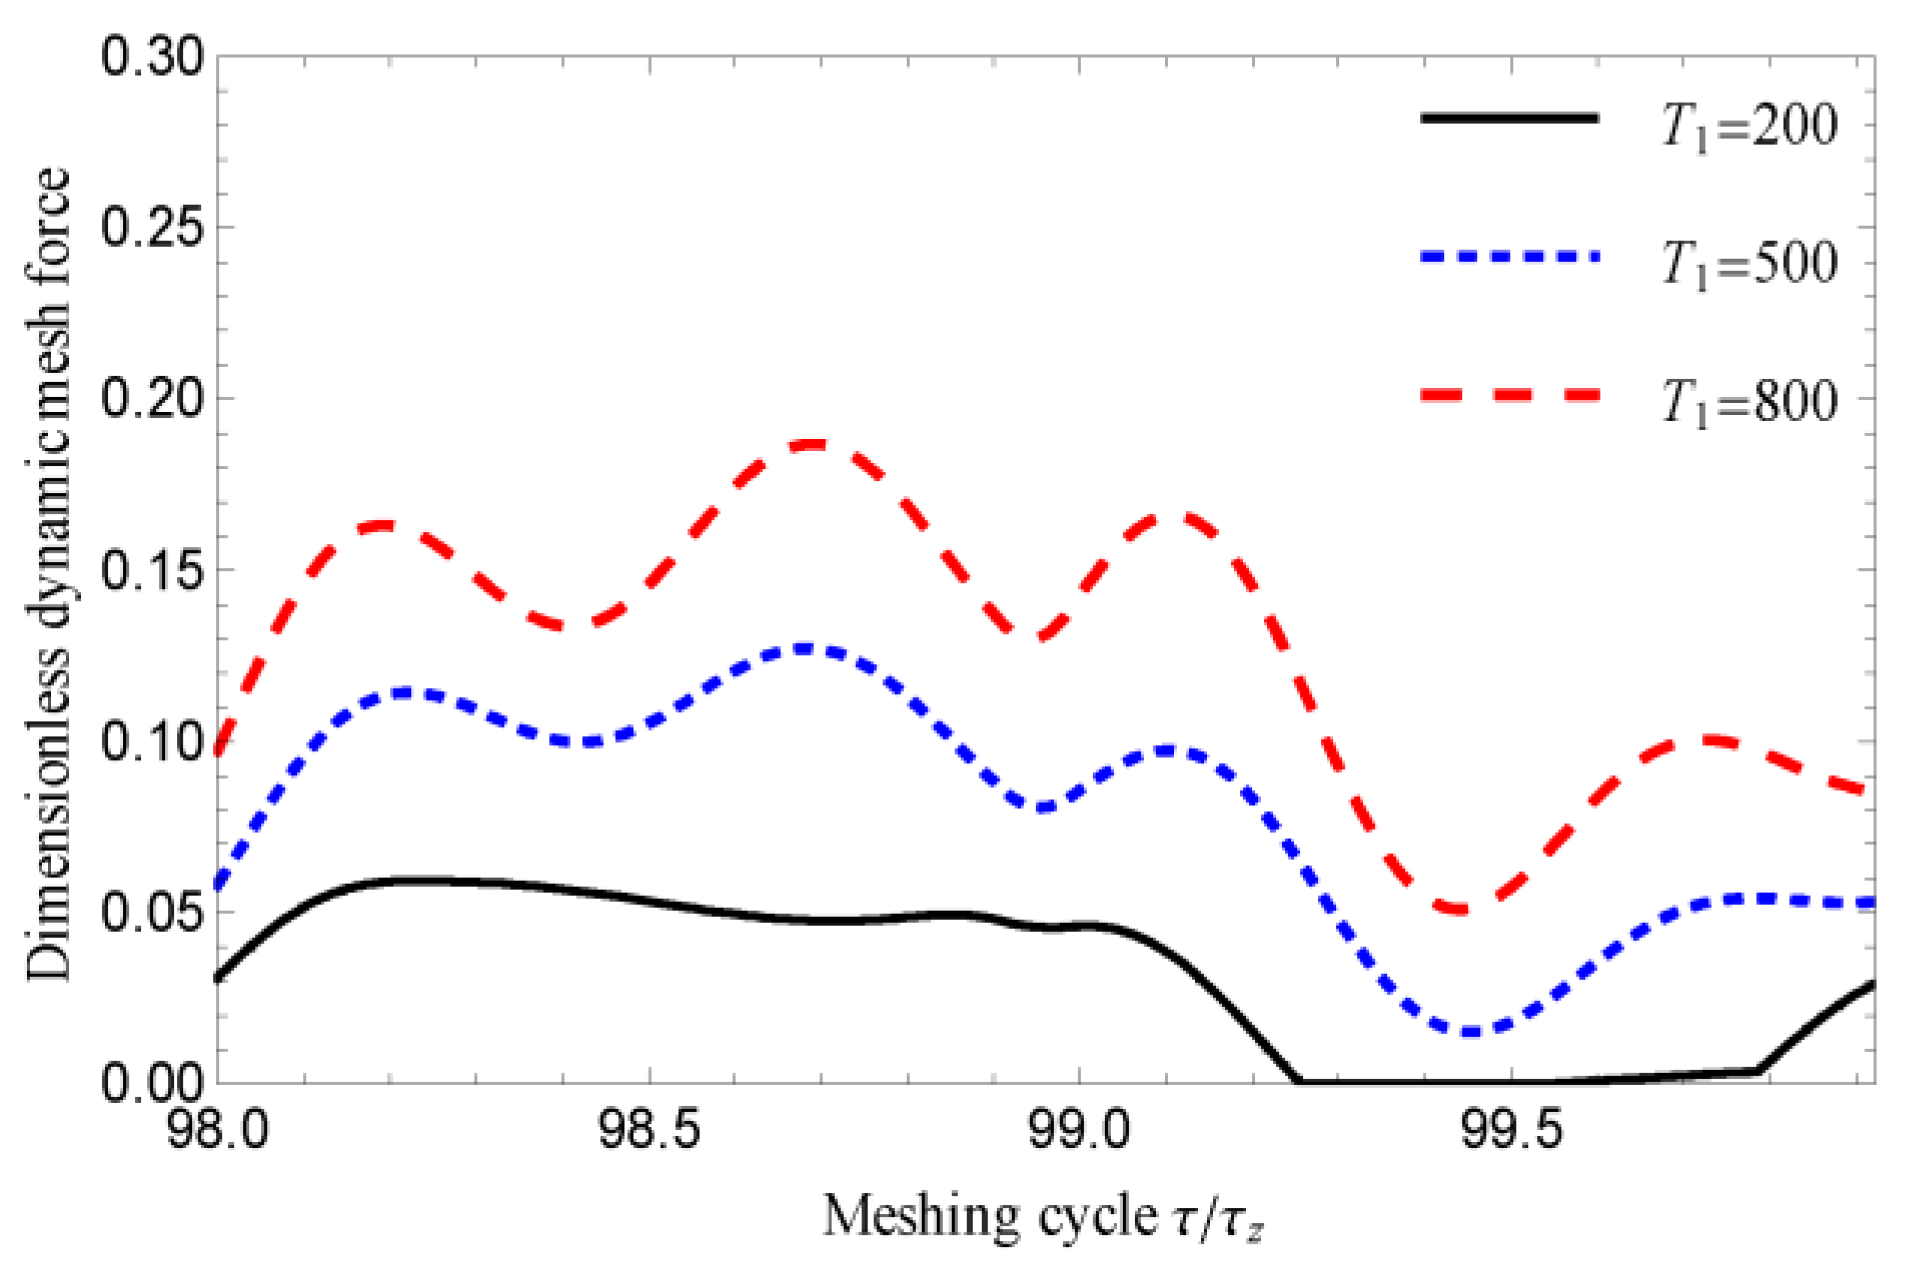
By bringing the solution results of the dynamic equation into the formula of the dynamic meshing force, the variation of the total dynamic meshing force and the single pair of teeth meshing force with the meshing cycle can be obtained when T 1 is equal to 200 ,   500 ,   800   N · m , respectively, as shown in Figure 23 and Figure 24. With the increase of T 1 , the amplitude and average value of the total dynamic meshing force and the single pair of teeth meshing force both increase significantly. We can also see from Figure 24 that, due to small load, the gear teeth begin to disengage near τ / τ z = 99.4 when T 1 = 200   N · m . Figure 25 shows that, with the increase of T 1 , the load sharing ratio curve gradually becomes flat, the amplitude of which gradually decreases, and the load distribution ratio curve during the whole meshing cycle will gradually become symmetrical. This means that the influence of the tooth profile deviation will gradually decrease and the load distribution on the teeth pair will gradually stabilize with T 1 increasing.

4.4. Influence of Different Damping Ratios on Dynamic Meshing Force

Let f f α 1 = 0.015   mm ,   T 1 = 500   N · m ,   Ω h = 0.6 . Based on the calculated meshing errors, we can obtain the corresponding time history diagram and FFT spectrogram by solving the dynamic equation when ζ ¯ is 0.01 ,   0.04 ,   0.07 , respectively, as shown in Figure 26. As can be seen from Figure 26a, with ζ ¯ changing from 0.01 ,   0.04 to 0.07, the fluctuation amplitude of displacement q gradually decreases. It is mainly due to the decrease of the amplitude of the second harmonic, which can be more clearly shown in Figure 26b. With ζ ¯ varying from 0.01 to 0.07, the amplitude of the first harmonic increases by 0.001, while the amplitude of the second harmonic decreases by 0.007.
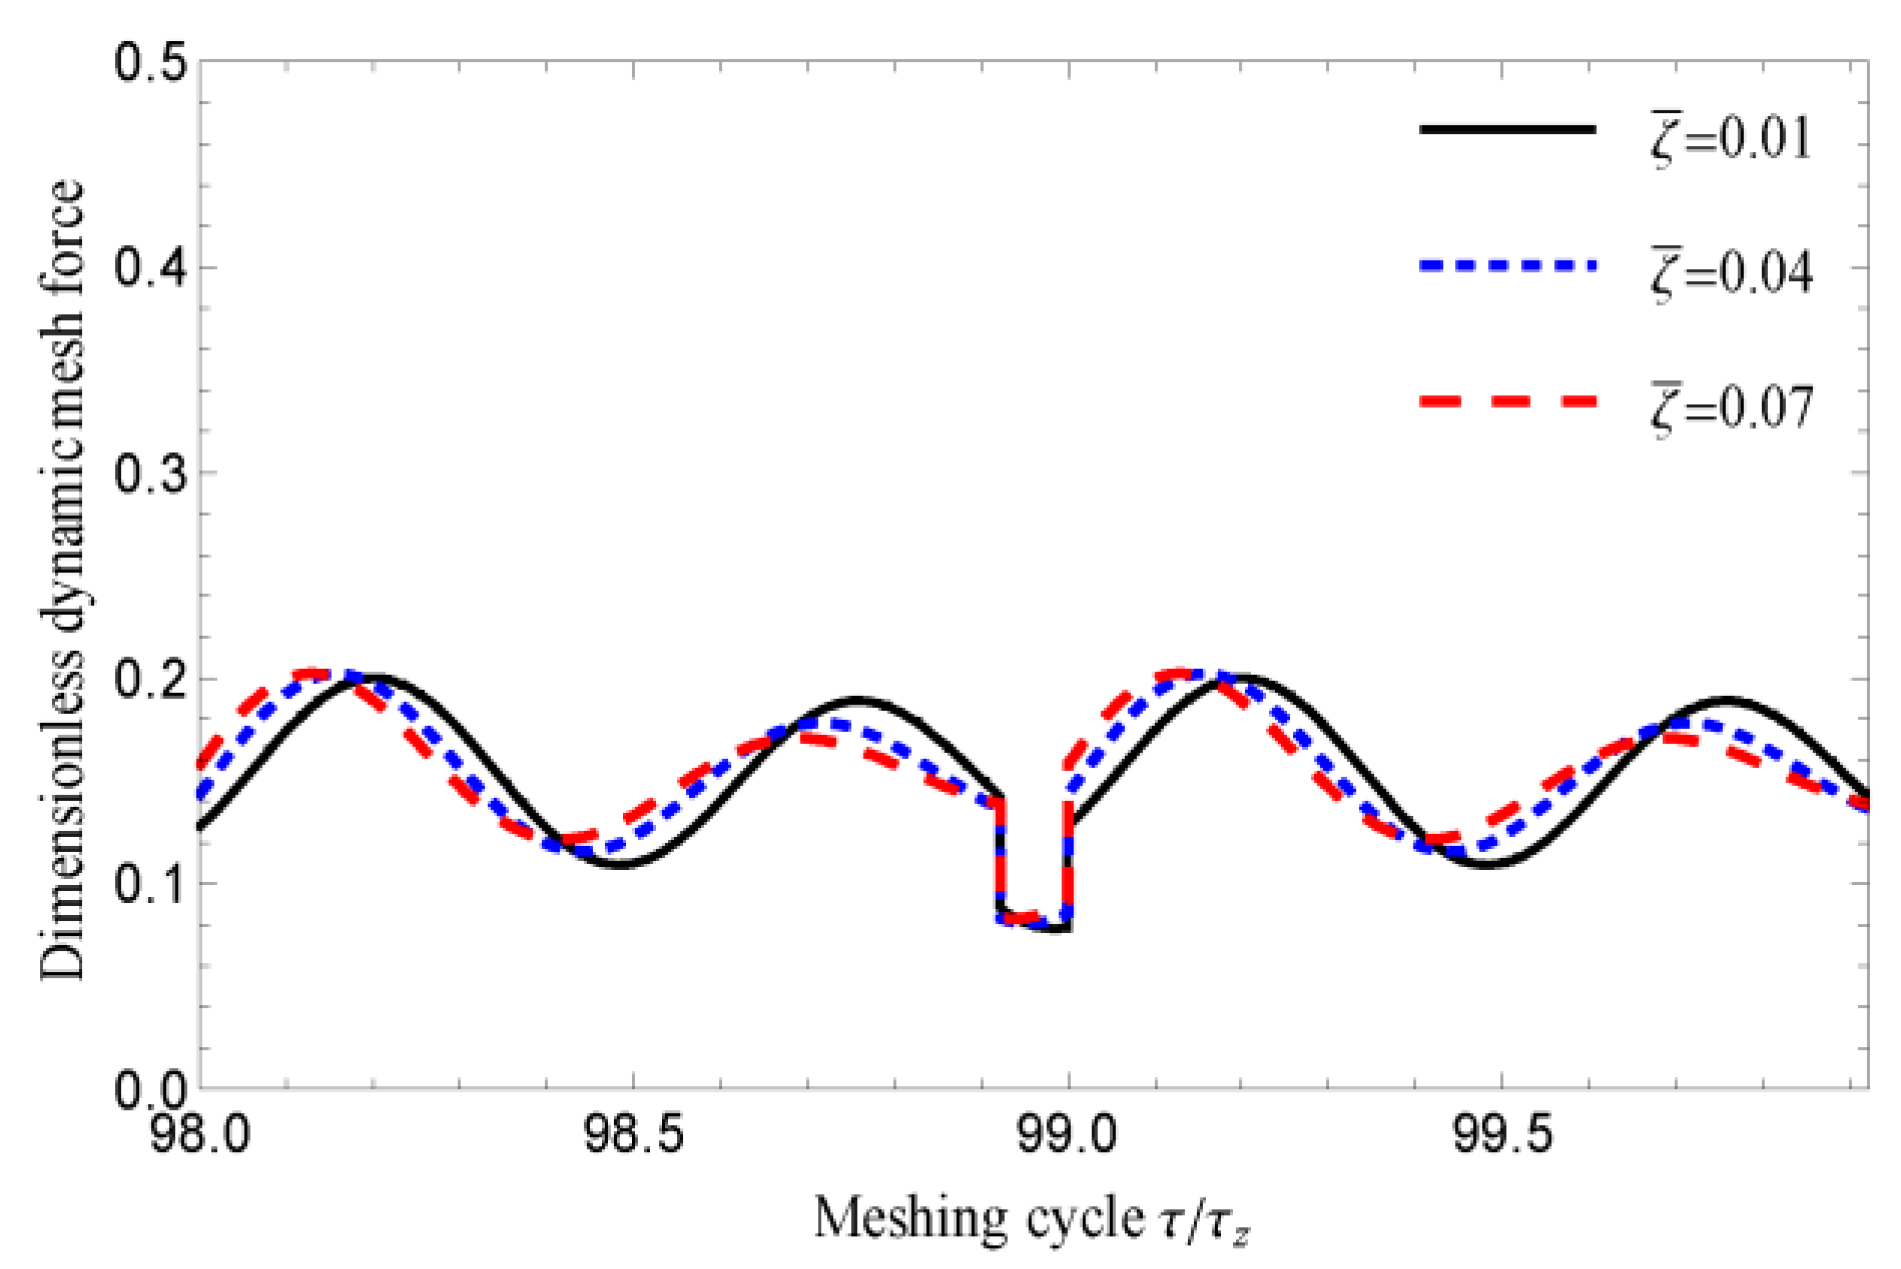
By bringing the solution results of the dynamic equation into the formula of the dynamic meshing force, the variation of the total dynamic meshing force and the single pair of teeth meshing force with the meshing cycle can be obtained when ζ ¯ is equal to 0.01 ,   0.04 ,   0.07 , respectively, as shown in Figure 27 and Figure 28. As ζ ¯ changes from 0.01 ,   0.04 to 0.07 , the amplitude of the total dynamic meshing force and the single pair of teeth meshing force gradually decreases. Figure 29 shows that, with the increase of ζ ¯ , the load sharing ratio curve gradually becomes flat and its amplitude gradually decreases. However, the magnitudes of these changes are relatively small.
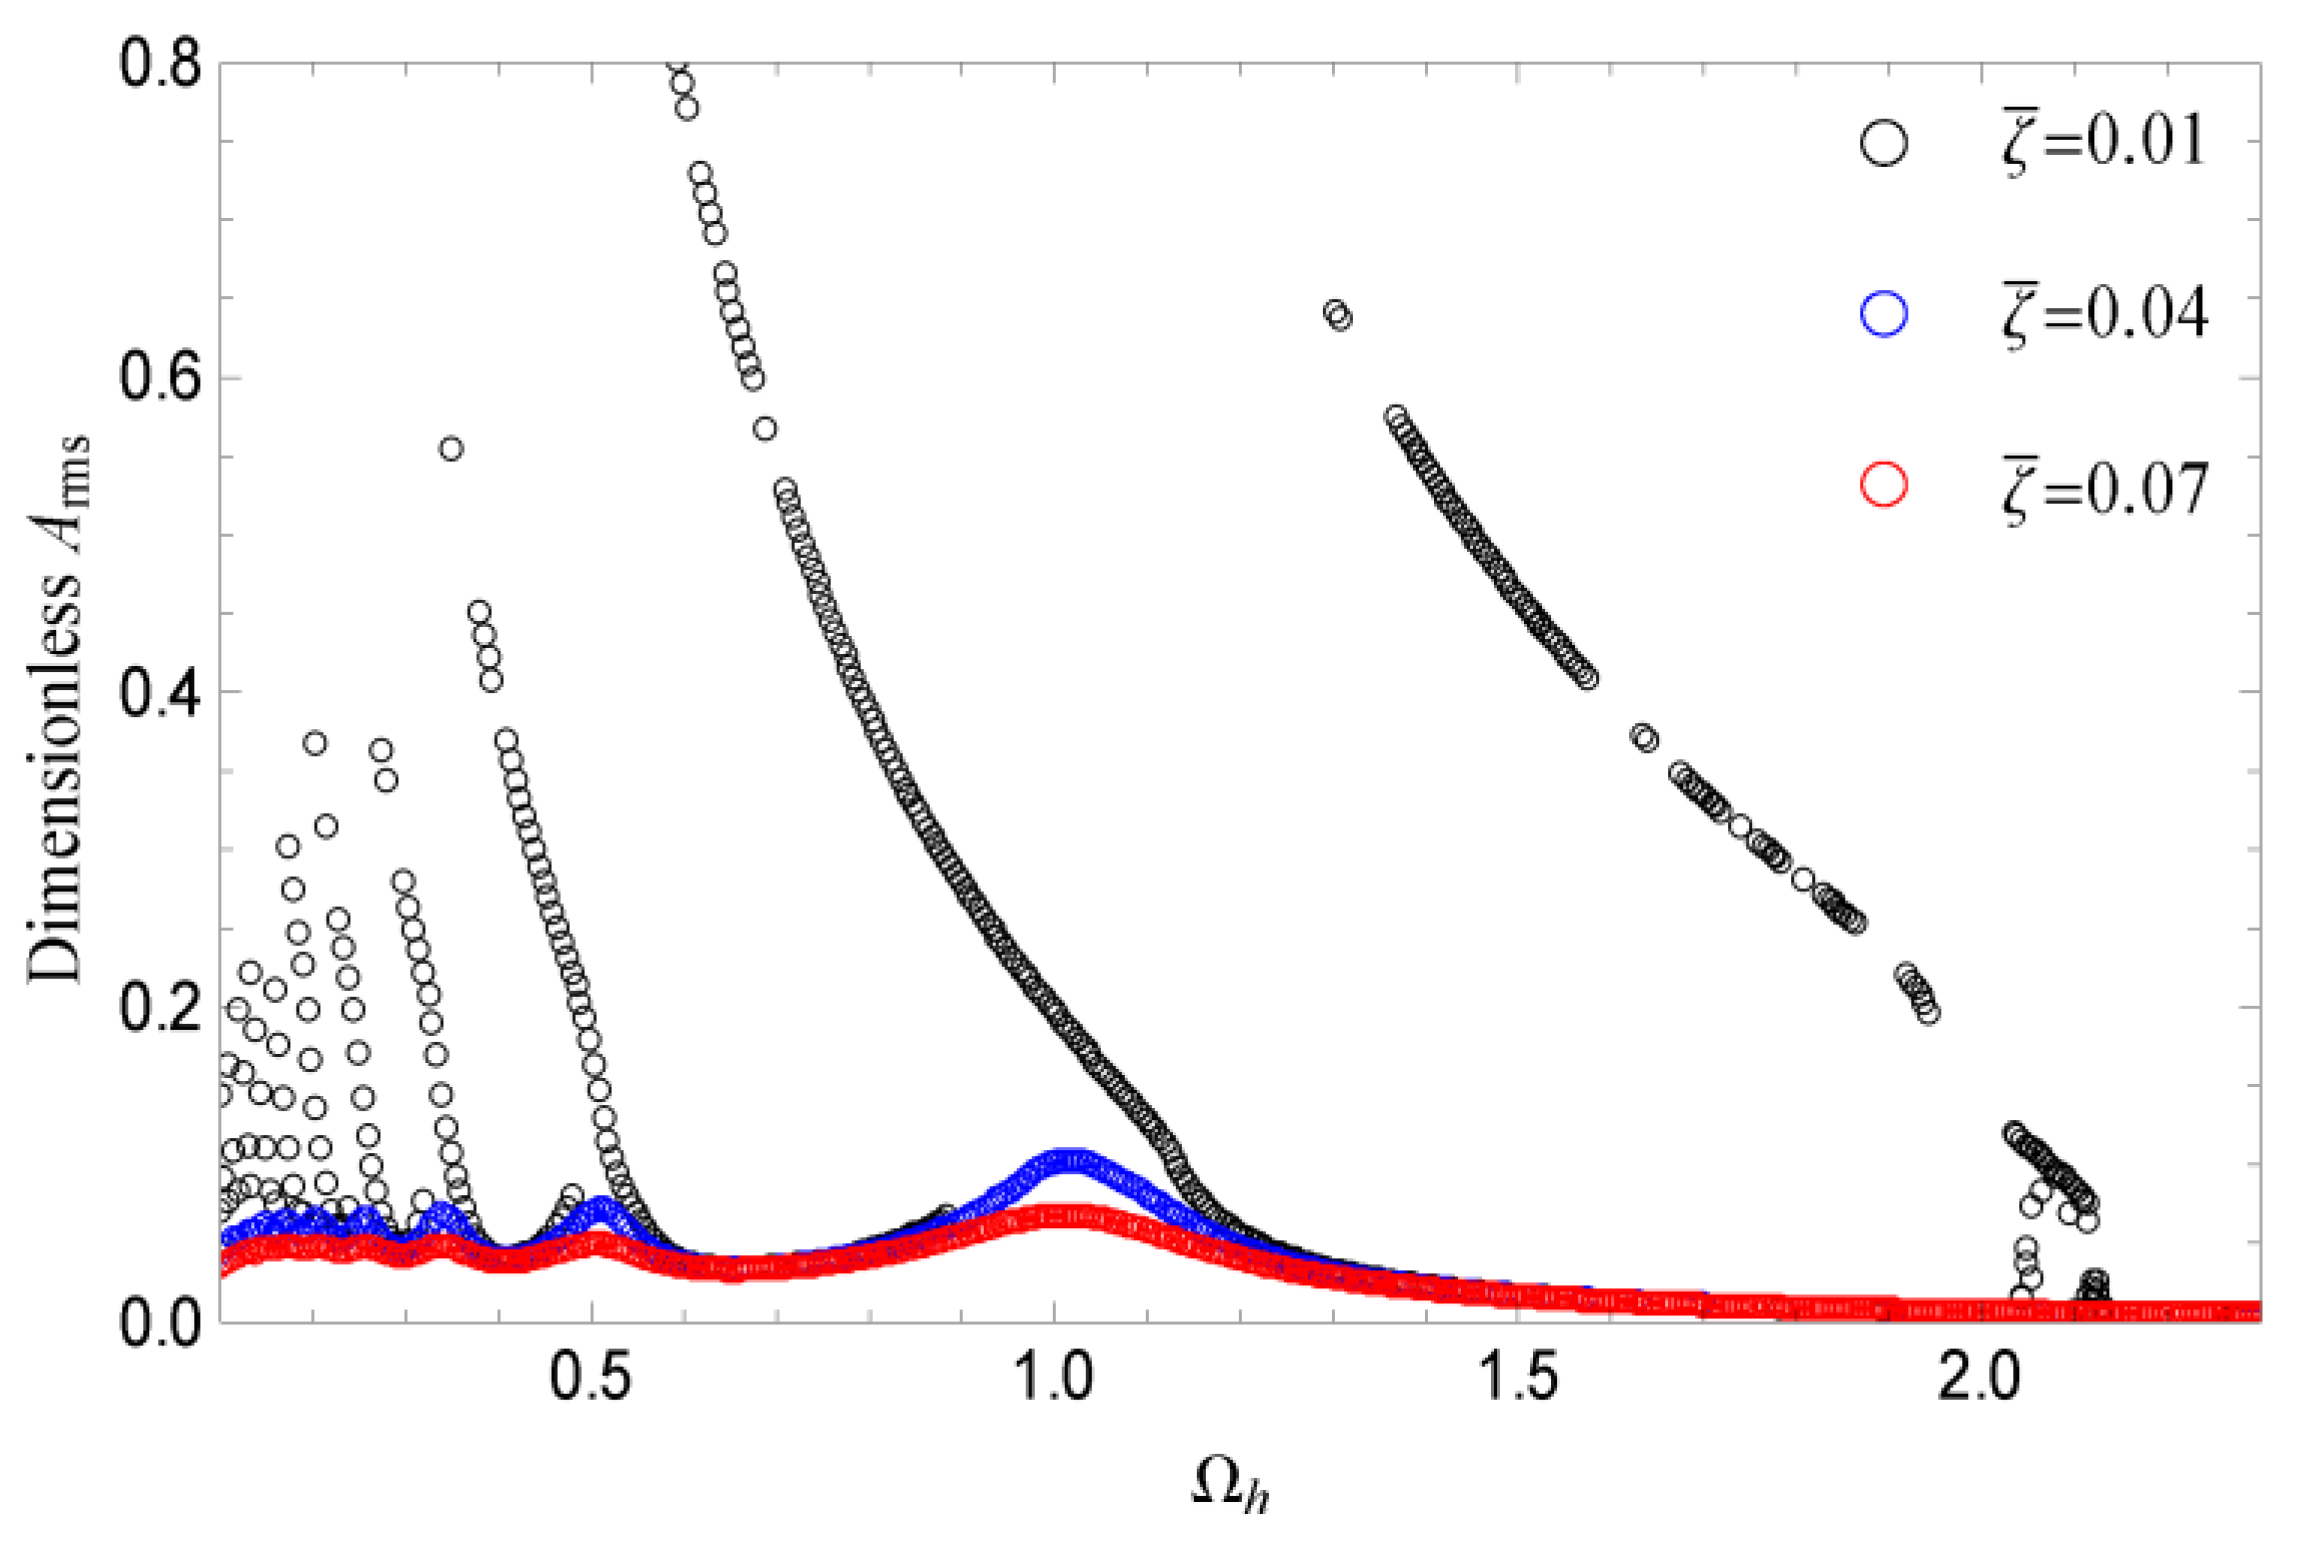
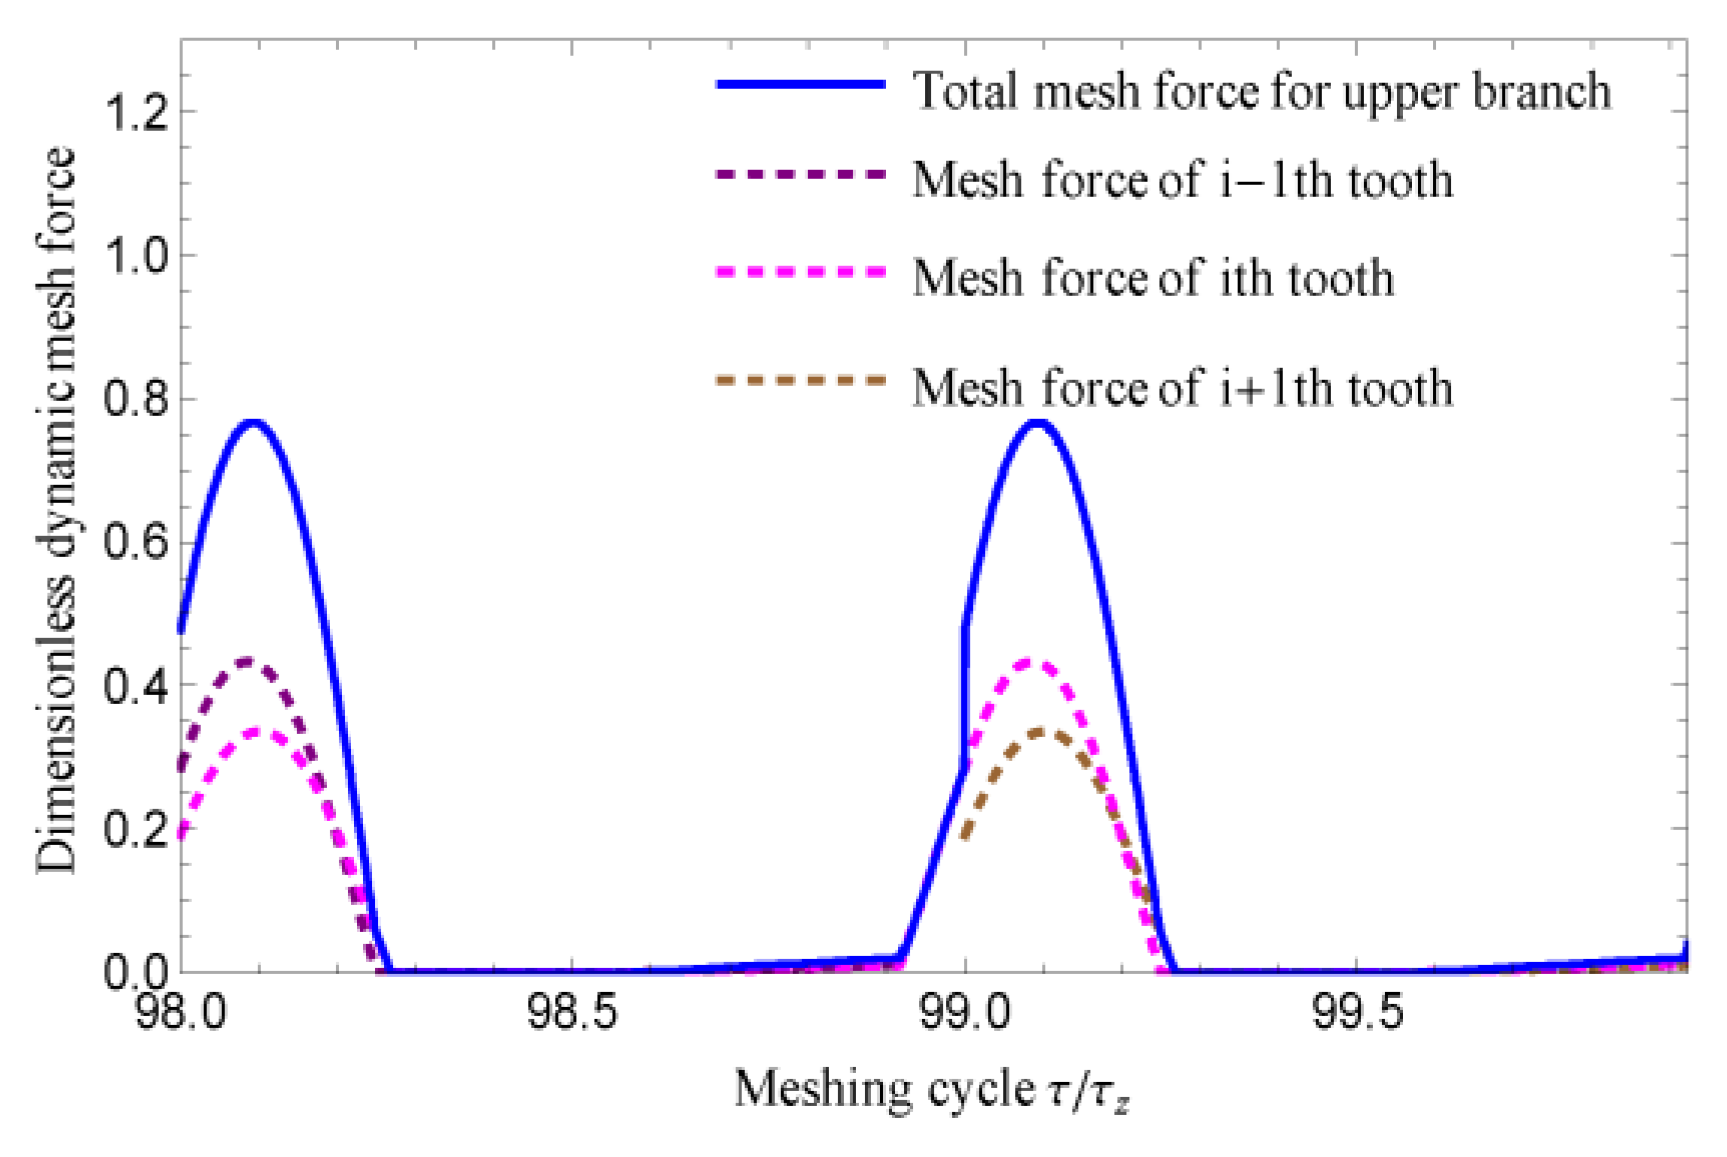
From the above analysis, it can be seen that ζ ¯ has little effect on the dynamic meshing force. However, appropriately increasing ζ ¯ will help to reduce the vibration of the system and improve the stability of the system. Figure 30 shows the simulation results of A r m s varying with Ω h when ζ ¯ is 0.01 ,   0.04 and 0.07 , respectively. We can observe that, as ζ ¯ changes from 0.01 ,   0.04 to 0.07 , the amplitude of A r m s at the same decreases gradually, that is, the system becomes more and more stable. However, compared with the case of ζ ¯ = 0.04 and ζ ¯ = 0.07 , there are abundant jumping phenomena and the amplitude of A r m s at the resonance frequency is much larger when ζ ¯ = 0.01 . Due to the jumping phenomena, there are two branches at the resonance frequency, which means that there are two values at the same Ω h due to the different initial conditions. As described above, Figure 27 and Figure 28 show the total dynamic response and the single pair of teeth dynamic meshing force at the lower branch when Ω h = 0.6 , respectively. Accordingly, the dynamic response and the total dynamic meshing force at the upper branch can also be obtained when Ω h = 0.6 , as shown in Figure 31 and Figure 32, respectively. Comparing Figure 26 and Figure 27, we can see that the amplitude of dynamic transmission error in Figure 31 and the total dynamic meshing force in Figure 32 have increased sharply. Moreover, the shape of the total dynamic meshing force curve has also changed greatly in the whole meshing process, especially in some meshing regions, where the dynamic meshing force is reduced to zero (i.e., contact loss). It can be seen from the above analysis, when ζ ¯ is too small, the system will become unstable, which may lead to increased vibration and a sharp increase in dynamic meshing force.
Based on the above analysis, the effects of different parameters on the dynamic response and dynamic meshing force of the gear system can be summarized that with the increase of f f α 1 , the vibration amplitude of the system will gradually increase. Moreover, when f f α 1 is large, the change of vibration amplitude will be more obvious. Compared with f f α 1 , the change of f H α 1 has little effect on the dynamic response of the system, but the corresponding dynamic response of the system is still quite different when f H α 1 is positive and negative, respectively. In addition, f f α 1 and f H α 1 have different effects on the dynamic meshing force and load distribution coefficient, but when f f α 1 and f H α 1 change to a certain value, the gear teeth will both be out of meshing. When Ω h is small, due to the effect of stiffness excitation, there are some fluctuations in dynamic transmission error and dynamic meshing force. With the increase of Ω h , the amplitude of the first harmonic increases and gradually dominates, while the fluctuation of dynamic meshing force and load sharing ratio becomes more gentle and their amplitudes increase to a certain extent. When T 1 is too small, the teeth may disengage during meshing. With the increase of T 1 , the amplitude of dynamic transmission error gradually increases and the second harmonic gradually dominates. Accordingly, the dynamic meshing force will increase accordingly, and the fluctuation level of the load distribution coefficient will gradually reduce with the decrease of the influence of the tooth profile deviation. The damping ratio has little effect on the dynamic transmission error and dynamic meshing force. With the increase of damping, the amplitude of dynamic transmission error and dynamic meshing force decrease to a certain extent. Accordingly, the fluctuation of the load sharing ratio also becomes smooth. However, when ζ ¯ is too small, the system will become unstable, which may lead to increased vibration and a sharp increase on the dynamic meshing force.

5. Conclusions

This paper puts forward a calculation method of the dynamic meshing force of a single pair of gear teeth by constructing the nonlinear dynamic model of spur gear pair considering the meshing state of multiple pairs of teeth based on the actual meshing characteristics of gear teeth. The new method can be used to effectively calculate the dynamic meshing force and load sharing ratio of each pair of teeth with different meshing characteristics, especially various tooth surface characteristics and deviations.
Considering the tooth profile deviation, based on the established dynamic model and the calculation formula of dynamic meshing force, the effects of different parameters on the dynamic response and the dynamic meshing force of the system are analyzed. The results show that these parameters all have effects on the dynamic characteristics and dynamic meshing force, but their effects are different. Therefore, in order to accurately analyze the dynamic response and dynamic meshing force under different meshing conditions, especially the dynamic meshing force of a single pair of teeth, the influence of these parameters needs to be fully considered, which is very important to predict the load capacity and carry out the parameter optimization for gear system. In addition, the method presented in this paper also lays a foundation for analyzing and predicting the dynamic behavior or the load capacity of HCR gears. In this paper, only the influences of tooth profile deviations on the dynamic response and dynamic meshing force of gear system are discussed. Considering that HCR gears are more sensitive to the tooth meshing state, the influence of more tooth surface and deviation parameters, such as tooth profile modification, pitch deviation, installation deviation, etc., on the dynamic response and dynamic meshing force of HCR gears will be studied, which is also the focus of our next work.

Author Contributions

Conceptualization, R.X. and J.Z.; methodology, J.W.; software, R.X., R.L. and Z.W.; validation, L.X. and Z.W.; writing—original draft preparation, R.X.; writing—review and editing, J.Z., J.W. and H.L. All authors have read and agreed to the published version of the manuscript.

Funding

This research was funded by the National Natural Science Foundation of China (grant number 51775156), the Anhui Provincial Natural Science Foundation (grant number 2108085ME169), the University Synergy Innovation Program of Anhui Province (grant number GXXT-2019-048), the Anhui university scientific research platform innovation team building projects (2016–2018), the Scientific Research Foundation for Talent Introduced (grant number 2019YQQ005), the Scientific Research Project (grant number Xjky2020008) of Anhui Polytechnic University, National College Students’ Innovation and Entrepreneurship Training Program (grant number 202110363014) and Open Research Fund of Anhui Engineering Technology Research Center of Automotive New Technique (grant number QCKJ202006).

Institutional Review Board Statement

Not applicable.

Informed Consent Statement

Not applicable.

Data Availability Statement

The data presented in this study are available upon request from the corresponding author.

Conflicts of Interest

The authors declare no conflict of interest.

Nomenclature

A r r th mesh harmonic amplitude of dynamic transmission error
A r m s equivalent root-mean-square amplitude of dynamic transmission error
b ( t ) comprehensive backlash
b ( j 1 ) ( t ) , b ( j ) ( t ) , b ( j + 1 ) ( t ) backlash of j 1 th , j th and j + 1 th pair of teeth
c m ( t ) comprehensive damping
c ( j 1 ) ( t ) , c ( j ) ( t ) , c ( j + 1 ) ( t ) damping of j 1 th , j th and j + 1 th pair of teeth
e ( t ) comprehensive meshing error
e ( j 1 ) ( t ) , e ( j ) ( t ) , e ( j + 1 ) ( t ) meshing error of j 1 th , j th and j + 1 th pair of teeth
f f α 1 profile form deviation of driving wheel
f H α 1 profile slope deviation of driving wheel
f r 1 number of sine periods over the profile evaluation range of driving wheel
F m equivalent applied load
F m e s h total dynamic meshing force
F m e s h ( j 1 ) , F m e s h ( j ) , F m e s h ( j + 1 ) dynamic meshing force of j 1 th , j th and j + 1 th pair of teeth
I 1 ,   I 2 rotary inertia of driving and driven wheels
k m average meshing stiffness
k ( t ) comprehensive meshing stiffness
k ( j 1 ) ( t ) , k ( j ) ( t ) , k ( j + 1 ) ( t ) meshing stiffness of j 1 th , j th and j + 1 th pair of teeth
l nominal dimension
m e equivalent mass
N i the number of teeth on gear i
q dimensionless transmission error
R b 1 ,   R b 2 radius of the base circle of driving and driven wheels
s i shaft order index
ε contact ratio
t z meshing period
t h meshing time of a pair of teeth from engagement to disengagement
T 1 ,   T 2 torque of driving and driven wheels
ω n nominal frequency
ω meshing frequency
W one-sided discrete autopower spectra
W m ( t ) comprehensive internal incentive
W m ¯ ( τ )dimensionless comprehensive internal incentive
θ 1 , θ 2 rotation angle of the driving and driven wheels
τ dimensionless time
Ω h dimensionless frequency
ζ damping ratio
ζ ¯ damping ratio of a single pair of teeth
ρ ¯ function of the number of meshing pairs
B W analysis bandwidth

References

  1. Litvin, F.L.; Jian, L.; Townsend, D.P.; Howkins, M. Computerized simulation of meshing of conventional helical involute gears and modification of geometry. Mechanism and Machine Theory. Mech. Mach. Theory 1997, 34, 123–147. [Google Scholar] [CrossRef] [Green Version]
  2. Litvin, F.L.; Fan, Q.; Vecchiato, D.; Demenego, A.; Handschuh, R.F.; Thomas, M. Computerized generation and simulation of meshing of modified spur and helical gears manufactured by shaving. Comput. Method Appl. M 2001, 190, 5037–5055. [Google Scholar] [CrossRef]
  3. Litvin, F.L.; Fuentes, A.; Gonzalez-Perez, I.; Carvenali, L.; Kawasaki, K.; Handschuh, R.F. Modified involute helical gears: Computerized design, simulation of meshing and stress analysis. Comput. Method Appl. M 2003, 192, 3619–3655. [Google Scholar] [CrossRef] [Green Version]
  4. Litvin, F.L.; Fuentes, A. Gear Geometry and Applied Theory, 2nd ed.; Cambridge University Press: New York, NY, USA, 2004; pp. 241–265. [Google Scholar]
  5. Litvin, F.L.; Sheveleva, G.I.; Vecchiato, D.; Gonzalez-Perez, I.; Fuentes, A. Modified approach for tooth contact analysis of gear drives and automatic determination of guess values. Comput. Method Appl. M 2005, 194, 2927–2946. [Google Scholar] [CrossRef]
  6. Litvin, F.L.; Vecchiato, D.; Yukishima, K.; Fuentes, A.; Gonzalez-Perez, I.; Hayasaka, K. Reduction of noise of loaded and unloaded misaligned gear drives. Comput. Method Appl. M 2006, 195, 5523–5536. [Google Scholar] [CrossRef]
  7. Simon, V. Computer simulation of tooth contact analysis of mismatched spiral bevel gears. Mech. Mach. Theory 2007, 42, 365–381. [Google Scholar] [CrossRef]
  8. Lin, C.H.; Fong, Z.H. Numerical tooth contact analysis of a bevel gear set by using measured tooth geometry data. Mech. Mach. Theory 2015, 84, 1–24. [Google Scholar] [CrossRef]
  9. Vivet, M.; Tamarozzi, T.; Desmet, W.; Mundo, D. On the modelling of gear alignment errors in the tooth contact analysis of spiral bevel gears. Mech. Mach. Theory 2021, 155, 104065. [Google Scholar] [CrossRef]
  10. Kubo, A.; Umezawa, K. On the power transmitting characteristics of helical gears with manufacturing and alignment errors (1st Report). Trans. Jpn. Soc. Mech. Eng. 1997, 43, 2771–2779. [Google Scholar] [CrossRef] [Green Version]
  11. Kubo, A. Stress condition, vibrational exciting force, and contact pattern of helical gears with manufacturing and alignment error. J. Mech. Design 1978, 100, 77–84. [Google Scholar] [CrossRef]
  12. Kahraman, A.; Singh, R. Non-linear dynamics of a spur gear pair. J. Sound Vib. 1990, 142, 49–75. [Google Scholar] [CrossRef]
  13. Kahraman, A.; Singh, R. Interactions between time-varying mesh stiffness and clearance non-linearities in a geared system. J. Sound Vib. 1991, 146, 135–156. [Google Scholar] [CrossRef]
  14. Kahraman, A.; Blankenship, G.W. Experiments on nonlinear dynamic behavior of an oscillator with clearance and periodically time-varying parameters. J. Appl. Mech-T. Asme 1997, 64, 217–226. [Google Scholar] [CrossRef]
  15. Kahraman, A.; Blankenship, G.W. Effect of involute contact ratio on spur gear dynamics. J. Mech. Design 1999, 121, 112–118. [Google Scholar] [CrossRef]
  16. Mucchi, E.; Dalpiaz, G.; Rivola, A. Elastodynamic analysis of a gear pump. Part II: Meshing phenomena and simulation results. Mech. Syst. Signal Pr. 2010, 24, 2180–2197. [Google Scholar] [CrossRef]
  17. Fernández, A.; Iglesias, M.; de-Juan, A.; Garcia, P.; Sancibrian, R.; Viadero, F. Gear transmission dynamic: Effects of tooth profile deviations and support flexibility. Appl. Acoust. 2014, 77, 138–149. [Google Scholar] [CrossRef]
  18. Chen, Q.; Wang, Y.; Tian, W.; Wu, Y.M.; Chen, Y.L. An improved nonlinear dynamic model of gear pair with tooth surface microscopic features. Nonlinear Dynam. 2019, 96, 1615–1634. [Google Scholar] [CrossRef]
  19. Suh, S.H.; Jih, W.S.; Hong, H.D.; Chung, D.H. Sculptured surface machining of spiral bevel gears with CNC milling. Int. J. Mach. Tools Manuf. 2001, 41, 833–850. [Google Scholar] [CrossRef]
  20. Bouzakis, K.D.; Lili, E.; Michailidis, N.; Friderikos, O. Manufacturing of cylindrical gears by generating cutting processes: A critical synthesis of analysis methods. CIRP Ann. 2008, 57, 676–696. [Google Scholar] [CrossRef]
  21. Pasternak, S.; Danylchenko, Y. Cutting forces in gear machining by disk milling cutters. J. Mech. Adv. Technol. 2018, 1, 5–11. [Google Scholar] [CrossRef]
  22. Gołebski, R. Parametric programming of CNC machine tools. In Proceedings of the 4th International Conference on Computing and Solutions in Manufacturing Engineering 2016, Brasov, Romania, 3–4 November 2016. [Google Scholar]
  23. Piotrowski, A.; Gołebski, R.; Boral, P. Geometric Analysis of Composite Hobs. Trans. FAMENA 2020, 44, 43–54. [Google Scholar] [CrossRef]
  24. Gołebski, R.; Boral, P. Study of machining of gears with regular and modified outline using CNC machine tools. Materials 2021, 14, 2913. [Google Scholar] [CrossRef] [PubMed]
  25. Marimuthu, P.; Muthuveerappan, G. Investigation of load carrying capacity of asymmetric high contact ratio spur gear based on load sharing using direct gear design approach. Mech. Mach. Theory 2016, 96, 52–74. [Google Scholar] [CrossRef]
  26. Wang, Y.; Liu, P.; Dou, D. Investigation of Load Capacity of High-Contact-Ratio Internal Spur Gear Drive with Arc Path of Contact. Appl. Sci. 2022, 12, 3345. [Google Scholar] [CrossRef]
  27. Pimsarn, M.; Kazerounian, K. Efficient evaluation of spur gear tooth mesh load using pseudo-interference stiffness estimation method. Mech. Mach. Theory 2002, 37, 769–786. [Google Scholar] [CrossRef]
  28. Fernández Del Rincon, A.; Viadero, F.; Iglesias, M.; García, P.; De-Juan, A.; Sancibrian, R. A model for the study of meshing stiffness in spur gear transmissions. Mech. Mach. Theory 2013, 61, 30–58. [Google Scholar] [CrossRef]
  29. Li, S. Effects of misalignment error, tooth modifications and transmitted torque on tooth engagements of a pair of spur gears. Mech. Mach. Theory 2015, 83, 125–136. [Google Scholar] [CrossRef]
  30. Ye, S.Y.; Tsai, S.J. A computerized method for loaded tooth contact analysis of high-contact-ratio spur gears with or without flank modification considering tip corner contact and shaft misalignment. Mech. Mach. Theory 2016, 97, 190–214. [Google Scholar] [CrossRef]
  31. Marimuthu, P.; Muthuveerappan, G. Design of asymmetric normal contact ratio spur gear drive through direct design to enhance the load carrying capacity. Mech. Mach. Theory 2016, 95, 22–34. [Google Scholar] [CrossRef]
  32. Sánchez, M.B.; Pleguezuelos, M.; Pedrero, J.I. Approximate equations for the meshing stiffness and the load sharing ratio of spur gears including hertzian effects. Mech. Mach. Theory 2017, 109, 231–249. [Google Scholar] [CrossRef]
  33. Chen, S.Y.; Tang, J.Y.; Luo, C.W.; Wang, Q.B. Nonlinear dynamic characteristics of geared rotor bearing systems with dynamic backlash and friction. Mech. Mach. Theory 2011, 46, 466–478. [Google Scholar]
  34. Xiang, L.; Jia, Y.; Hu, A. Bifurcation and chaos analysis for multi-freedom gear-bearing system with time-varying stiffness. Appl. Math. Model. 2016, 40, 10506–10520. [Google Scholar] [CrossRef]
  35. Xia, Y.; Wan, Y.; Liu, Z. Bifurcation and chaos analysis for a spur gear pair system with friction. J. Braz. Soc. Mech. Sci. 2018, 40, 529. [Google Scholar] [CrossRef]
  36. Li, Z.; Zhu, C.; Liu, H.; Gu, Z. Mesh stiffness and nonlinear dynamic response of a spur gear pair considering tribo-dynamic effect. Mech. Mach. Theory 2020, 153, 103989. [Google Scholar] [CrossRef]
  37. Doğan, O.; Karpat, F.; Kopmaz, O.; Ekwaro-Osire, S. Influences of gear design parameters on dynamic tooth loads and time-varying mesh stiffness of involute spur gears. Sadhana-Acad. P. Eng. S. 2020, 45, 258. [Google Scholar] [CrossRef]
  38. Liu, P.; Zhu, L.; Gou, X.; Shi, J.; Jin, G. Modeling and analyzing of nonlinear dynamics for spur gear pair with pitch deviation under multi-state meshing. Mech. Mach. Theory 2021, 163, 104378. [Google Scholar] [CrossRef]
  39. Amabili, M.; Fregolent, A. A method to identify modal parameters and gear errors by vibrations of a spur gear pair. J. Sound Vib. 1998, 214, 339–357. [Google Scholar] [CrossRef]
  40. Shi, Z.Y.; Kang, Y.; Lin, J.C. Comprehensive Dynamics Model and Dynamic Response Analysis of a Spur Gear Pair Based on Gear Pair Integrated Error. Chin. J. Mech. Eng. 2010, 46, 55–61. [Google Scholar] [CrossRef]
  41. Xu, R.; Zhang, J.; Wang, J.; Li, R.J. Research on nonlinear dynamic model and characteristics of a spur gear pair considering the meshing state of multiple pairs of teeth. J. Adv. Mech. Des. Syst. 2021, 15, JAMDSM0068. [Google Scholar] [CrossRef]
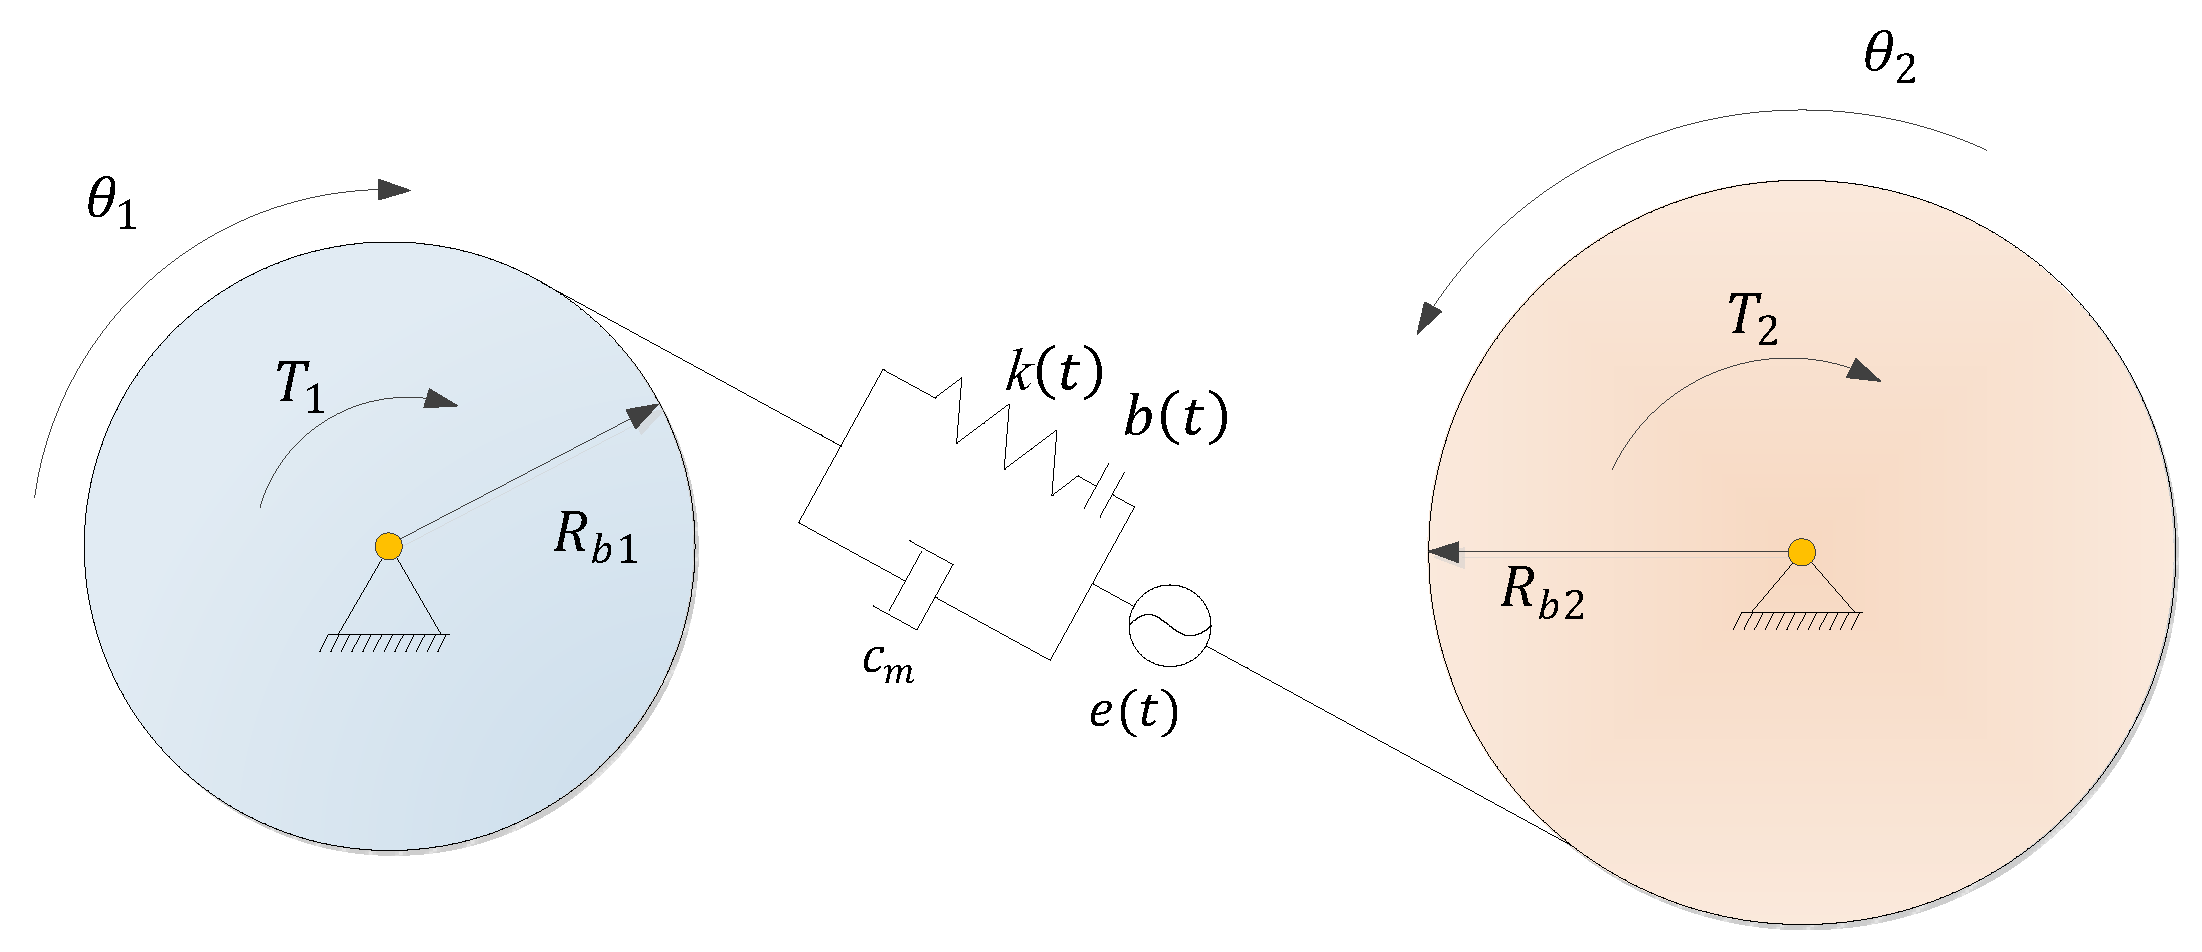
Figure 1. Traditional SDOF dynamic model for a gear system.
Applsci 12 04690 g001
Figure 2. Dynamic model for gear system considering the meshing state of multiple pairs of teeth: (a) j 1 th   and   j th pairs of teeth; (b)   j th pair of teeth; (c) j th   and   j + 1 th pairs of teeth.
Applsci 12 04690 g002
Figure 3. Simulation and experimental results of dimensionless A r m s with frequency Ω h .
Applsci 12 04690 g003
Figure 4. Meshing error calculation and its curve drawing process based on TCA: (a) Step 1; (b) Step 2; (c) Step 3; (d) Step 4.
Applsci 12 04690 g004aApplsci 12 04690 g004b
Figure 5. The single pair of teeth meshing error and comprehensive meshing error with different contact ratio: (a) ε = 1.28 ; (b) ε = 1.75 ; (c) ε = 1.92 ; (d) ε = 1.92 (adjusted profile deviation).
Applsci 12 04690 g005
Figure 6. Comparative analysis of dynamics characteristics based on traditional and new model: (a) time history diagram; (b) FFT spectrogram.
Applsci 12 04690 g006
Figure 7. Comparative analysis of total dynamic mesh force based on traditional and new model.
Applsci 12 04690 g007
Figure 8. Dynamic mesh force based on new dynamic model under different meshing errors: (a) dynamic mesh force based on Figure 5c; (b) dynamic mesh force based on Figure 5d.
Applsci 12 04690 g008
Figure 9. Load sharing ratio based on new dynamic model.
Applsci 12 04690 g009
Figure 10. The dynamics characteristics with different f f α 1 : (a) time history diagram; (b) FFT spectrogram.
Applsci 12 04690 g010
Figure 11. Total dynamic mesh force under different f f α 1 .
Applsci 12 04690 g011
Figure 12. Dynamic mesh force of a single pair of teeth under different f f α 1 .
Applsci 12 04690 g012
Figure 13. Dynamic mesh force of a single pair of teeth under different f f α 1 .
Applsci 12 04690 g013
Figure 14. The dynamics characteristics with different f H α 1 : (a) time history diagram; (b) FFT spectrogram.
Applsci 12 04690 g014
Figure 15. Total dynamic mesh force under different f H α 1 .
Applsci 12 04690 g015
Figure 16. Dynamic mesh force of a single pair of teeth under different f H α 1 .
Applsci 12 04690 g016
Figure 17. Dynamic mesh force of a single pair of teeth under different f H α 1 .
Applsci 12 04690 g017
Figure 18. The dynamics characteristics with different Ω h : (a) time history diagram; (b) FFT spectrogram.
Applsci 12 04690 g018aApplsci 12 04690 g018b
Figure 19. Total dynamic mesh force under different Ω h .
Applsci 12 04690 g019
Figure 20. Dynamic mesh force of a single pair of teeth under different Ω h .
Applsci 12 04690 g020
Figure 21. Load sharing ratio of a single pair of teeth under different Ω h .
Applsci 12 04690 g021
Figure 22. The dynamics characteristics with different T 1 : (a) time history diagram; (b) FFT spectrogram.
Applsci 12 04690 g022
Figure 23. Total dynamic mesh force under different T 1 .
Applsci 12 04690 g023
Figure 24. Dynamic mesh force of a single pair of teeth under different T 1 .
Applsci 12 04690 g024
Figure 25. Load sharing ratio of a single pair of teeth under different T 1 .
Applsci 12 04690 g025
Figure 26. The dynamics characteristics with different ζ ¯ : (a) time history diagram; (b) FFT spectrogram.
Applsci 12 04690 g026
Figure 27. Total dynamic mesh force under different ζ ¯ .
Applsci 12 04690 g027
Figure 28. Dynamic mesh force of a single pair of teeth under different ζ ¯ .
Applsci 12 04690 g028
Figure 29. Load sharing ratio of a single pair of teeth under different ζ ¯ .
Applsci 12 04690 g029
Figure 30. Curves of dimensionless A r m s with dimensionless frequency Ω h .
Applsci 12 04690 g030
Figure 31. The dynamics characteristics for the upper branch when ζ ¯ = 0.01 : (a) time history diagram; (b) FFT spectrogram.
Applsci 12 04690 g031
Figure 32. Dynamic mesh force for the upper branch when ζ ¯ = 0.01 .
Applsci 12 04690 g032
Table 1. Basic parameters of gears.
ParametersValue
Driving/Driven Wheel
Number of teeth50
Module (mm)3
Pressure angle (°)20
Base diameter [mm]140.95
Tooth thickness at pitch diameter [mm]4.64
Outer diameter [mm]156
Root diameter [mm]140.68
Face width [mm]20
Mass [kg]2.52
Inertia [kg·m2]0.0074
Young’s modulus [MPa]206,000
Poisson’s coefficient0.3
Center distance [mm]150
Backlash [mm]0.145
Backlash on line of action [mm]0.136
Contact ratio [-]1.7547
Publisher’s Note: MDPI stays neutral with regard to jurisdictional claims in published maps and institutional affiliations.