2. Plasma Cleaning Power Supply Design
The nozzle of the plasma cleaning machine produces plasma by the electrical breakdown of gas. For the plasma resonant power supply, the plasma torch is equivalent to a large capacitive load. If the pre-stage power supply is not properly compensated, the power factor will be too low affecting the efficiency, and the quality factor of the system will not be well controlled, while a small quality factor will cause a poor selectivity of the output power in frequency modulation [
5].
Compensation for the capacitive load can be achieved by adding inductance to the primary side to form series resonance. In the case of a non-uniform electric field, the breakdown of 1 mm of compressed air needed for the breakdown voltage of about 3 kV, causes a lot of leakage inductance in the transformer. Now that the leakage inductance of the transformer is inevitable, simply using the series resonance with the load capacitance, can play a role of power factor compensation, and have a good quality factor. At the same time, it also avoids the volume increase caused by additional inductance.
The full-bridge inverter circuit is generally used to form high frequency and high voltage with a positive and negative polarity on the plasma torch. Although the traditional non-phase shifting control is simple, it is not convenient to construct a soft switch, and the switching loss is large. By adopting a phase shift full bridge control mode, the soft switch can be easily constructed, and the efficiency can be improved. Therefore, the phase-shifting full bridge is adopted as the control mode of the main circuit in this system [
6].
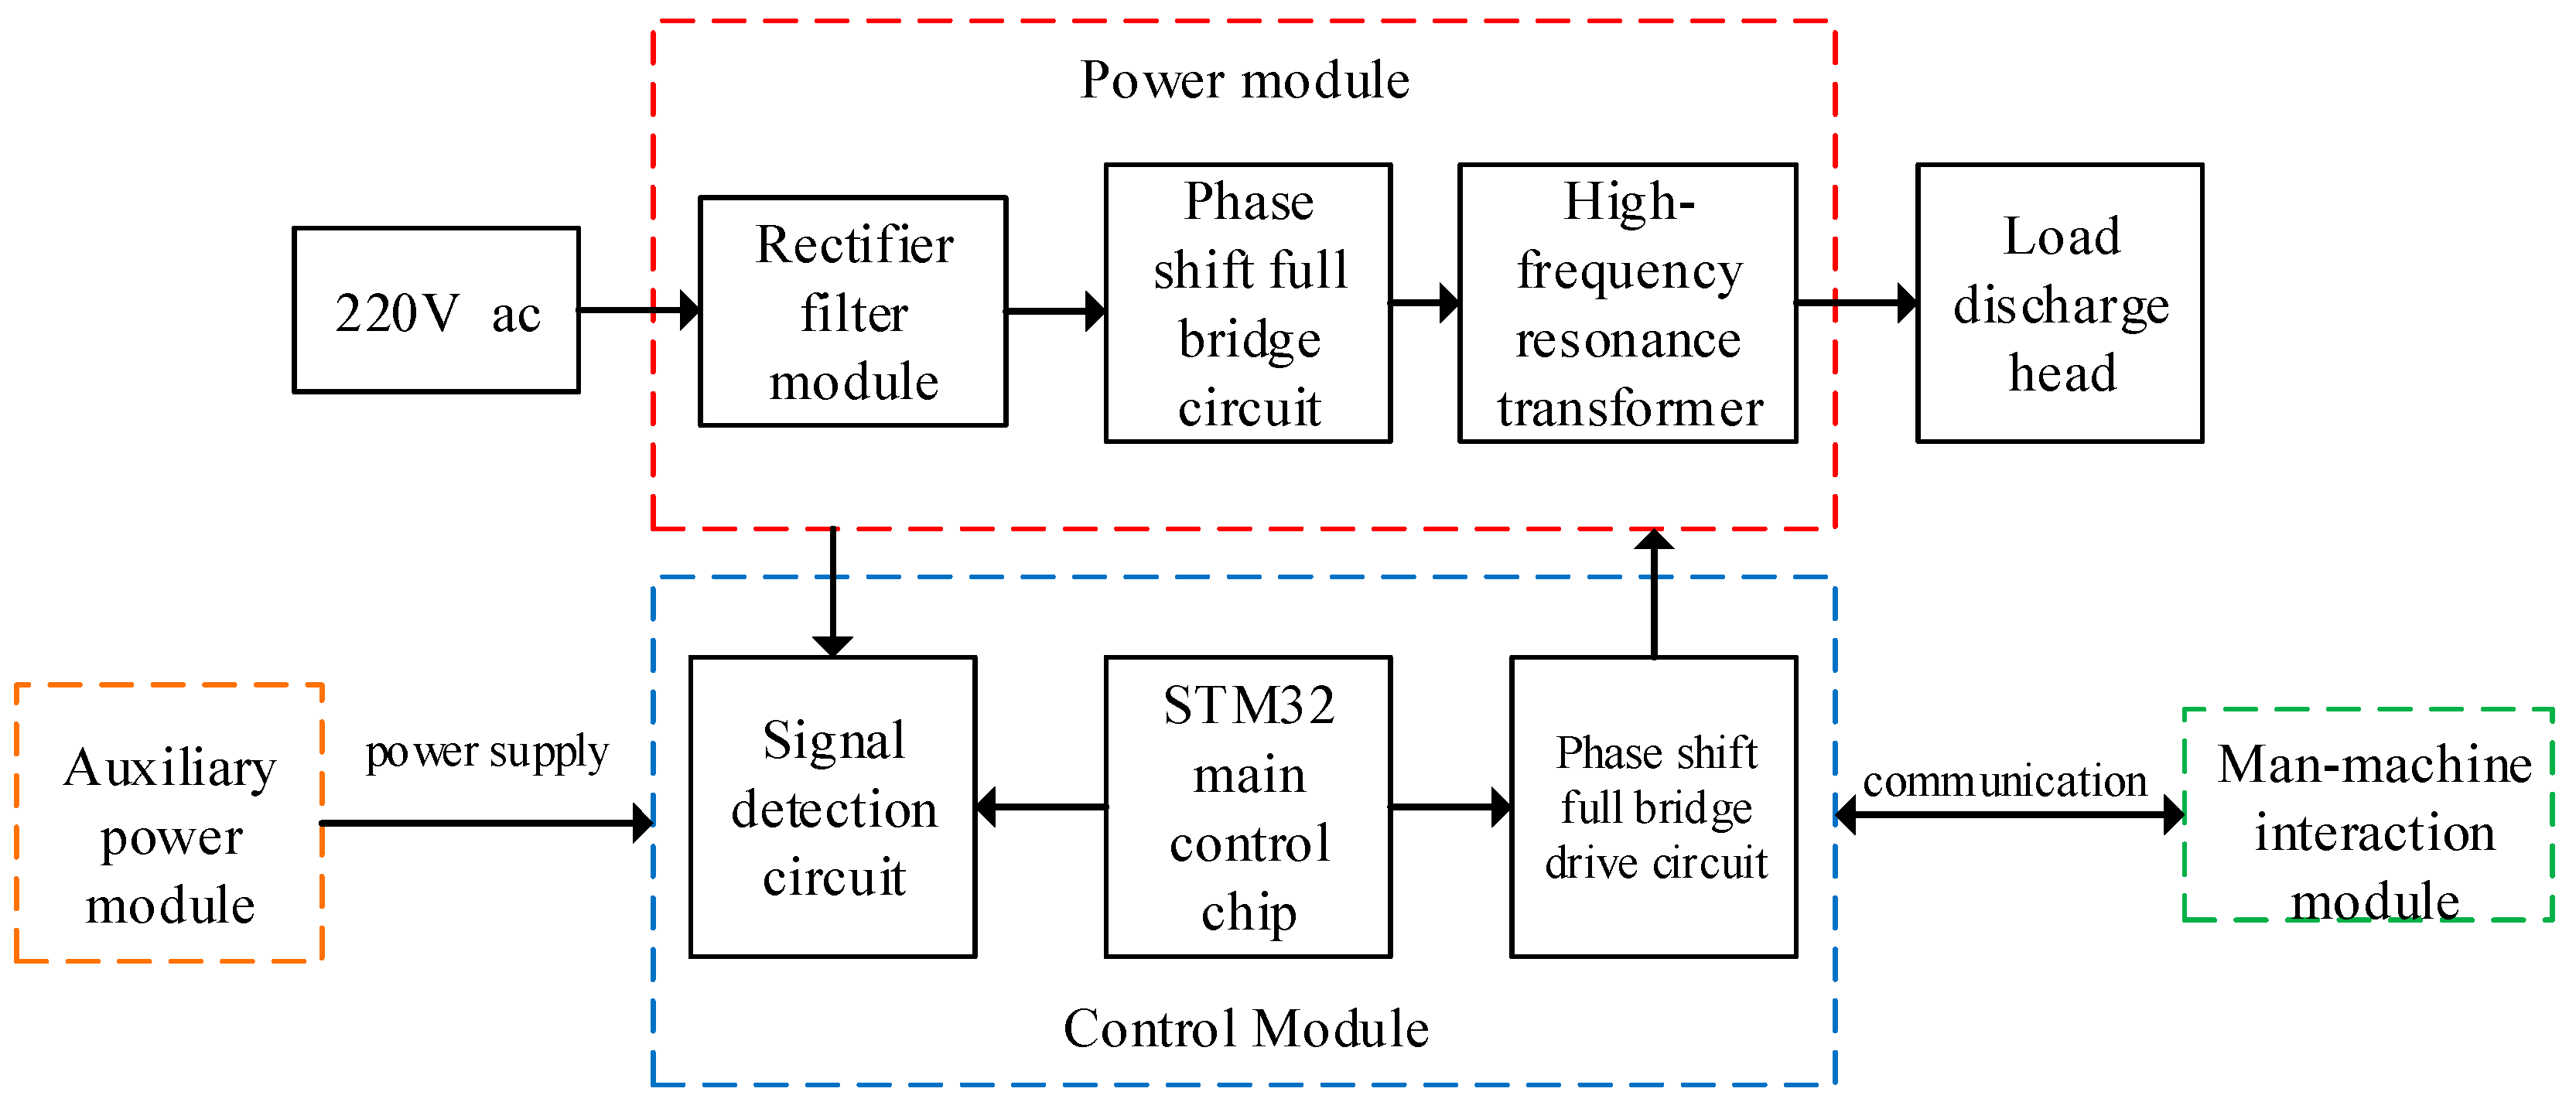
The system architecture of the resonant power supply for plasma cleaning is shown in
Figure 1, which mainly includes four parts: the power module, the control module, the auxiliary power module, and the human–computer interaction module.
The power module includes the front rectifier filter module, the phase shift full bridge circuit, and the high-frequency resonant transformer. The rectifier filter module is responsible for the power grid 220 V AC through the diode rectifier bridge and filter circuit to get smooth DC. The phase-shifting full-bridge circuit is responsible for inverting the DC obtained in the previous stage into a high-frequency AC square wave, acting on the high-frequency resonant transformer [
7]. The high-frequency resonant transformer boosts the low-voltage AC square wave of the primary winding to the high-voltage AC square wave of more than 3000 volts of the secondary winding, and acts on the load discharge gun head, so that the gas of the gun head is continuously decomposed and generates plasma, which acts on the cleaning object.
The control module consists of signal detection and the conditioning circuit, the main control STM32 chip, and the phase shift full bridge driver circuit. The signal detection circuit is responsible for obtaining circuit voltage, current, and temperature information, and these analog signals through the conditioning circuit modulation output to the master chip. The master chip converts these analog signals into digital signals in the program and calculates them to obtain the working condition of the plasma cleaning power supply system and controls the corresponding driving circuit accordingly to ensure the safe and stable work of the system.
The auxiliary power module is a multi-output quasi-resonant flyback circuit with UCC28610 as the control core, which supplies power to the circuits of different voltage levels such as the master chip, the signal conditioning circuit, and the drive circuit.
The human–computer interaction module is responsible for real-time communication with the main control chip to obtain the operation information of the plasma cleaning power supply system and display it through the control panel. Users can understand the real-time working conditions of the system through the panel and set the operation parameters through the operation control panel. The control panel will send these instructions to the main control chip, and then execute the corresponding control instructions.
This paper will analyze and design the resonant power supply system for plasma cleaning according to the system architecture mentioned above, and its main indicators are shown in
Table 1.
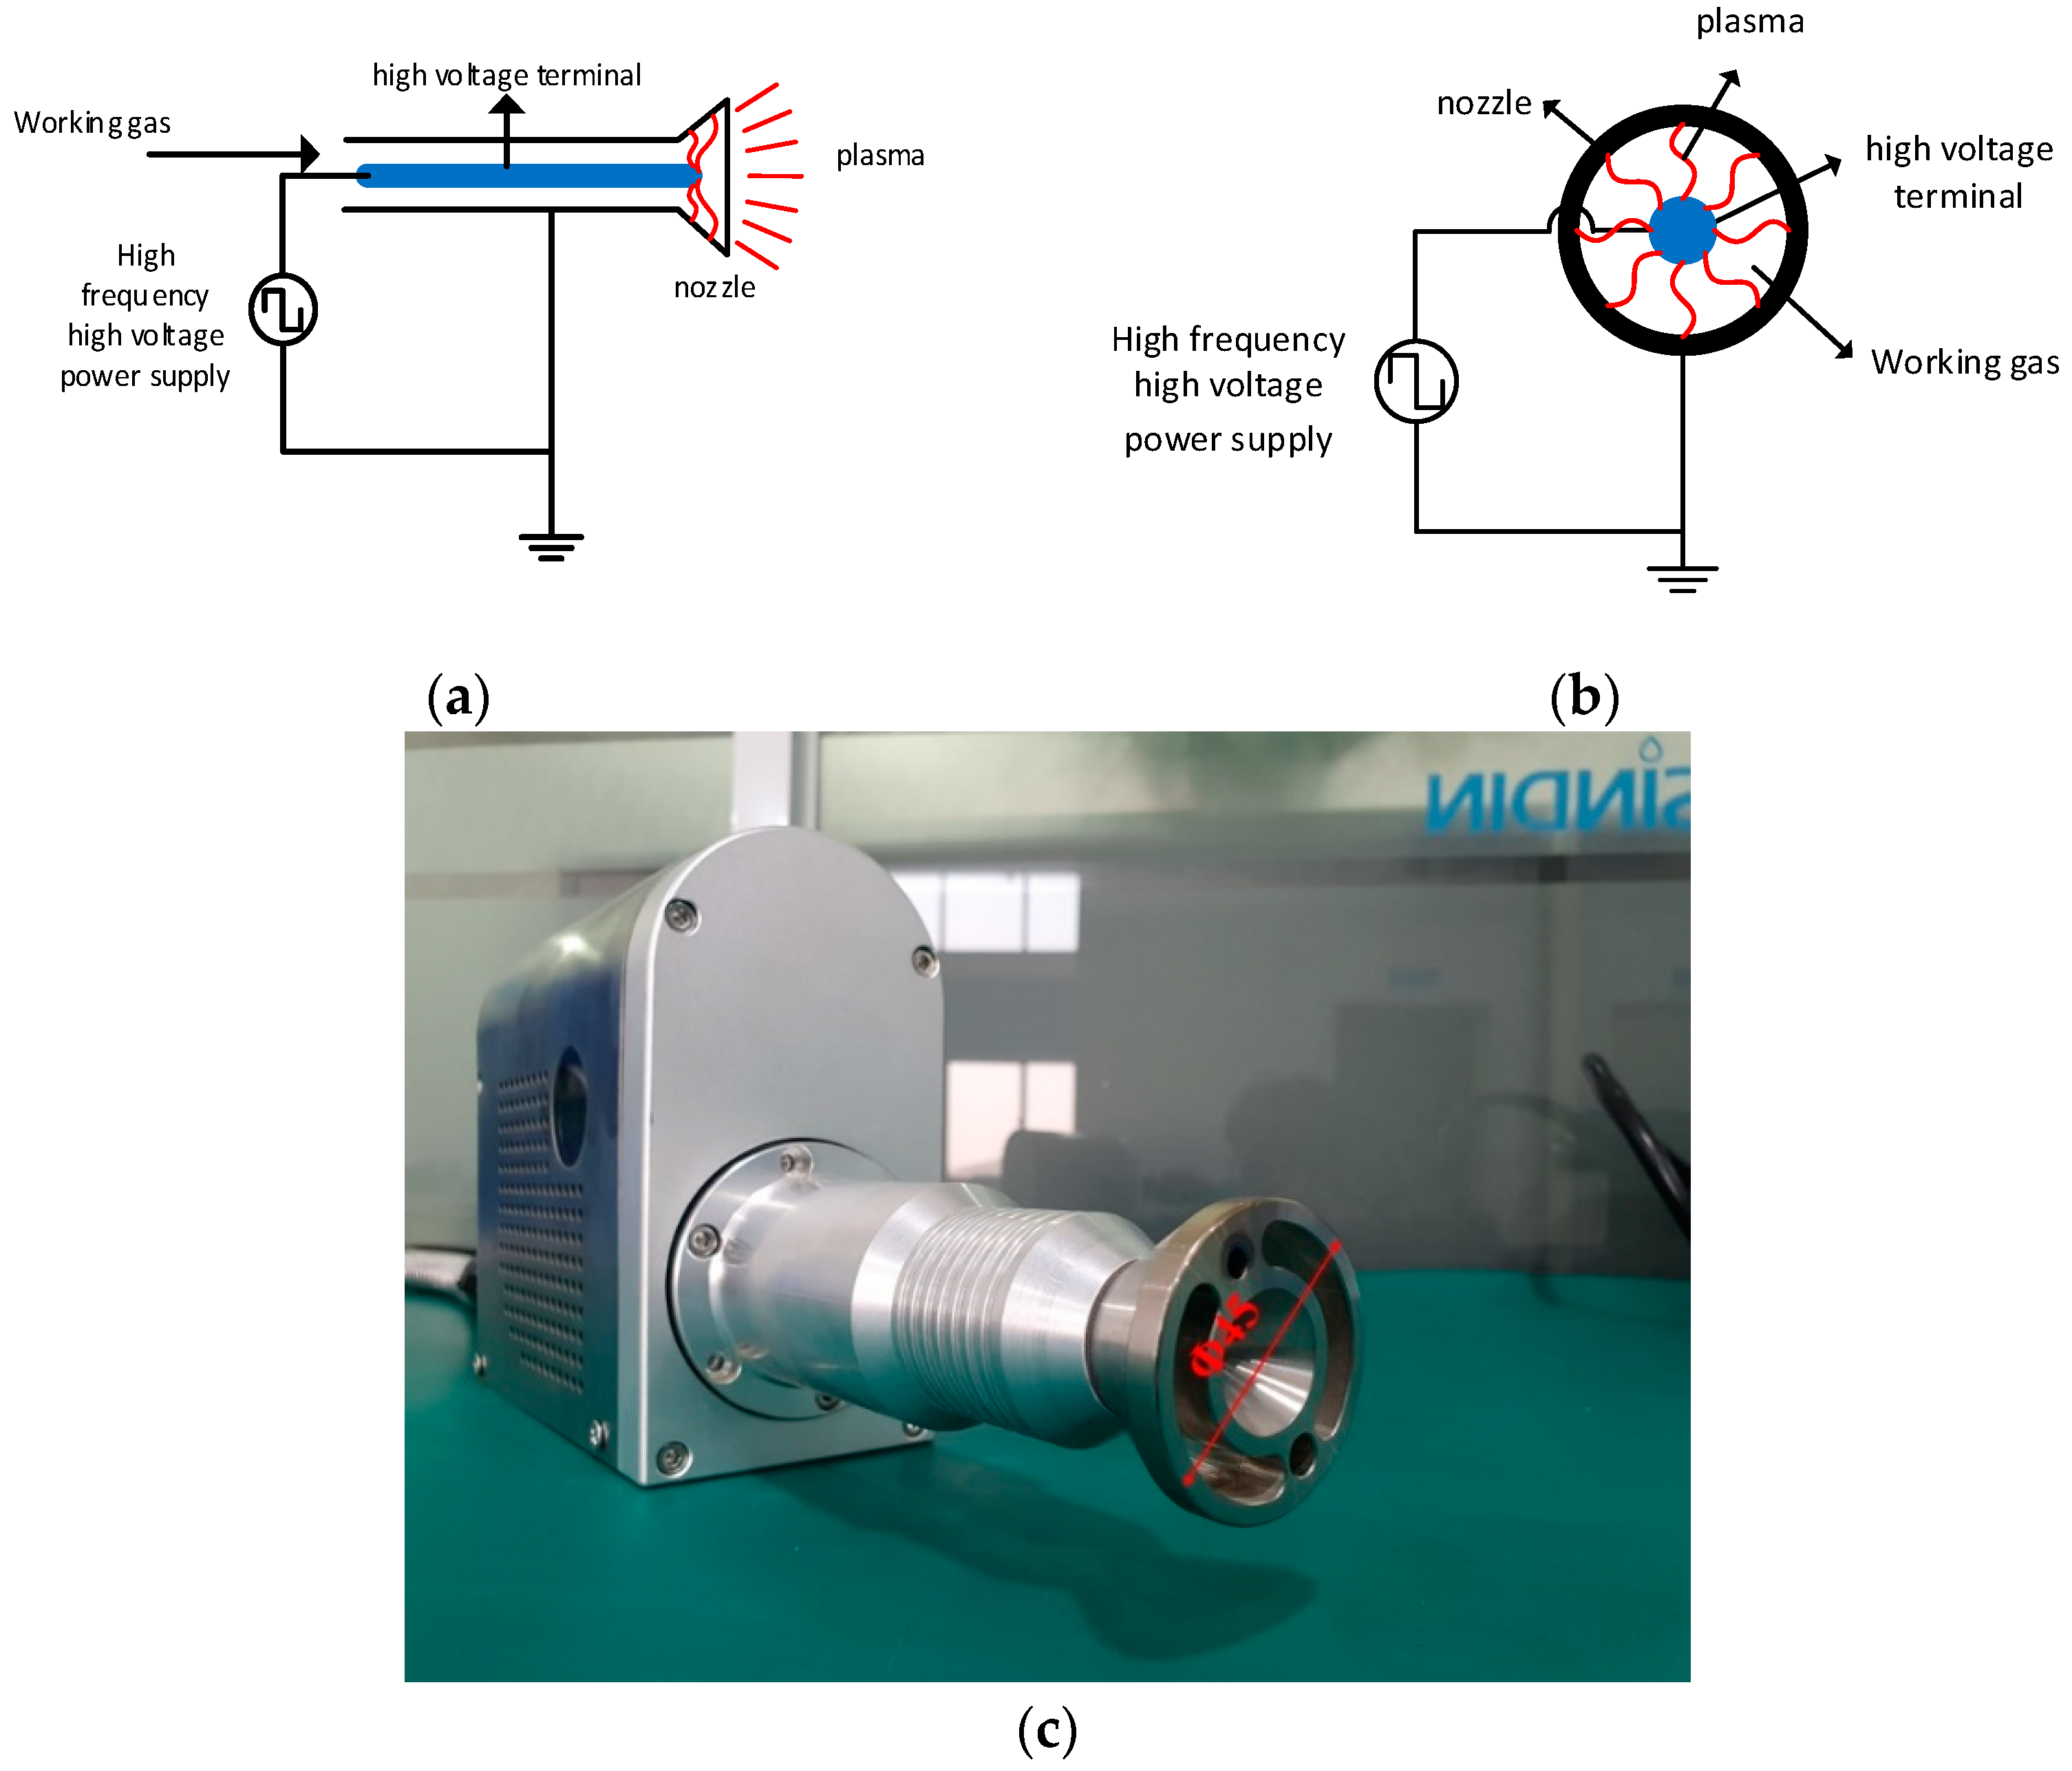
Figure 2 is the cross section of the resonant power supply plasma torch for plasma cleaning. By applying positive and negative pulses of high frequency and high voltage to the plasma torch, the working gas is continuously decomposed, and a filamentary plasma column is generated between the electrodes, which is blown away from the plasma torch under the action of gas pressure, thus generating plasma [
8].
Plasma torch load is imposed by the working gas, nitrogen, argon, or compressed air. Nitrogen and argon gas on the material surface modification effect is better, but they are expensive, not suitable for mass production, and generally used in places that have requirements of specific requirements. Compressed air has a low cost and only needs a compressor to be achieved; therefore, it has been widely used in industry [
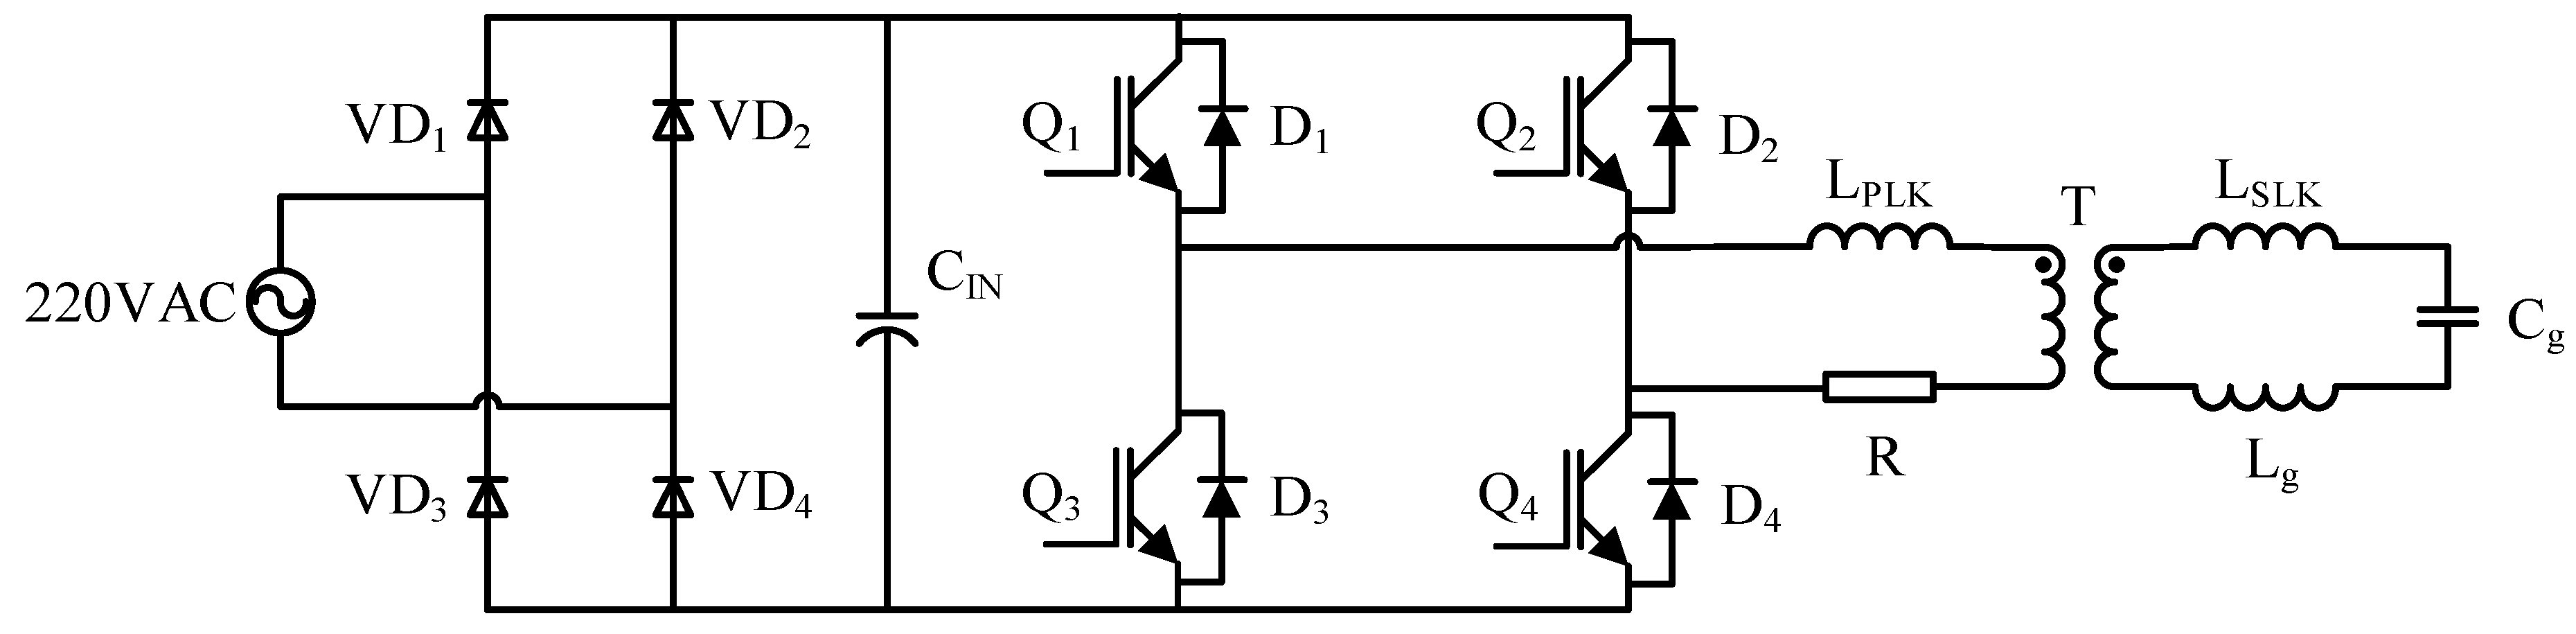
9]. No matter what kind of gas is used, the gun head is equivalent to the capacitive load, so an equivalent capacitance can be used to replace it in the circuit analysis, and the main circuit diagram of the system can be expressed, as shown in
Figure 3. Wherein, L
PLK is the primary leakage inductance of the transformer, L
SLK is the secondary leakage inductance of the transformer, L
g is the inductance of plasma torch, R is the line resistance, and C
g is the equivalent capacitance of the nozzle air gap.
The main control chip of the resonant power supply for plasma cleaning is STM32F103.
3. Resonant Power Supply Control Method for Plasma Cleaning
This section proposes a PSPWM-PFM hybrid modulation control mode, aiming to combine the characteristics of PSPWM and PFM control modes, so that the system can adjust the output power quickly and accurately, and ensure that the system has a wide enough power tuning range. It can also adjust the working frequency of the system to prevent the system from deviating from the resonant frequency point due to changes in the external environment such as air pressure, temperature, or load, and maintain a higher output efficiency.
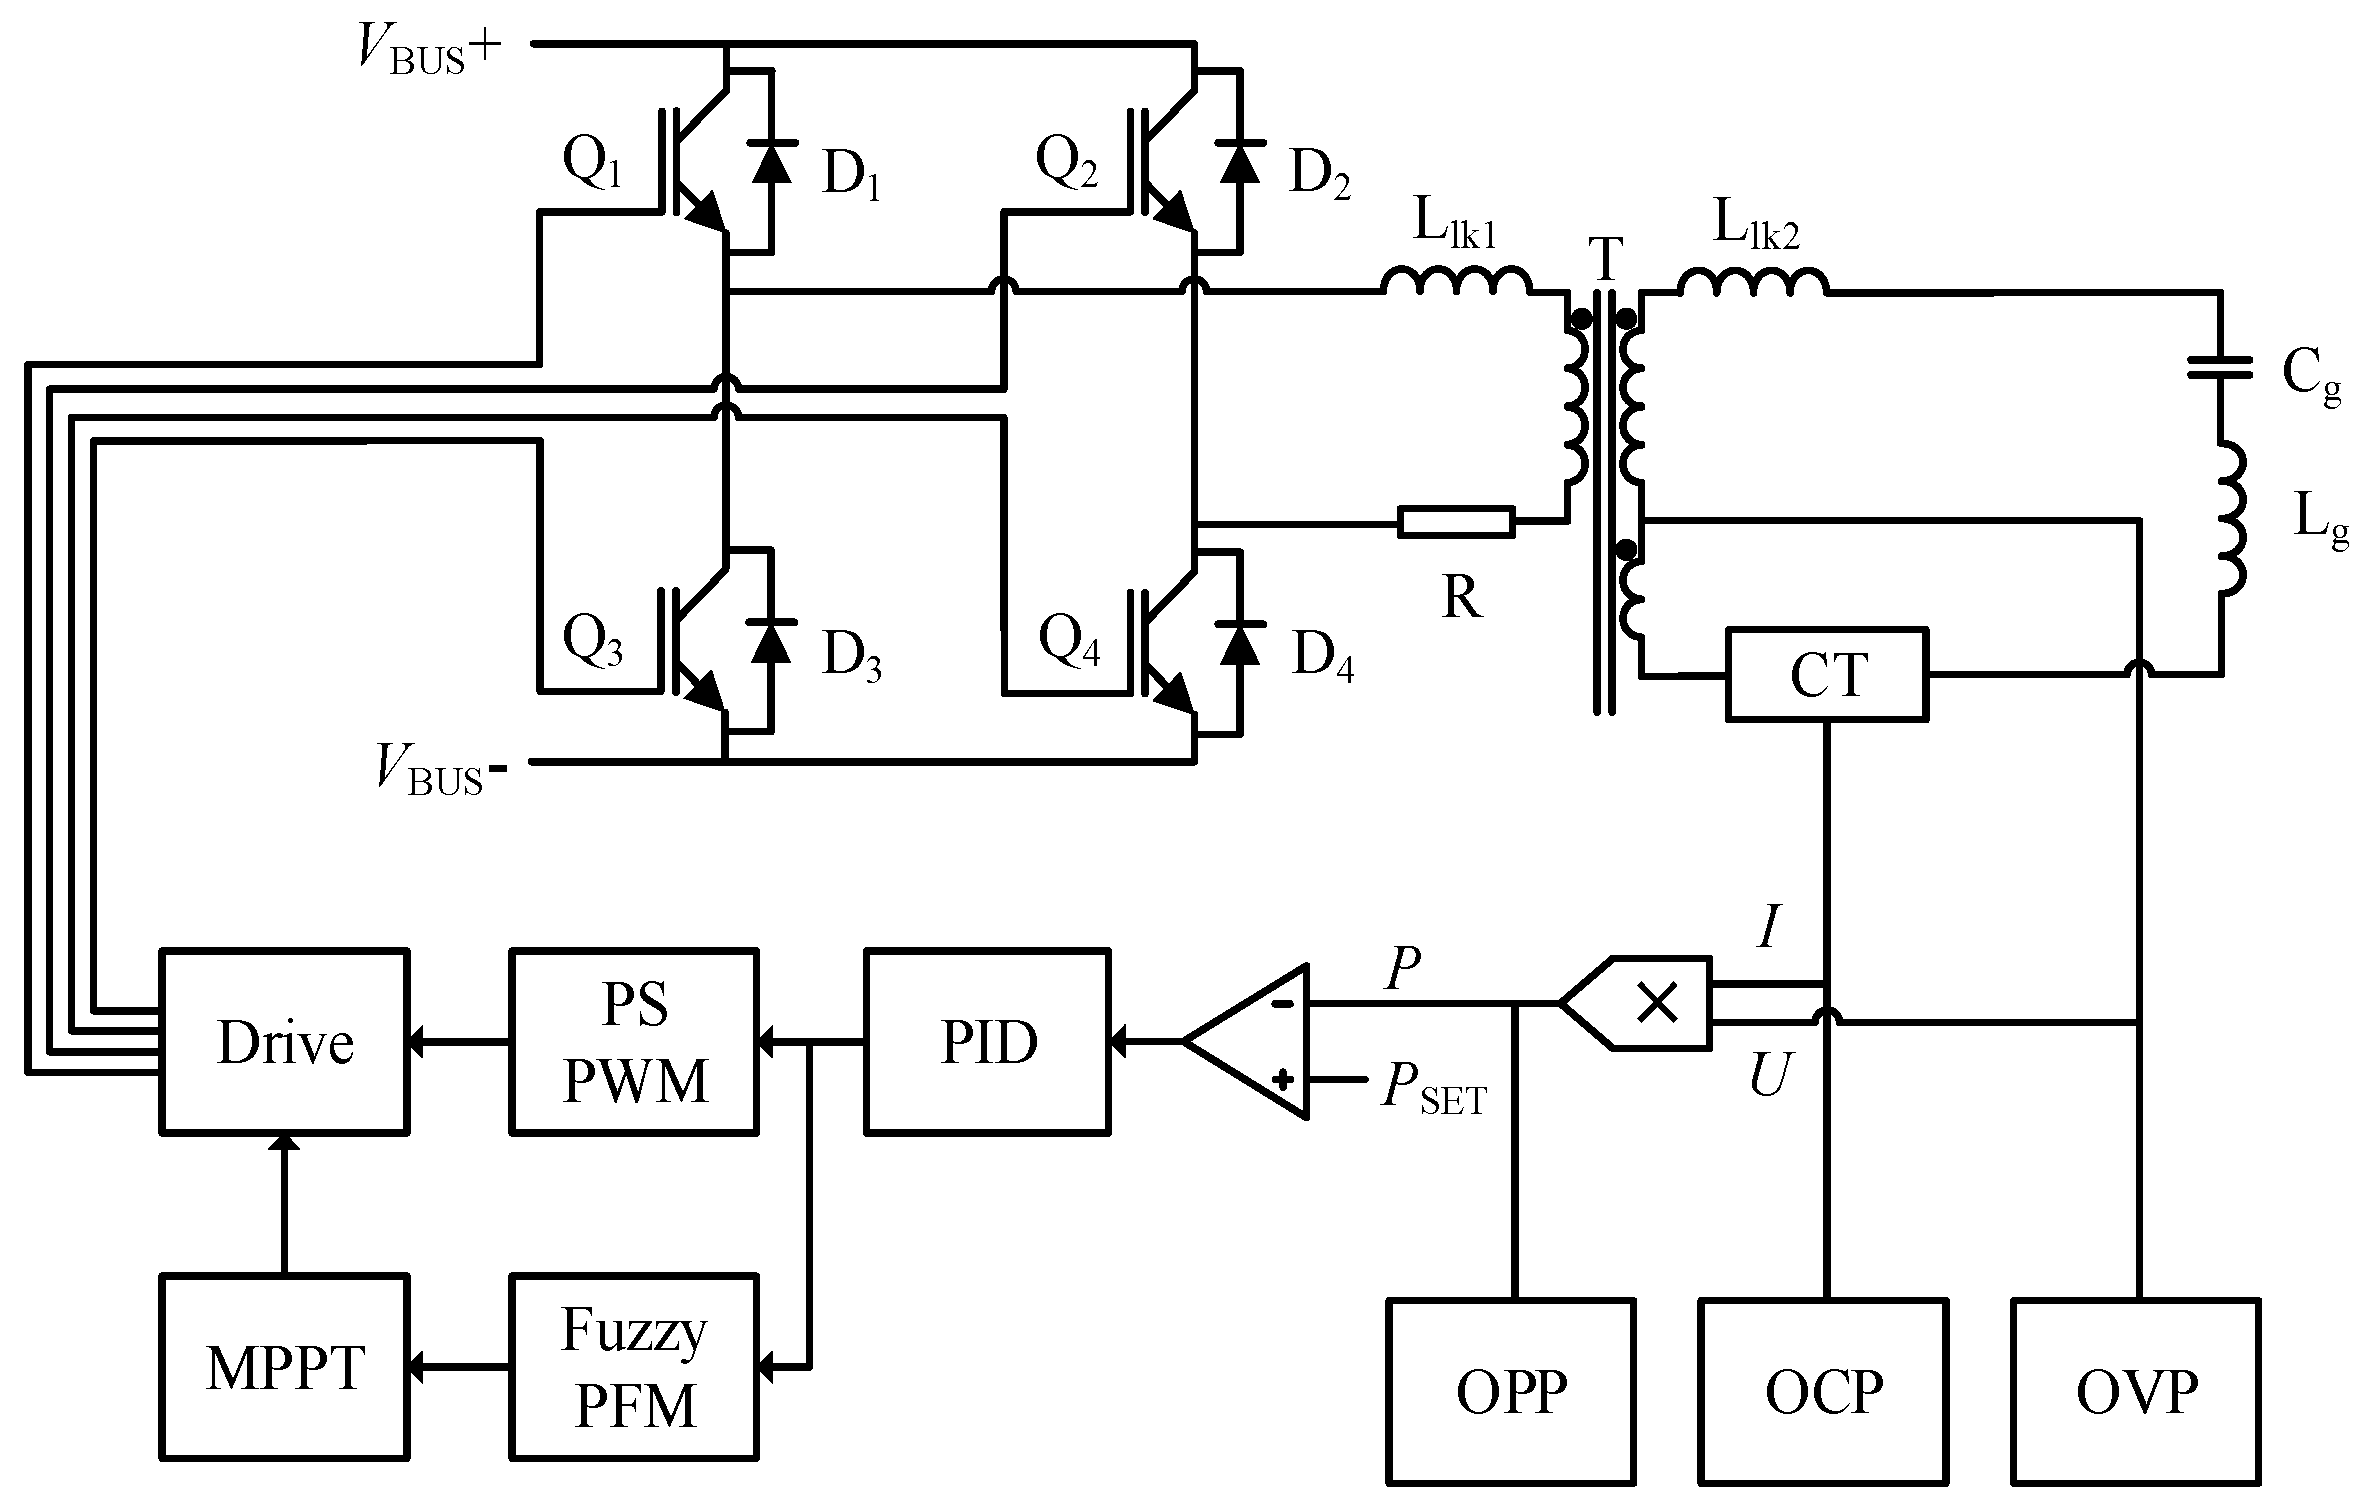
Figure 4 shows the PSPWM-PFM mixed modulation closed-loop control diagram of the system. Firstly, the output voltage signal U and current signal I of the system are sampled. The voltage signal is obtained from the secondary winding of the power transformer and sampled by the secondary voltage detection circuit. The current signal is sampled by a secondary current detection circuit. After the signal is sampled and calculated by the master chip, the actual output power P of the system is obtained. The functions of over voltage protection (OVP), over current protection (OCP), and over power protection (OPP) are also set for the sampled and calculated signals. The actual output power P is compared with the user’s set power PSET, and the power deviation E is obtained. After the PID modulation of bias E and mixed modulation of PSPWM-PFM, the driving signal with variable pulse width and period is obtained, and then the corresponding IGBT tube in the phase-shifting full-bridge circuit is driven to achieve the modulation of the output power [
10,
11].
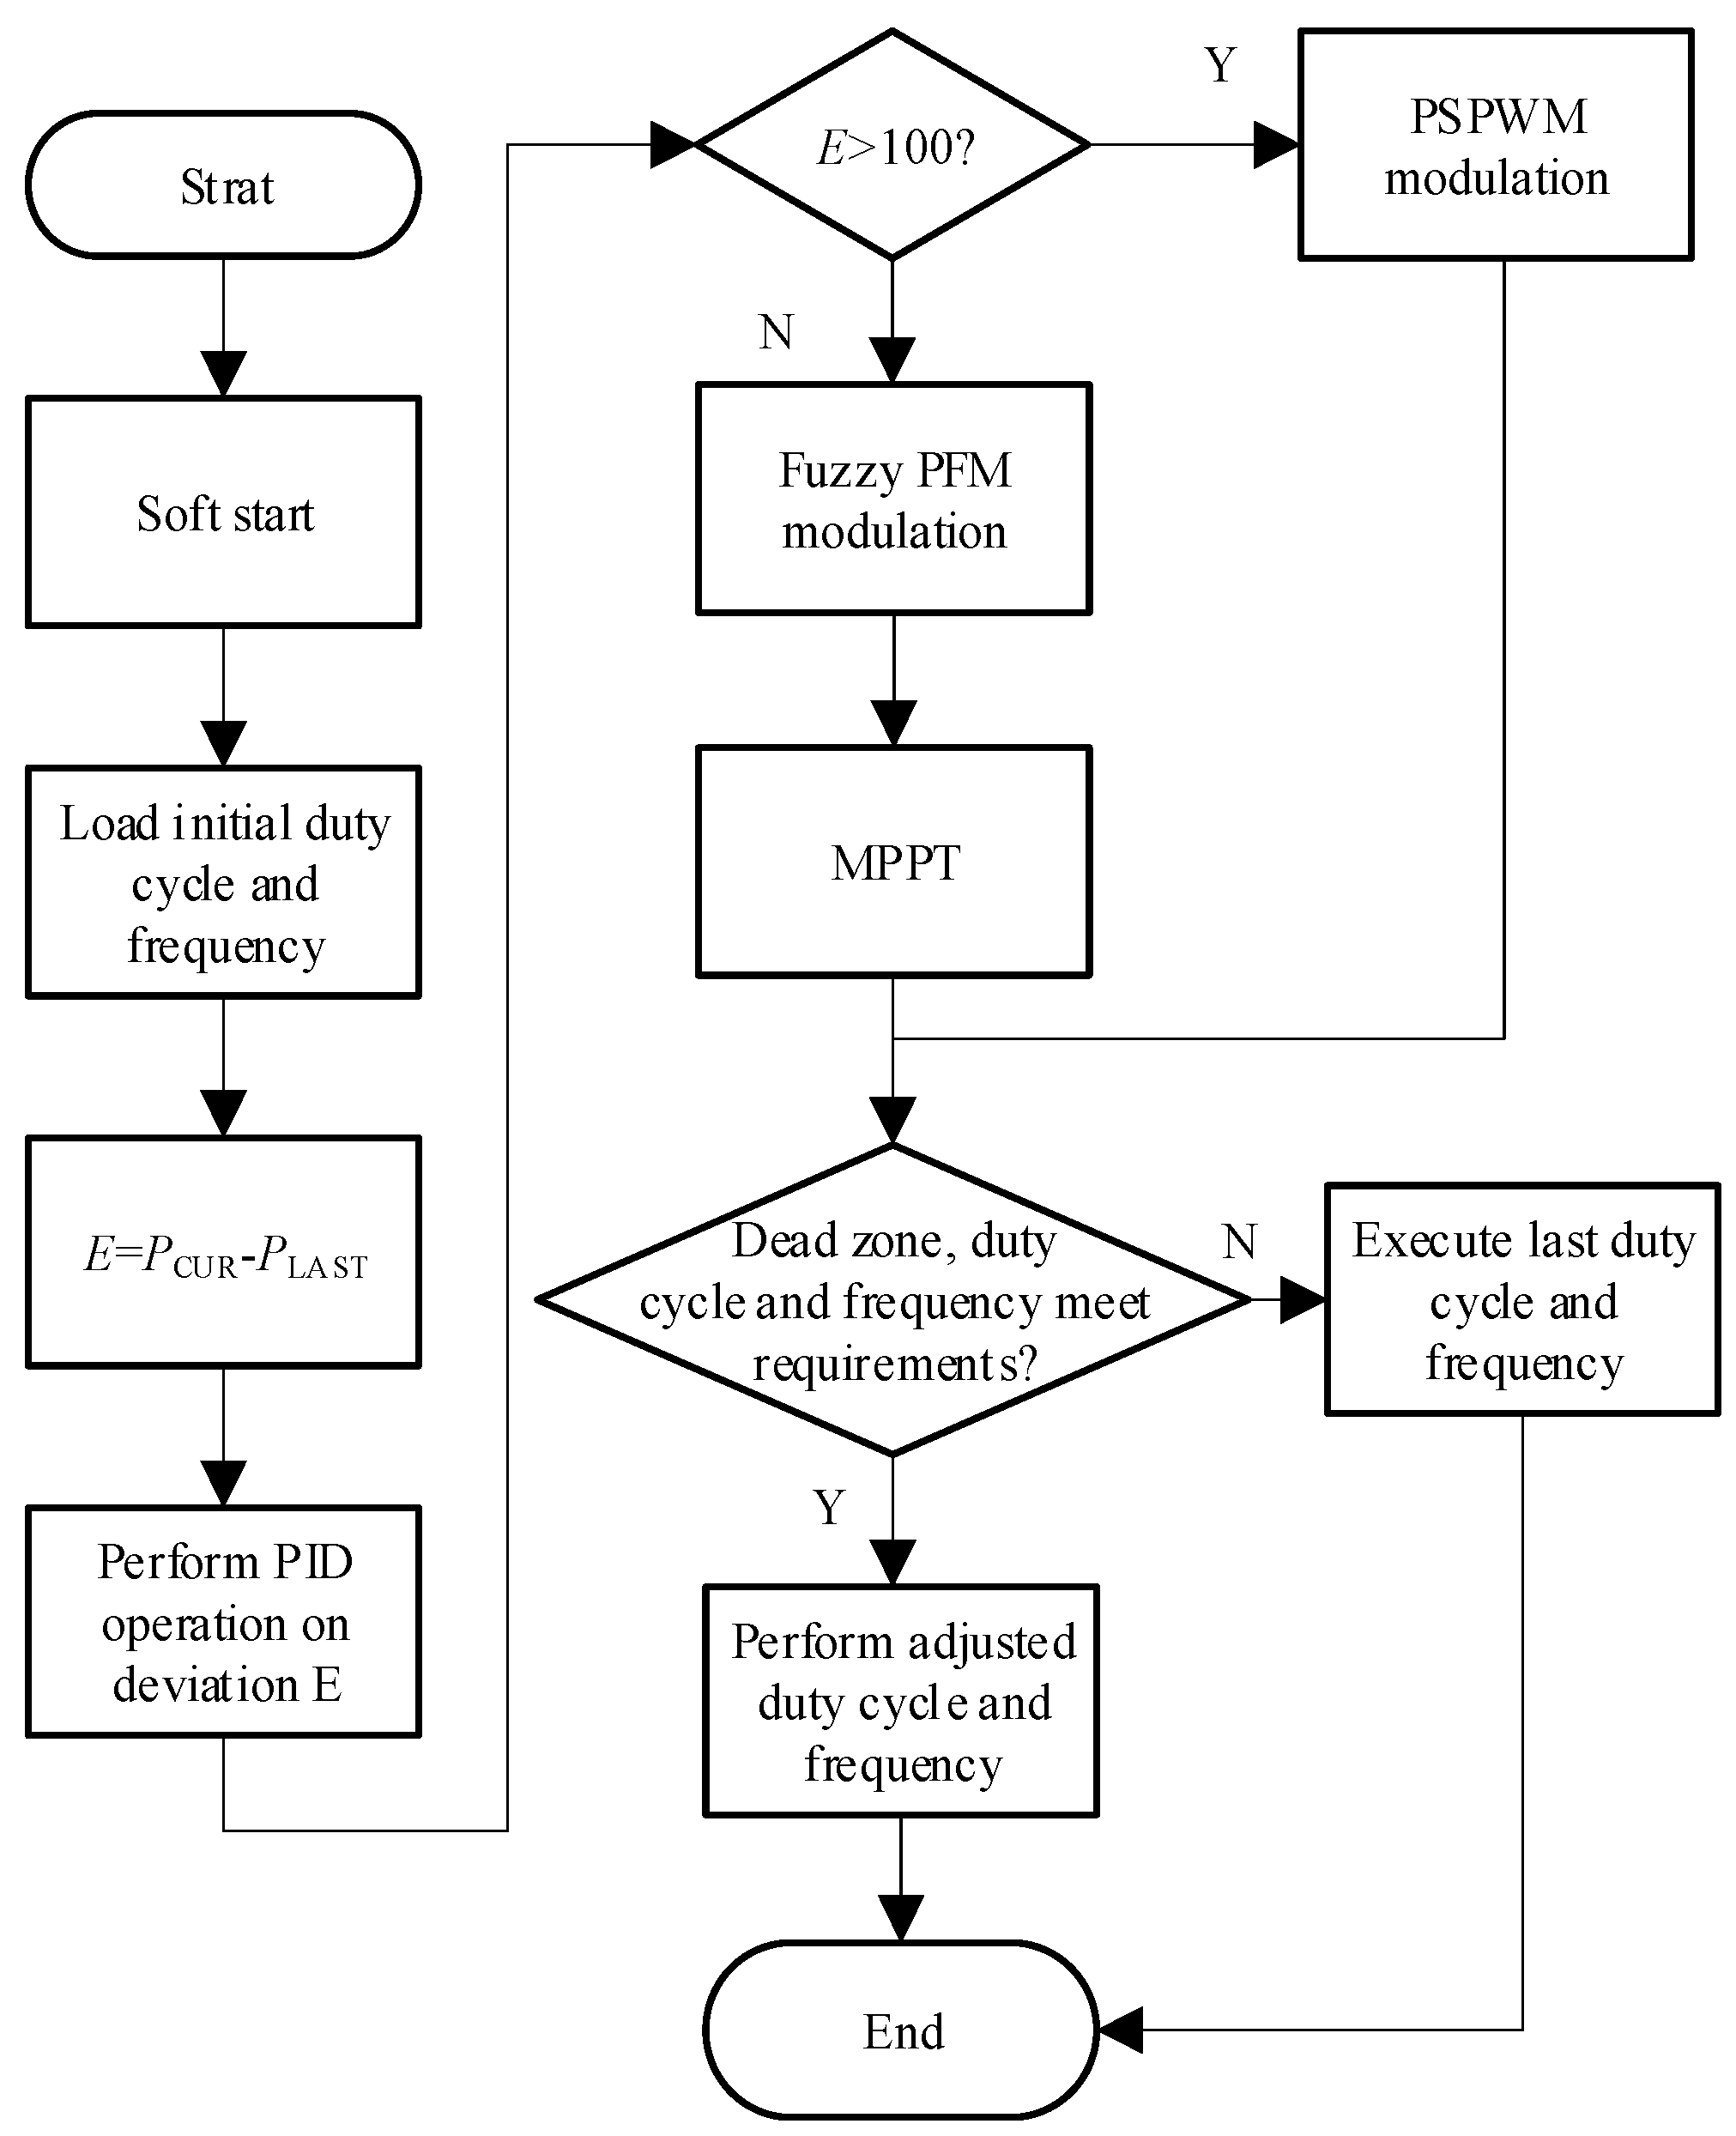
The program of the mixed modulation part of the main control chip is executed according to the flow chart shown in
Figure 5. After the system is powered on, soft start is carried out first. After arcing successfully, the system allocates an initial duty cycle and frequency to the driver according to the set power. Then the operation according to the deviation between the actual power value and the set power value is selected. If the deviation is greater than 100 W, the system adopts PSPWM modulation. The adjustment time of the system is reduced by using the characteristics of PSPWM rapid power adjustment, so as to ensure that the system has a larger power adjustment range. If the deviation is less than or equal to 100 W, the system adopts fuzzy PFM modulation and carries out maximum power tracking to ensure that the system works at the maximum power point under the current duty cycle, namely the resonant frequency point, to ensure that the system has a high-power factor and work efficiency.
There are many ways to judge whether the system works near the resonant frequency point. One is to use the zero-crossing detection circuit to detect the zero-crossing of the secondary current of the transformer, and to ensure that the output current and voltage are in the same phase through the phase-locked loop, so as to ensure that the system works in the resonant state. However, for the plasma with a nonlinear working state, its load is always in a dynamic equilibrium state with large fluctuation, which is easy to cause the false zero-crossing detection and make the calculation result wrong [
12].
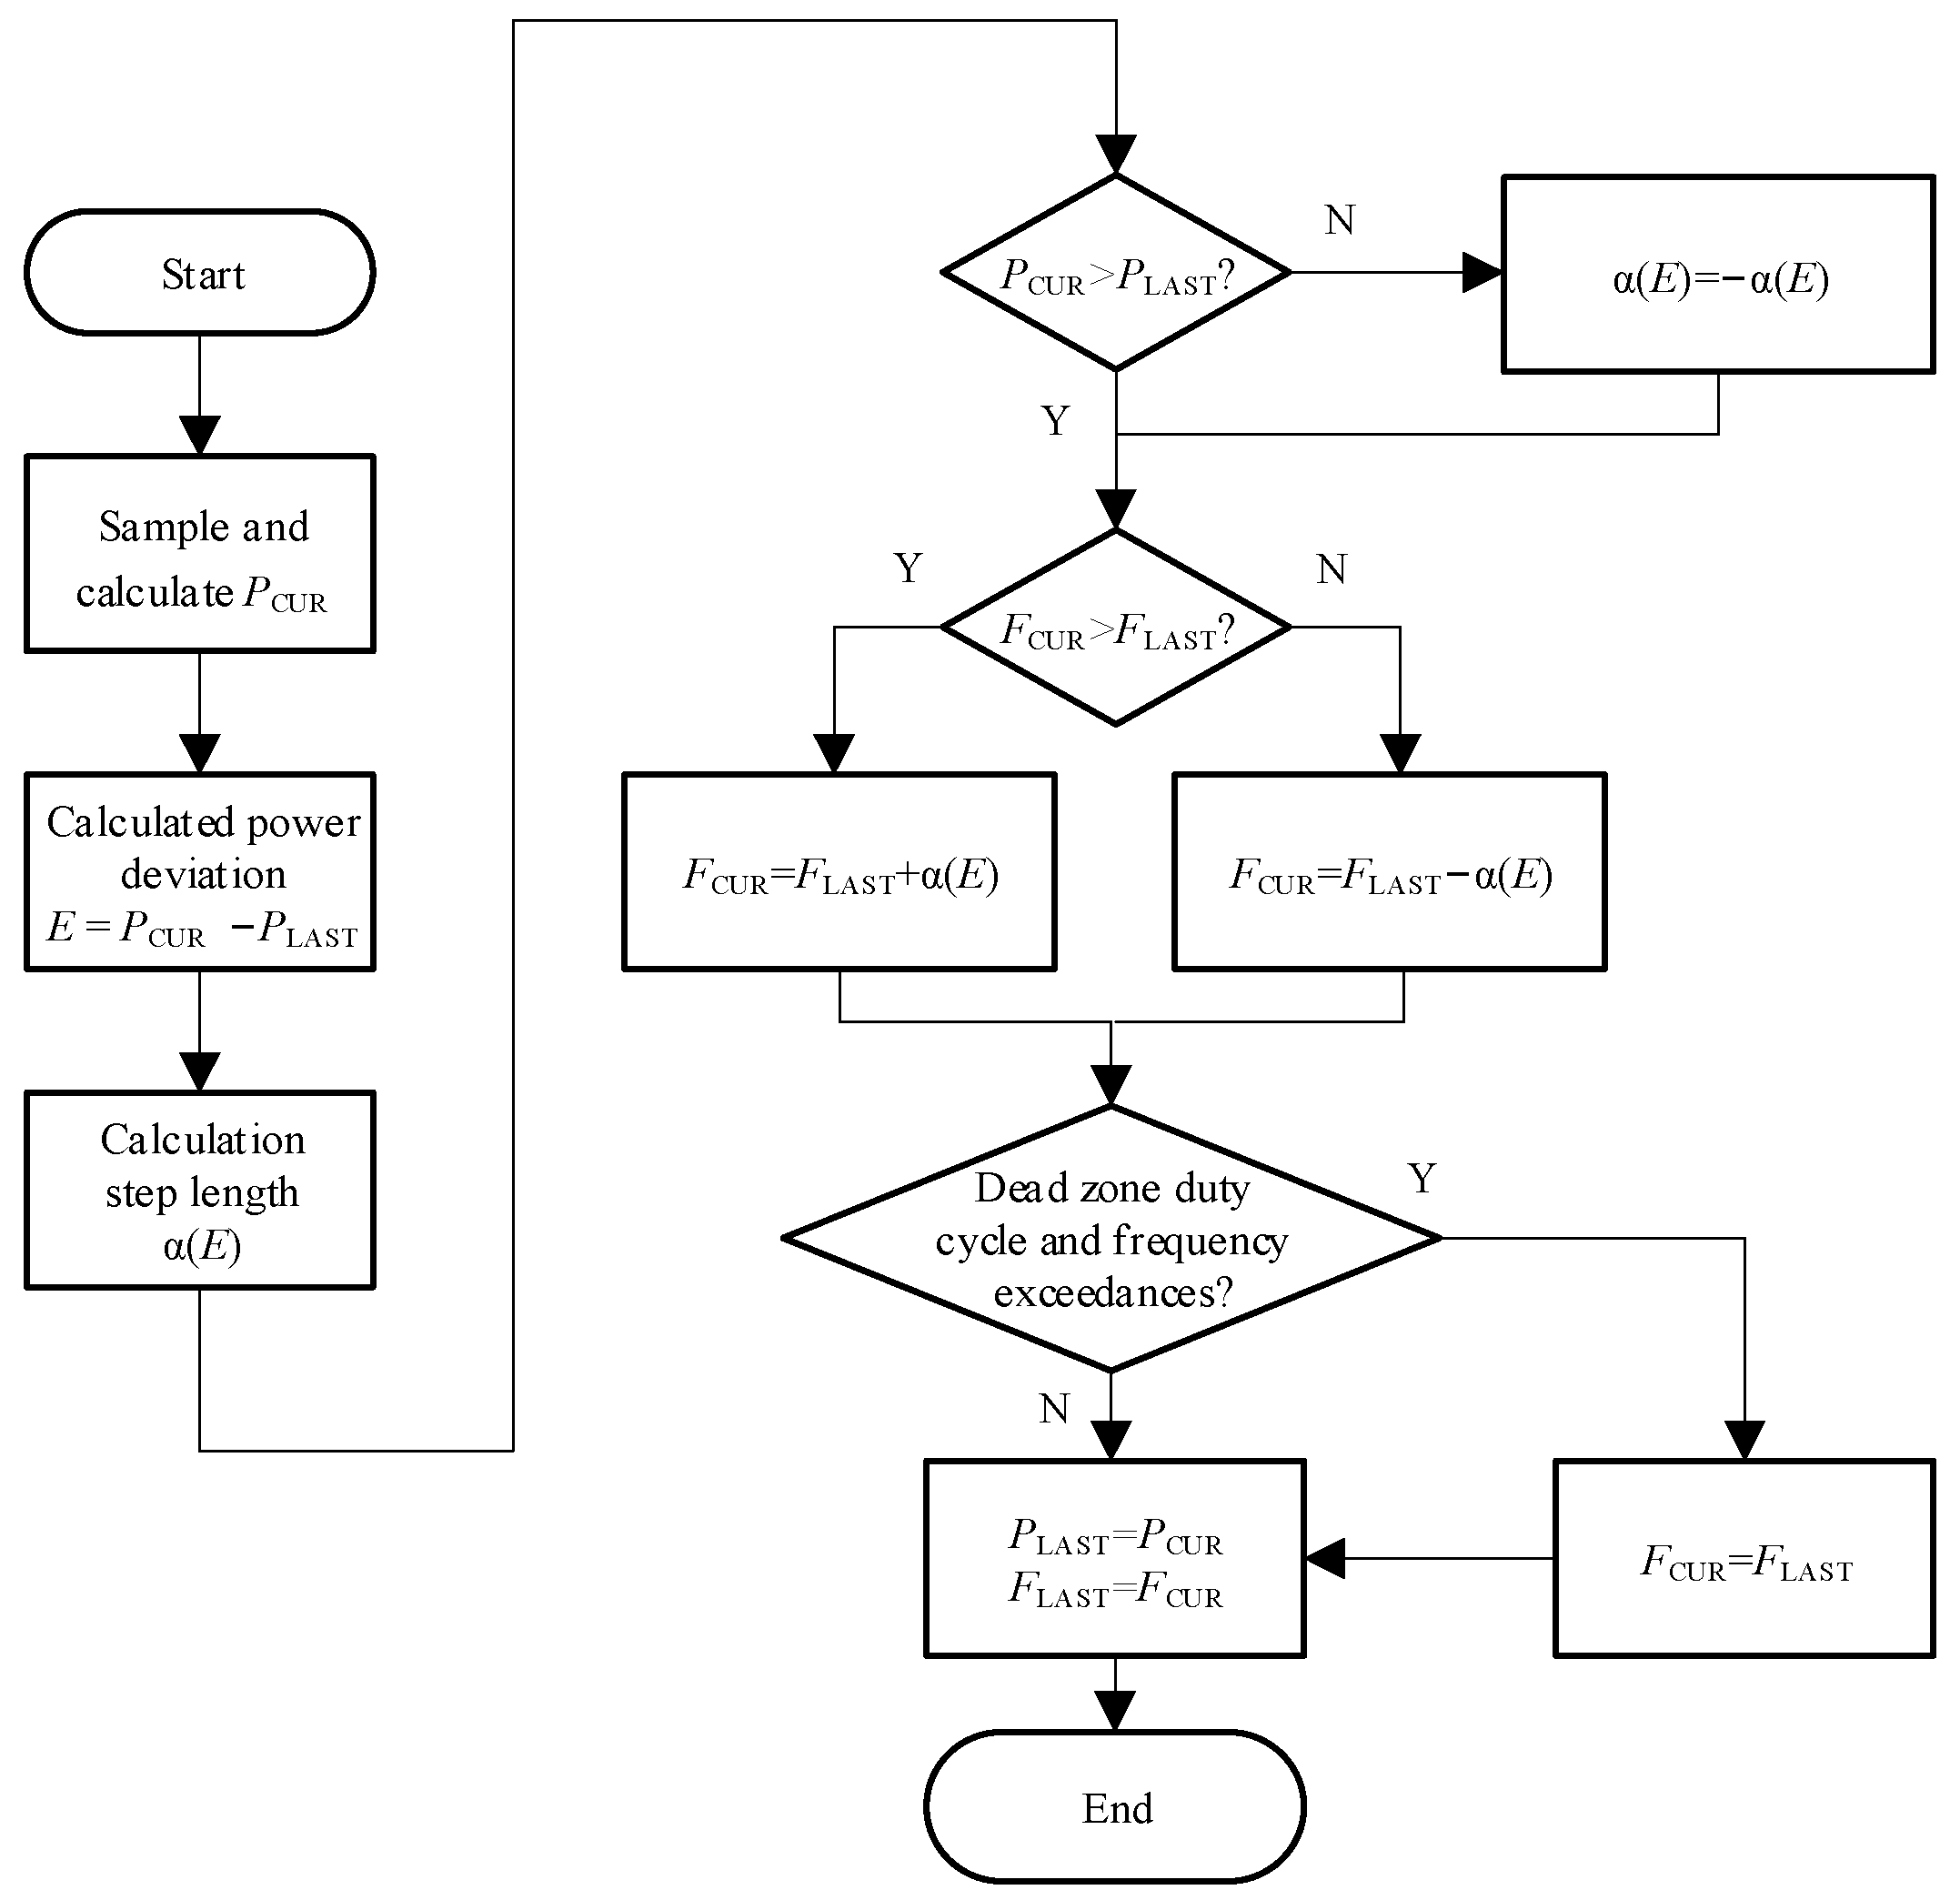
Another simple and effective method is to continuously disturb the working frequency of the system, and record the corresponding working voltage and current, so as to find the working frequency corresponding to the maximum output power of the resonant power supply system for plasma cleaning. According to the simulation results, when the system works near the resonant frequency, the active power output reaches the maximum value [
13]. Its control flow chart is shown in
Figure 6.
The actual output power P
CUR is calculated according to the sampled output voltage and current, and the power change value E is obtained by comparing it with the power at the last moment. Based on this, the disturbance step length α is calculated. Firstly, judge whether the current actual power P
CUR increases or decreases compared with the last power P
LAST. If it increases, the direction of disturbance is correct, and keep the direction of disturbance; otherwise, the disturbance will reverse. The increase or decrease of the frequency is determined according to the relationship between the current frequency F
CUR and the frequency F
LAST at the last time. Finally, judge whether the adjusted dead zone, duty cycle and frequency exceed the limit value. If not, the system will execute the adjusted frequency and update the power P
LAST and frequency F
LAST for the next calculation; otherwise, the frequency before the adjustment will be executed [
14].
Although the PFM perturbation method has the advantages of being simple and efficient, it is difficult to achieve accurate and efficient power tracking for such a nonlinear time-varying system as a plasma discharge power supply. However, the fuzzy controller does not need an accurate mathematical model for the controlled object, so it is very suitable for this system. Therefore, the maximum power tracking algorithm based on fuzzy PFM is adopted in this paper to ensure that the system works near the resonant frequency point [
15].
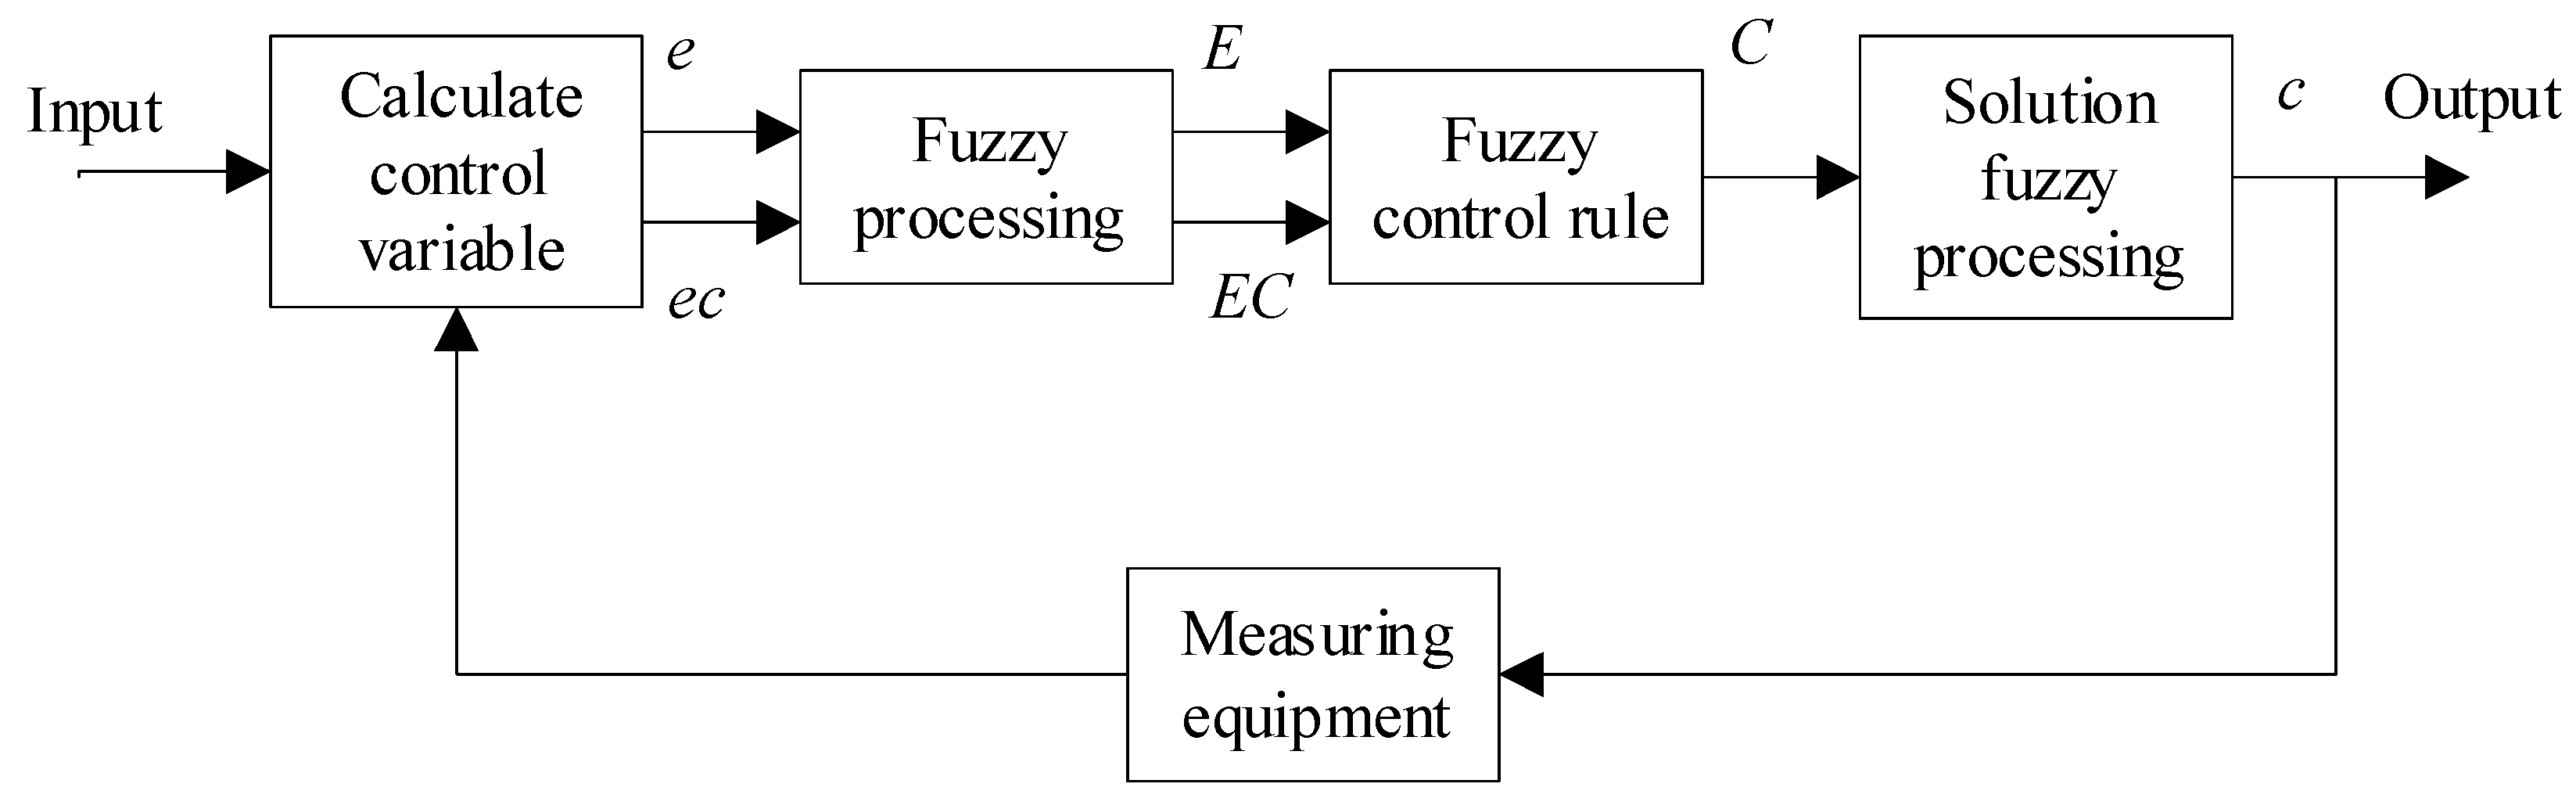
Figure 7 shows the working principle of the fuzzy controller. The system errors E and EC are obtained by the quantitative calculation of input and feedback, which are used as the input of the fuzzy controller. Control variables were fuzzified, fuzzy domains and corresponding membership functions were determined, and E and EC were obtained. Then, according to the pre-established fuzzy control rules, the decision is made, and the fuzzy output C is obtained. The fuzzy output C is de-fuzzified to obtain the actual control quantity C, which is sent to the control mechanism to complete the whole control process [
16].
The control variables of the algorithm are system output power and frequency, respectively. The input
e and
ec of the fuzzy controller are their corresponding changes, namely:
The output parameter
c is the disturbance amount to the driving signal frequency of the full-bridge switch tube, namely:
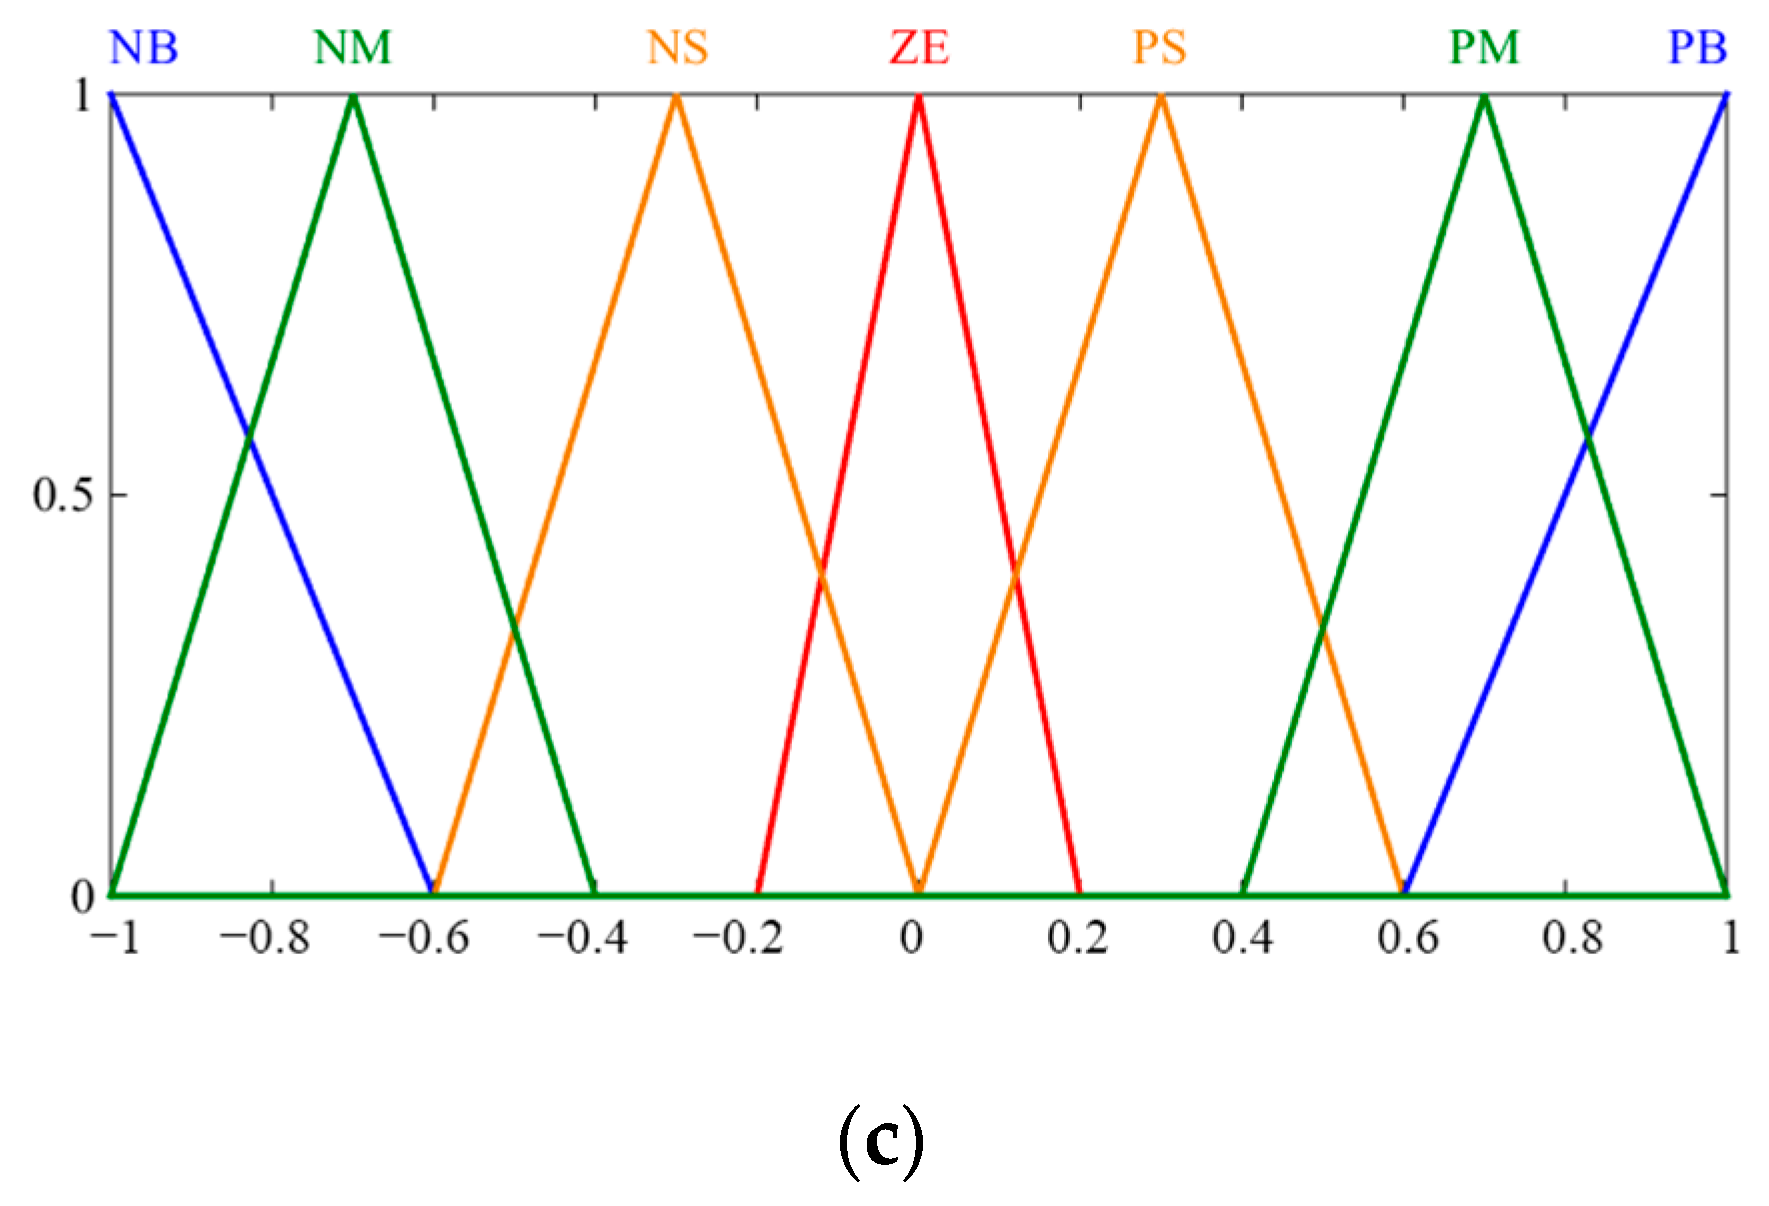
The fuzzy theory domain of input
e,
ec, and output
c is set as
E =
EC =
C = [−1, −0.8, …, 0.8, 1], with a total of 11 grades. The value of parameter variation and control quantity can be expressed by fuzzy subsets. The fuzzy subsets of power variable e and output control variable
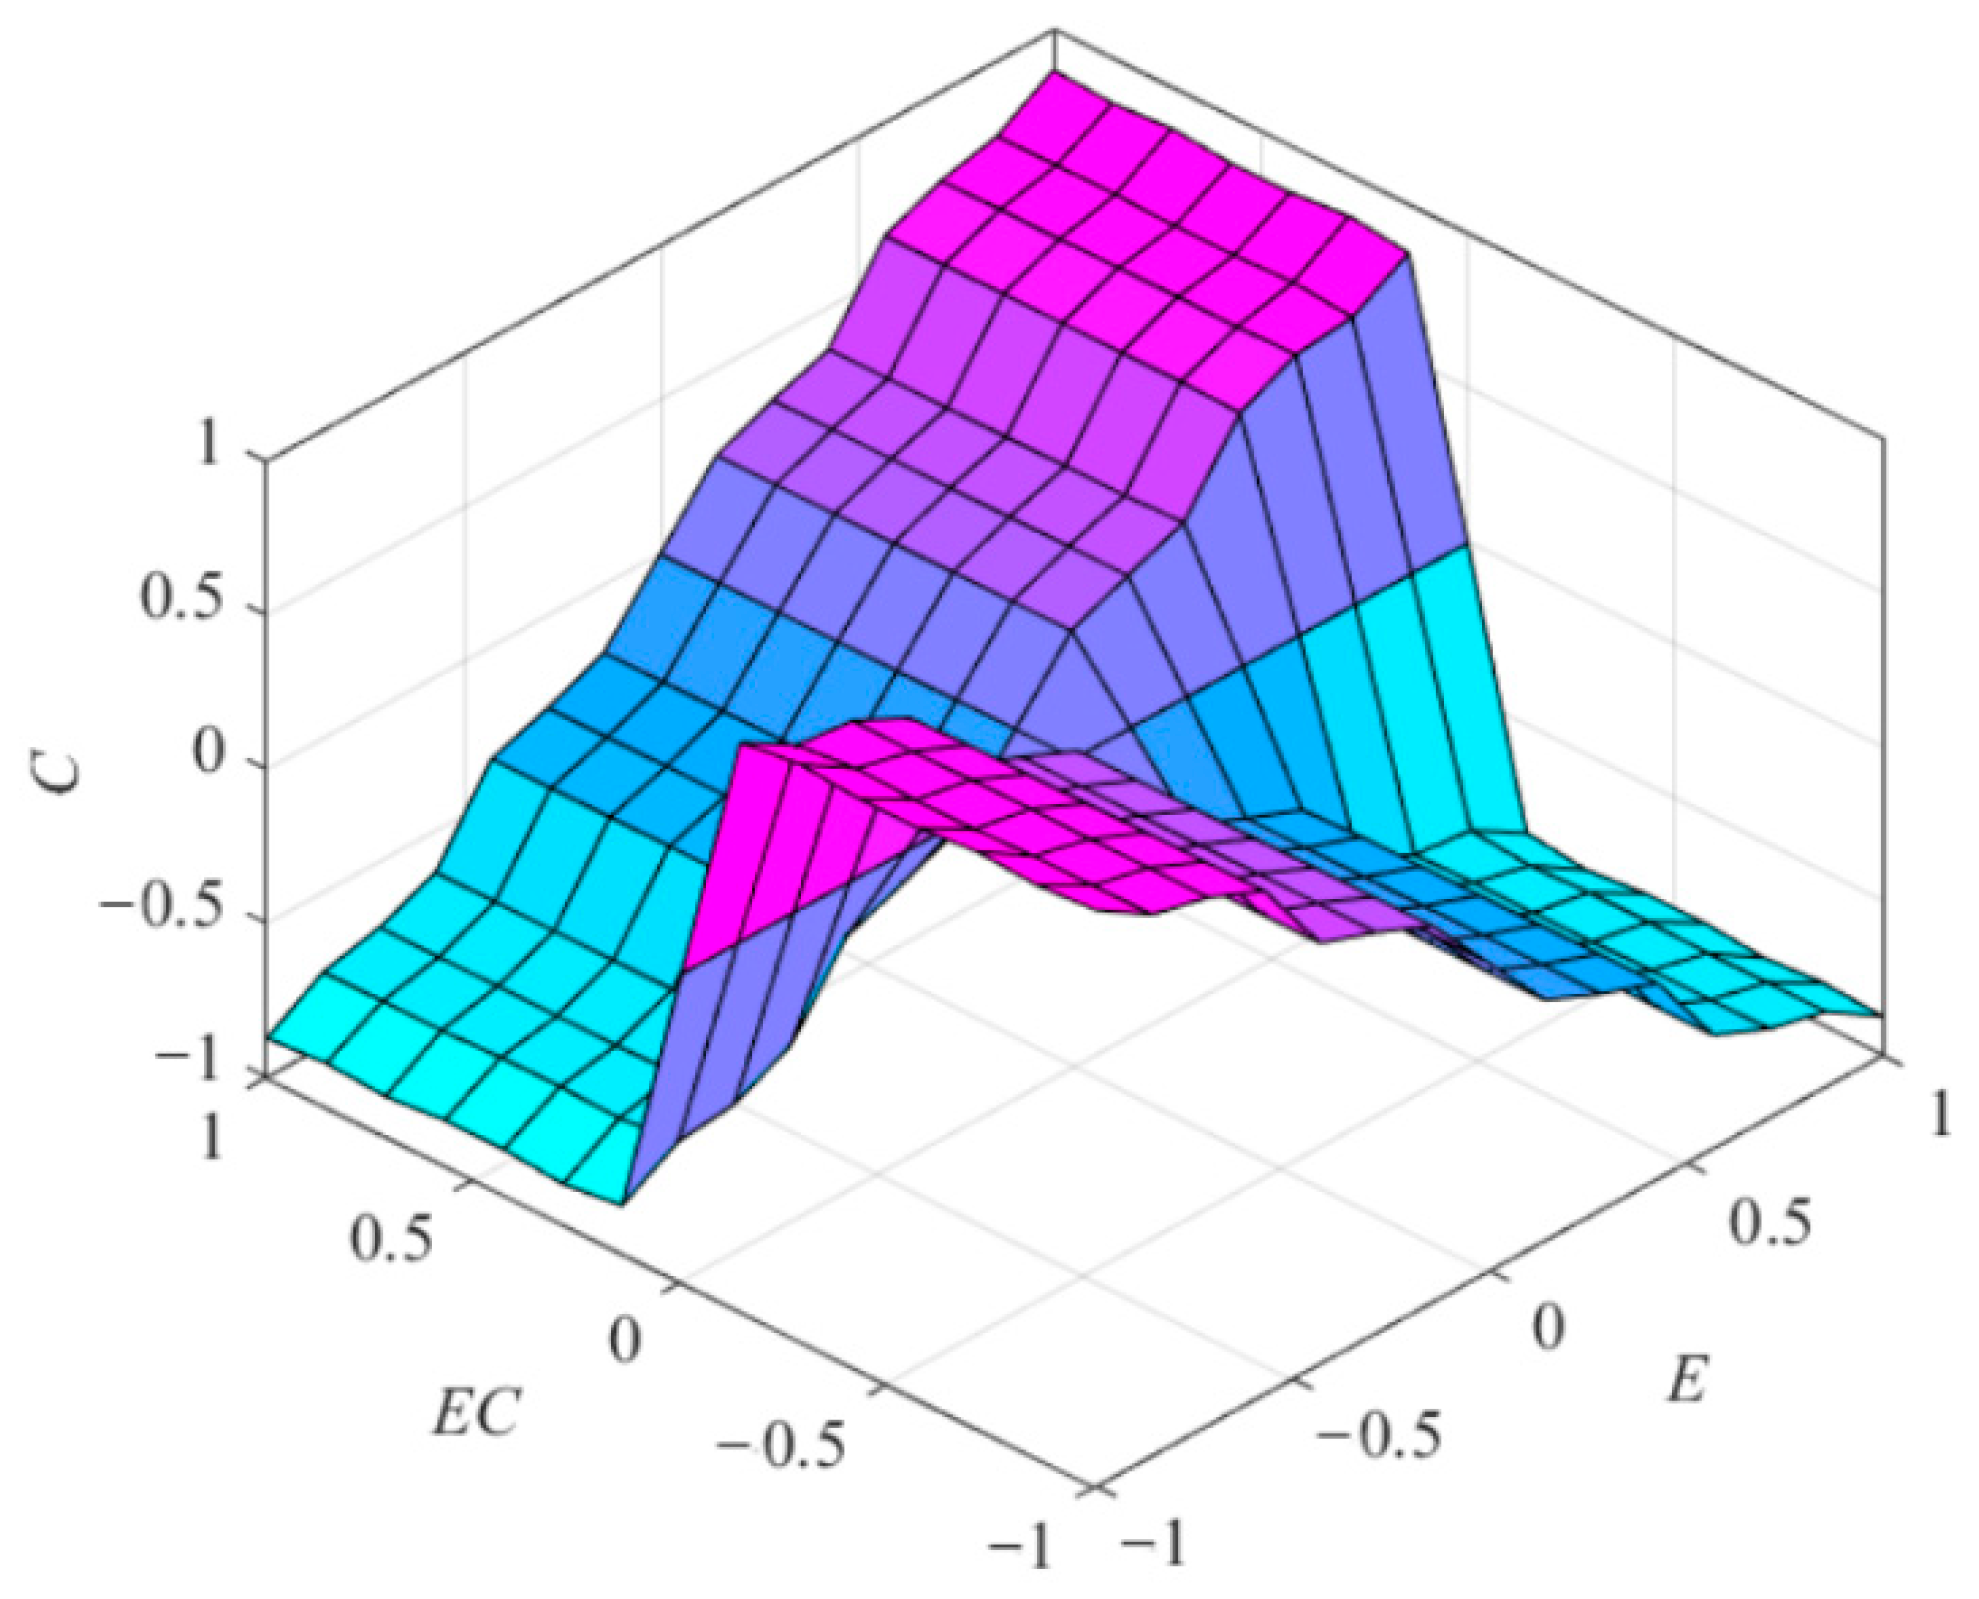
c are represented by seven fuzzy languages: “positive big (PB), positive median (PM), positive small (PS), zero (ZE), negative small (NS), negative medium (NM), and negative big (NB)”. EC, the fuzzy subset of frequency variation, is expressed by six fuzzy languages: “PB, PM, PS, NS, NM, NB”. The relationship between each input quantity and each fuzzy subset is represented by membership function. Membership curves of
E,
EC, and
C are shown in
Figure 8.
After the fuzzy processing is completed, the corresponding fuzzy control rules can be formulated. They are formulated according to human experience. The design idea is: when the power change is positive, the disturbance direction is proved to be correct, and the direction of output control quantity and frequency change quantity should be consistent, otherwise, the reverse operation should be carried out. The control quantity is consistent with the power change quantity, that is, when the system is close to the maximum power point, the power change quantity is small, and the disturbance quantity should be kept small, otherwise the control quantity should be kept large. The fuzzy control rules are shown in
Table 2 and
Figure 9, and the corresponding 3D surface of the fuzzy control rules is shown in
Figure 8 [
17].
After the above steps, the output quantity C needs to be de-fuzzified and converted into the actual control quantity, so as to realize the modulation of the driving frequency. In this paper, the gravity center method is adopted to solve the ambiguity, and its formula is:
where,
c is the output of the fuzzy controller,
Ui is the center value of the output corresponding to the membership function interval, and
μ(
Ui) is the membership degree corresponding to
Ui [
18].
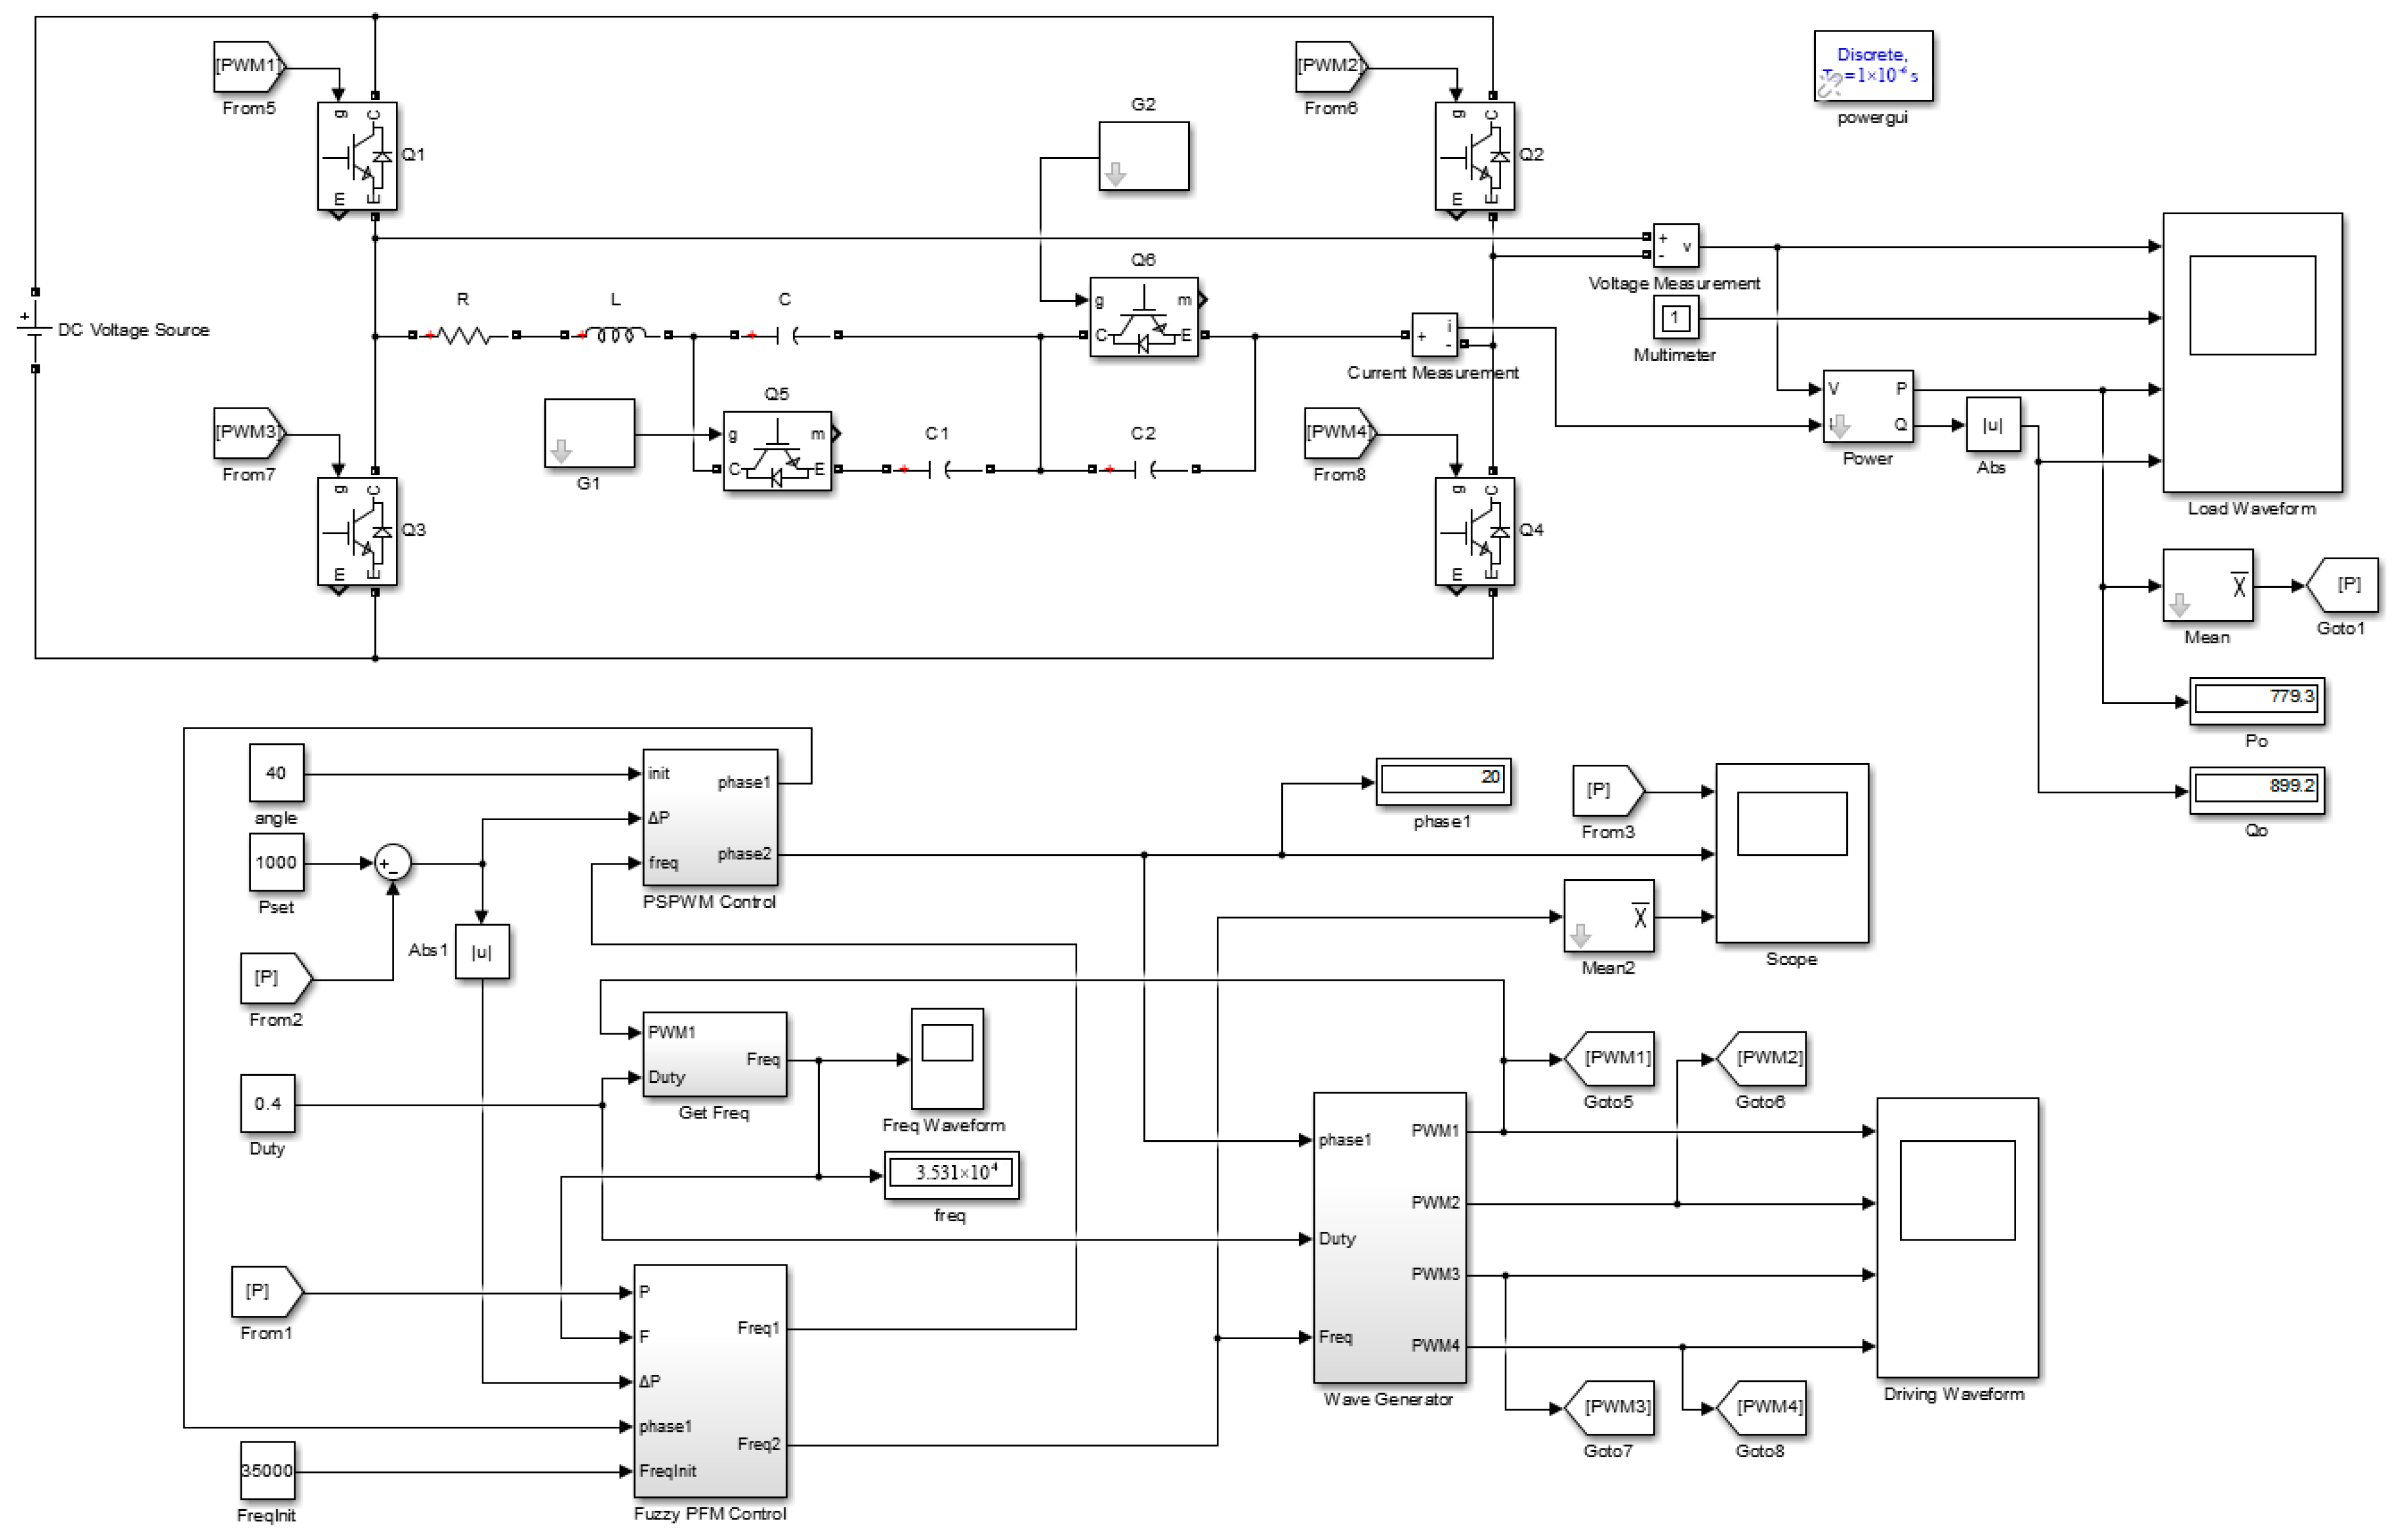
A model is built in Simulink to simulate the above hybrid modulation algorithm and the maximum power tracking algorithm based on fuzzy PFM, as shown in
Figure 10. The upper part of the figure consists of the main circuit of the phase-shifted full bridge and its load. In order to simulate the mutation of the load caused by perturbation, capacitors C
1 and C
2 are connected in parallel or in series at the equivalent load. They are controlled by pulse signals G
1 and G
2 and switch transistors Q
5 and Q
6, respectively, so as to introduce perturbation at specific time points. The lower part is a hybrid modulation algorithm, including a frequency estimator, a PSPWM controller, a fuzzy PFM controller, and a drive signal generator.
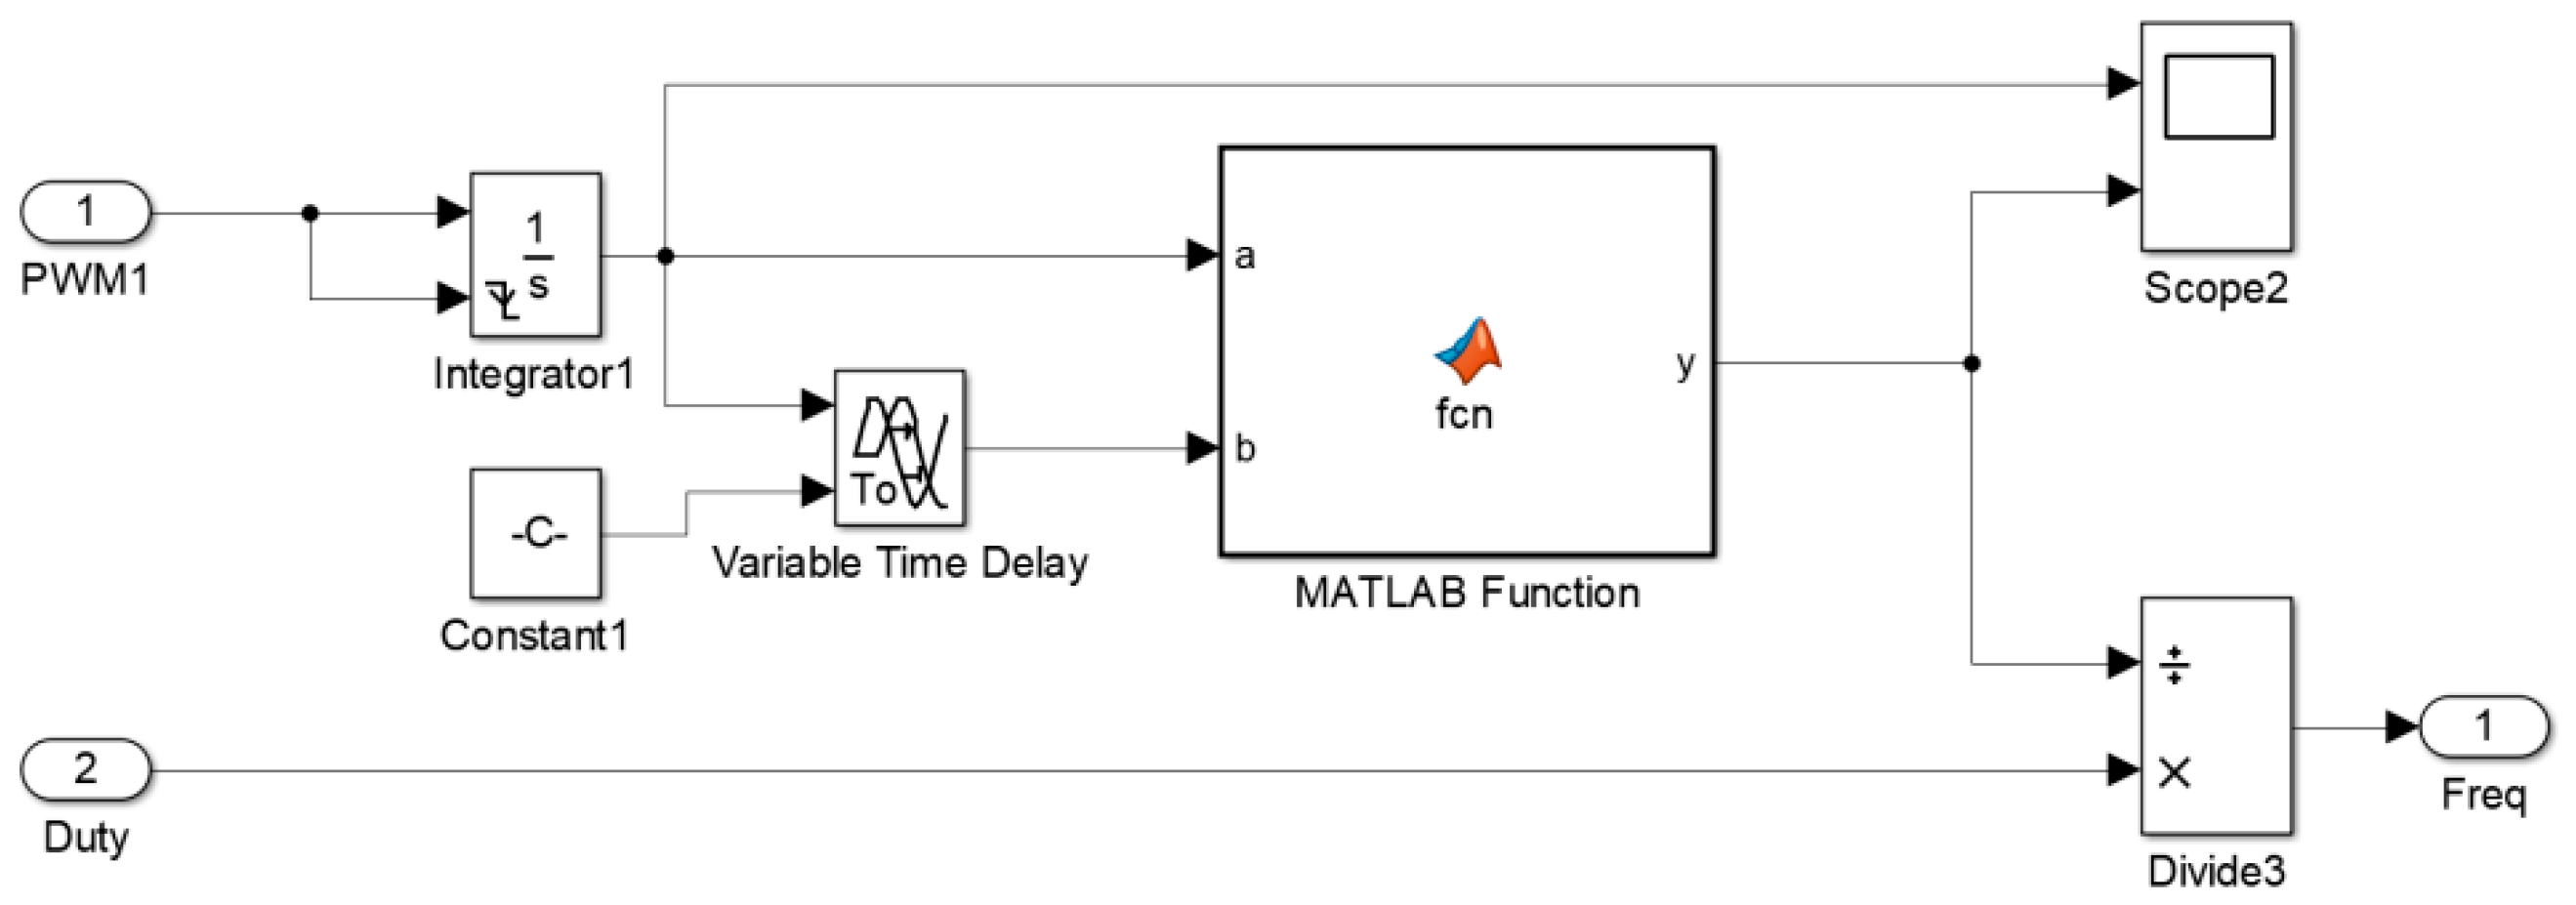
Figure 11 shows the internal structure of a frequency estimator. This circuit is used to obtain the working frequency of PWM. Firstly, the single PWM (Pulse Width Modulation) waveform is integrated, and then the peak point is sampled by the delay circuit and comparison function. Finally, the working frequency of the corresponding time point is derived by the duty cycle.
Figure 12 shows the internal structure of a PSPWM controller. The module detects the frequency and power error of the system in real time. Once the power error is above 100 W, or the frequency deviates to the upper and lower limits during frequency modulation, namely 2.5 Hz and 6.5 kHz, the module starts to work and realizes power control by adjusting the phase shift angle [
19].
The internal structure of the fuzzy PFM controller is shown in
Figure 13. Firstly, the power and frequency of the system are sampled and preprocessed, and the variation value is obtained and input into the fuzzy controller. The output value, as the variation of frequency, is added to the initial frequency and sent to the PFM modulator. When the power error is less than 100 W, or the phase shift angle deviates to 20° or 70°, the module starts to work to realize the maximum power tracking under the current duty cycle of the system, prevents the system from deviating from the resonant frequency due to external perturbation, and ensures the working efficiency of the system.
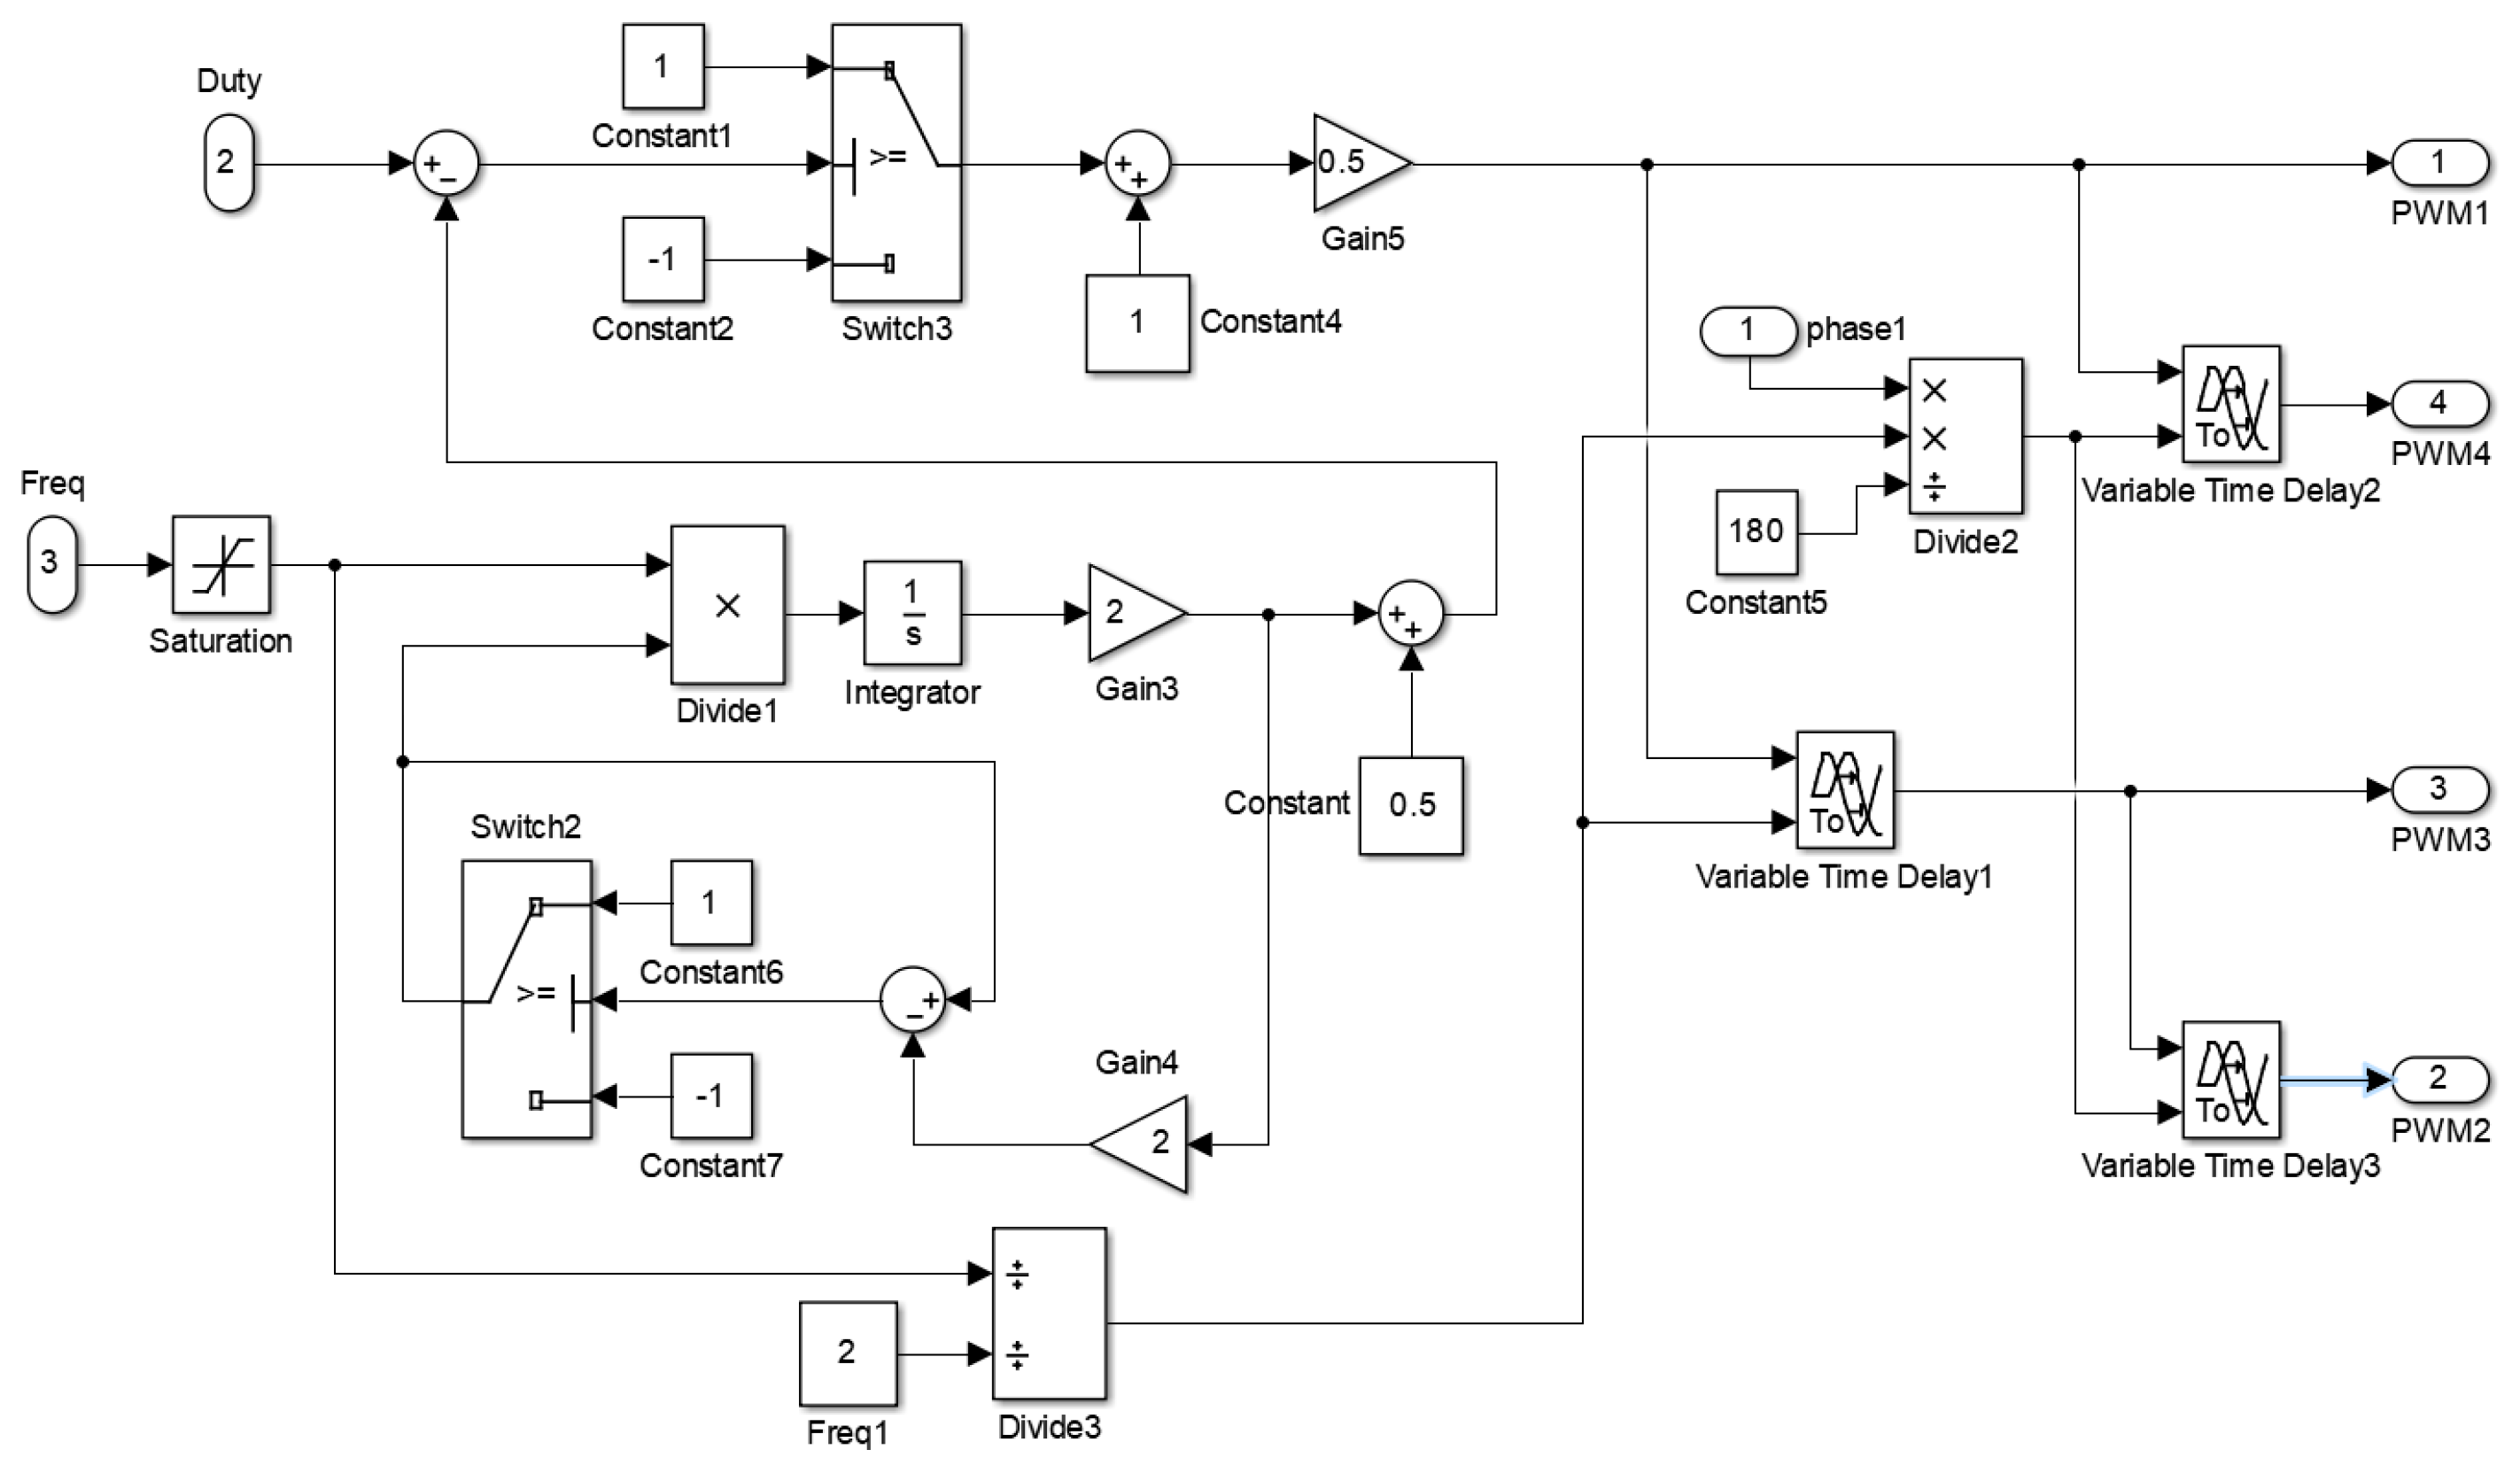
Figure 14 shows the internal structure of the driver signal generator. The module uses an integrator and flip comparator to convert the adjustable digital input signal into an adjustable triangular wave signal, and then compares the triangular wave with the duty cycle signal to generate a pulse waveform with an adjustable frequency. A delay device is used to generate a four-channel PWM waveform with a phase shift angle, which is used to drive the full-bridge circuit [
20].
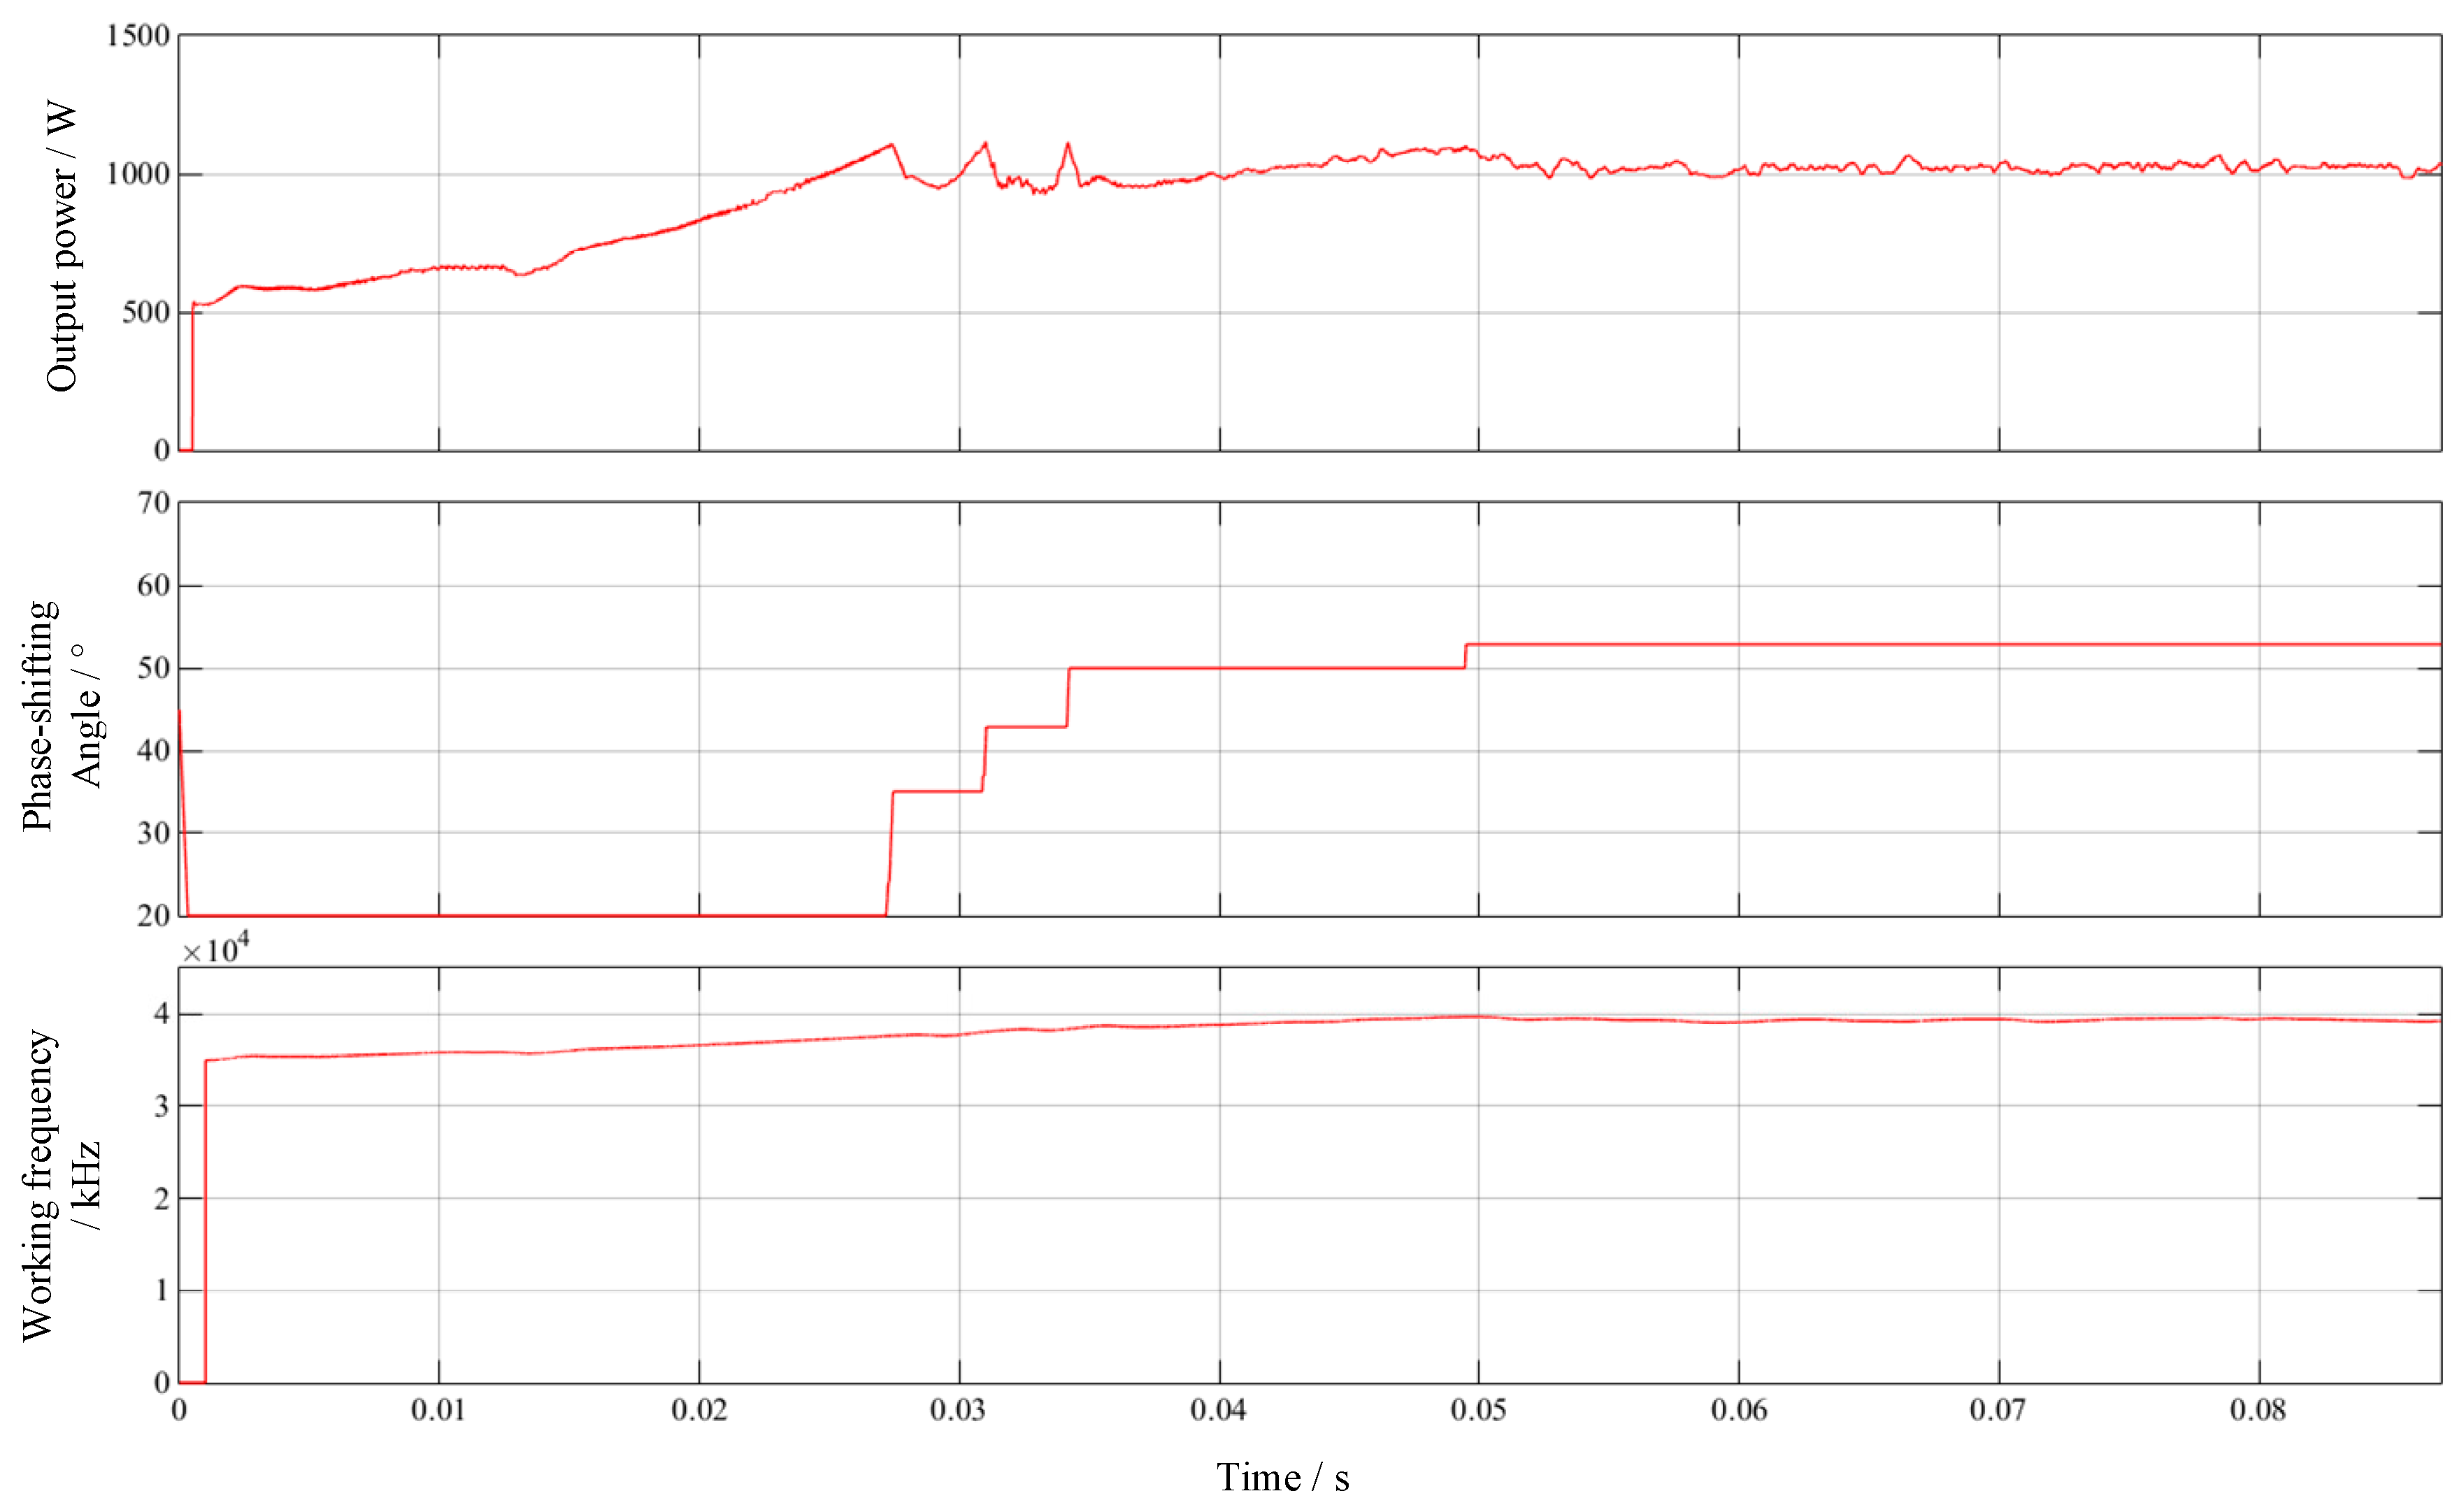
Adjust the equivalent load of the system, set the resonance frequency of the system as 42.54 kHz, the initial operating frequency as 35 kHz, the initial phase shift angle as 45°, the duty cycle as 0.4, and the output power as 1000 W to simulate the system.
Figure 15 shows the output power, phase shift angle, and operating frequency. As can be seen from the figure, after 0.05 s, the output power of the system is stable at about 1000 W, the phase shift angle is stable at 53°, and the working frequency is stable at about 40 kHz. It can be seen that the hybrid modulation algorithm has the advantages of a fast adjustment speed, a high-adjustment precision, and is operable.
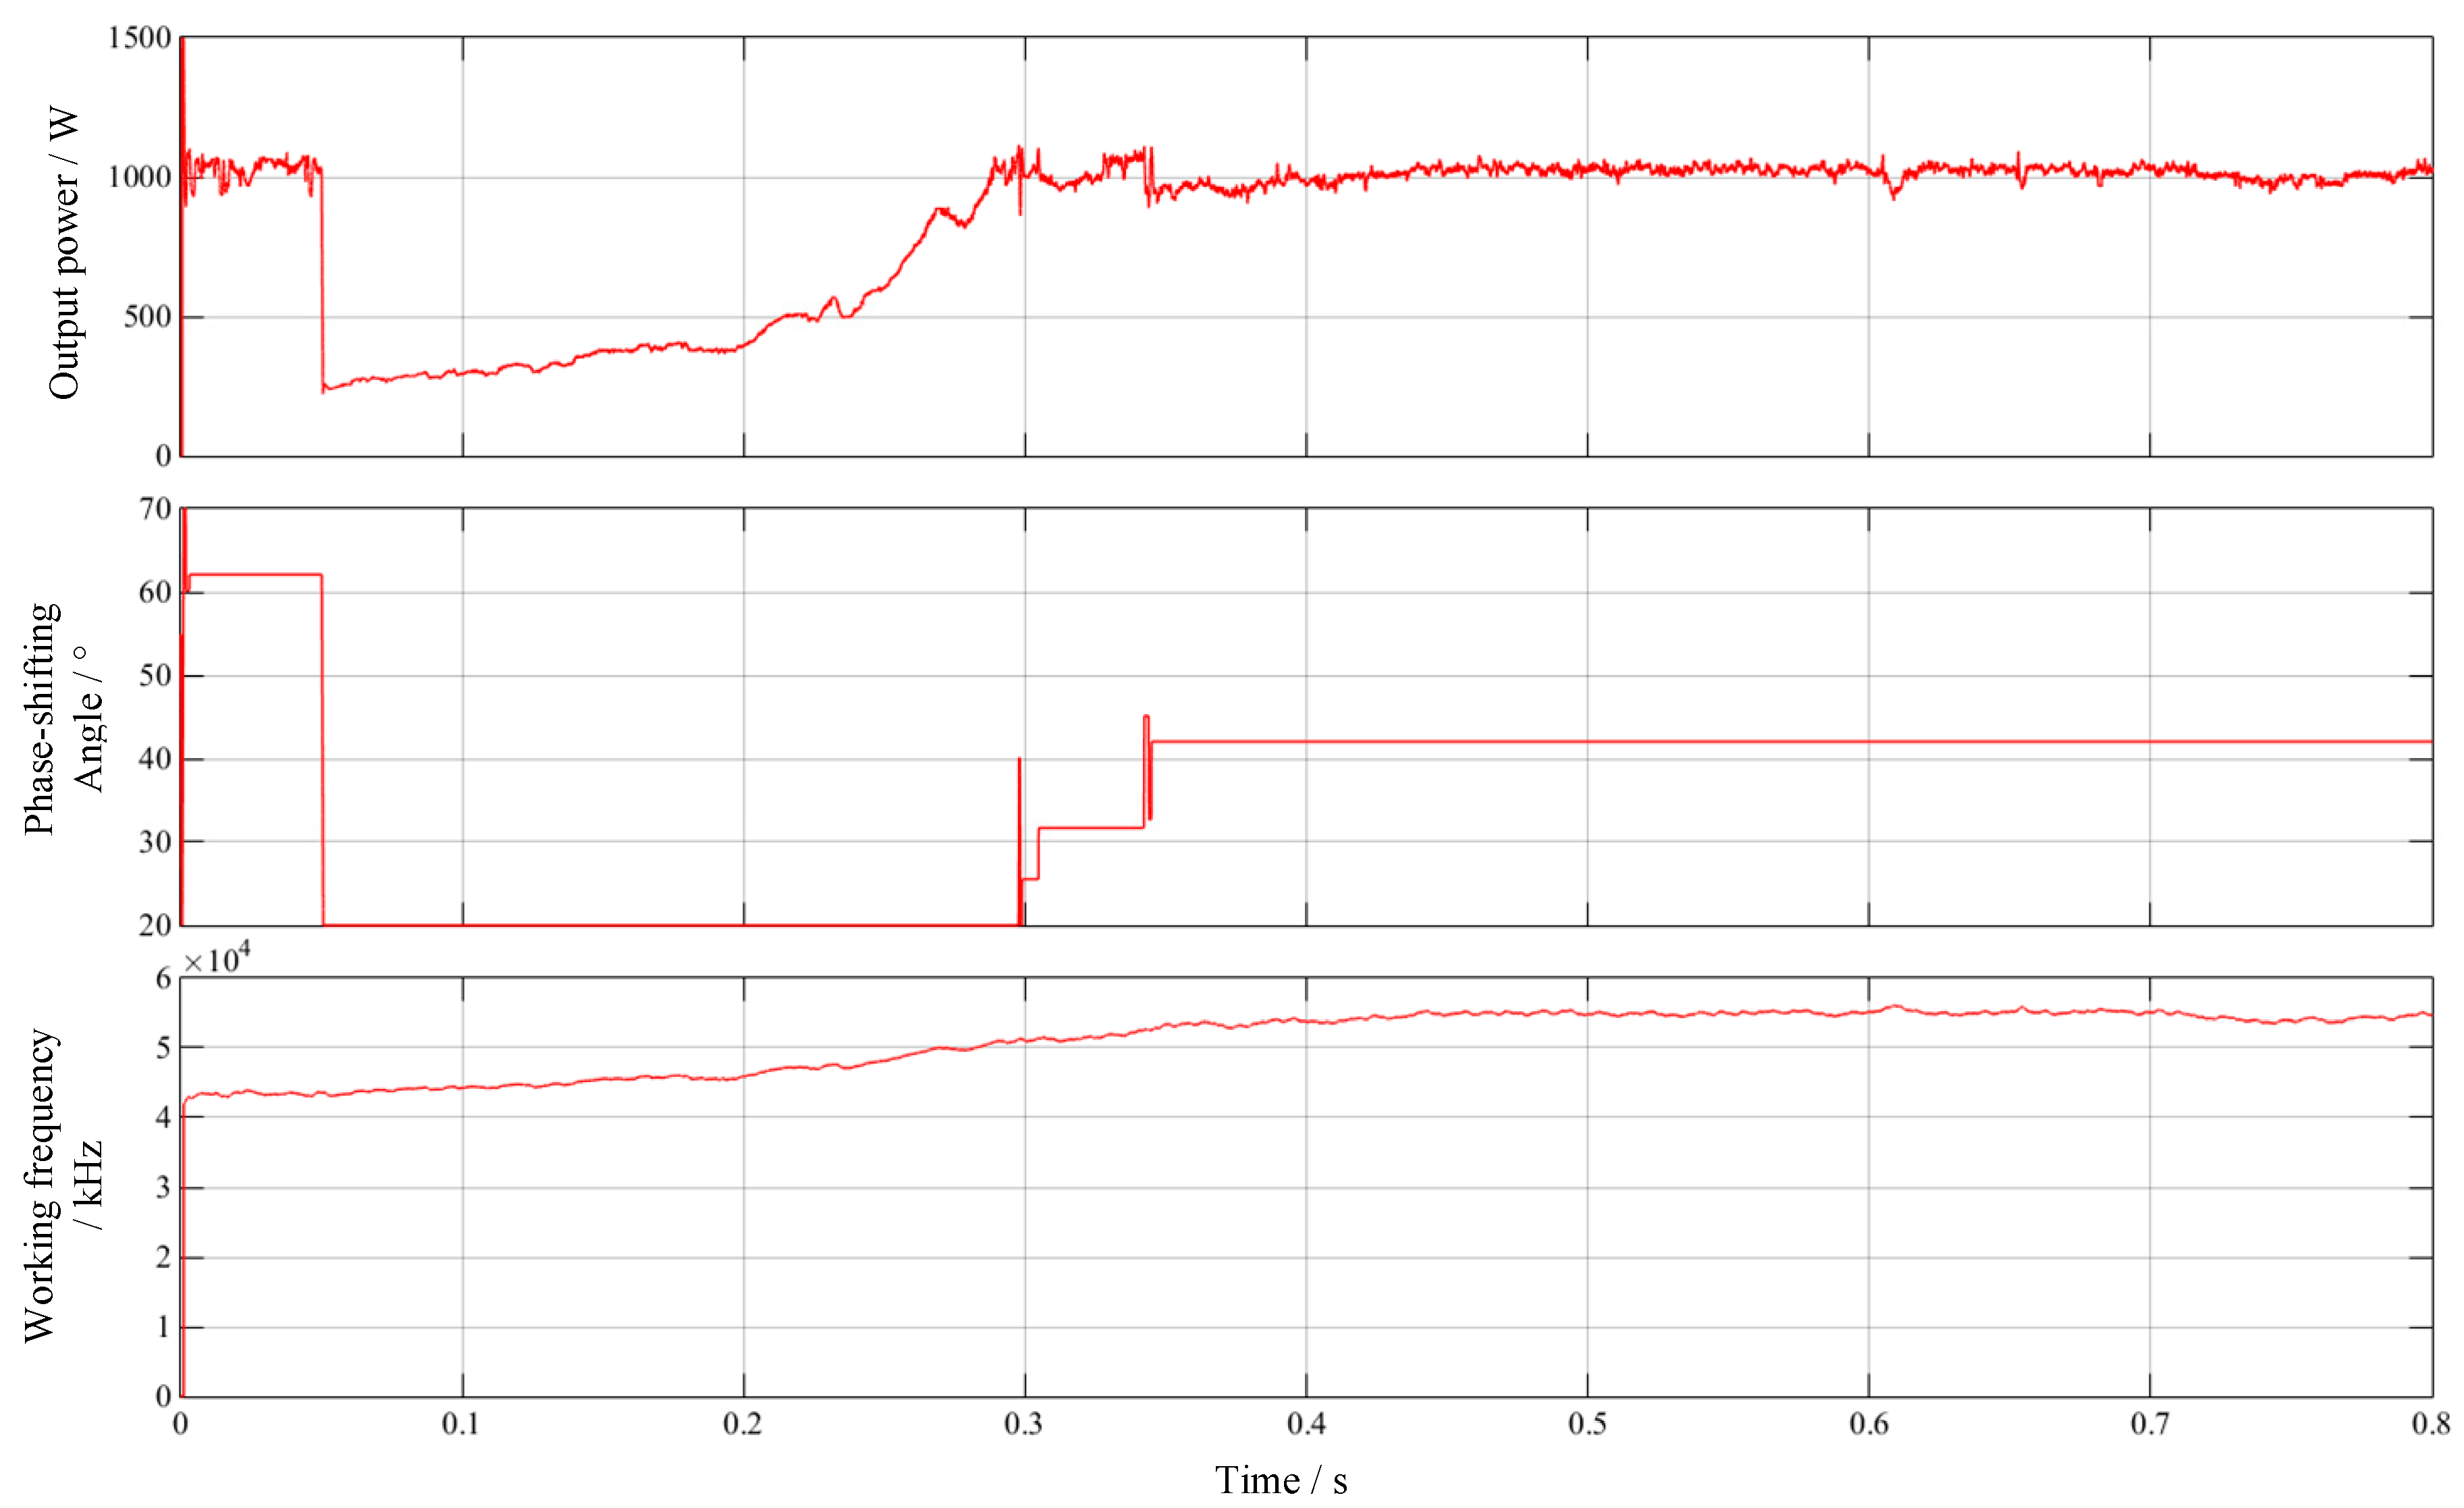
Set the initial operating frequency of the system as 40 kHz, the initial phase shift angle as 55°, the duty cycle as 0.4, and the target output power as 1000 W. At 0.05 s, the parallel capacitor C
1 perturbation is introduced, and its capacitance value is 25 nF, that is, the equivalent load capacitance of the system increases from 35 nF to 60 nF at 0.05 s, and the anti-perturbation performance of the system is simulated.
Figure 16 shows the output power, phase shift angle, and operating frequency.
As seen in
Figure 16, at 0.05 s the load capacitance spurts resulting in the system and the resonance frequency of the power of the output power falling sharply. The error of the algorithm to detect the output power is very big and tries to improve the power output by rapidly reducing the phase-shifting angle. When the phase-shifting angle adjustment to the lower limit of 20° still cannot meet the needs of power set, the maximum power tracking algorithm based on fuzzy PFM starts to work. During the period of 0.05 s to 0.25 s, the operating frequency of the system decreases, and the resonant frequency point is constantly approached, so that the output power increases. During the period from 0.25 s to 0.46 s, the working frequency continues to decrease and approach the resonant frequency, so as to maintain the maximum efficiency of the plasma power supply, but the output power should be stable at 1000 W and cannot continue to rise. At this time, PSPWM takes effect, making the working frequency track the resonant frequency point while the output power remains stable. Finally, after 0.46 s, the output power, phase shift angle, and operating frequency of the system stabilize at about 1000 W, 60°, and 32 kHz, respectively.
Under the same conditions, the C
2 perturbation of the series capacitor is introduced at 0.05 s with a capacity of 46 nF, that is, the equivalent load capacitance of the system drops from 35 nF to 19.88 nF at 0.05 s. The anti-perturbation performance of the system is simulated, and the simulation results are shown in
Figure 17.
As can be seen from
Figure 17, at 0.05 s, the sudden change of load leads to a sharp decline in system output power, and the phase shift angle is rapidly adjusted to the lower limit of 20°, but the actual output power is still too small. The maximum power tracking algorithm based on fuzzy PFM takes effect at this time. From 0.05 s to 0.3 s, in this period of time the working frequency continues to rise close to the resonant frequency point, and the output power increases to about 1000 W. During the period from 0.3 s to 0.35 s, the working frequency continues to rise, but the output power should be stable at 1000 W. At this time, PSPWM takes effect and keeps the output power stable by increasing the phase shift angle to offset the influence of frequency increase on the output power. Finally, after 0.35 s, the output power, phase shift angle, and operating frequency of the system stabilize at about 1000 W, 42°, and 55 kHz, respectively.
To sum up, the PSPWM-PFM hybrid modulation algorithm has the characteristics of a fast response speed and a high adjustment accuracy, while the maximum power tracking algorithm based on fuzzy PFM enables the system to have the ability of self-correction when disturbed, so that the system keeps working near the resonant frequency point with high efficiency. Therefore, the application of this algorithm in the field of resonant power supply for plasma cleaning is feasible.
4. Analysis of Test Results
Based on the hardware circuit design and control strategy analysis in the previous sections, the prototype is developed, and the corresponding experimental platform is built. The key circuit point waveform of the prototype was tested, and the power regulation experiment was conducted to verify the relationship between the output active power, phase shift angle, and working frequency. The performance of three different modulation methods were compared and tested to verify the advantages of the hybrid modulation algorithm in the comprehensive efficiency, and the cleaning effect of the plasma cleaning machine was tested. At the same time, the influence of various factors on the cleaning effect of plasma cleaner is verified.
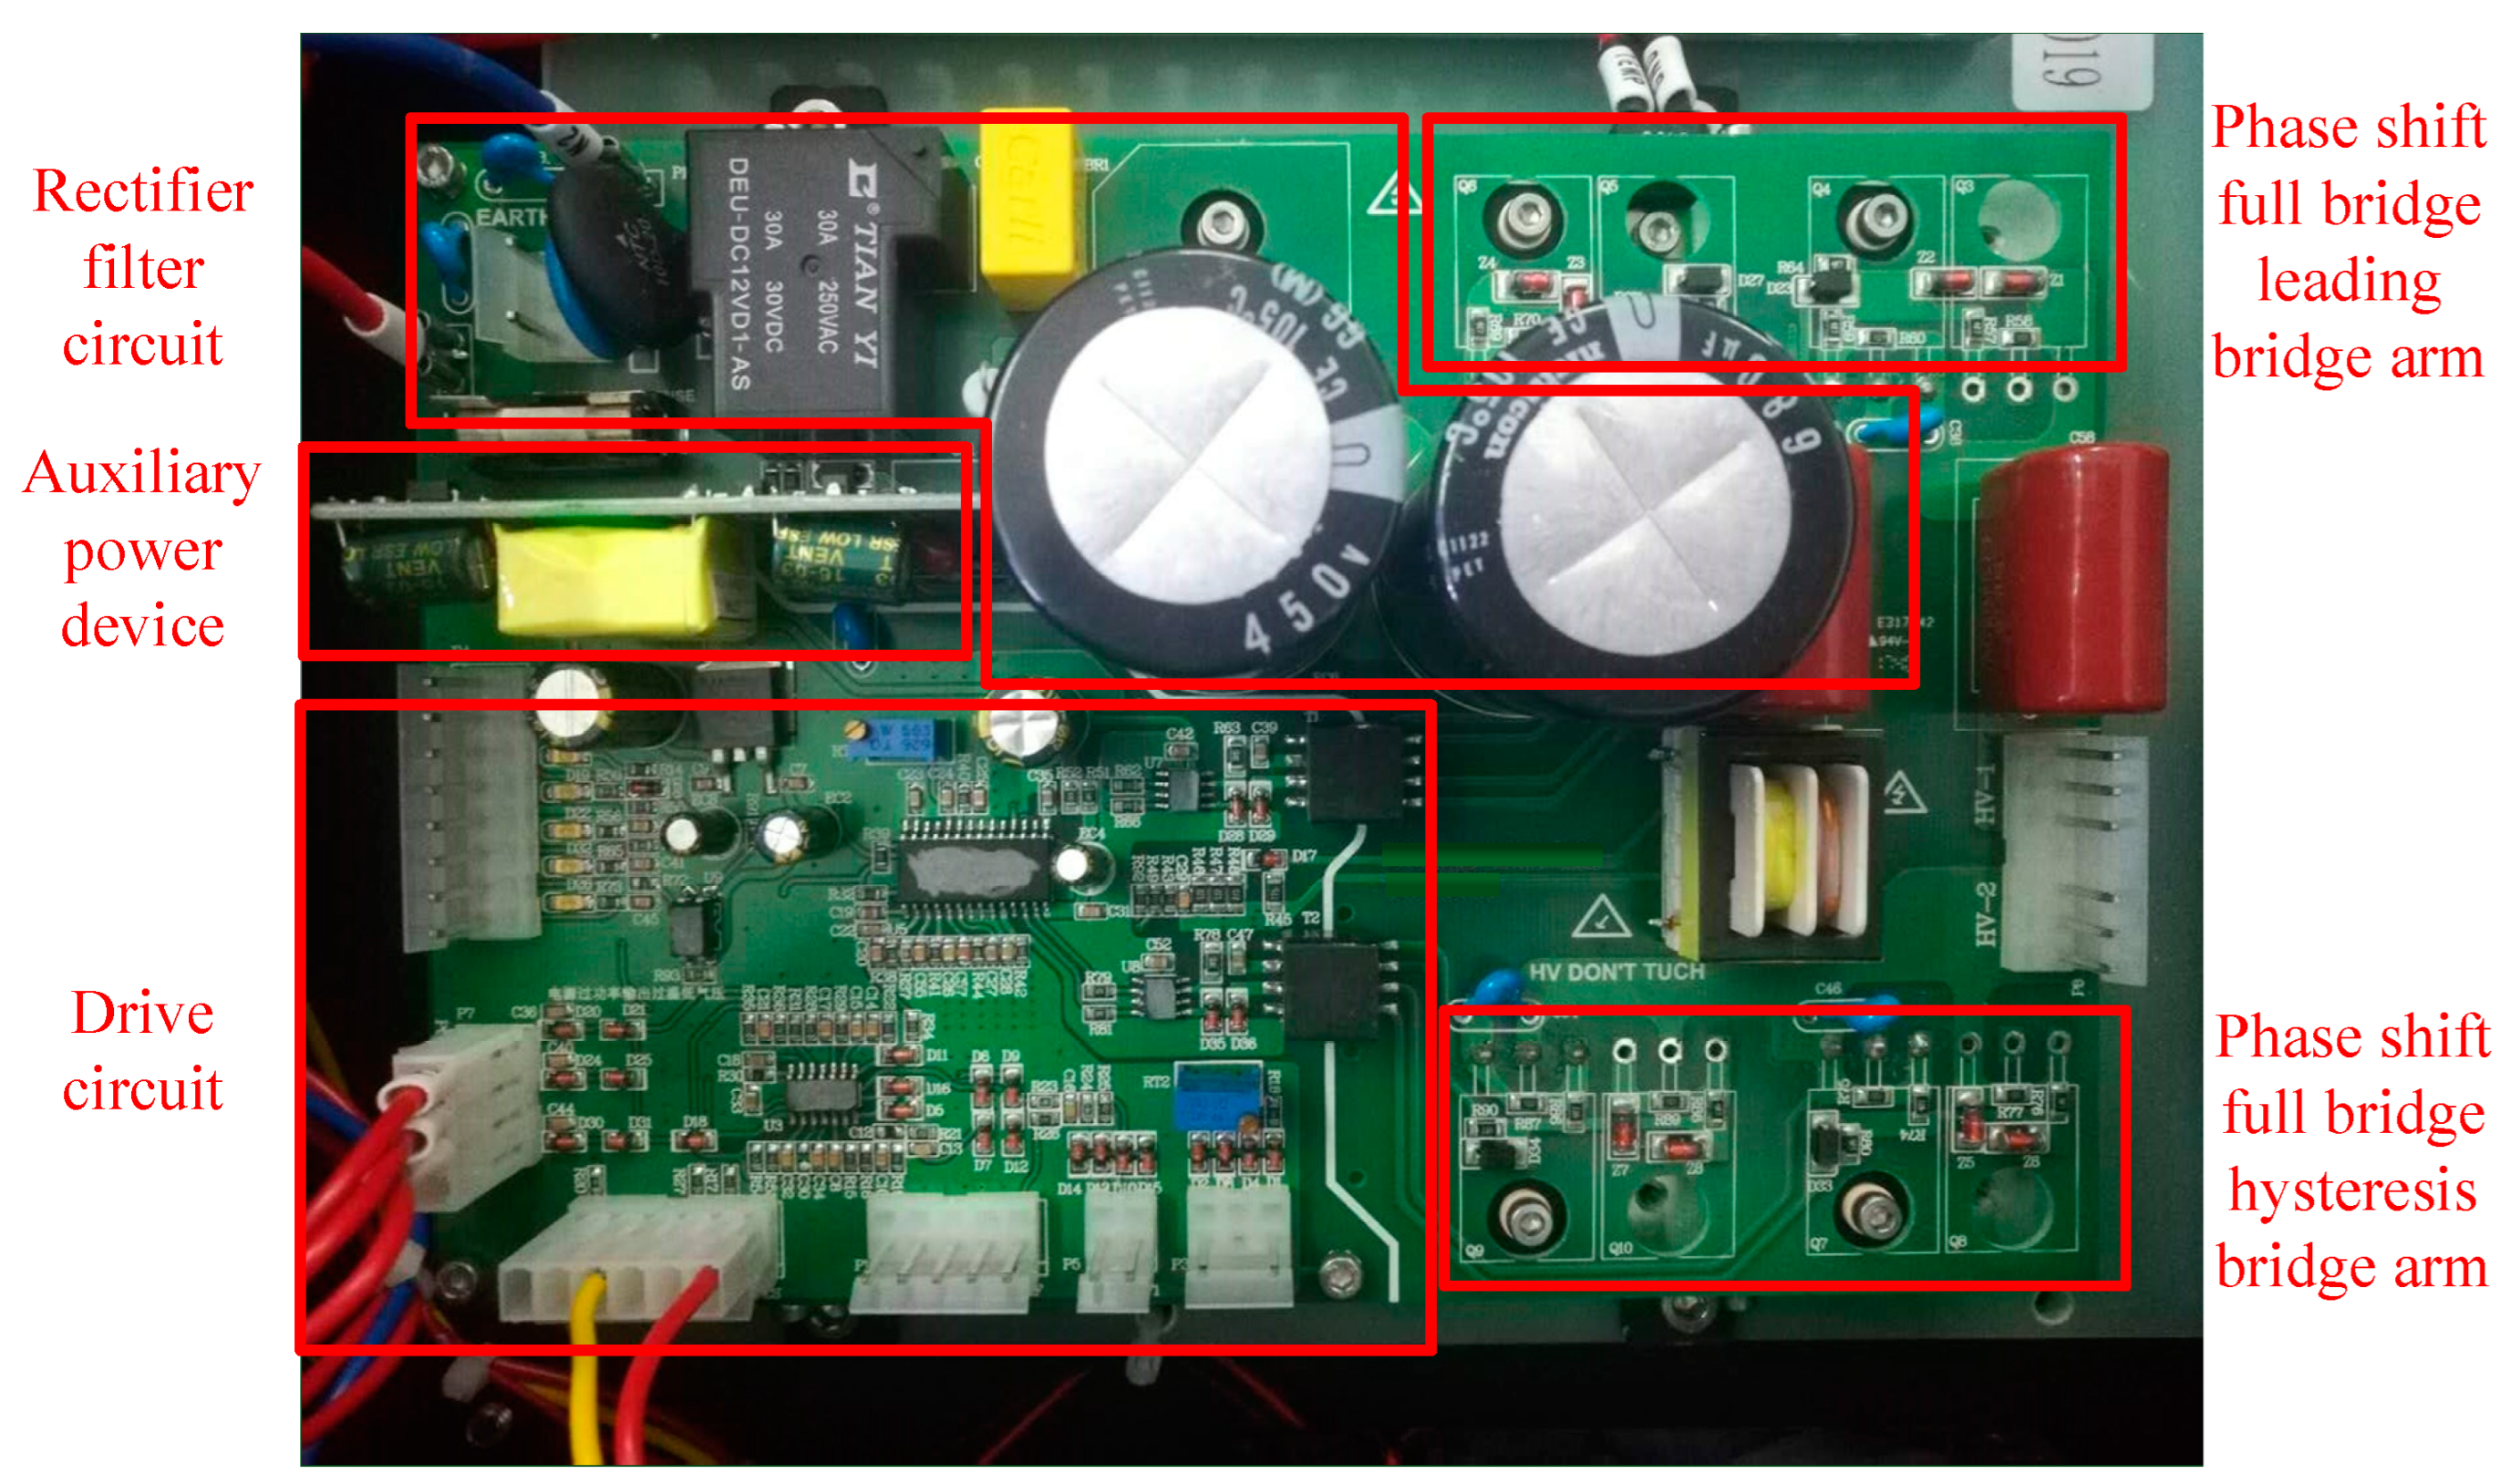
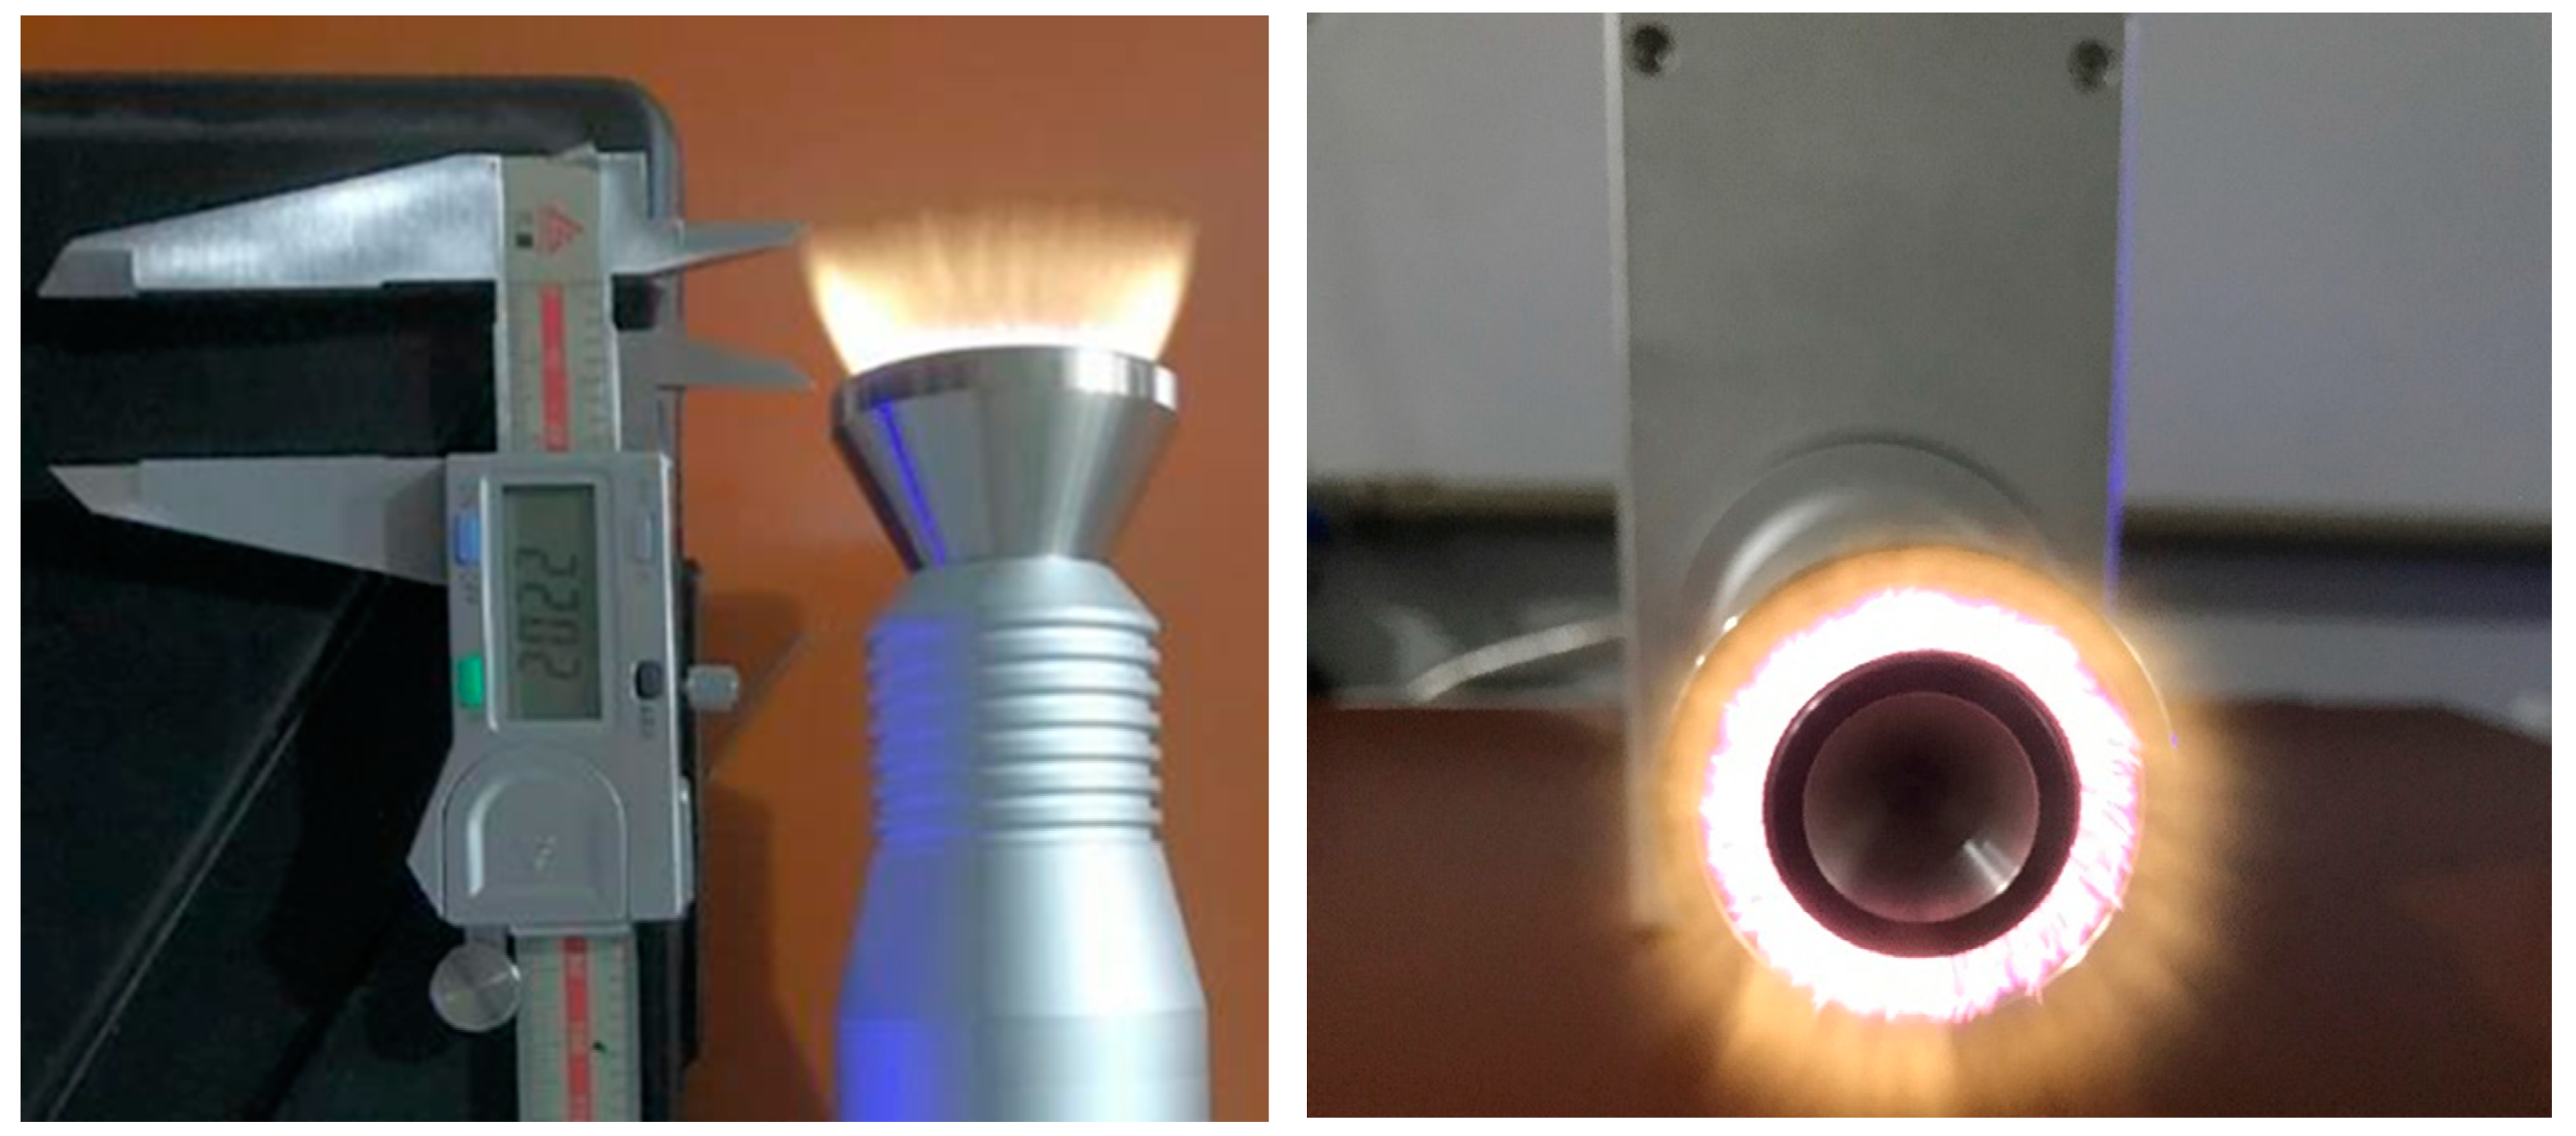
Figure 18 shows the main circuit board of the resonant power supply system for plasma cleaning, which is designed according to the idea of modularization, including the rectifier filter circuit, the auxiliary power supply, the driving circuit, and the phase shift full bridge circuit of the front stage. The auxiliary power supply adopts a plug-in board mode, which makes full use of the longitudinal space and reduces the area of the prototype.
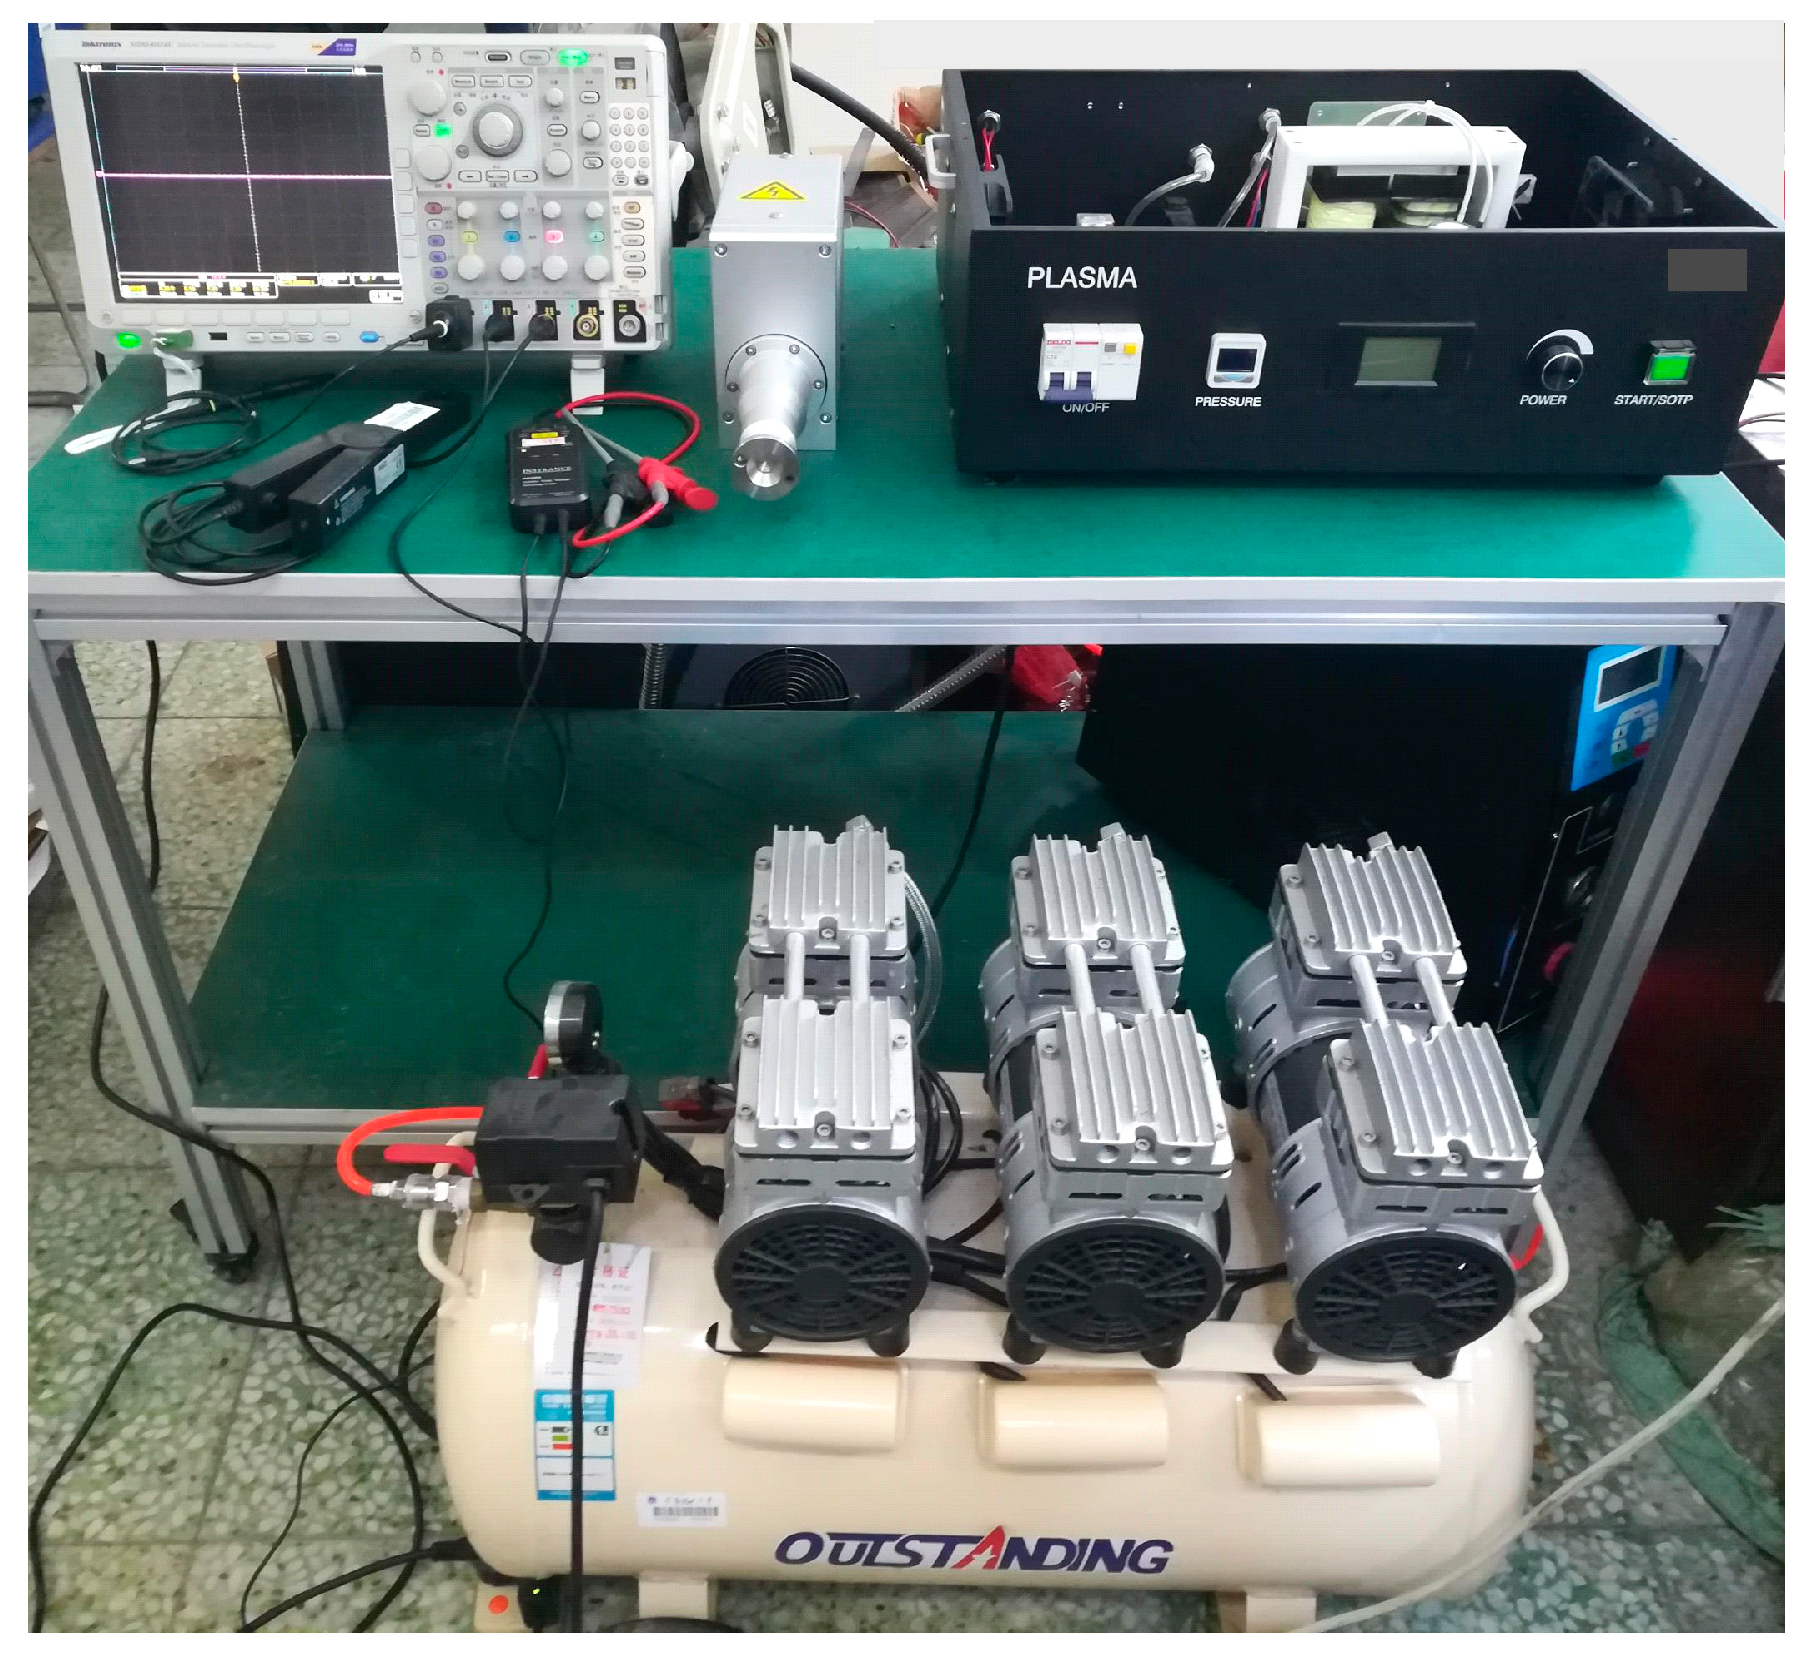
Figure 19 shows the experimental platform of the resonant power supply system for plasma cleaning. The experimental instruments mainly include an air compressor, a four-channel oscilloscope, a programmable AC power supply, a contact angle measuring instrument, a multimeter, an ultra-high voltage probe, a differential probe, and a current probe, etc. Using a rotating jet plasma head, the discharge situation of the plasma jet during operation is shown in
Figure 20.
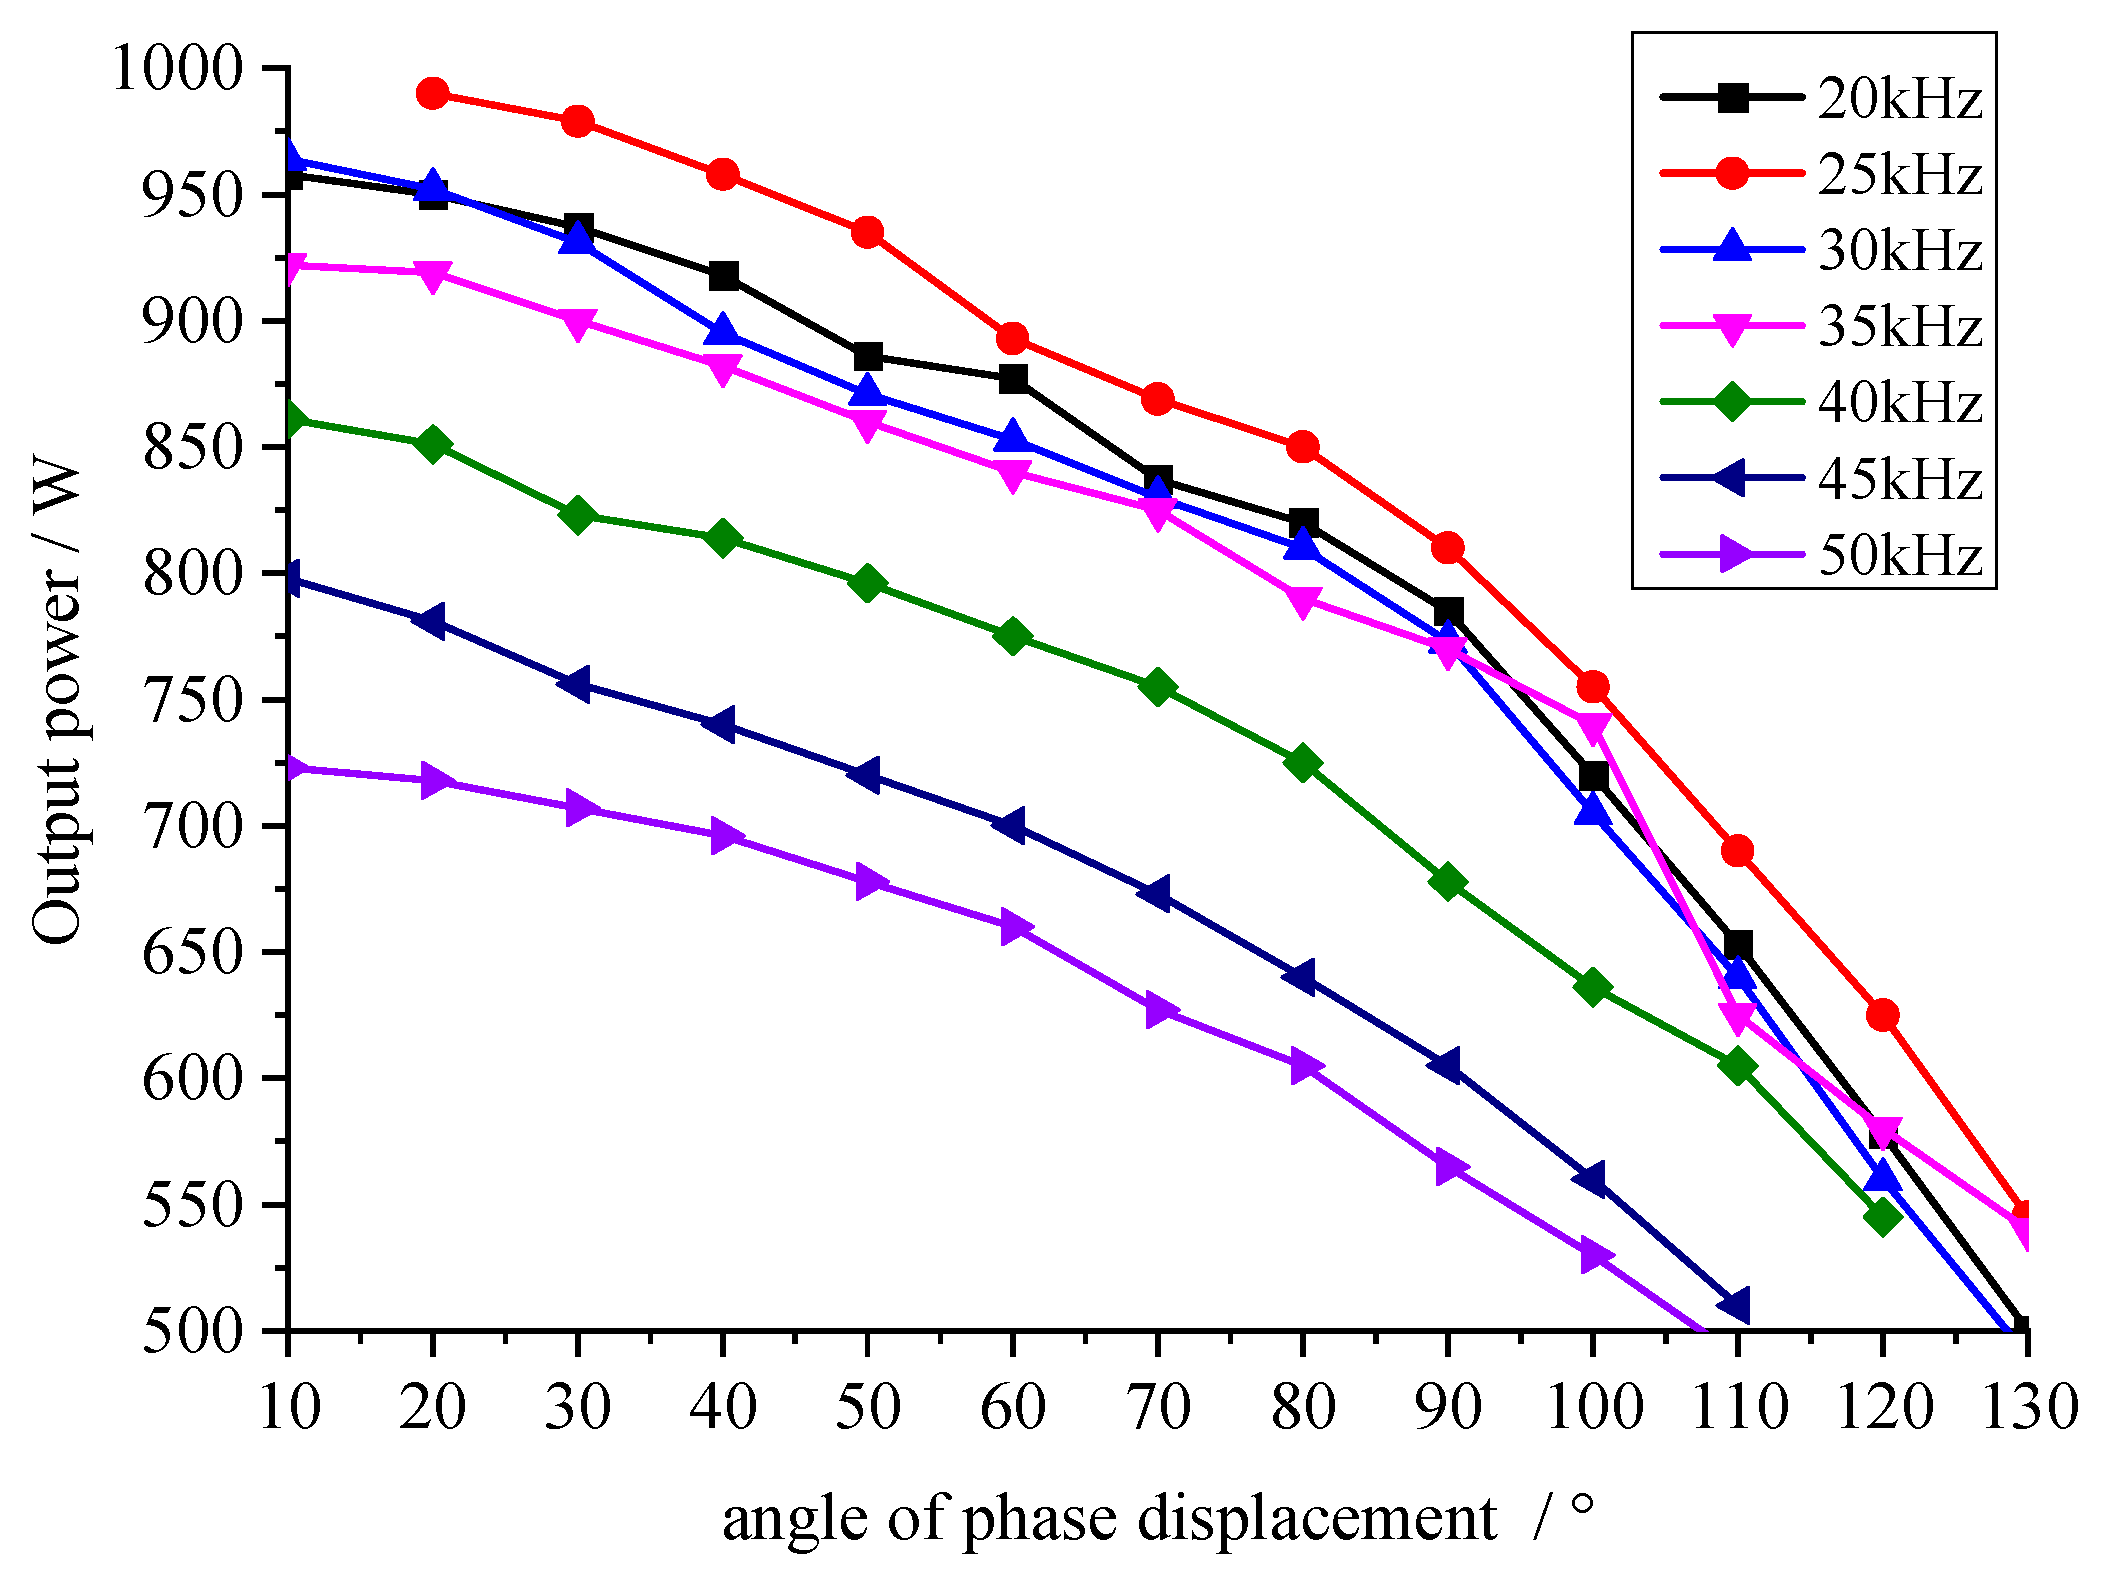
In order to verify whether the theoretical analysis and simulation of the relationship between output active power, phase shift angle, and frequency are correct, the operating frequencies of the system are set to fixed values, respectively: 20 kHz, 25 kHz, 30 kHz, 35 kHz, 40 kHz, 45 kHz, and 50 kHz. Meanwhile, the phase shift angle from 10° to 130° every 10° was adjusted, and the output power of the plasma prototype when working at different frequencies and phase shift angles was recorded. The test results are shown in
Table 3. For data lower than 500 W, due to an unstable plasma arc, the table does not record data exceeding 1000 W are not recorded in the table because overload protection is triggered.
The data in the table are sorted into curves as shown in
Figure 21, and the following conclusions can be drawn from the analysis:
- (1)
At the same working frequency, the larger the phase shift angle of the system is, the lower the output power is; the smaller the phase shift angle of the system is, the higher the output power is.
- (2)
The four curves of 20 kHz, 25 kHz, 30 kHz, and 35 kHz are relatively dense, that is, the resonant frequency of the system jitter in the range of 20 kHz–35 kHz.
- (3)
At the same phase shift angle, the closer the operating frequency of the system is to the resonant frequency, the higher the output power of the system will be; otherwise, the lower the output power will be.
- (4)
Pure PFM regulation, that is, in the fixed phase shift angle frequency modulation mode, the power range is narrow, not more than 300 W, which is the shortcoming of pure PFM modulation mode; similarly, pure PWM adjustment, that is, in the fixed frequency adjustment phase shift angle, the power range can not fully meet the requirements.
- (5)
The curve is steeper when the phase shift angle is larger, and is slower when the phase shift angle is smaller. That is, the larger the phase shift angle is, the greater the influence of the phase shift angle on the output power is; otherwise, the smaller the influence is, which is consistent with the simulation results. Other factors contributing to this phenomenon are as follows: the smaller the phase shift angle is, the phase shift full bridge will gradually separate from the soft switch and become the hard switch, leading to the increase in switching loss of the power tube, thus offsetting part of the increased output power. Therefore, in order to maintain a high output efficiency, it is not advisable to adjust the phase shift angle too small in actual modulation.
In order to verify the PSPWM-PFM hybrid modulation algorithm, compared with the pure PWM modulation or PFM modulation, the comprehensive efficiency is higher, and the power matching accuracy is also higher. Test the resonant power supply system for plasma cleaning, respectively, input power and output power in PSPWM-PFM, PWM and PFM modulation modes, and record the relevant experimental data, as shown in
Table 4.
In
Table 4, there are three groups of experimental data that are not recorded, namely: when the power is set to 500 W, the experimental data are difficult to record because the PWM algorithm fails to start the arc; when the power is set as 550 W, the experimental data cannot be recorded because of the unstable arc of the PWM algorithm; when the power is set to 1000 W, the experimental data will not be recorded because the PWM algorithm triggers over power protection.
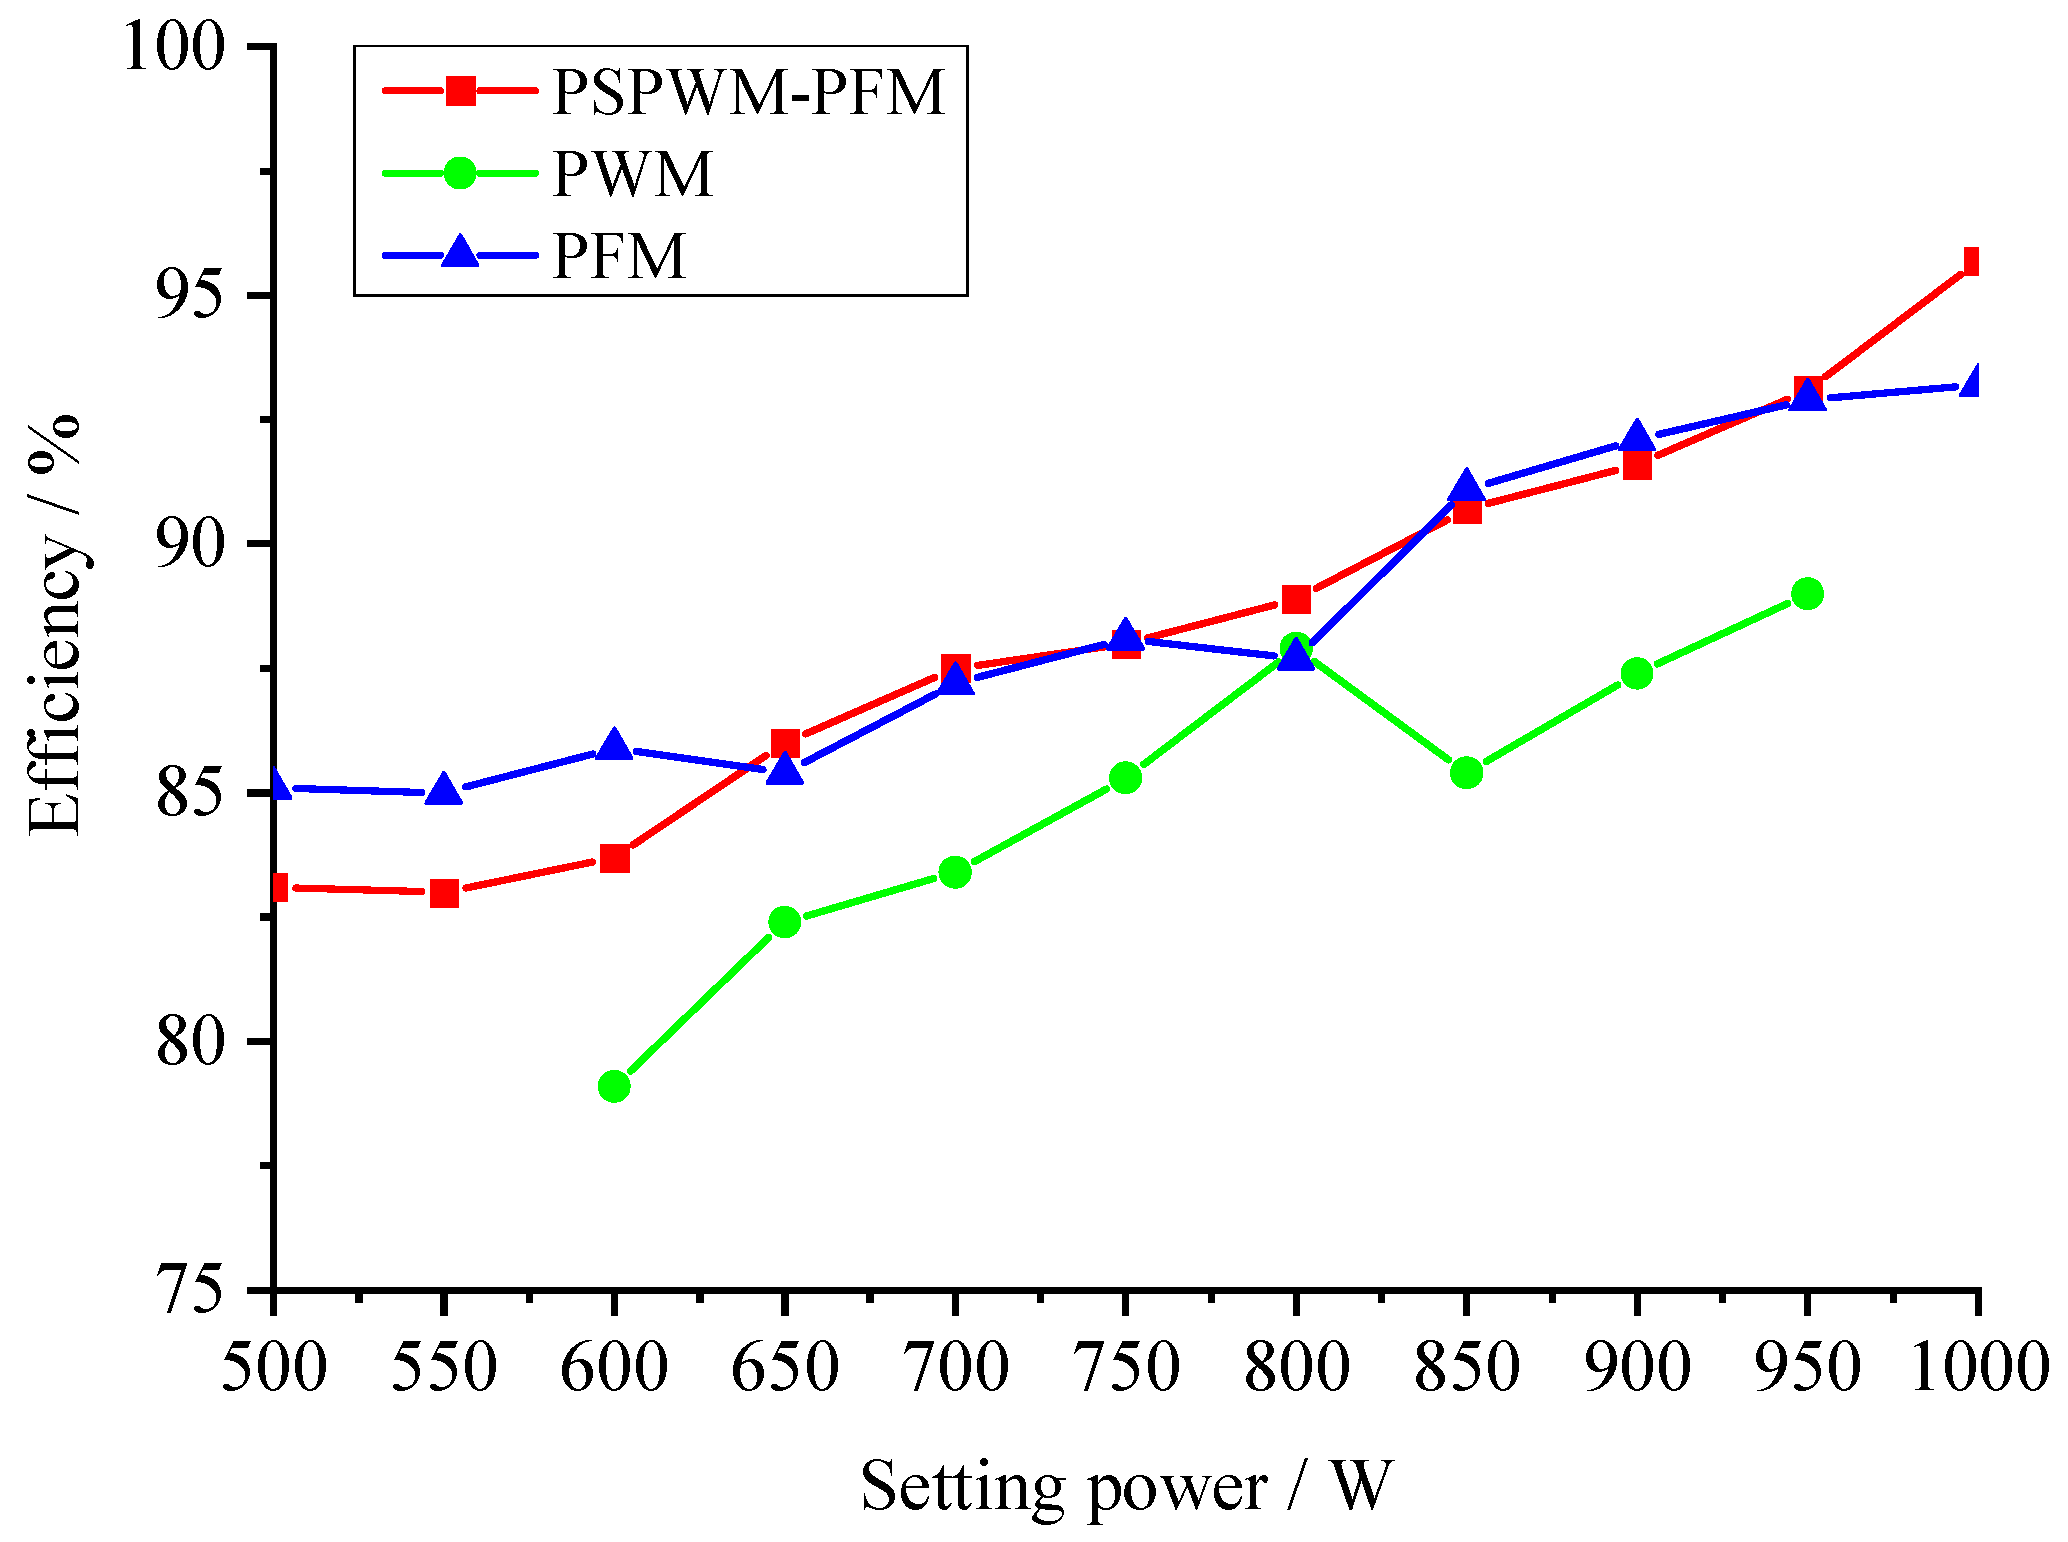
Based on the input power and output power data recorded in
Table 4, you can calculate the efficiency curves of the three modulation modes at each set power, as shown in
Figure 22. As can be seen from the figure, the efficiency of the PWM modulation mode is the worst among the three, and the lowest efficiency is less than 80%, especially in low power and high-power operation. This is because the PWM cannot adjust the frequency and it is easy to deviate from the resonant frequency point of the system, so that the system has too much reactive power, resulting in a low efficiency. The PFM modulation mode and the hybrid modulation mode have their own advantages and disadvantages in each set power, but at low power operation the PFM modulation mode has better efficiency than the hybrid modulation mode because of its frequency modulation characteristics. Among them, the PFM modulation efficiency is above 85%, and the mixed modulation efficiency is above 83%, which meet the requirements. Regardless of the modulation mode, the overall efficiency of the system tends to increase as the set power increases.
Similarly, according to the recorded experimental data, power matching curves of three modulation modes can be calculated under each set power. Power matching refers to the ratio between the actual output power and the users set power. The closer the value is to 100%, the higher the matching degree is, and the lower the actual output power is. The higher the actual output power is, the higher the actual output power is, as shown in
Figure 23. The power matching degree of the PWM modulation mode is the best among the three. This is because the output power is most relevant to the duty cycle. The PFM modulation mode is the worst among the three, especially at low power and high power. This is because the correlation between output power and working frequency is low, and the modulation effect is not obvious. Once the equipment needs a low-power or high-power operation, it will be very difficult.
Although PFM and PWM modulations are superior to hybrid modulation in a certain aspect such as low power operation, the PFM algorithm is more efficient. The PWM algorithm has a higher power matching accuracy in each power. However, considering efficiency, power matching accuracy, and working power range, the hybrid modulation algorithm is obviously superior to the other two modulation methods. Therefore, it is appropriate and efficient to select the hybrid modulation algorithm as the control mode of the resonant power supply system for plasma cleaning.
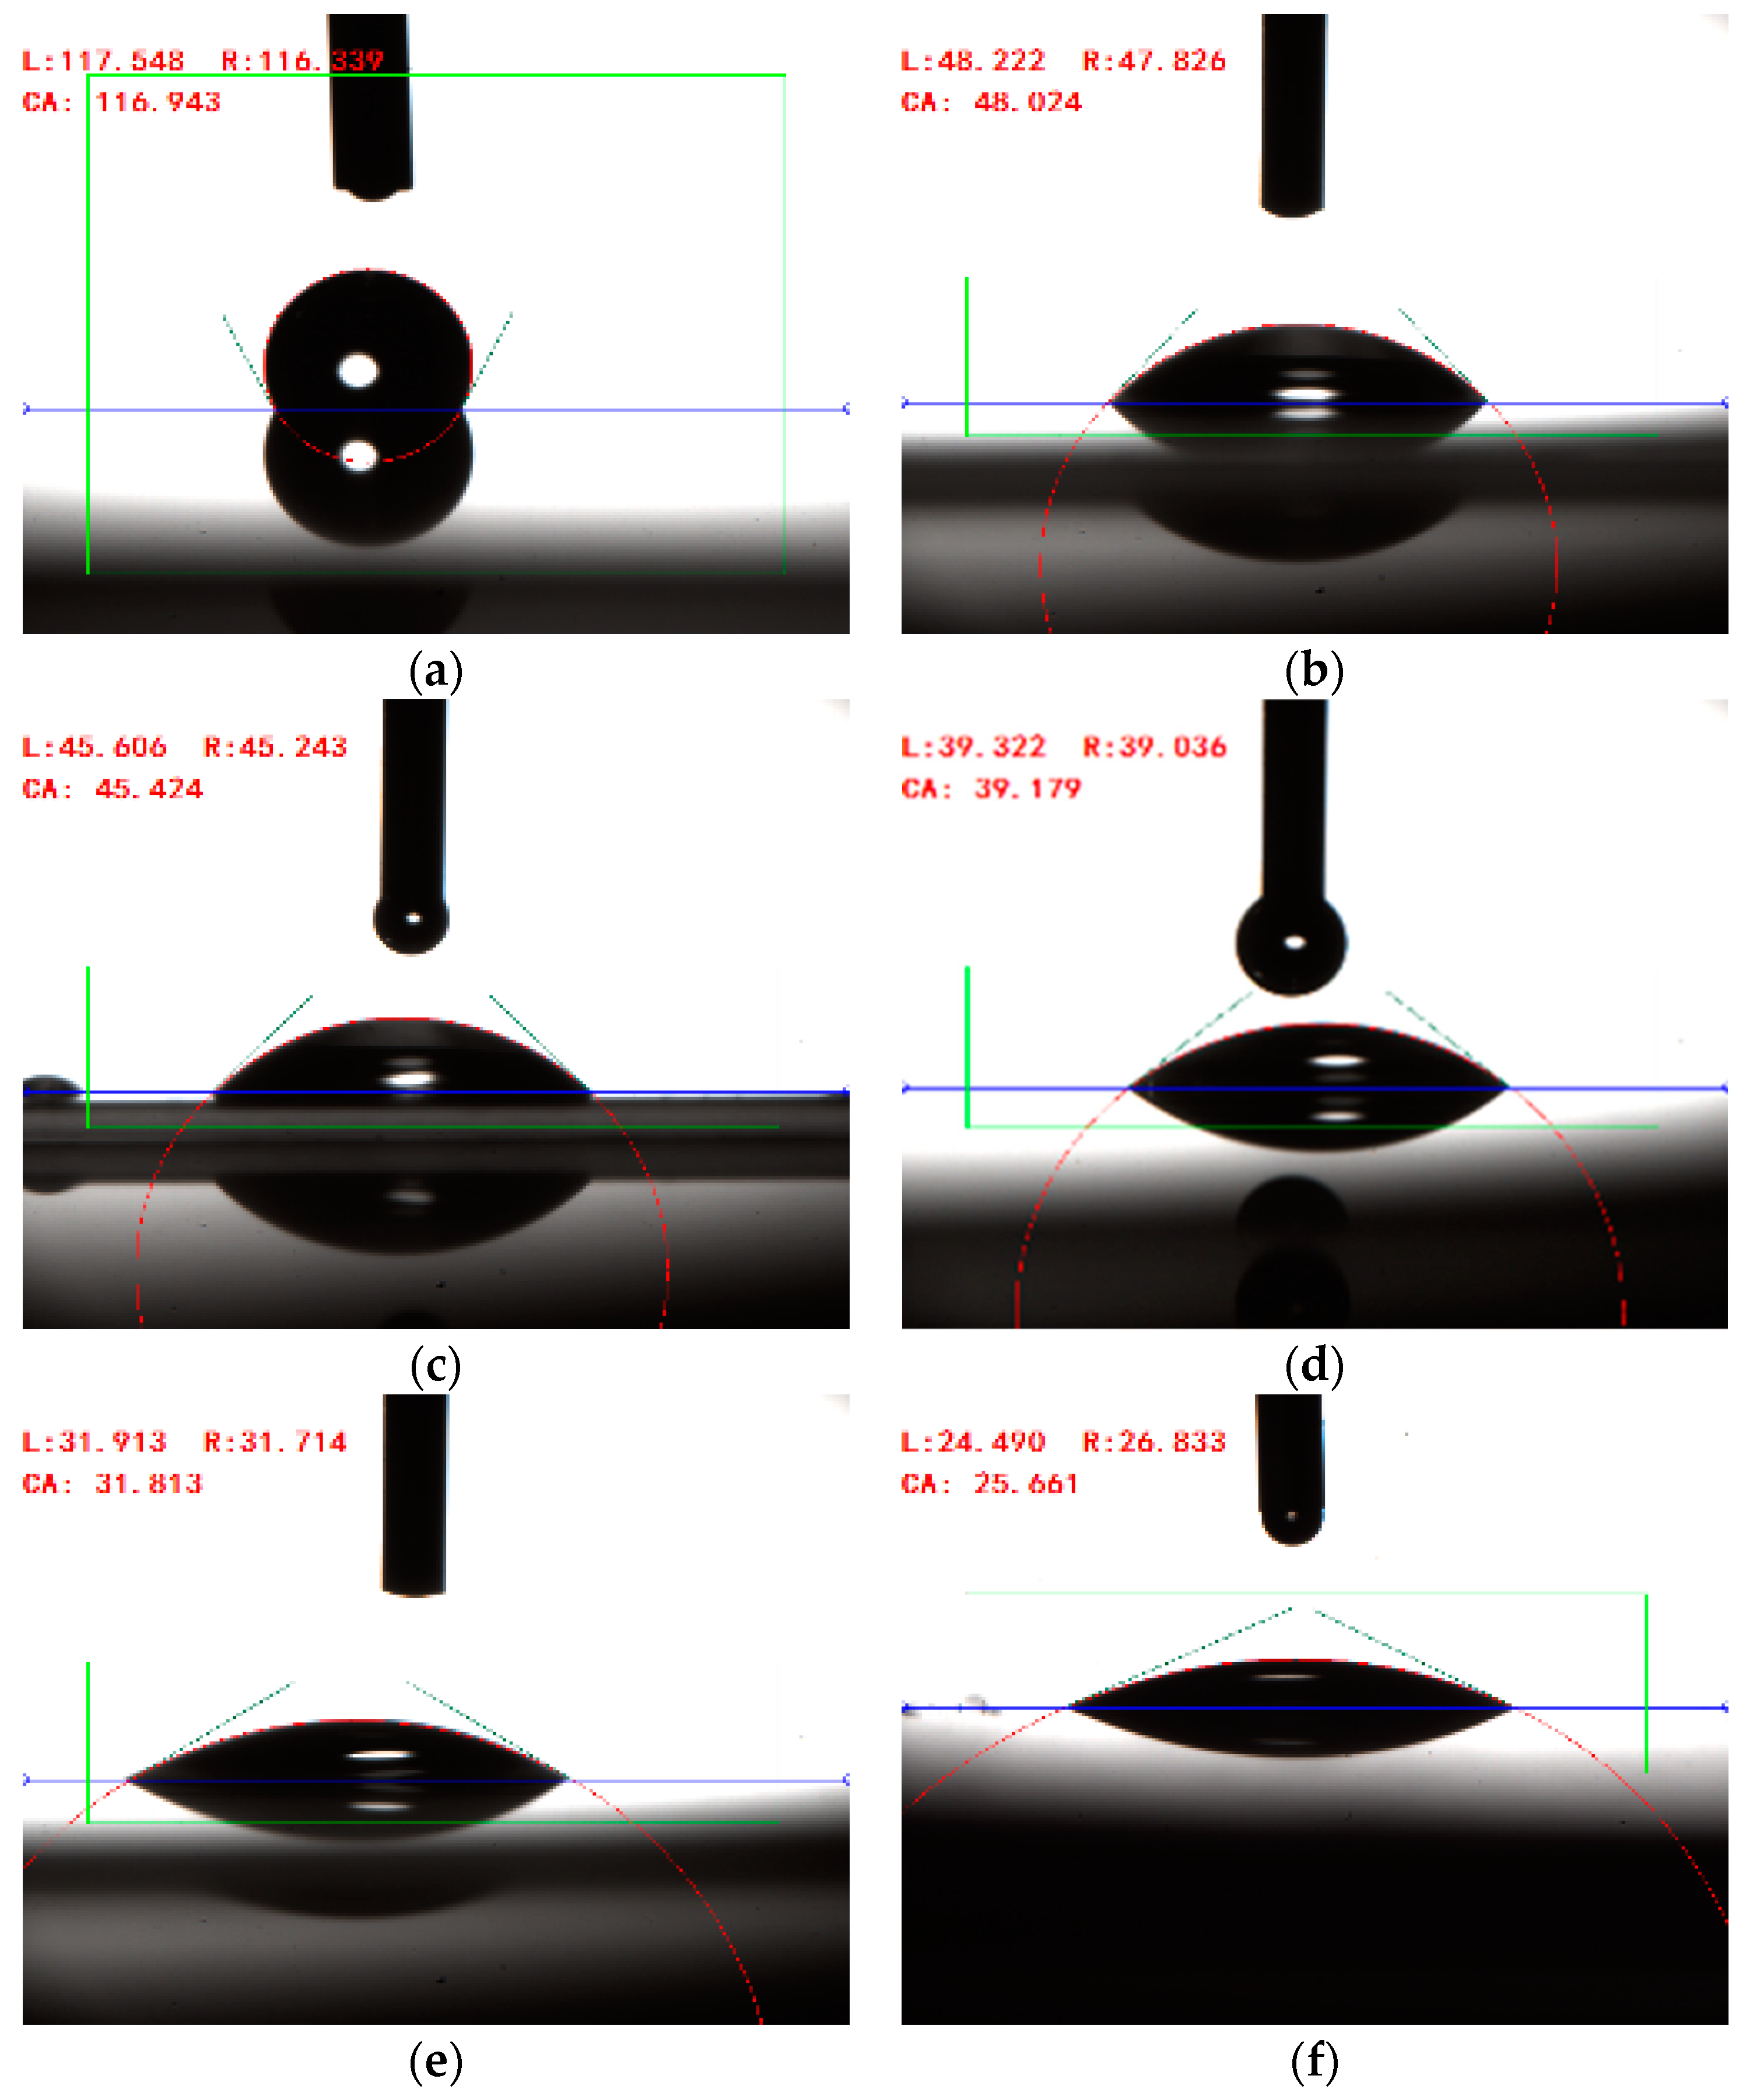
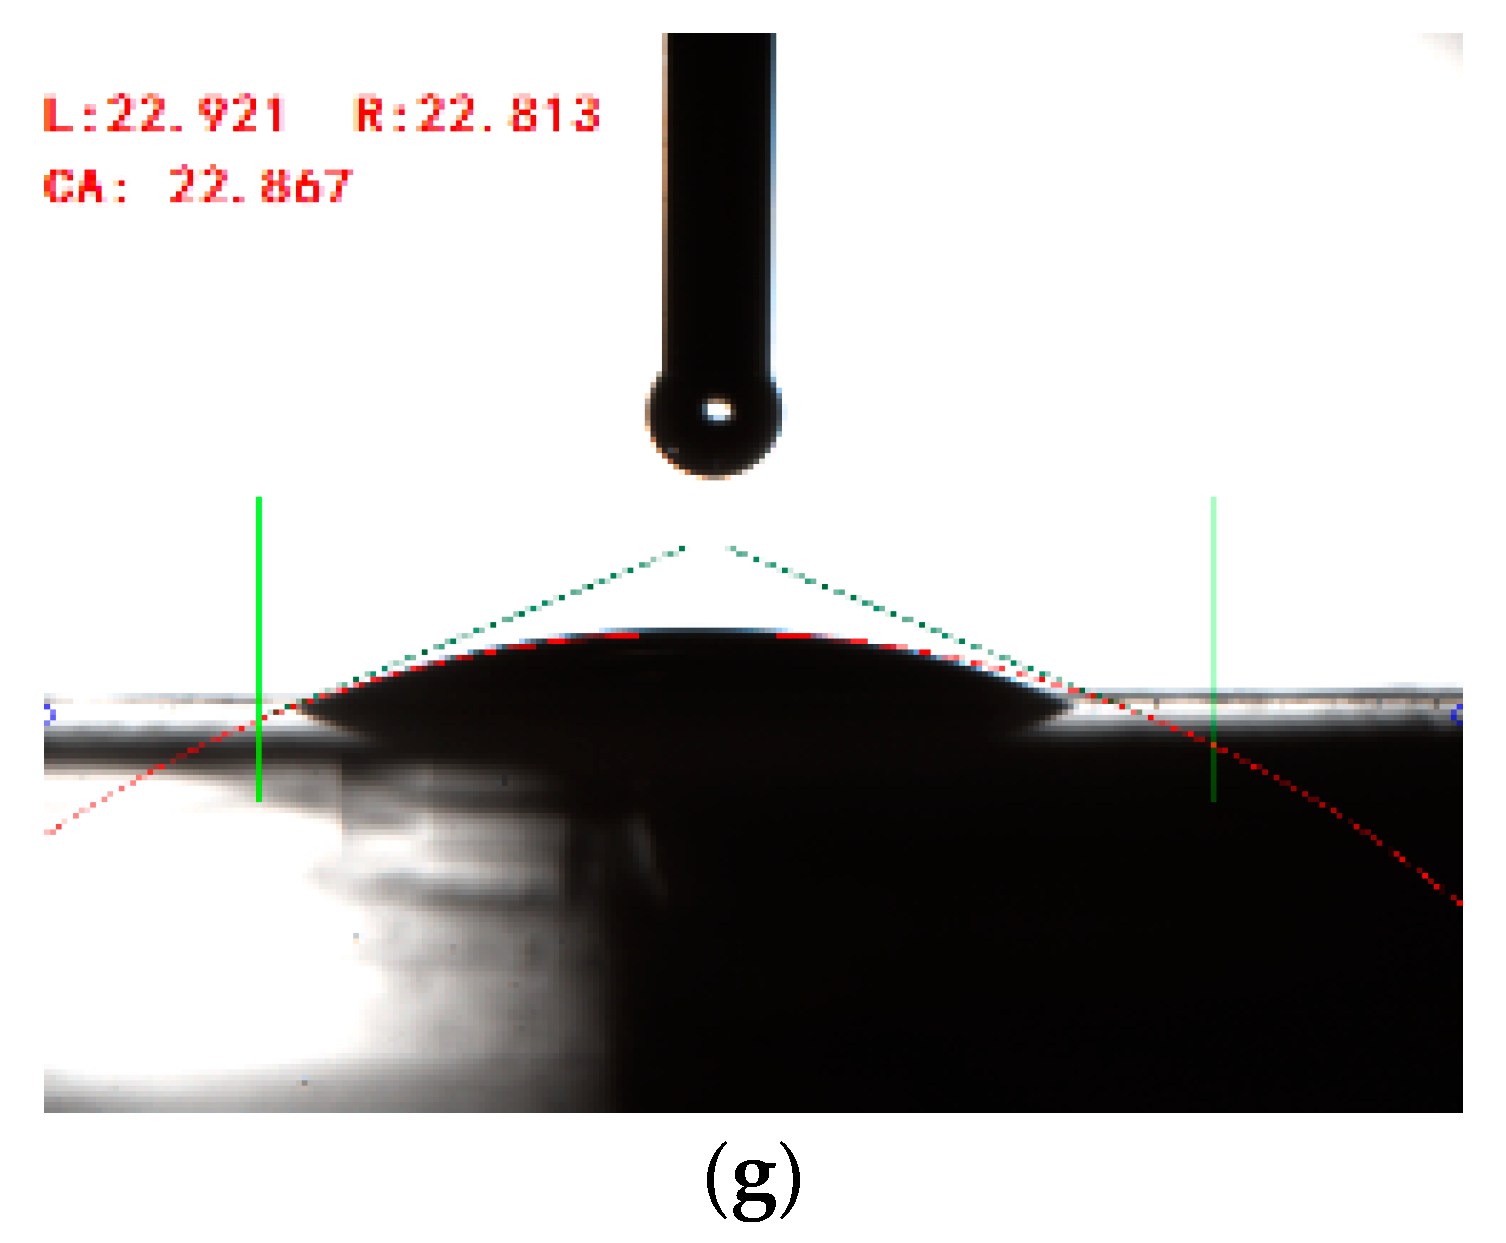
The cover plate of a glass mobile phone was taken as the test object, and the contact angle measuring instrument was used to fix the acting distance at 1.5 cm. The air pressure was 0.15 MPa, the neutral gas temperature was 85 °C, the working frequency was 25 kHz, the processing speed was 100 mm/s, the resonant inductance was 34 mH, and the working gas was compressed air. The contact angle before and after the cover plate was cleaned at different powers and was measured, as shown in
Figure 23. The contact angle here refers to the angle formed when the liquid phase is sandwiched between the two tangents of the gas–liquid interface and the solid–liquid interface. As shown in
Figure 24, the contact angle decreases gradually with the increase in the set power, indicating that the hydrophilicity of the material is greatly improved, and the cleaning effect of the resonant power supply system for plasma cleaning meets the requirements.
In order to further study the influence of working distance on cleaning effect, the power was set to 500 W~1000 W, and the working distance was set to 0.5 cm~2.5 cm, respectively. The change of contact angle before and after cleaning of the mobile phone cover plate is measured and recorded, as shown in
Table 5.
The data in
Table 5 are arranged into curves as shown in
Figure 25. The analysis shows that the change angle of the contact angle is positively correlated with the set power, that is, the higher the set power, the better the cleaning effect. This negatively correlated with the acting distance, that is, the larger the acting distance, the worse the cleaning effect. However, the contact angle of the mobile phone cover plate after cleaning has a lower limit, that is, there is a minimum contact angle, its value is about 12°, that is, the maximum change angle of the contact angle is about 105°. When the contact angle of the mobile phone cover is close to the maximum value, no matter how the set power increases and how the acting distance decreases, the change of the contact angle will not increase, that is, the contact angle will not decrease after cleaning.
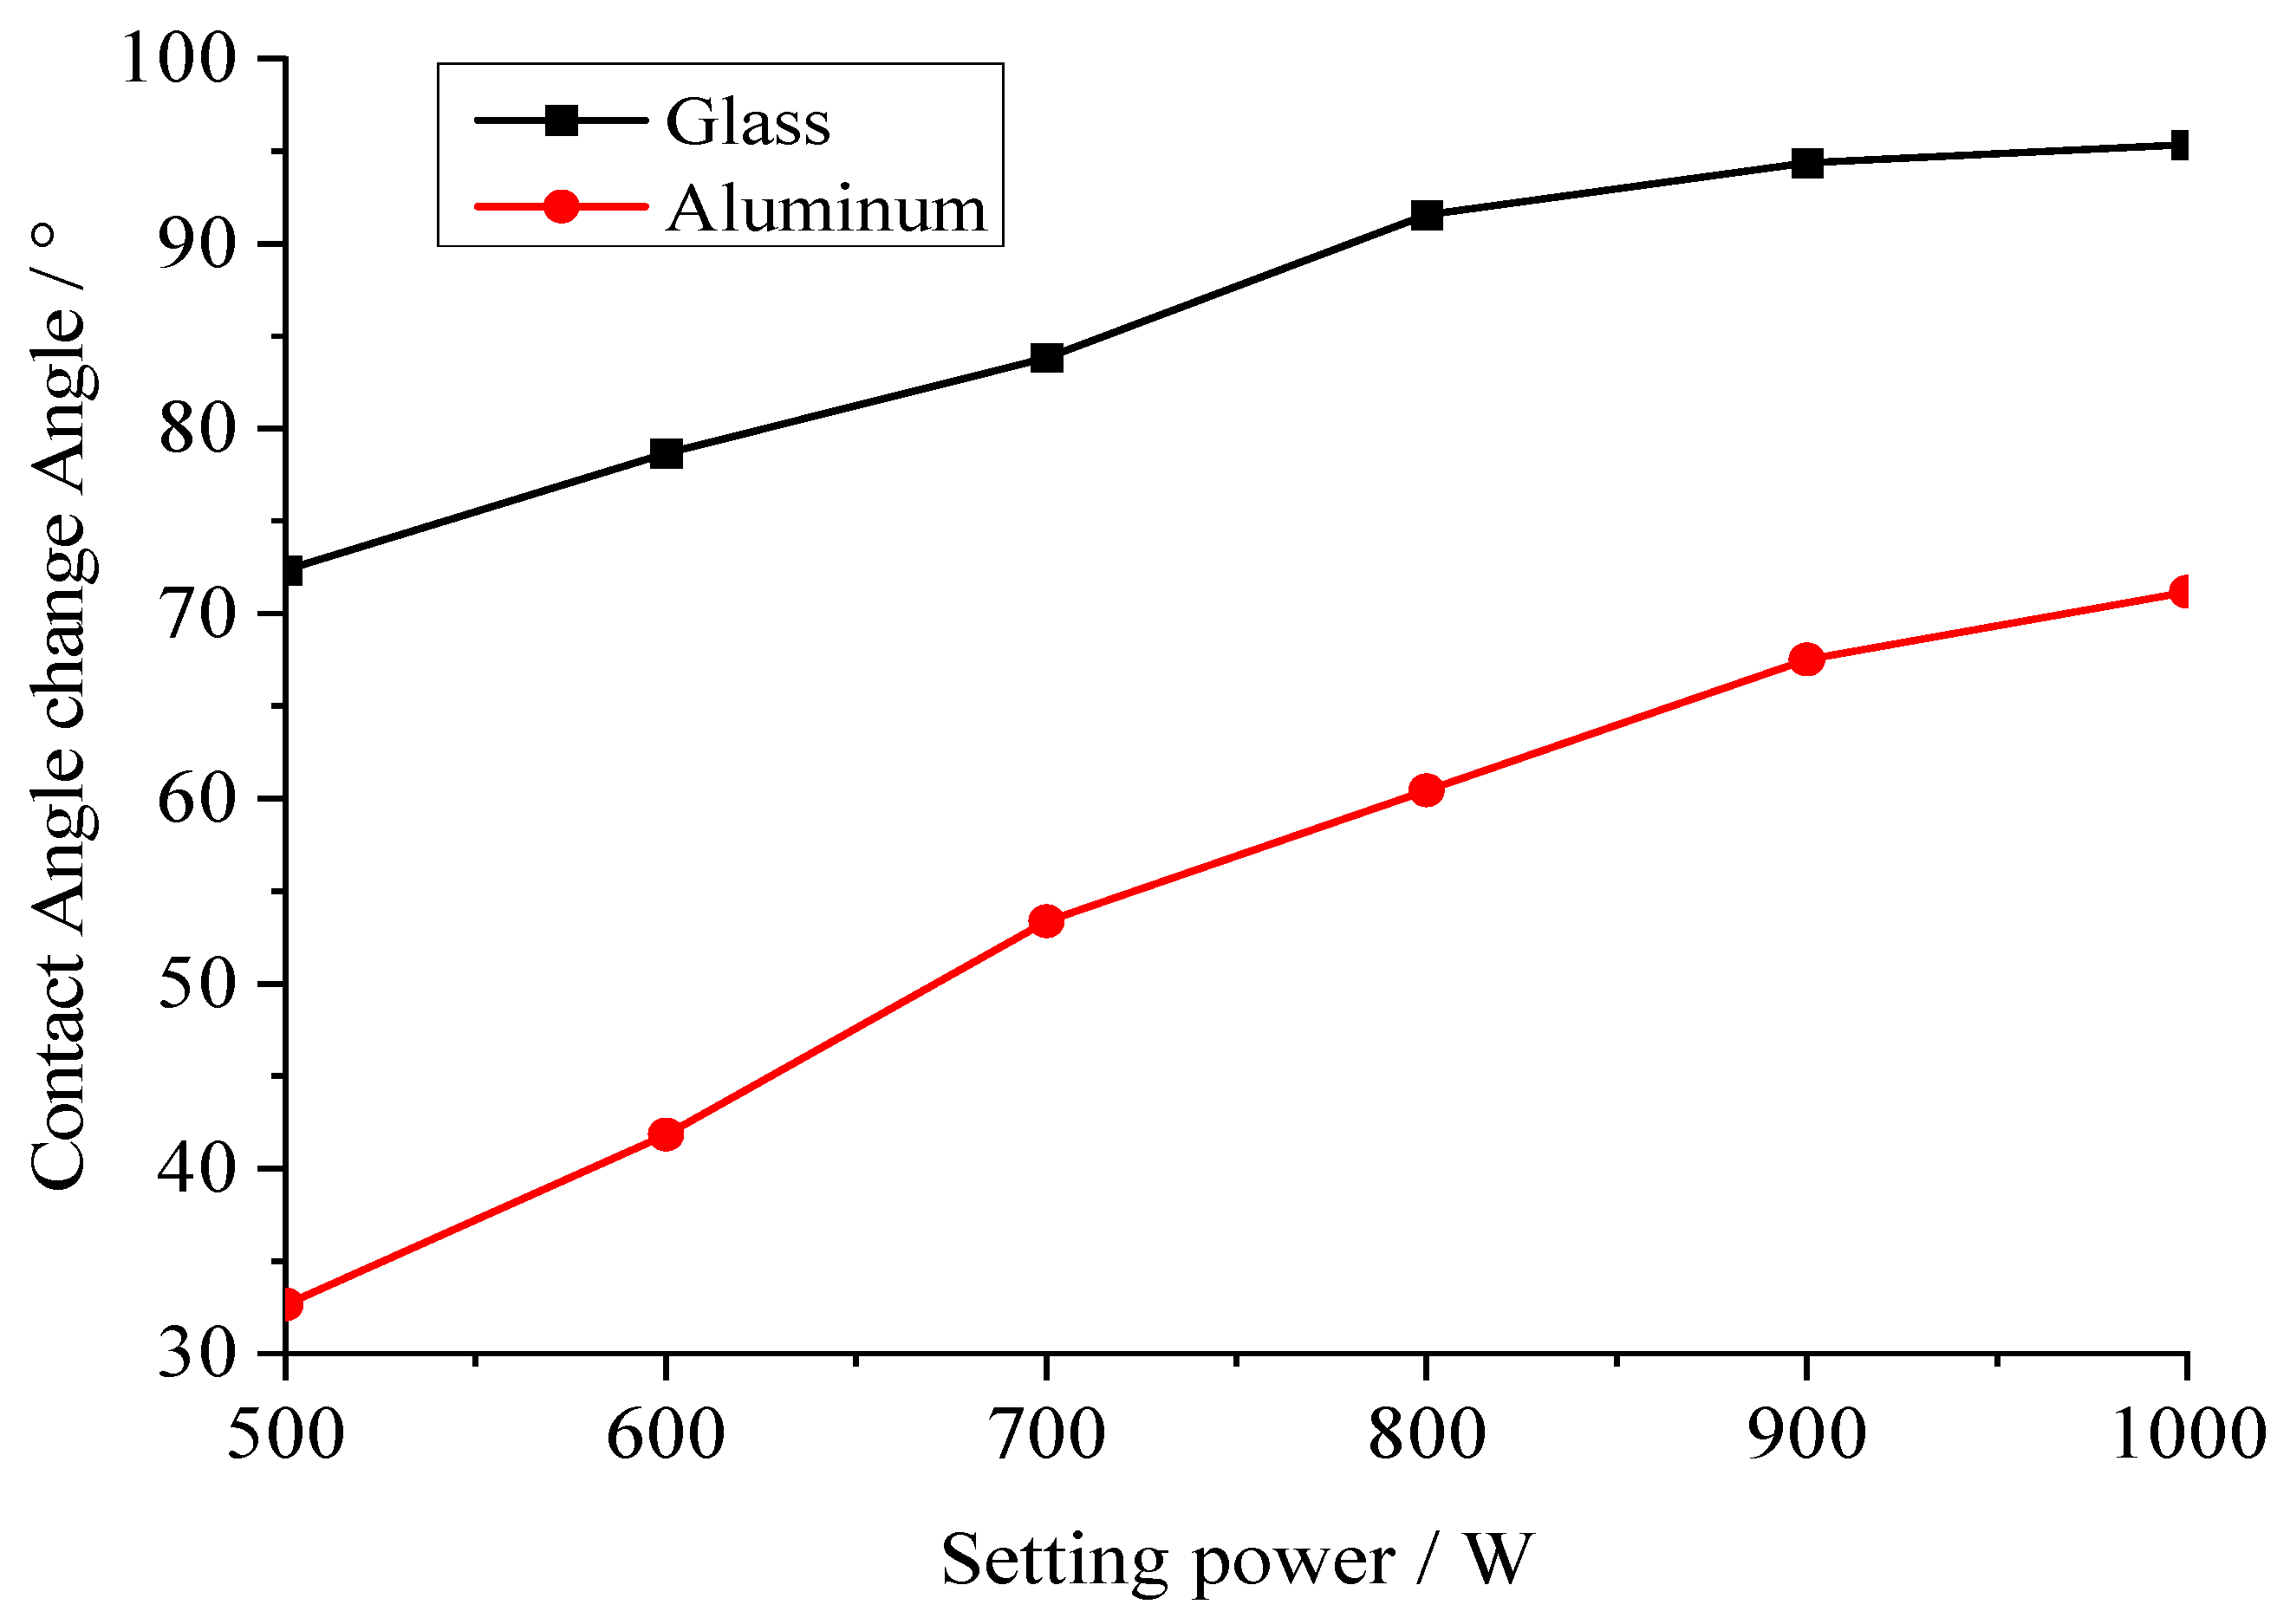
The working distance was set to a fixed value of 1.5 cm, and the power was set to 500 W~1000 W, respectively. Under the same test conditions, two materials, glass and aluminum, were tested. The change data of the material contact angle before and after cleaning are shown in
Table 6.
The data in
Table 6 are arranged into the curve shown in
Figure 26, and the analysis shows that the properties of the acting materials have a significant impact on the cleaning effect. In the same case, under the action of plasma, glass material is obviously more easily activated than aluminum material, the surface free energy is more easily improved, and the flatness changes more, that is, it is easier to be modified.


