Abstract
European Portuguese (EP) is characterized by a large number of nasals encompassing five phonemic nasal vowels. One notable characteristic of these sounds is their dynamic nature, involving both oral and nasal gestures, which makes their study and characterization challenging. The study of nasal vowels, in particular, has been addressed using a wide range of technologies: early descriptions were based on acoustics and nasalance, later expanded with articulatory data obtained from EMA and real-time magnetic resonance (RT-MRI). While providing important results, these studies were limited by the discrete nature of the EMA-pellets, providing only a small grasp of the vocal tract; by the small time resolution of the MRI data; and by the small number of speakers. To tackle these limitations, and to take advantage of recent advances in RT-MRI allowing 50 fps, novel articulatory data has been acquired for 11 EP speakers. The work presented here explores the capabilities of recently proposed data-driven approaches to model articulatory data extracted from RT-MRI to assess their suitability for investigating the dynamic characteristics of nasal vowels. To this end, we explore vocal tract configurations over time, along with the coordination of velum and lip aperture in oral and nasal bilabial contexts for nasal vowels and oral congeners. Overall, the results show that both generalized additive mixed models (GAMMs) and functional linear mixed models (FLMMs) provide an elegant approach to tackle the data from multiple speakers. More specifically, we found oro-pharyngeal differences in the tongue configurations for low and mid nasal vowels: vowel track aperture was larger in the pharyngeal and smaller in the palatal region for the three non-high nasal vowels, providing evidence of a raised and more advanced tongue position of the nasal vowels. Even though this work is aimed at exploring the applicability of the methods, the outcomes already highlight interesting data for the dynamic characterization of EP nasal vowels.
1. Introduction
One of Portuguese’s distinctive marks is the large nasals inventory, including five phonemic nasal vowels and three nasal diphthongs. In this paper, we contribute to the study of these sounds by expanding on our work presented at Iberspeech [1]. The articulatory properties of vowels are often indirectly inferred from formant values, with F1 being reversely correlated with tongue height and F2 with tongue backness. Given that the acoustic effects of the oral and nasal cavities are merged in the formant values of nasal sounds, it is difficult to disentangle the acoustic effects of the nasal cavity on oral formants to estimate the vocal tract shape in nasal vowels. Dynamic aspects cannot be caught with static analysis of vowel midpoints; one has to consider the whole or a greater part of their duration. This will be one of the advances of this paper.
The study of such complex sounds, exhibiting characteristic dynamic patterns, contributes to improving our knowledge on speech production, supporting a range of applications from speech therapy to articulatory speech synthesis. To tackle these aspects, recent advances in real-time MRI (e.g., [2]) include a considerable step-up in the possible time resolution (e.g., 50 frames per second), and our team has been working on acquiring a novel RT-MRI dataset that encompasses a large number of speakers to study European Portuguese nasal vowels, and addressing how to tackle these data to attain a systematic processing and quantitative analysis of the articulatory data (e.g., [3,4]). In this context, the large amount of available data also fosters the consideration of novel approaches based on data-driven methods (e.g., [4]). These can have an impact on how we improve our knowledge on nasal vowels, by making it possible to computationally model their dynamic behavior and providing a means to deal with the variability of the data (e.g., due to the idiosyncratic nature of each speaker’s anatomy and articulation).
A recent data-driven approach applied to articulatory data extracted from RT-MRI [5] proposes the use of generalized additive mixed models (GAMMs) to tackle the data from multiple repetitions and/or speakers. In view of the obtained results, it is important to understand if these methods, proposed and demonstrated for a general scope, might be useful for studying the dynamic behavior of nasal vowels. To this end, we present the first conclusions in Cunha et al. [1], considering EP cardinal vowels, and the work presented here expands those results by considering all EP nasal vowels and by providing, to the extent of the method’s capabilities, a more complete report of EP nasal vowel dynamics in bilabial contexts.
In alignment with these goals, the remainder of this paper starts by providing an overall background for the research in nasal vowel production, in Section 2, along with an overview of related work regarding data-driven methods for tackling speech production data. Section 3 provides a description of the data considered and an overview of the methods applied, namely those deriving from the work by Carignan and colleagues [5], and how we applied them to our data. The results obtained by the application of these methods are presented and discussed in Section 4, with final remarks and ideas for future work provided in Section 5.
Initial studies of the dynamics of EP nasal vowel production resorted to electromagnetic articulography (EMA) data and concerned quantitative analysis of velum movement in the context of stop consonants [6]; comparison with French nasal vowels [7]; study of gestures timing, characterization of the gesture in terms of average duration, investigation of factors influencing such durations, and characterization of inter-gestural coordination [8]; and speech rate effects [9]. These first studies were expanded by exploring the advances in real-time magnetic resonance imaging (RT-MRI) that provided data covering the whole vocal tract, over time, at 14 frames per second (e.g., [10,11,12,13]).
2. Background and Related Work
Nasal vowels are complex sounds that involve the passage of airflow through nose and mouth, where the lowering of the velum plays a pivotal role in their unfolding. It is not just a matter of a lowered or raised velum. As shown for American English with nasalance data, the tongue position is higher during nasalized [ĩ] compared to the oral counterparts [14], and the tongue body is lowered for back vowels, fronted for low vowels, and raised for front vowels in Hindi nasal vowels [15]. Oro-pharyngeal differences between oral and nasal vowel pairs were also found by Carignan et al. [16] in an EMA study with 12 speakers of Northern Metropolitan French (NMF), and in one of the first MRI studies, analyzing three female speakers of the same French variety [17]. According to [18], nasalization significantly lowered F1 for all three nasal vowels of Southern French (SF), recorded with synchronous nasalance, ultrasound, and EGG for four male speakers. In a recent RT-MRI study with 35 German participants and the same recording settings used in our experiment [19], it was shown that nasalization involves, in a first stage, gestural shortening and realignment of the velar gesture relative to the tongue gesture.
2.1. Study of European Portuguese Nasal Vowels
The European Portuguese (EP) inventory includes five nasal vowels and three nasal diphthongs [20]. However, it is debated whether the vowels are phonemic nasal or simply contextually nasalized. For example, for Brazilian Portuguese, Meireles [21] found a synchronous coordination of the nasal vowel with the preceding consonant, while Desmeules-Trudel [22] reported a very late alignment of nasal and oral gestures, arguing against the phonemic status of the nasal vowels. In an RT-MRI study with 12 participants from southeastern Brazil, Barlaz et al. [23] found oro-pharyngeal differences between nasal and oral vowel counterparts /a ã/, /i ĩ/, and /u ũ/, and nasal coda emergence, arguing that nasal vowels are underlyingly /Ṽ/rather than/VN/sequences in BP.
The study of nasality towards a richer description of its unfolding over time is an important step towards a greater understanding of speech production, with a potential impact in several application areas, such as speech therapy, and it is paramount to evolving articulatory-based speech synthesis [24,25].
In this regard, our team has studied the static and dynamic patterns of European Portuguese nasal vowels, resorting to technologies ranging from EMA [7,8,9,26] to RT-MRI [10,11,27]. To expand this line of work, further improvements are still required regarding how oral and nasal gestures are synchronized in EP nasal vowels production by moving beyond the limitations of the previously analyzed data, mostly due to a restricted number of speakers (between 1 and 3) and partial information regarding the tract, for EMA, or reduced temporal resolution (14 Hz), for RT-MRI. The way velar aperture varies over time and how it coordinates with other articulators [28] is paramount for their characterization. This dynamic behavior of nasal vowels, starting with a dominant oral segment and ending with a dominant nasal configuration [29], is relevant for their perception [30], and hence understanding it is also important for improving, for instance, articulatory synthesis models. Recent work considering a novel RT-MRI dataset [1,3] acquired at 50 Hz for 11 speakers presented first results for the synchronization of the oral gestures [31], analyzing the data for each speaker individually. However, such rich sets of data open additional possibilities to expand our knowledge on the dynamic nature of nasal vowels, particularly by going beyond a speaker-by-speaker analysis. To this end, two important challenges need to be addressed. First, the considered data need to provide a characterization of the whole vocal tract configuration, and at the same time, support higher time resolutions, a key aspect for studying dynamic sounds such as nasal vowels. Second, since previous research was often restricted to a small number of speakers, the exploration of data providing a wider diversity is paramount to moving research towards more generalizable findings and normative data.
2.2. Data-Driven Analysis and Modeling of Articulatory Data
With the increase of the data available from different technologies supporting speech production studies, as is the case for RT-MRI [32,33], it is paramount to pursue methods that enable its systematic quantitative assessment through unsupervised approaches. These novel approaches can take advantage of the data not only to provide a wider view over the existing diversity (e.g., among speakers), but also to apply unsupervised methods that profit from the amount of data to model the phenomena. To this end, the literature already proposes several data-driven methods for processing and analysis of different data supporting speech studies (e.g., [34,35,36]).
Considering articulatory data extracted from RT-MRI, the authors have explored data-driven approaches to determine critical articulators from vocal tract data extracted from RT-MRI [4,37], expanding an approach proposed for EMA [38]. One notable aspect of the methods conveyed in Silva et al. [4] is that, even though the method considers statistical modeling for the different sounds, the consideration of tract variables aligned with the articulatory phonology framework [39], as grounds for the method, yields results that maintain a connection to the tract anatomy (e.g., constrictions on the tongue tip and body) and are, hence, more interpretable towards a critical discussion of the outcomes and an improved knowledge of speech production. Nevertheless, while this provides valuable information for a wide range of sounds in an unsupervised manner, it is still not able to provide it over time, since it relies on a single vocal tract configuration to represent each sound, often taken at the middle of its production. While this may be adequate to grasp which articulators play a key role in producing each sound (e.g., the tongue body and velum for vowels), how these unfold over the duration of a vowel is key for further understanding the subtlety of the underlying dynamics and coordination.
In a recent work, Carignan et al. [5] propose a novel data-driven approach exploring how vocal tract data extracted from RT-MRI can be tackled by modeling the dynamics of speech production based on multiple repetitions of each sound. In their method, they adopt generalized additive mixed models (GAMMs) applied to vocal tract aperture functions, along with validations of the resulting models using functional linear mixed models (FLMMs) at 20% and 80% of the vowel interval. Overall, these methods model vocal tract aperture over time for given sounds, and they can be useful to gain insight into how sounds are produced, considering data from multiple speakers at once. One aspect deserving particular attention is the interpretability of the results obtained with these data-driven methods, to ensure that by using GAMMs and FLMMs we do not lose sight of the vocal tract anatomy. It is important to interpret the results in light of articulatory changes and not in some unknown variable space resulting from the data-driven process. To achieve this goal, the authors establish a correspondence between data points on the tract aperture functions and anatomical regions and apply this principle to all speakers and repetitions. This allows both an alignment of the tract anatomy among speakers and a subsequent interpretation of how the resulting GAMMs relate to the vocal tract configuration. Given the shown potential of GAMMs as a method to model articulatory data extracted from RT-MRI data, it is important to assess if it can be applied to the study of nasal vowels, particularly to jointly address data from multiple speakers, as described in the following sections.
3. Methods
In what follows, an overall description of the considered data and methods adopted for analysis is provided.
3.1. Data Aquisition
The RT-MRI dataset recordings were performed at the Max Planck Institute for Multidisciplinary Sciences in Göttingen, Germany, using a 3T Siemens Prisma Fit MRI System equipped with a 64-channel head coil. The MRI acquisitions involved a low-flip-angle gradient-echo sequence with radial encodings and a high degree of data undersampling [33]. The setup enabled us to record, in real time, a sequence of images of the vocal tract of the speaker in a midsagittal plane at 50 fps. Audio from the speech was recorded synchronously using an optical microphone (Dual Channel-FOMRI, Optoacoustics, Mazor, Israel), and the output data was annotated using Praat [40].
3.2. Corpus and Speakers
The analysed corpus consists of minimal pairs containing the five stressed oral and nasal point vowels [a, E, i, ↄ, u] and [, ẽ, ĩ, õ, ũ] preceded by bilabial oral or nasal consonants, as in the following words: ‘pato’ [patu] (duck), ‘panto’ [ptu] (word prefix meaning ‘whole’), ‘mato’ [matu] (woods), and ‘manto’ [mtu] (cloak). All words were randomized and repeated in two prosodic conditions: the first with the word in a prosodic prominent position, as opposed to the second, which targets a non-prominent repetition. Three carrier sentences were considered, alternating the verb as follows: diga (‘Say’), ouvi (‘I heard’), leio (‘I read’), as in ‘Leio pato, leio pato baixinho’ (‘I read duck, I read duck gently’). In this article, the corpus considered for the analysis encompasses data from 11 native European Portuguese speakers, and it is part of a larger corpus to study EP nasals that has already been processed and revised.
3.3. MRI Data Processing and Analysis
The main goal was to explore the methods proposed by Carignan et al. [5] and their applicability to study EP nasal vowels from articulatory data extracted from RT-MRI sequences. For this purpose, we have expanded the number of grids in order to include the labial and velar signals, which are particularly relevant to study the nasal vowel dynamics. To find the vocal tract apertures, we have adapted the function to fit and process our acquired data. The proposed method consists of a pipeline with five main steps:
- Image registration—each frame of the dataset is aligned to compensate any movements of the speaker during the recordings.
- Semi-polar grid—after the alignment, a 28-line grid is positioned throughout the vocal tract, starting at the glottis and going to the alveolar ridge.
- Air-tissue boundary detection—as in the other steps, this semi-automatically processes each image to locate the outer boundary of each grid line.
- Aperture estimation —the aperture is calculated from the number of pixels in the gridline that are below a certain threshold of intensity. The gridlines are also grouped in regions (alveolar, palatal, velar, and hyper-pharyngeal region), and this will later be useful for interpreting the results.
- Velum and lip aperture—these are obtained separately: for the velum, principal component analysis (PCA) is used, and lip aperture is estimated based on a region of interest (ROI) and by counting the amount of the dark pixels.
Figure 1 illustrates, in the top row, the steps entailed in positioning the gridlines over the tract and finding the corresponding tract aperture values, along with the manual selection of the velum and lips region, in the second row. To create the new dataset with the data to explore the generalized additive mixed model (GAMM) visualizations, we have followed the approach taken by Carignan et al. [5]. However, as we have interest in the movement of the velum and lips, the data of the semi-polar grid was complemented with the data extracted for velar and lips aperture. To the grid lines obtained in the previous steps, two more data points were added, representing the computed values obtained for the lip aperture obtained in step 5. Additionally, the tract aperture values associated with the grid lines corresponding to the velar region were modified by combining their values with those obtained from the velar aperture PCA computed in step 5. Specifically, a factor of this value was subtracted from the tract aperture in that region, in an attempt to make velar aperture have an impact on the differences between oral and nasal sounds when computing the GAMMs. The bottom row of Figure 1 shows illustrative examples of the results obtained from the dataset.
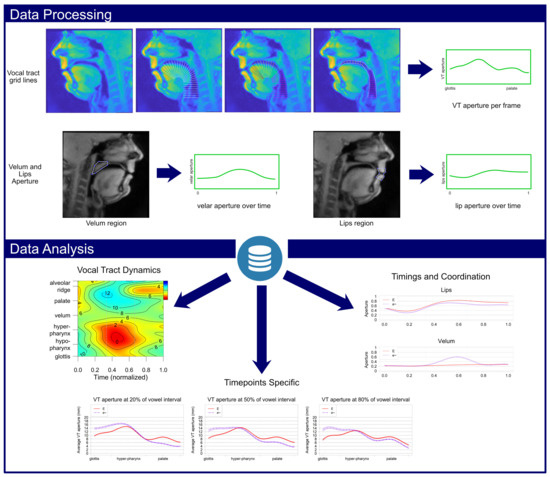
Figure 1.
Diagram depicting the main steps of the adopted processing and analysis methodology. Starting from real-time MRI images of the vocal tract, the tract configuration is extracted, obtaining area functions for the vocal tract, per frame, and velar and lip aperture, over time. Next, this data is grouped based on the sounds of interest, and generalized additive mixed models (GAMMs) and functional linear mixed models (FLMMs) are applied to support the comparison among oral and nasal vowels, along with the analysis of nasal vowel dynamics and coordination.
The GAMMs were computed with R using the mgcv package. The generalized additive model (GAM) function and parameters used were the same as those considered in Carignan et al. [5]. Figure 2 shows the code to compute the GAMMs and FLMMs.
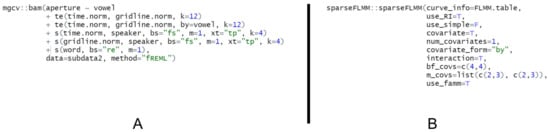
Figure 2.
(A) R code to create the GAMMs. (B) R code to create the FLMMs.
The data considered to compute the GAMMs includes the preceding and following consonants as a context to what is happening in the vocal tract before and after the vowel. Each GAMM is represented considering a normalized time axis with a duration of 1.0: the vowel is at the center one-third, with the preceding consonant—a /p/ or an /m/—and the subsequent consonant—a /t/ or a /d/—shown to the left and right, respectively. In addition to the GAMMs visualizations, two different functional linear mixed models (FLMMs) were computed, in order to have a more detailed analysis: the first FLMM was computed using the vocal tract configuration (apertures) at 20%, 50%, and 80% of the vowel interval, to have a more detailed comparison at the beginning, middle, and end of the vowels; the second was obtained based on the data extracted from the velum and lips, to model their behavior over time, supporting an overall analysis of their coordination.
4. Results
This section presents analyses aimed at both assessing the capabilities of the methods and contributing to the knowledge regarding the temporal aspects of nasal vowel production. The results, obtained from the data for 11 EP speakers, cover an overall analysis of tract dynamics, a more detailed analysis of tract configuration for key timepoints along the vowels, and a general analysis of lip and velar coordination.
4.1. Overall Vocal Tract Dynamics
The assessment of the methods’ capabilities began with an investigation of the evolution in time of the tract. For this, GAMMS were applied to the EP five nasal vowels and oral counterparts. The results obtained for the first prosodic condition (see Section 3.2) are presented in Figure 3 as ‘areagrams’ (spectrogram-like image representations, representing vocal tract areas as a function of tract position and time). In the ‘areagrams’, the vowel appears at the center of each plot (from 0.33 to 0.66 normalized time), with context consonants ([p] and [t]) represented at the beginning and end. Each row of the figure presents the ‘areagram’ for an oral vowel, its nasal congener, and the difference. As no major differences were observed between the two bilabial contexts, only vowels in the context of [p] are shown in the figure. Figure 4 shows the difference ‘areagrams’ for all the oral/nasal vowel pairs in the second prosodic condition. These can be compared with the rightmost column in Figure 3, and they mostly exhibit the same patterns, that is, the differences observed between the oral vowel and its nasal congener show the same pattern for both prosodic conditions. Therefore, from now on, we will only refer to results for the first prosodic condition.
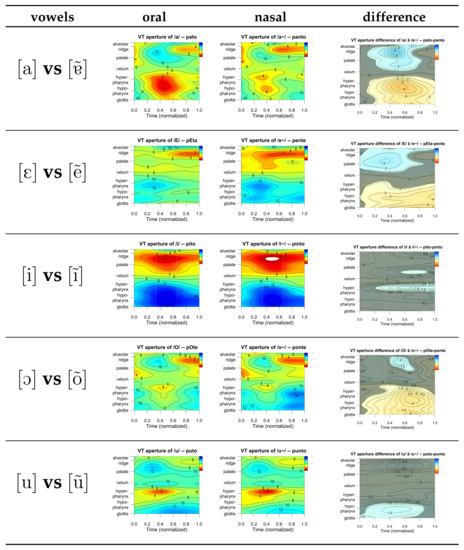
Figure 3.
Results from GAMMs for the five vowel pairs in /p/ context. From left to right, in each row, the plots refer to the oral vowel, the nasal vowel, and the difference between the two. Each GAMM is plotted considering normalized time, from 0.0 to 1.0, and encompasses the previous consonant /p/, the vowel (at the center, from 0.33 to 0.66), and the next consonant. The results for the /m/ context presented similar patterns and are not shown. The plots from the first two columns consider a color scale from 0 (red) to 16 (blue), from a narrower to wider aperture. The rightmost column uses shades of blue for positive difference values and red for negative values, with the gray areas meaning that the GAMMs are very similar.
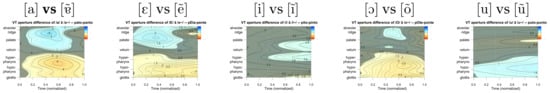
Figure 4.
From left to right, comparison between vowels [a, ɛ, i, ↄ, u] and their nasal counterparts as produced for the second prosodic condition. The images show the difference between the corresponding ‘areagrams’ and are analogous to those presented in the rightmost column in Figure 3 (corresponding to the first prosodic condition). A comparison between the two figures shows a similar difference pattern between orals and their nasal counterparts for the two prosodic conditions. In these representations, shades of blue represent positive values, shades of red stand for negative values, and the gray areas mean that the compared GAMMs are identical.
The leftmost panels for [a] and [i] replicate the results of [5] for [a:, i:] analyzed from 38 speakers of German. In both studies, the palate is expanded and the pharynx constricted for [a], while the palate is constricted and the pharynx expanded for [i]. In our data, nasal [] shows less expansion along the palate and less constriction throughout the pharynx, meaning that this nasal vowel presents a more raised and advanced tongue position than its oral congener.
The dominant grayish color of the difference diagram for [u]/[ũ] and [i]/[ĩ] are clear indications of the very small overall differences for these two pairs of vowels.
For the other three vowel pairs, differences are more noticeable. Differences are negative in the pharynx region, hinting on a more open passage for the nasal vowel in this region. These data hint on a more backed configuration for the orals when compared with the nasal congeners. On the contrary, differences are positive in the alveolo-palatal region, with a maximum at the middle of vowel production, pointing to a higher degree of closure for nasal counterparts. For [ↄ]/[õ], these differences are of lower magnitude and more concentrated at the middle of production.
Overall, the GAMMs presented here were successful in deriving representations from vocal tract area functions, which provide interesting and useful insights regarding oral configurations. However, even with the modifications introduced concerning velar and labial apertures (see Section 3.3), nasality differences between oral and nasal vowels, particularly regarding the velar region, were not evident in the representations.
4.2. Detailed Analysis at Specific Timepoints
After the analysis of the changes of vocal tract during production of oral and nasal vowels with similar articulations, with representative results shown in Figure 3, to have a more detailed grasp of the tract’s configuration, it is worth comparing the tract aperture of related nasal and oral vowels at relevant time-points of their production. Selecting as relevant time-points for comparison the beginning (defined at 20% of vowel production), middle (at 50%), and end (at 80 %), Figure 5 shows superimposed plots of tract apertures for the five vowel pairs for the bilabial context [m]. Similar patterns were observed for the oral bilabial context (after [p]) and are not presented for the sake of brevity.
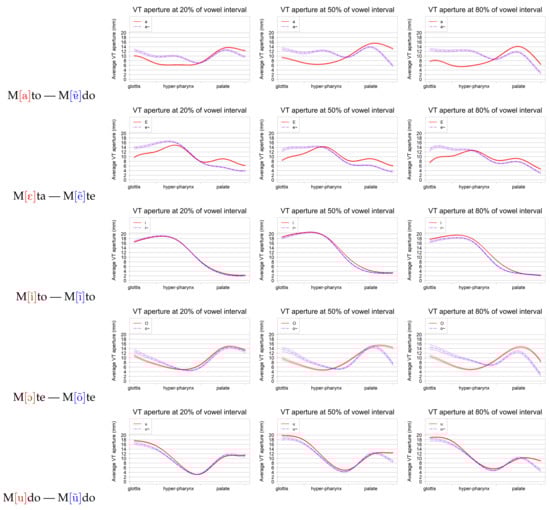
Figure 5.
FLMMs showing the aperture function of the vocal tract for three time points. Each row presents the aperture function for 20%, 50%, and 80%, along the vowel. Each of the presented plots shows, in red, the curve for the oral and, in blue, the curve for the nasal. The curves for the oral bilabial context [p] showed similar patterns, and are thus not presented. The vertical axis represents the aperture, measured in millimeters (i.e., a higher value means a greater vocal tract opening).
The FLMMs obtained confirm relevant differences for non-high vowels pairs [a]/[], [ε]/[ẽ], and [ↄ]/[õ]. VT aperture is larger in the pharyngeal region for all three vowels, providing evidence of a raised tongue position of the nasal vowels, relative to the oral counterparts. On the contrary, slightly smaller apertures are shown in the palatal region, suggesting a slightly more advanced tongue position of the non-high nasal vowels, as indicated already in the GAMMs of the previous subsection.
For [a] and [], the oral vowel exhibits, for both contexts, a higher aperture at the palatal region, consistent with the observed retraction of the tongue position. The opposite effect occurs at the back of the tongue, with a smaller aperture for the oral vowel being a sign of a more posterior configuration compared to the nasal. These differences are similar over time.
The main differences between [ẽ] and [ε] are also similar for the three stages. They consist of a larger area at the pharynx for the nasal vowel, corresponding to a more anterior configuration for the tongue, and a smaller opening of the oral passages in the front, corresponding to an higher position of the tongue. For the pair [ↄ]/[õ], differences are more noticeable at the middle and ending phases, where, as in [ε]/[ẽ], the nasal has a larger area in the pharynx, and a smaller, higher, and more frontal tract configuration. Finally, for vowels [i] and [u], the differences towards their nasal congeners are very small (slightly higher for [u]), and no notable difference appears across contexts. For [u], the nasal shows a slight difference for the alveolar ridge from 50% onward, possibly due to the tongue movement to produce the the following consonant in the considered contexts.
4.3. Timings and Coordination
Coordination and timings are important and challenging aspects to study for nasal vowels. The use of GAMMs and FLMMs makes it possible, for the first time, to consider data from several EP speakers, advancing on previous single-speaker approaches.
Since we aimed to analyze timing and coordination of the lower lip with the velar aperture and compare patterns across vowels, we have recorded vowels produced after a bilabial consonant. Resulting from these analyses of FLMMs, Figure 6 shows the variation in time of the lip and velar aperture for the different oral/nasal pairs.
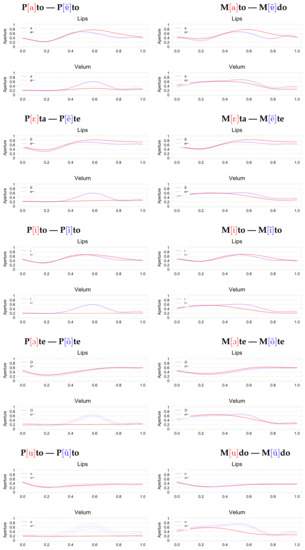
Figure 6.
FLMMs of lip and velar aperture over time for the different vowels and contexts, obtained from articulatory data from 11 speakers. Curves for the oral vowels in red, and for the nasals in blue.
Overall, temporal evolution of velar apertures during vowel production is as expected for both consonantal contexts. For contexts where the vowel is preceded by an oral consonant (i.e., [p]), the velum starts closed, opens during the nasal vowel, and closes again. When the preceding consonant is instead nasal (i.e., [m]), the velum starts open and gradually closes during the oral vowel, or continues closing after the nasal vowel. In the oral context (i.e., after [p]), the velum gestures seem to open simultaneously or shortly after the vowel start (.33) and to close during the coda consonant [t]. For [], and [ĩ], the curves seem compatible with the possibility of lip closure minima after the vowel, occurring slightly before velar closure. However, without further processing—which is outside the scope of the work presented here—it is not possible to make further conclusions.
For vowel [], in both contexts, the lip aperture’s maximum occurs earlier than for the oral vowel. The smaller aperture is consistent with the more closed vowel quality of the nasal congener. Vowels [ẽ] and [ĩ] seem to show a similar (albeit less pronounced) pattern. For the nasals in [p] context, the onset of velar opening (at around 0.3 of duration) seems to happen slightly after lip occlusion release (occurring around 0.2 of duration).
In summary, the FLMMs depict data that is in agreement with the expected general behavior of the lips and velum. The resulting models show only a small variability, apart from a more noticeable error interval observed for [ↄ], [u], and [ũ], hinting at a good representative pattern of the modeled behavior considering the data for the 11 speakers.
5. Conclusions
Profiting from ongoing work in the collection of a new RT-MRI EP dataset for a large number of subjects, this paper presents novel analyses of vocal tract configurations, their variation during vowels production, and the synchronization of velum movement with lip aperture, for EP nasal vowels. The analyses are based in the application of GAMMs to vocal tract apertures estimated from RT-MRI images recorded at 50 fps.
In general, the main objectives defined were accomplished: (1) The method adopted for dynamic analysis of RT-MRI data of the vocal tract is an evolution of recent methods based in GAMMs. (2) The applicability of such methods to nasal vowels production studies was assessed in several aspects with good results. (3) New results were produced regarding EP nasal and oral vowels production, with the novel characteristic of resulting from multi-speaker analyses.
The methods explored in this article allowed us to explore, in an elegant and innovative way, data from a broad group of speakers to obtain a general model of the dynamics of the tract throughout the production of oral and nasal vowels. Although it is a first exploration, the results obtained have allowed the identification of various aspects of interest regarding the nasal vowels based on RT-MRI data for a considerable number of speakers.
As shown for Brazilian Portuguese [23], we also found oropharyngeal adjustments in the low nasal vowel, giving evidence for a more raised tongue position than the oral congener. This was already taken into account by the transcription of this sound in the IPA [20]. Adjustments were also found for the mid vowels, suggesting a raised and more advanced position of the tongue in the production of the nasal congeners in a similar way as has been shown for French [17].
However, we did not find any adjustments in the high vowels, as was shown in BP [23]. This may partially explain why high nasal vowels sound less nasalized in European than in Brazilian Portuguese, but more research is needed to explore these questions.
The results obtained for the 11 speakers with the proposed method corroborate previous studies reporting for [ĩ] and [ũ] the similarity of the vocal tract configuration and its variation in time when compared to the corresponding oral vowels and a sharper difference in the configuration between [a] and [], which is slightly more pronounced at the end of the vowel.
As previous results are generally for a speaker or a small set of speakers, this additional support for the characterization of the oral configuration for nasal vowels, the differences and similarities for the oral congeners, and the temporal organization is of paramount relevance for the advancement of description and modeling of this very relevant class of sounds for the Portuguese language, with implications in phonetics, speech therapy, and articulatory synthesis.
The larger variability of the velar opening for the nasal vowel [ũ] is one of the most interesting results obtained. We can conjecture that this variation may be associated with the proximity of the posterior part of the tongue to the velum, which will lead to less well-defined adjustments and timings. It is also possible that artifacts may be caused in the RT-MRI, image thus introducing a greater dispersion of aperture estimates. Accurate identification of the effective causes of this variation observed in [ũ] requires further investigation. This future work to clarify the adjustments in question should, among other things, consider information on the movement of the body of the tongue in relation to the pharynx.
Regarding coordination, the FLMMs showed some potential for creating possible coordination models based on a large set of speakers; the results obtained point to an anticipatory closure/minimal area of the lips with respect to velar closure. The closure of the velum after the time of the vowel duration (.66) could give some evidence for the appearance of a short nasal consonant in the acoustic signal. However, to confirm this—which would provide evidence supporting the occurrence of a small consonantal nasal tail—a more detailed analysis is required including, for example, automatic determination of the opening and closing events from the aperture curves.
The efforts to include data for the lips and nasal aperture in the information considered by GAMMs did not provide a basis for identification of nasality differences when comparing oral and nasal vowels with similar oral articulations. This limitation is possibly a result of the smoothing implied by GAMMs, which prevents properly addressing changes of limited spatial scope, as is the case of the changes in the velar region. Further work to improve these aspects is required. From previous experience (e.g., [4]), a first approach with potential would be an exploration of the methods adopted in this paper with data extracted not directly from images, but from tract segmentations—techniques that would allow one to consider direct measures of the velopharyngeal passage and interlip distance, as we considered in [4], from RT-MRI.
Author Contributions
Conceptualization, S.S. and A.T.; data curation, N.A. and C.C.; formal analysis, N.A.; funding acquisition, S.S., C.C. and A.T.; investigation, N.A., S.S. and A.T.; methodology, N.A., S.S., C.C. and A.T.; project administration, S.S., C.C. and A.T.; resources, C.C.; software, N.A.; supervision, S.S. and A.T.; validation, N.A.; visualization, N.A.; writing—original draft, N.A., S.S. and A.T.; writing—review and editing, S.S., C.C. and A.T. All authors have read and agreed to the published version of the manuscript.
Funding
This work is partially funded by the German Federal Ministry of Education and Research (BMBF, KZ:01UL1712X), by IEETA Research Unit funding (UIDB/00127/2020), by Portugal 2020 under the COMPETE Program, and by the European Regional Development Fund through project MEMNON (POCI-01-0145-FEDER-028976).
Institutional Review Board Statement
Not applicable.
Informed Consent Statement
Informed consent was obtained from all subjects involved in the study.
Data Availability Statement
Data is contained within the article.
Acknowledgments
A word of thanks is due to Christopher Carignan for sharing the scripts that served as the basis for the methods explored here.
Conflicts of Interest
The authors declare no conflict of interest. The funders had no role in the design of the study; in the collection, analyses, or interpretation of data; in the writing of the manuscript, or in the decision to publish the results.
References
- Cunha, C.; Almeida, N.; Frahm, J.; Silva, S.; Teixeira, A. Data-driven analysis of nasal vowels dynamics and coordination: Results for bilabial contexts. In Proceedings of the IberSPEECH, Valladolid, Spain, 24–25 March 2021; pp. 215–219. [Google Scholar]
- Iltis, P.W.; Frahm, J.; Voit, D.; Joseph, A.A.; Schoonderwaldt, E.; Altenmüller, E. High-speed real-time magnetic resonance imaging of fast tongue movements in elite horn players. Quant. Imaging Med. Surg. 2015, 5, 374. [Google Scholar] [PubMed]
- Cunha, C.; Silva, S.; Teixeira, A.; Oliveira, C.; Martins, P.; Joseph, A.A.; Frahm, J. On the Role of Oral Configurations in European Portuguese Nasal Vowels. In Proceedings of the 20th Annual Conference of the International Speech Communication Association (Interspeech), Gratz, Austria, 15–19 September 2019; pp. 3332–3336. [Google Scholar] [CrossRef]
- Silva, S.; Almeida, N.; Cunha, C.; Joseph, A.; Frahm, J.; Teixeira, A. Data-Driven Critical Tract Variable Determination for European Portuguese. Information 2020, 11, 491. [Google Scholar] [CrossRef]
- Carignan, C.; Hoole, P.; Kunay, E.; Pouplier, M.; Joseph, A.; Voit, D.; Frahm, J.; Harrington, J. Analyzing speech in both time and space: Generalized additive mixed models can uncover systematic patterns of variation in vocal tract shape in real-time MRI. Lab. Phonol. J. Assoc. Lab. Phonol. 2020, 11, 1–26. [Google Scholar] [CrossRef]
- Teixeira, A.; Vaz, F. European Portuguese Nasal Vowels: An EMMA Study. In Proceedings of the 7th European Conference on Speech Communication and Technology, EuroSpeech—Scandinavia. CPK/ISCA. Aalborg, Denmark, 3–7 September 2001; Volume 2, pp. 1843–1846. [Google Scholar]
- Rossato, S.; Teixeira, A.; Ferreira, L. Les Nasales du Portugais et du Français: Une étude Comparative sur les données EMMA. Journées d’Etude sur la Parole. 2006. Available online: http://jep2006.irisa.fr/openconf/author/final/final-114.pdf (accessed on 18 January 2022).
- Oliveira, C.; Teixeira, A. On Gestures timing in European Portuguese nasals. In Proceedings of the 16th International Congress of Phonetic Sciences (ICPhS), Saarbrücken, Germany, 6–10 August 2007. [Google Scholar]
- Oliveira, C.; Martins, P.; Teixeira, A. Speech Rate Effects on European Portuguese Nasal Vowels. In Proceedings of the 10th Annual Conference of the International Speech Communication Association (Interspeech), Brighton, UK, 6–10 September 2009. [Google Scholar]
- Martins, P.; Carbone, I.; Silva, A.; Teixeira, A. An MRI study of European Portuguese nasals. In Proceedings of the 8th Annual Conference of the International Speech Communication Association (Interspeech), Antwerp, Belgium, 27–31 August 2007. [Google Scholar]
- Martins, P.; Carbone, I.; Pinto, A.; Silva, A.; Teixeira, A. European Portuguese MRI based speech production studies. Speech Commun. 2008, 50, 925–952. [Google Scholar] [CrossRef][Green Version]
- Teixeira, A.; Martins, P.; Oliveira, C.; Ferreira, C.; Silva, A.; Shosted, R. Real-Time MRI for Portuguese. In Proceedings of the Computational Processing of the Portuguese Language, PROPOR 2012, Lecture Notes in Computer Science/LNAI, Coimbra, Portugal, 17–20 April 2012; Volume 7243. [Google Scholar]
- Oliveira, C.; Martins, P.; Silva, S.; Teixeira, A. An MRI study of the oral articulation of European Portuguese nasal vowels. In Proceedings of the 13th Annual Conference of the International Speech Communication Association (Interspeech), Portland, OR, USA, 9–13 September 2012. [Google Scholar]
- Carignan, C.; Shosted, R.; Shih, C.; Rong, P. Compensatory articulation in American English nasalized vowels. J. Phon. 2011, 39, 668–682. [Google Scholar] [CrossRef]
- Shosted, R.; Carignan, C.; Rong, P. Managing the distinctiveness of phonemic nasal vowels: Articulatory evidence from Hindi. J. Acoust. Soc. Am. 2012, 131, 455–465. [Google Scholar] [CrossRef] [PubMed]
- Carignan, C. An acoustic and articulatory examination of the “oral” in “nasal”: The oral articulations of French nasal vowels are not arbitrary. J. Phon. 2014, 46, 23–33. [Google Scholar] [CrossRef]
- Carignan, C.; Shosted, R.K.; Fu, M.; Liang, Z.P.; Sutton, B.P. A real-time MRI investigation of the role of lingual and pharyngeal articulation in the production of the nasal vowel system of French. J. Phon. 2015, 50, 34–51. [Google Scholar] [CrossRef]
- Carignan, C. Covariation of nasalization, tongue height, and breathiness in the realization of F1 of Southern French nasal vowels. J. Phon. 2017, 63, 87–105. [Google Scholar] [CrossRef]
- Carignan, C.; Coretta, S.; Frahm, J.; Harrington, J.; Hoole, P.; Joseph, A.; Kunay, E.; Voit, D. Planting the seed for sound change: Evidence from real-time MRI of velum kinematics in German. Language 2021, 97, 333–364. [Google Scholar] [CrossRef]
- Redenbarger, W.J.; Mateus, M.H.; d’Andrade, E. (2000). The phonology of Portuguese. Oxford: Oxford University Press. Pp. x+ 162. Phonology 2001, 18, 309–312. [Google Scholar] [CrossRef]
- Meireles, A.R.; Goldstein, L.; Blaylock, R.; Narayanan, S.S. Gestural coordination of Brazilian Portugese nasal vowels in CV syllables: A real-time MRI study. In Proceedings of the 18th International Congress of Phonetic Sciences (ICPhS), Glasgow, Scotland, UK, 10–14 August 2015. [Google Scholar]
- Desmeules-Trudel, F. The aerodynamics of vowel nasality and nasalization in Brazilian Portuguese. In Proceedings of the 18th International Congress of Phonetic Sciences (ICPhS), Glasgow, Scotland, UK, 10–14 August 2015. [Google Scholar]
- Barlaz, M.; Shosted, R.; Fu, M.; Sutton, B. Oropharygneal articulation of phonemic and phonetic nasalization in Brazilian Portuguese. J. Phon. 2018, 71, 81–97. [Google Scholar] [CrossRef]
- Teixeira, A.; Martinez, R.; Silva, L.N.; Jesus, L.; Prí ncipe, J.; Vaz, F. Simulation of Human Speech Production Applied to the Study and Synthesis of European Portuguese. EURASIP J. Appl. Signal Process. 2005, 9, 1435–1448. [Google Scholar] [CrossRef]
- Teixeira, A.; Oliveira, C.; Barbosa, P. European Portuguese articulatory based text-to-speech: First results. In International Conference on Computational Processing of the Portuguese Language; Springer: Berlin/Heidelberg, Germany, 2008; pp. 101–111. [Google Scholar]
- Oliveira, C. Do Grafema ao gesto: Contributos Linguísticos para um Sistema de Síntese de base articulatória. Dissertação de Doutoramento, Universidade de Aveiro, Aveiro, Portugal, 2009. [Google Scholar]
- Martins, P.; Oliveira, C.; Silva, S.; Teixeira, A. Velar movement in European Portuguese nasal vowels. In Proceedings of the IberSpeech—VII Jornadas en Tecnología del Habla and II Iberian SLTech Workshop, Madrid, Spain, 15 June 2012; pp. 231–240. [Google Scholar]
- Teixeira, A.; Vaz, F.; Príncipe, J.C. Nasal Vowels After Nasal Consonants. In Proceedings of the 5th Seminar on Speech Production: Models and Data, Kloster Seeon, Bavaria, Germany, 1–4 May 2000. [Google Scholar]
- Parkinson, S. Portuguese nasal vowels as phonological diphthongs. Lingua 1983, 61, 157–177. [Google Scholar] [CrossRef]
- Teixeira, A.; Vaz, F.; Príncipe, J.C. Influence of Dynamics in the Perceived Naturalness of Portuguese Nasal Vowels. In Proceedings of the 14th International Congress of Phonetic Sciences (ICPhS 99), San Francisco, CA, USA, 1–7 August 1999. [Google Scholar]
- Almeida, N.; Cunha, C.; Silva, S.; Teixeira, A. Assessing Velar Gestures Timing in European Portuguese Nasal Vowels with RT-MRI Data. In International Conference on Speech and Computer (SPECOM); Springer: Berlin/Heidelberg, Germany, 2021; pp. 26–35. [Google Scholar]
- Scott, A.D.; Wylezinska, M.; Birch, M.J.; Miquel, M.E. Speech MRI: Morphology and function. Phys. Medica 2014, 30, 604–618. [Google Scholar] [CrossRef] [PubMed]
- Uecker, M.; Zhang, S.; Voit, D.; Karaus, A.; Merboldt, K.D.; Frahm, J. Real-time MRI at a resolution of 20 ms. NMR Biomed. 2010, 23, 986–994. [Google Scholar] [CrossRef] [PubMed]
- Lammert, A.C.; Proctor, M.I.; Narayanan, S.S. Data-driven analysis of realtime vocal tract MRI using correlated image regions. In Proceedings of the 11th Annual Conference of the International Speech Communication Association (Interspeech), Makuhari, Chiba, Japan, 26–30 September 2010; pp. 1572–1575. [Google Scholar]
- Chao, Q. Data-driven approaches to articulatory speech processing. Ph.D. Thesis, University of California, Merced, CA, USA, 2011. [Google Scholar]
- Black, M.P.; Bone, D.; Skordilis, Z.I.; Gupta, R.; Xia, W.; Papadopoulos, P.; Chakravarthula, S.N.; Xiao, B.; Van Segbroeck, M.; Kim, J.; et al. Automated evaluation of non-native English pronunciation quality: Combining knowledge-and data-driven features at multiple time scales. In Proceedings of the 16th Annual Conference of the International Speech Communication Association (Interspeech), Dresden, Germany, 6–10 September 2015; pp. 493–497. [Google Scholar]
- Silva, S.; Teixeira, A. Unsupervised segmentation of the vocal tract from real-time MRI sequences. Comput. Speech Lang. 2015, 33, 25–46. [Google Scholar] [CrossRef]
- Jackson, P.J.; Singampalli, V.D. Statistical identification of articulation constraints in the production of speech. Speech Commun. 2009, 51, 695–710. [Google Scholar] [CrossRef]
- Browman, C.P.; Goldstein, L. Gestural specification using dynamically-defined articulatory structures. J. Phon. 1990, 18, 299–320. [Google Scholar] [CrossRef]
- Boersma, P. Praat: Doing phonetics by Computer [Computer Program]. 2020. Available online: http://www.praat.org/ (accessed on 15 December 2021).
Publisher’s Note: MDPI stays neutral with regard to jurisdictional claims in published maps and institutional affiliations. |
© 2022 by the authors. Licensee MDPI, Basel, Switzerland. This article is an open access article distributed under the terms and conditions of the Creative Commons Attribution (CC BY) license (https://creativecommons.org/licenses/by/4.0/).