1. Introduction
To mitigate the effects of fossil fuels and climate change, it is necessary to consider alternative means for generating electricity. In the last decade, renewable generation technologies have been developed and improved, such as solar and wind power, which are freely available natural resources [
1]. Currently, they are also used to electrify locations not interconnected with the electricity grid, as well as to provide resilience during power systems outages.
Thus, this paper intends to use of renewable energy, specifically microgrids (MGs) to provide resilience during extreme common events in Puerto Rico, such as hurricanes. In 2017, hurricanes María and Irma devastated Puerto Rico, resulting in power outages that lasted for several months. The outages impacted various areas of the local economy, and the education was one of the most severely affected. Universities around the island were closed, hindering education for national and international students due to the prolonged power outage. For this reason, the implementation of MGs on university campuses has been considered to improve the reliability and to have a backup during electrics emerges. MGs have been successfully implemented in universities around the world, in places such as Xiamen, Warwick and Illinois [
1,
2,
3,
4,
5] to improve the reliability of the electrical system.
The US Department of Energy (DOE) define a MG as “a group of interconnected loads and distributed energy resources within clearly defined electrical boundaries that acts as a single controllable entity with respect to the grid. A MG can connect and disconnect from the grid to enable it to operate in both grid-connected or island-mode” [
6]. The current regulations that apply to these types of connections, such as for protection and control systems, must be considered [
7,
8].
MGs have been extensively investigated in literature. For instance, the authors in [
1] researched the implementation of a MG at Xiamen University in China. The authors explored the implementation of a DC MG in commercial buildings. They implemented a MG using solar energy on the rooftop of the engineering building. The main power supply on the rooftop was 150 kW and can supply different DC loads, such as air conditioning, electric car charging stations, and LED lighting. One of the advantages of this MG is that it can be remotely monitored and controlled through computers, and tablets or smartphones. In addition, other advantages are to reduce energy consumption, and offset carbon emissions.
Some universities researched MG implementation with other technologies to reduce fuel consumption. The combined heat and power (CHP) is one such technology and it can provide electricity and heat simultaneously. Wang et al. developed a dynamic Simulink model and it was compared with an existing micro-CHP system at the University of Warwick. The results suggest that the experimental test matched the measured data, which compared different scenarios. The authors highlighted that CHP improves efficiency in contrast to traditional plants, with lower fuel consumption and environmental effects. These conclusions make the CHP system an excellent option for district energy supply, such as those encountered in university campuses [
2]
A similar MG [
1] was implemented at the Illinois Institute of Technology (IIT). The total generation capacity (12 MW) included natural gas turbines, solar generation, wind generation, backup generation such as batteries (BESS), and small storage devices. IIT’s MG can be operated in two modes: grid-connected and islanded mode, and it is in compliance with IEEE 1547 standard on islanding and reconnection [
3]. Different research has been developed to improve the IIT MG. For example, the implementation of high reliability distribution system (HDRS) with the capacity to supply AC and DC loads [
4,
5]. In that sense, other authors have been researching key performance indicators to obtain real contribution from the MG. In these studies, the reduction in energy consumption, increase’s percentage of power generation from renewable resources, air quality and others highlight as key indicators, as you can be seen in [
9]. Other features of the MG are also considered. For example, in [
10] the optimal design and financial feasibility is researching. This study is carried out to investigate the technical and financial feasibility of deploying a microgrid in a university campus.
This paper addresses the location of MG, which can house quarter an emergency operations center (EOC). It also describes its operation, size, and definition of the electrical lines and switches, etc. The aim is to propose a methodology to design, model and simulate a MG for areas in university campuses that operates critical loads and offers services to the local communities. The contributions of this paper are defined as follows:
study and define critical loads of university campuses;
analyze the local energy resource and determine the sources of renewable and non-renewable energy that can be used in a MG;
analyze storage systems to determine the percentage of renewable penetration that can affect the system dynamics;
determine the most suitable infrastructure of the distribution system for implementing a MG;
propose a MG that complies with the current local and international regulations and guides.
This document is divides in several sections.
Section 2 presents the mathematical formulation of the MG design problem.
Section 3 describes the proposed and developed methodology to design a MG for a university campus.
Section 4 discusses the test scenario used for the validation of the proposed methodology. This also included the minimum requirements and regulations for the design of a MG.
Section 5 shows the results obtained from the implementation of the proposed methodology. Finally,
Section 6 presents the conclusions and future work.
2. Problem Formulation
There are three known economic sector classifications. The first sector contributes to the added value of entities dedicated to obtaining natural resources, such as mining, castle raising, and fishing. On the other hand, the second sector transform the raw materials into consumer products as industries. The third sector, which community services, includes universities. To provide its services, universities typically rely on the power grid, namely, a suitable electrical infrastructure, which consists of a main distribution substation and secondary distribution substations.
The University of Puerto Rico Mayagüez Campus can accommodate around 12,000 students and requires a reliable source of electrical energy to provide a public service to the university community. Due to the geographical location of the University of Puerto Rico campuses, they are prone to outages related to climatic factors, such as hurricanes, so the need arises to have an electrical backup system, such as MGs, that can service critical loads after a disaster. During hurricane María, the university community was affected hindering normal operations due to power outages [
11]. To mitigate these effects, this work propose a methodology for MG implementation in university campuses to provide reliability and backup power supply.
3. Proposed Methodology
Within the methodology for the implementation of a MG in a University campus, different aspects must be considered, such as social, economic, political, etc. For example, feasibility studies in accordance with guidelines and standards in which requirements are considered as goals in reliability, organization, and education of stakeholders and authorities involved in the process. Additionally, must be considered aspects that allow defined the performance of the any MG within a university campus. The following subsections describe the considerations for implementing a MG on a university campus. The methodology proposed in this paper is showed in the
Figure 1.
3.1. Determine the Available Energy Resources
There are many options to produce electrical energy, such solar, wind, ocean, hydro-power, geothermal, and bio-energy. These resources may vary with geographical location, regarding resource availability and adequacy. To collect the necessary data, meteorological stations measuring solar radiation, wind speed, etc., are used. The International Renewable Energy Agency (IRENA) [
12] presents an overview of the renewable energy resources available according to several geographical locations. The data are shown in
Table 1.
3.2. Access MG Point Common Coupling (PCC) Data
For the electrical design, it is necessary to have access to electrical system parameters, such as type of conductor, current capacity, length, as well as the location of transformers, cabinets, and protection elements. Once the technical features and data necessary have been defined, the system is implemented on simulation software, to model its steady state behavior. It is also important to consider MG footprint, such as available rooftop and free areas for the installation.
3.3. Construction of Demand Profiles: Critical Loads
Data collection consists of a description of the energy consumption by the different electrical loads in the system, giving higher priority to critical loads.
The needs of the community require a study with the stakeholders to understand the use and prioritization of energy. It is important to mention that the priority depends on the availability of electrical energy, in addition to social, cultural, and political contexts [
13,
14].
3.4. Microgrid Design
For the MG design, the details and investigations described in this document must be considered. When considering the use of renewable energies to integrate them into MG, it is important to consider the climatic conditions and the availability of energy on site. Several other factors must be considered, such as available energy resources, physical space available, modification in the electrical system, if are required and standards and regulations.
3.4.1. Available Energy Resources—Electrical Model
In different universities around the world, penetration of photovoltaic (PV) solar energy has been studied to determine the effects in the power system, such as voltage variations and power injections. These studies have found that MGs produce variations in frequency and voltage, as expected; however, the variations are within admissible values. It is important to mention that PV technology is an excellent option to use, since many studies [
15,
16,
17] demonstrate its. Benefits regarding environmental, electrical, and economical aspects.
Through photovoltaic technology, a current is produced by the movement of electrons when exposing cells to sun irradiance, generating electrical power. The main factors that influence the generated energy from the PV are the sun irradiance and temperature. After a through literature review, it was found that the most used models to represent solar photovoltaic modules are the single and two diode models. Different variations of these models were found, being the simplified single diode (SSD), the single-diode model (SDM), the two-diode model the most relevant. Recently the three diode model (TDM) has been presented [
18]. The block diagram used to represent the PV system model is shown in
Figure 2.
For this work, the SDM was selected because it is the most helpful in terms of accuracy vs complexity. The solar panels are modeled as an injection of sinusoidal current. Equation (
1) represents the mathematical model of the SDM [
19].
where
denotes the output current of the PV cell,
corresponds to output voltage of the PV cell.
and
are the diode reverse saturation current and the photogenerated current, respectively.
q represents the electron charge.
is the number of cells,
K is the Boltzman constant,
T is the absolute temperature (in
K) of the pn-junction, and
A, represents the diode ideality factor.
After considering several models, the combined heat and power (CHP) model proposed in [
20] was chosen. The Rowen model was selected after conducting a study in the Microgrids Laboratory in collaboration with Sandia National Lab due to its simplicity in implementation. More detail of the model is presented in [
19].
The model implemented in Simulink consists of a compressor and turbine, fuel system, acceleration, temperature, and governor control.
Figure 3 shows a general diagram of the CHP model.
The energy storage system (ESS) complements the PV generators. It represents an additional initial cost in the MG project. The ESS supplies energy to the MG in cloudy days or at night when PV systems are not working. Currently, there are different methods and mechanisms for storage energy, for example batteries, fuel cells, supercapacitors, and flywheels. Those technologies offer considerable benefits to the grid, such as fossil fuel reduction [
21]. However, this research uses ion-lithium batteries as an energy storage system. Batteries have many technologies that are described in [
22,
23].
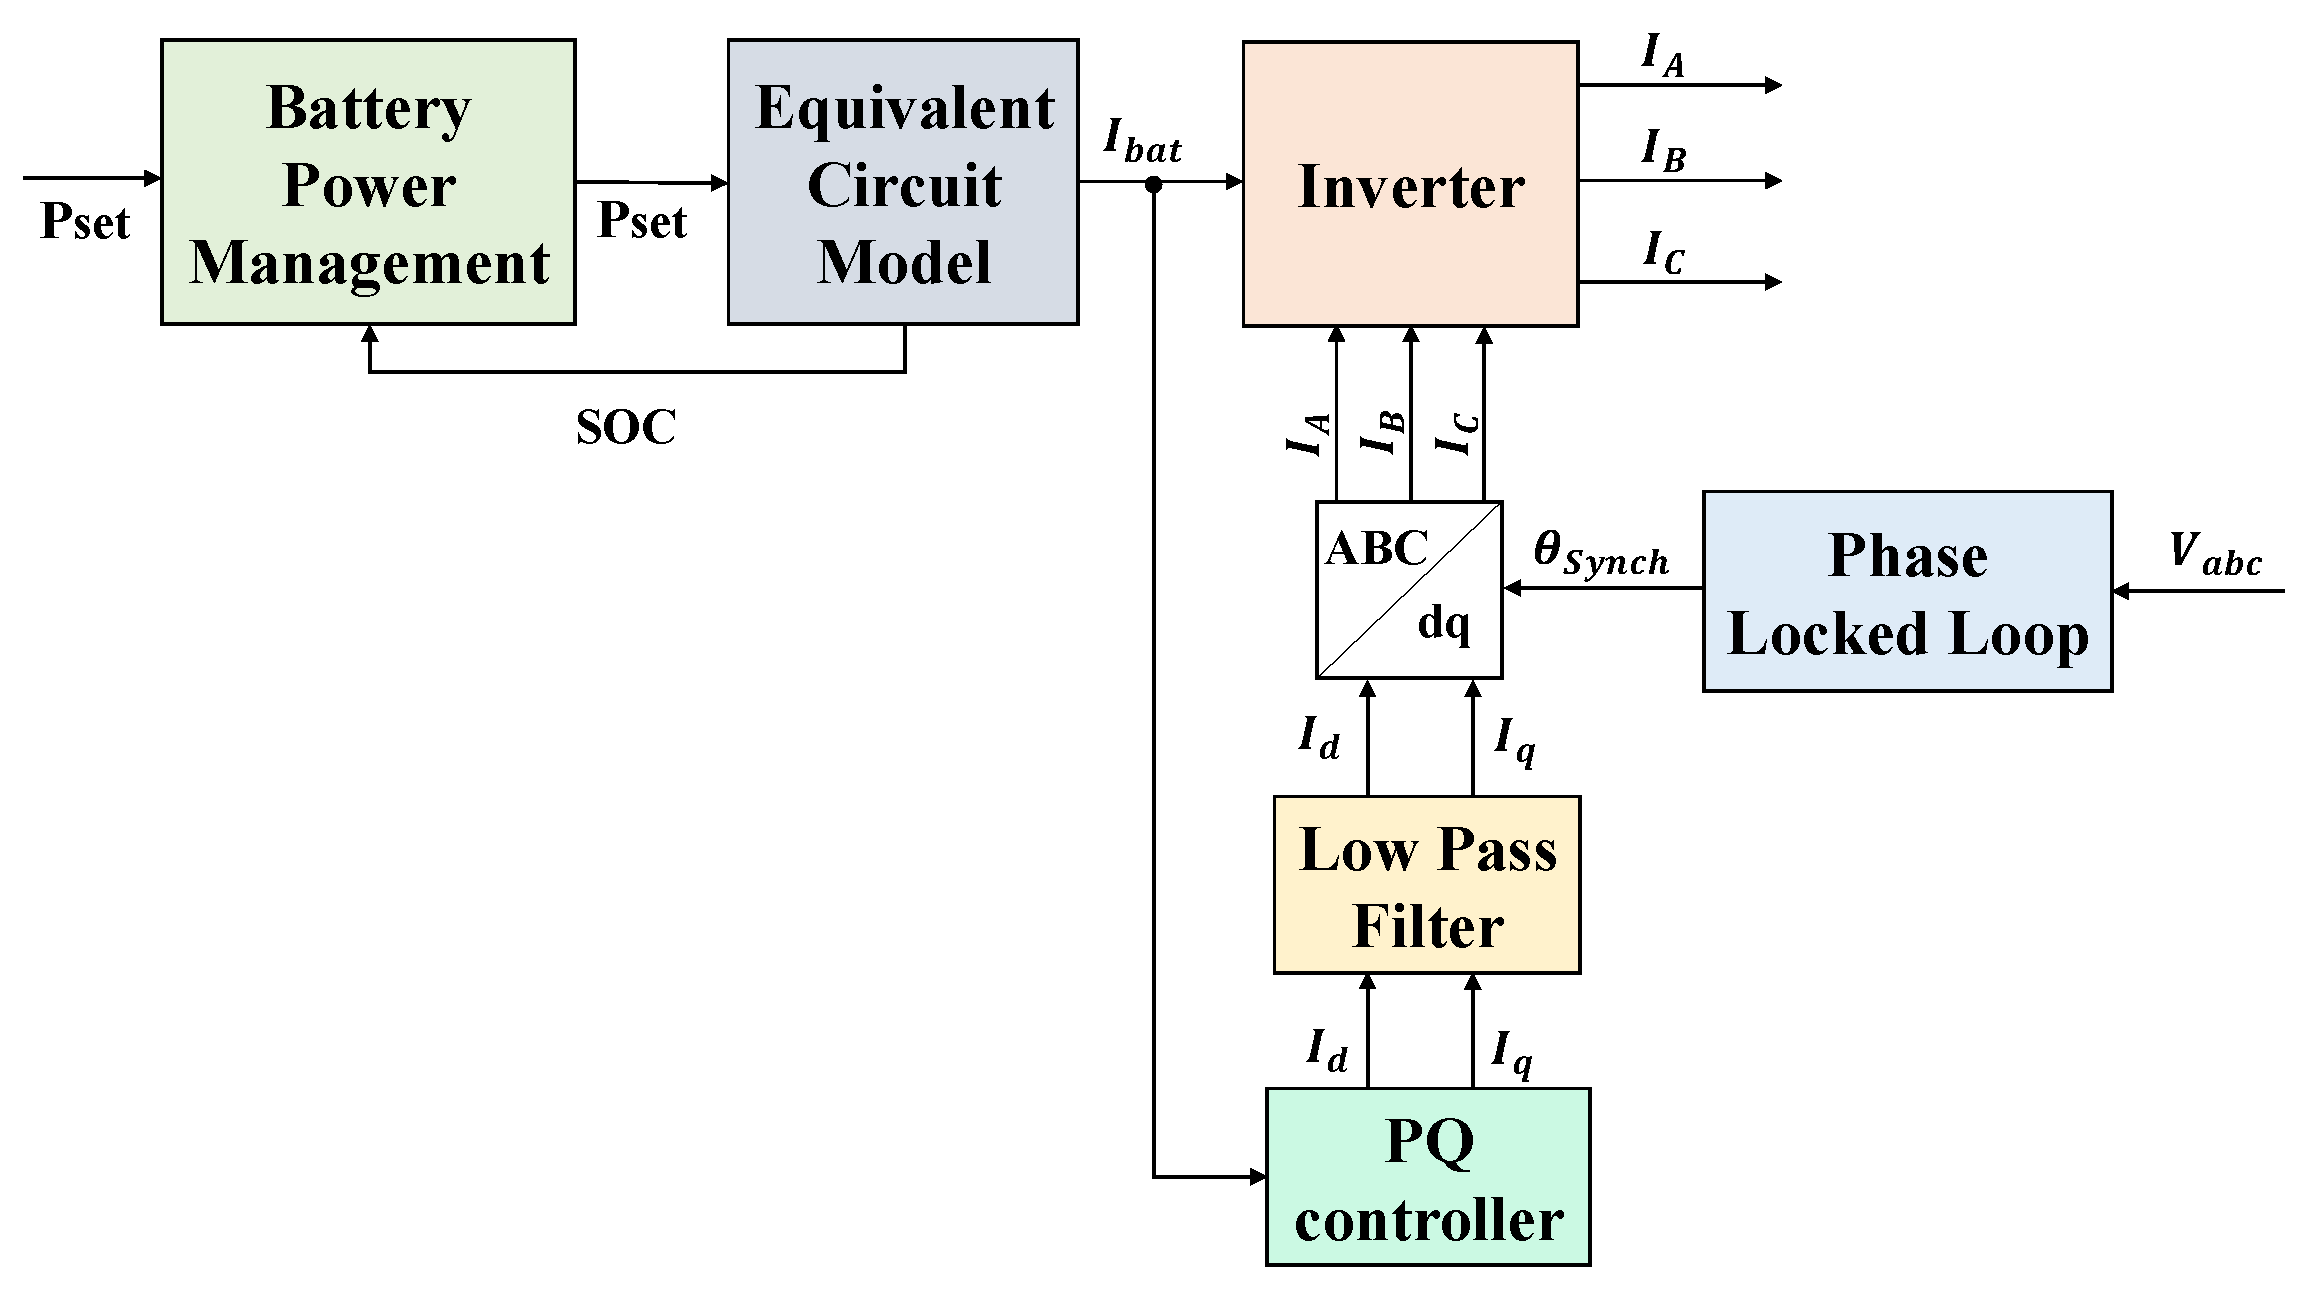
The model selected was an equivalent electric circuit because it has better accuracy, and it is not as complex as the mathematical model. Considering the information obtained from the literature and from the forecast for 2030 stated in IRENA about the lithium-ion batteries as leadership of the technology. This model is composed by a voltage source with a series resistor, representing the battery’s open circuit voltage (OCV) and internal resistance, respectively. Moreover, two RC networks in series were used to represent the electrochemical and concentration polarization of the battery. The voltage source was modeled using a lookup table that describes the relationship between the OCV and the battery level, which can be used to calculate the dynamic values of the battery’s internal resistances and the two RC networks. In the same way as in PV model, the inverter was modeled as a continuous ideal AC current source. Finally, a phase-locked loop (PLL) was used to perform the synchronization with the grid. This model was constructed in Simulink, as the other models. The representation model is shown in
Figure 4.
3.4.2. Physical Space Available for the Installation of the Microgrid
Once the sources and resources that will be part of the MG have been determined, it is necessary to find available space where it can be installed, such as roofs, parking lots, and undeveloped land. You should also consider looking for places that, in addition to having space availability, offer an area in which resources can be maximized. To save on installation costs, the proximity between the generation (MG) and the load must be considered. In the case of CHP, it is important to consider the use of thermal energy, to find a strategic place for its installation.
3.4.3. Modifications in the Electrical System
To install the MG, modifications must be made to the electrical system. It is important to consider the capacity of the electrical conductors, so as not to hinder the operation of the electrical system. If necessary, a simulation can provide information on whether the conductors should be replaced with higher capacity ones according to [
24] or the location of the new generators. Another consideration in the design of the MG is to verify that the voltage profiles do not have variations of more than 5% of the nominal voltage in the nodes. This node can be caused by the topological change of the circuit after the installation of the MG. Due to the topological change and possible change of conductors, the change in the protection system must also be considered, as it is directly related to the gauge of the conductors.
3.4.4. Guidelines as Current Standards and Regulations
Although alternative energy sources can benefit the environment, a high penetration of these sources can result in the deterioration of the capacity of the grid, power quality, and reliability response, due to the significant reduction in the level of inertia in electrical systems that use conventional generators. The distribution grid must be updated and improved to allow the integration of distributed generators to meet flexible needs. Current regulations are “IEEE standard for Interconnection and Interoperability of Distributed Energy Resources with Associated Electric Power systems Interfaces” [
25].
4. Test Scenario—UPRM
The methodology described in this document, which is shown in
Section 3, was developed at the University of Puerto Rico at Mayagüez (UPRM). The obtained results are shown in this section. A sketch of the University is shown in the
Figure 5. The numbers in the figure corresponding to building identification.
4.1. Available Energy Resource
Several studies have proven that the geographic position of Puerto Rico (latitude 18°) is an excellent location, approximately five hours of direct solar radiation is received every day of the year [
26]. Solar power is a technology that can be installed in building rooftops and it is not necessary sacrifice to land resources [
27].
Solar energy has variations, due to the movement of the clouds, which produces variations in the output of the PV plant [
28]. As a backup, the use of energy storage is necessary. In addition, energy storage can provide energy during the night. In addition to clean energy sources, there are also alternative energy sources that can be of great benefit such as combined heat and power. They have high efficiency and are useful in multiple applications where, in addition to electrical energy, thermal energy is necessary [
19].
In summary, PV solar energy, combining heat and power and storage by means of batteries, are an excellent combination for a MG located in the University of Puerto Rico, since it allows a great use of energy sources.
4.2. Electrical Design Access
In the case of the University of Puerto Rico, in Mayagüez, it was necessary to contact the personnel manager, who provided electrical drawing designed in the AUTOCAD software. Through the one-line diagram and descriptive files of the spatial location of the electrical devices, a file was built recreating the lines with their resistive and inductive properties, the capacitive effect was neglected because the distance between elements is very short.
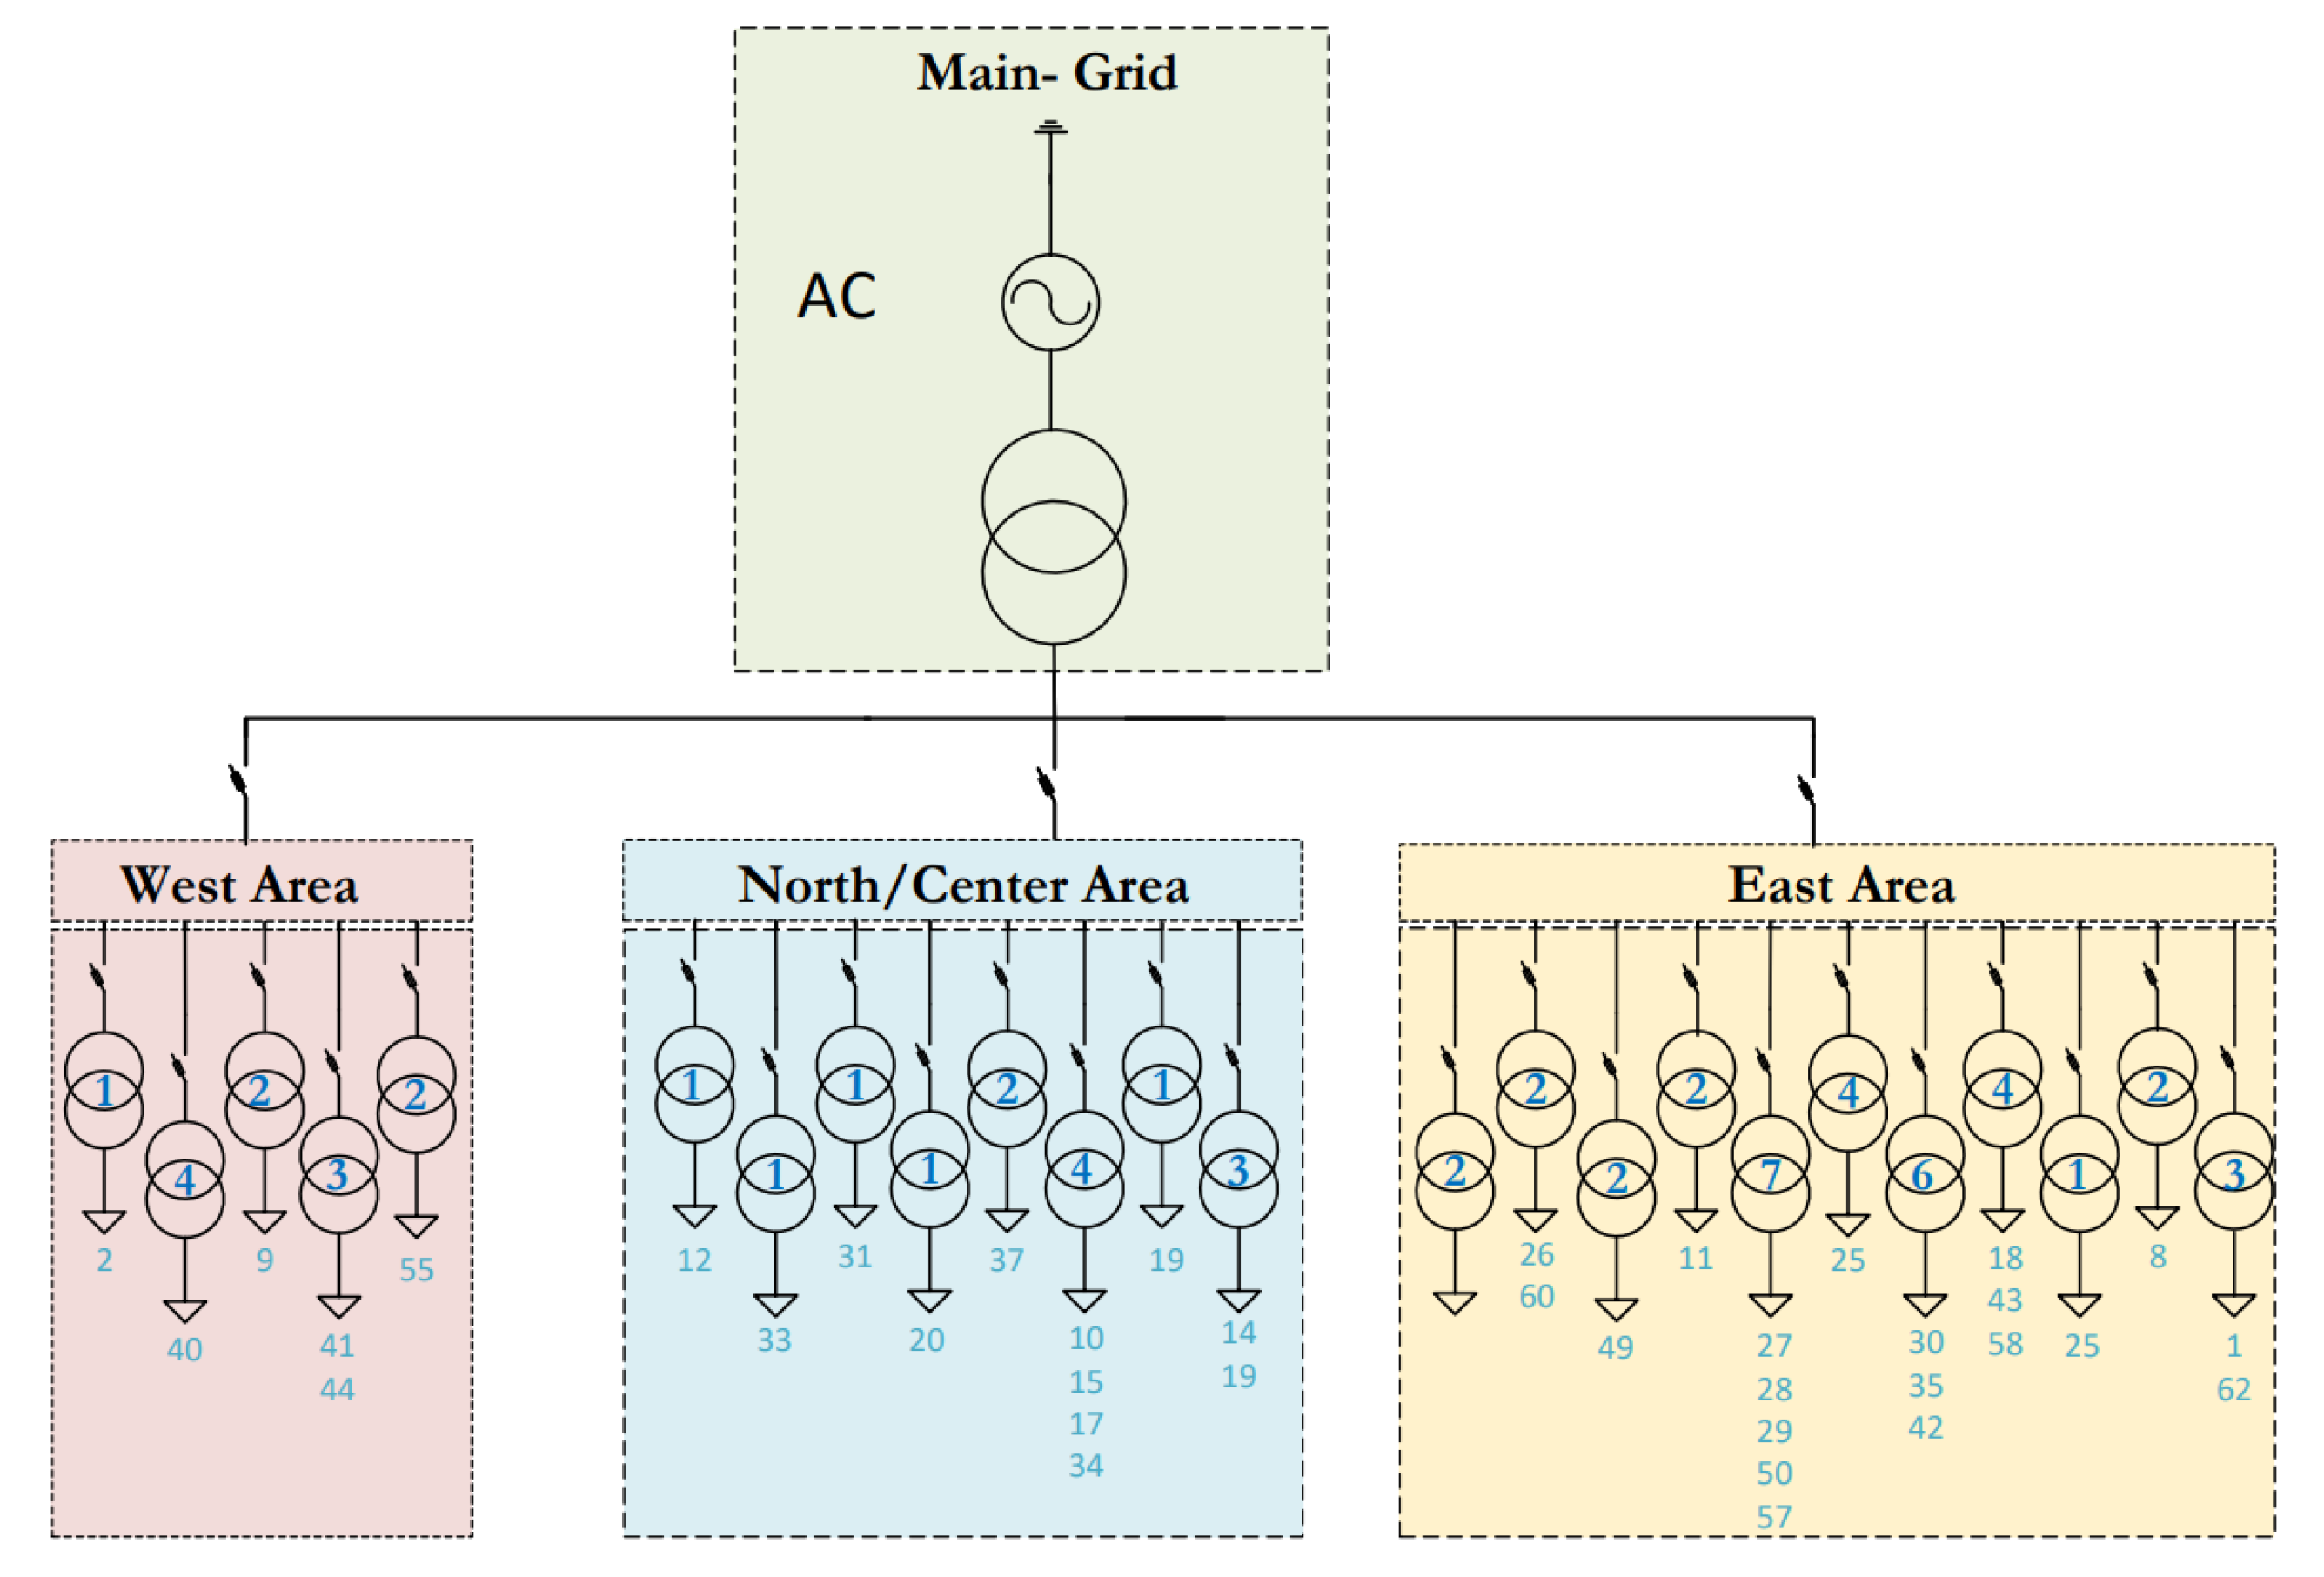
In addition, a model of the electrical system was built in MATLAB-Simulink to verify the behavior of the system in steady state. On the other hand, the UPRM electric system is composed of twenty-four electric cabinets and sixty-one secondary electric substations. The system is divided in three areas: West, North/Center, and East, with twelve, fourteen, and thirty-five electric substations, respectively. The simplified one-line diagram of UPRM is shown in
Figure 6. The numbers after the arrows correspond to the identification of the buildings visible on the UPRM map sketch.
4.3. Data Collection: Critical Loads
Once you have access to the electrical design, data collection is necessary to realize a description of the energy consumption by the different electrical loads in the system, giving higher priority to critical loads.
Critical loads are defined as those that must be kept in operation in times of emergency, or equipment, materials, and experiments that can be lost or suffer severe damage if they are without electricity for a certain time.
According to the electrical distribution of the University of Puerto Rico at Mayagüez and the loads to be supplied within the system, the following are determined as critical loads: Medical Services, Accounting-Terrats, Immigration-Celis, and Biology Laboratories. Medical Services for the service offered to the community, the devices installed there can help during an emergency, while Biology laboratories usually can run projects that involve live samples that depend on electricity service. Accounting is necessary for the community to receives their pays even in an emergency.
The Campus has meters installed in strategic locations the energy consumption in a month. Using this information, load profiles were constructed. It is important to mention that the meters are limited, and all loads are not measured. For this reason, load profiles were constructed for unmeasured load using the capacity of the elements. The critical loads that have meters are Medical Services and Biology.
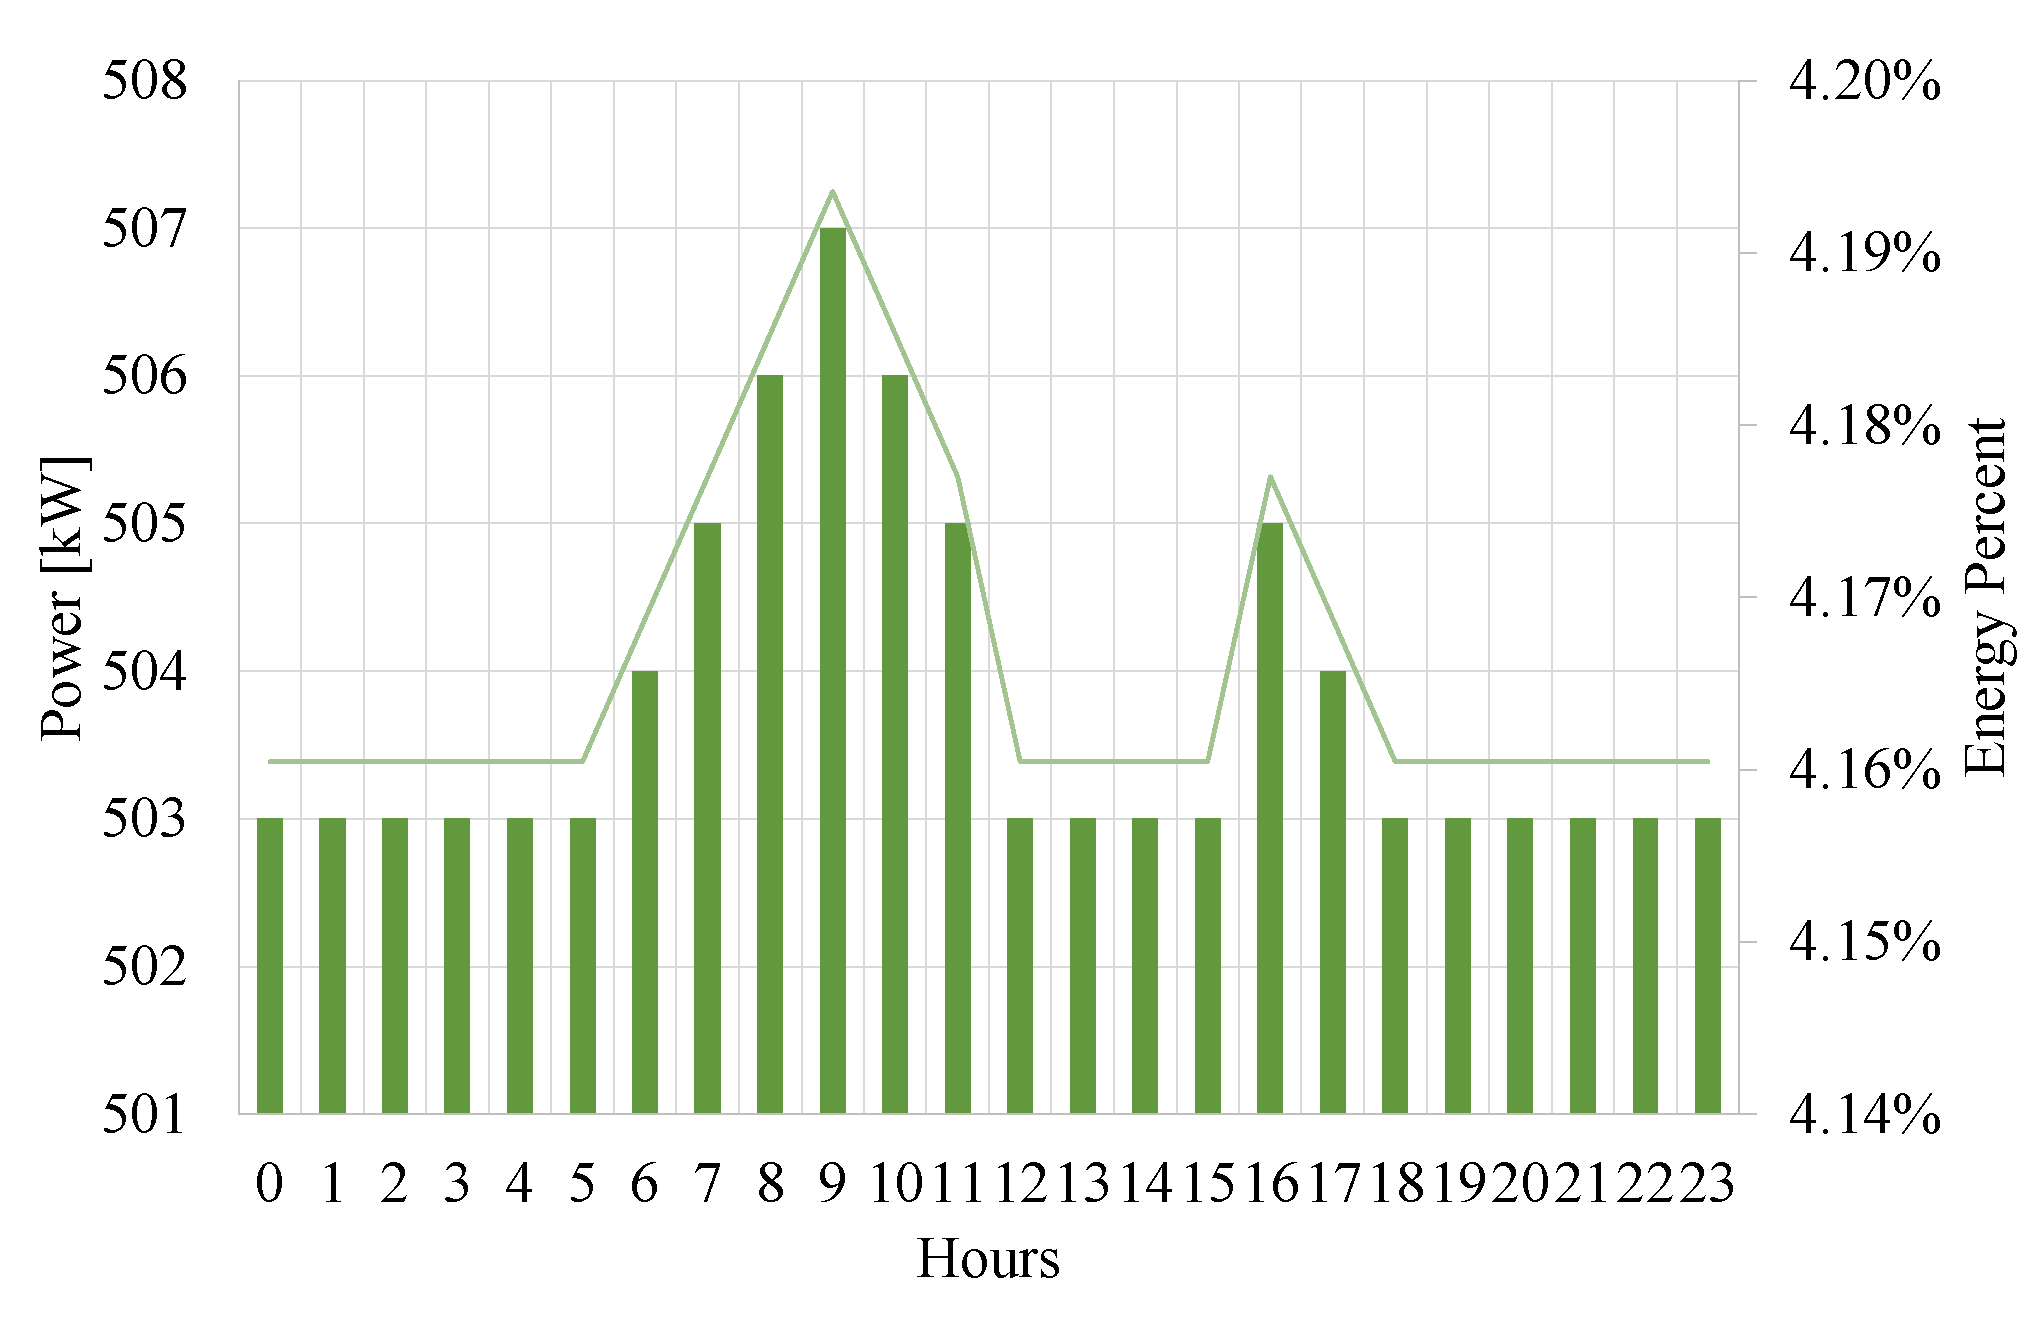
The Medical Service load uses an approximate daily consumption according to the meter; however, the profile was adjusted like a typical curve of a hospital. The curve used is presented in
Figure 7.
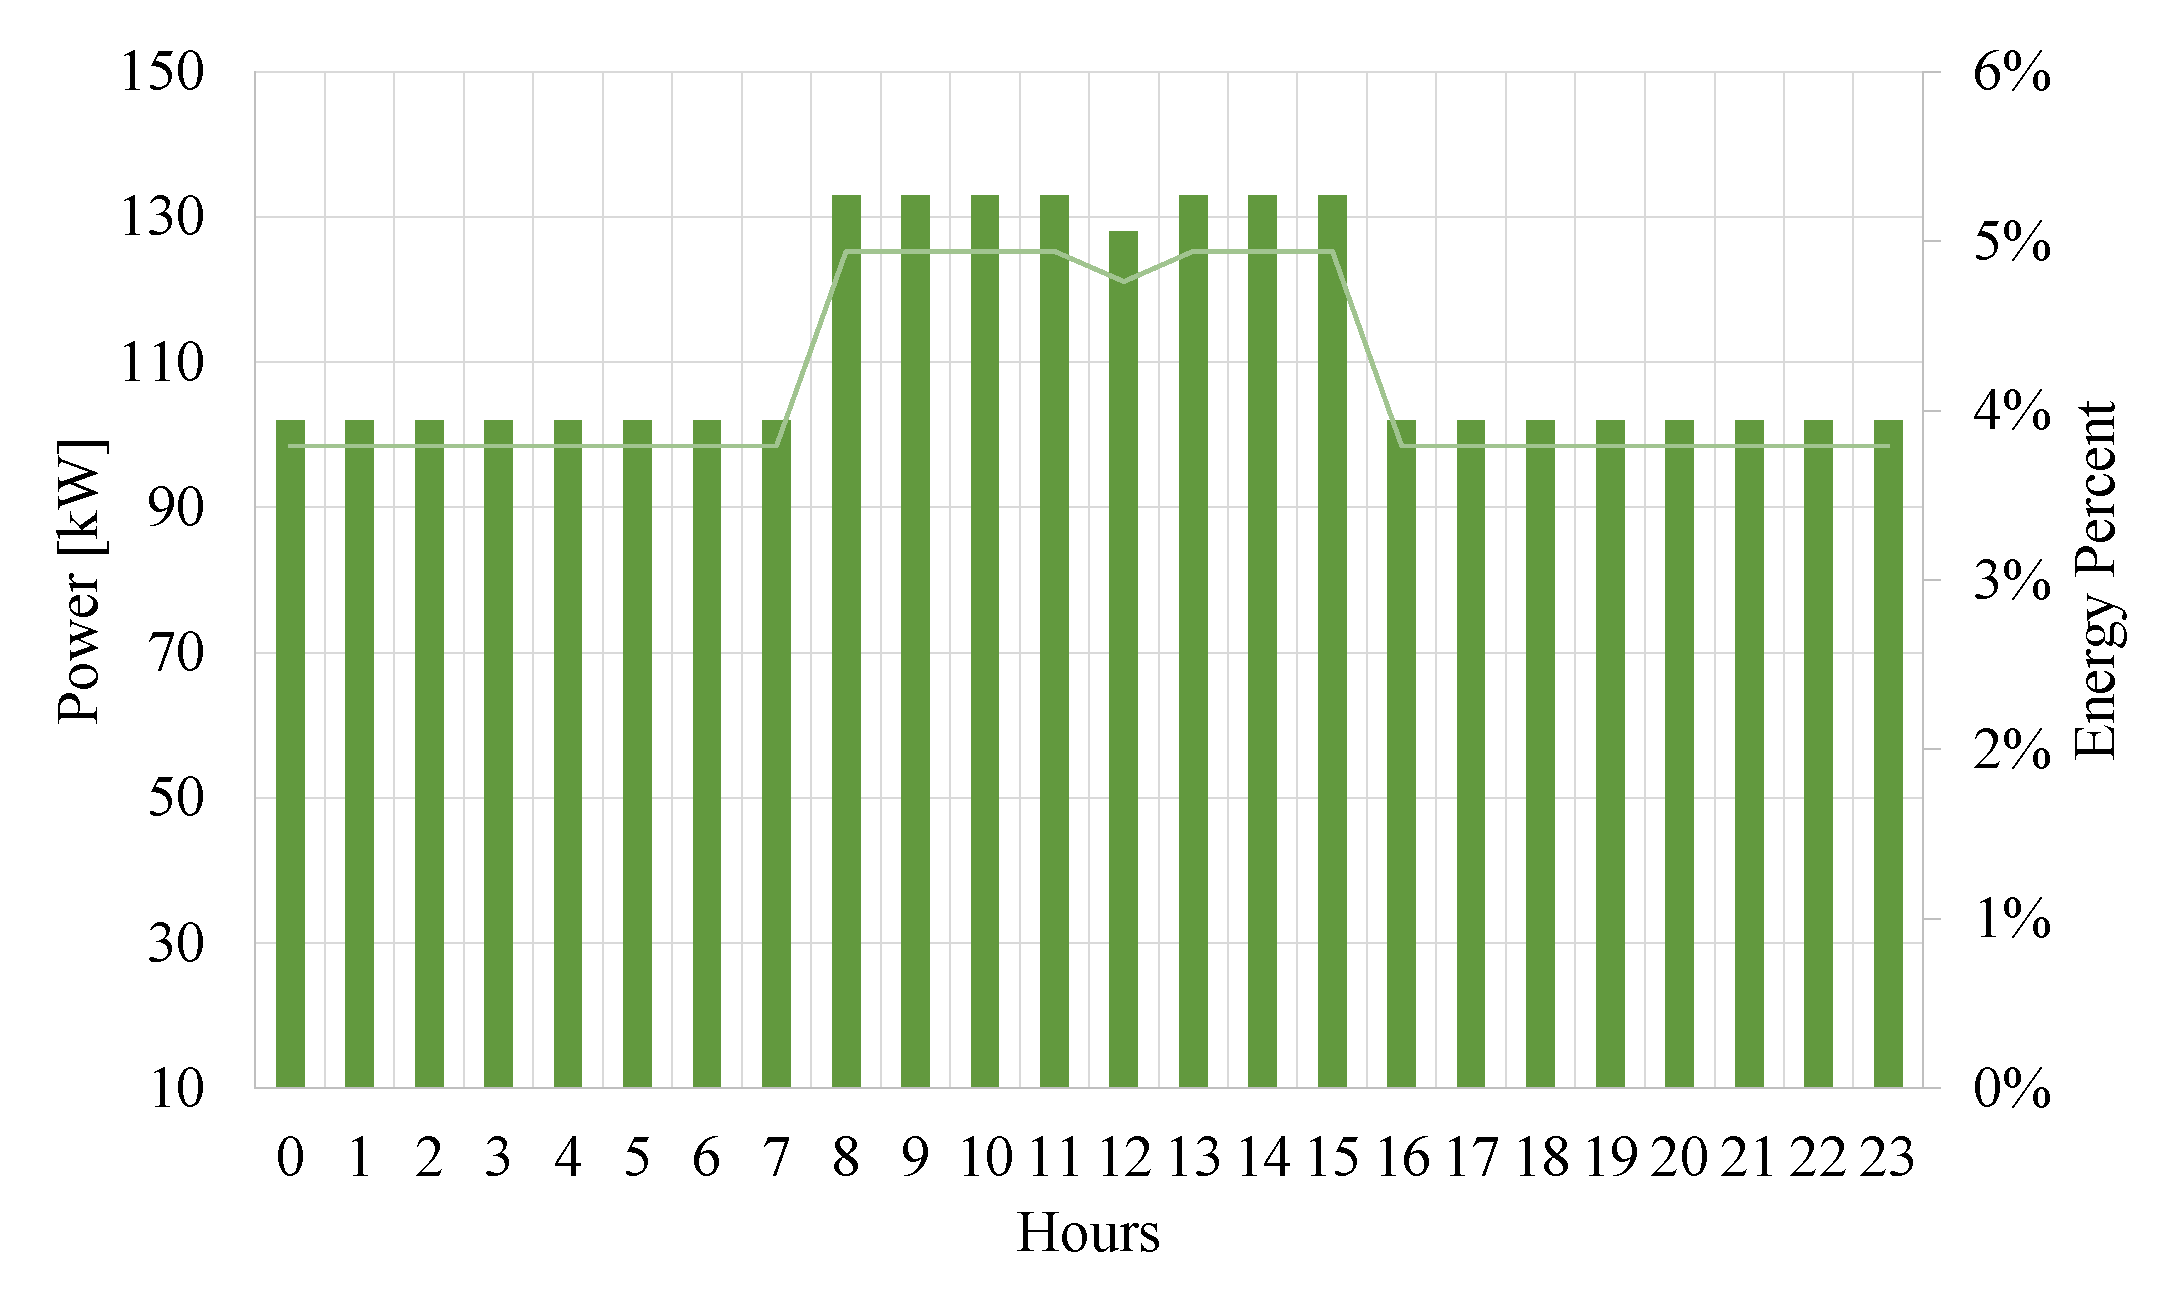
In the same way, Biology laboratories have a load profile characteristic. Usually the same devices are connected. During specific hours other devices are used and the consumption changes.
Figure 8 shows load consumption in Biology laboratories.
For the Immigration and Accounting offices, a load profile was constructed contemplating devices used in these offices such as computers, illumination, and air conditioning.
Figure 9 shows the load profile.
4.4. Microgird Design
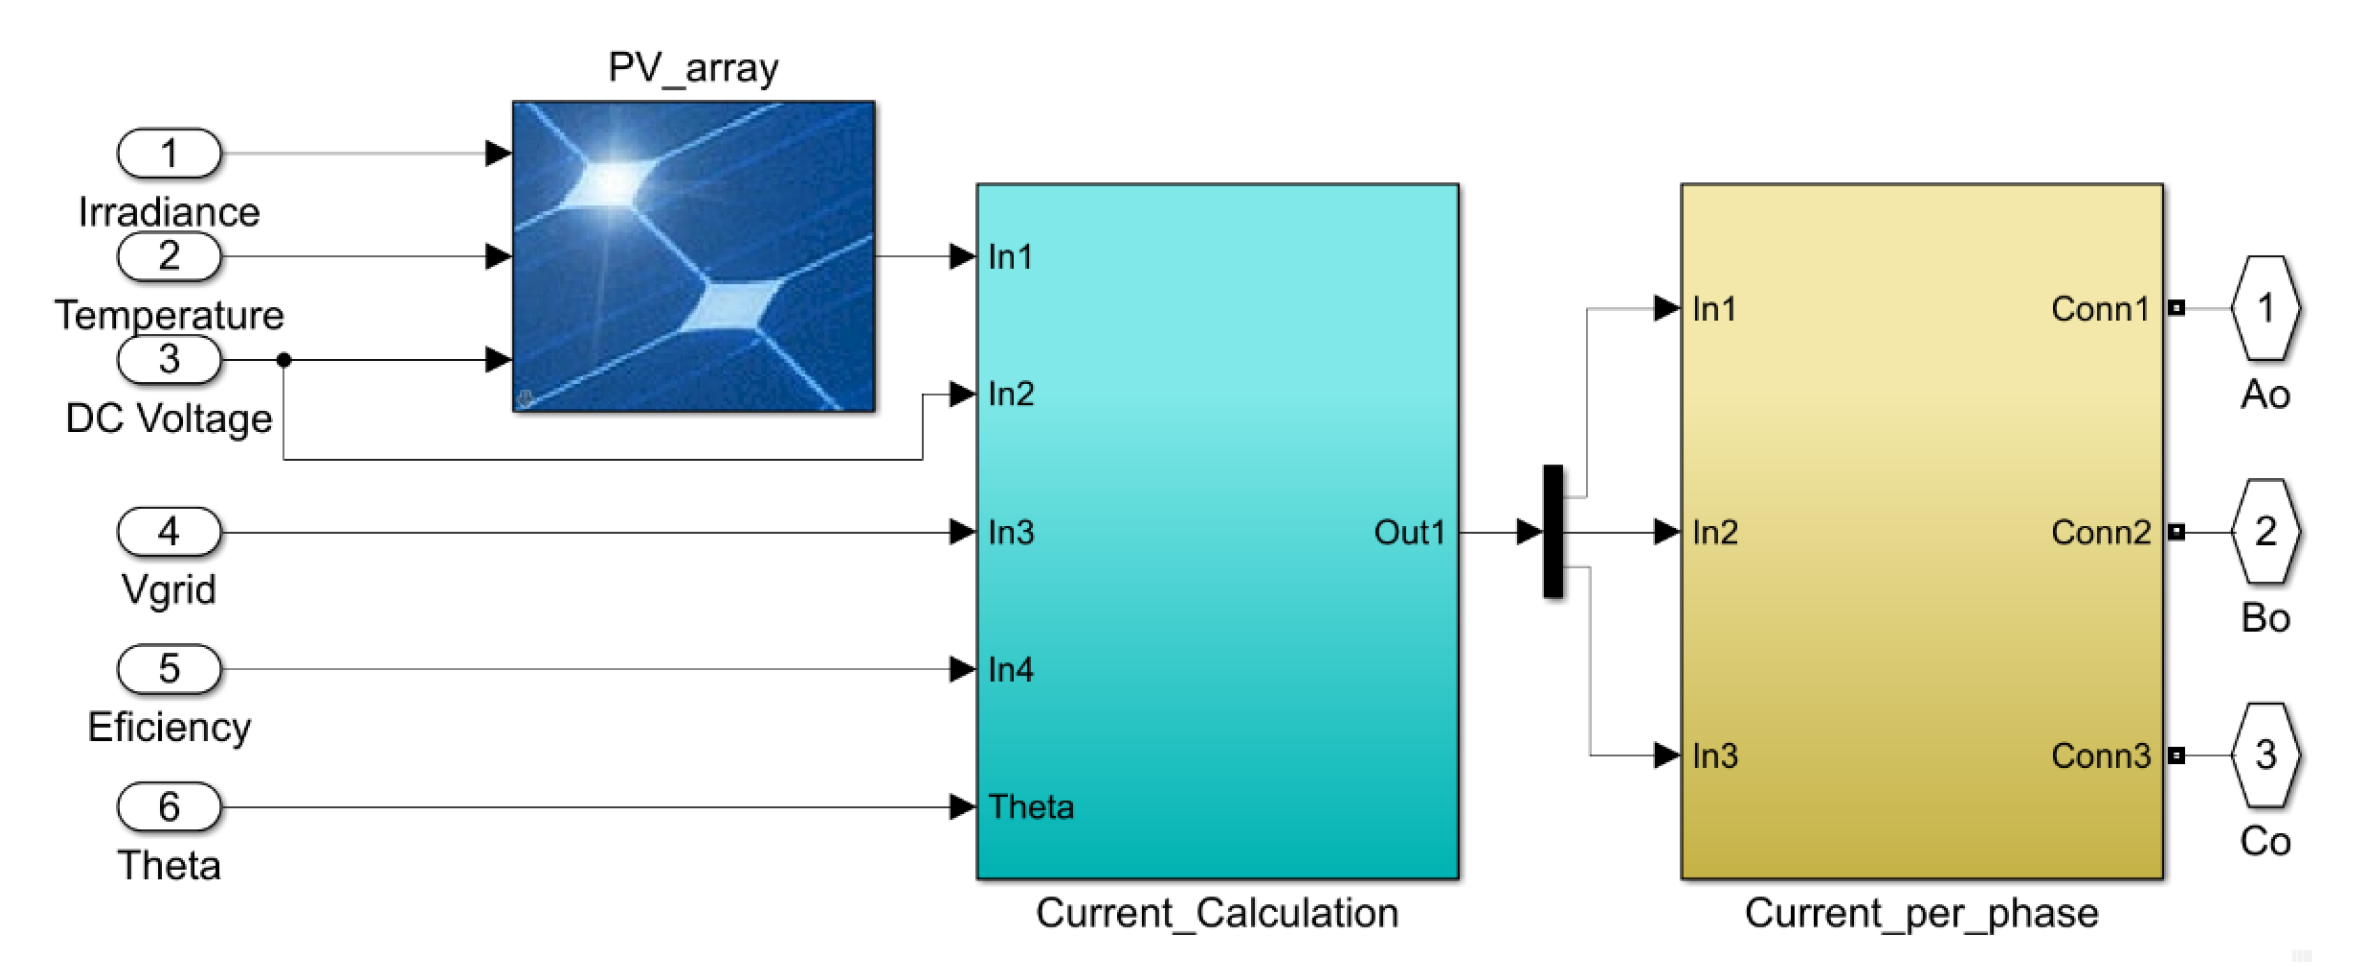
Figure 10 shows the model constructed in MATLAB-Simulink. The PV array block contains the mathematical equation described in
Section 3 and
Section 3.4.1. This equation considered variables such as irradiance, temperature, and DC voltage as input. The output is a current that is an input to the current calculation block. The current calculation block has as input variables, the grid voltage, the efficiency and synchronization angle with the main grid, and the energy of the PV to calculate the current injected into the grid. The current injected into the grid is received for the current per phase block that generates the voltage so that a current can flow through each phase.
Figure 11 shows the CHP file in MATLAB-Simulink. The input parameters of the model are electric power, reference speed, and ambient temperature. The model generates internal variables and block of interest such as acceleration and exhaust temperature. The output is the mechanical power, which is the input to the electric generator.
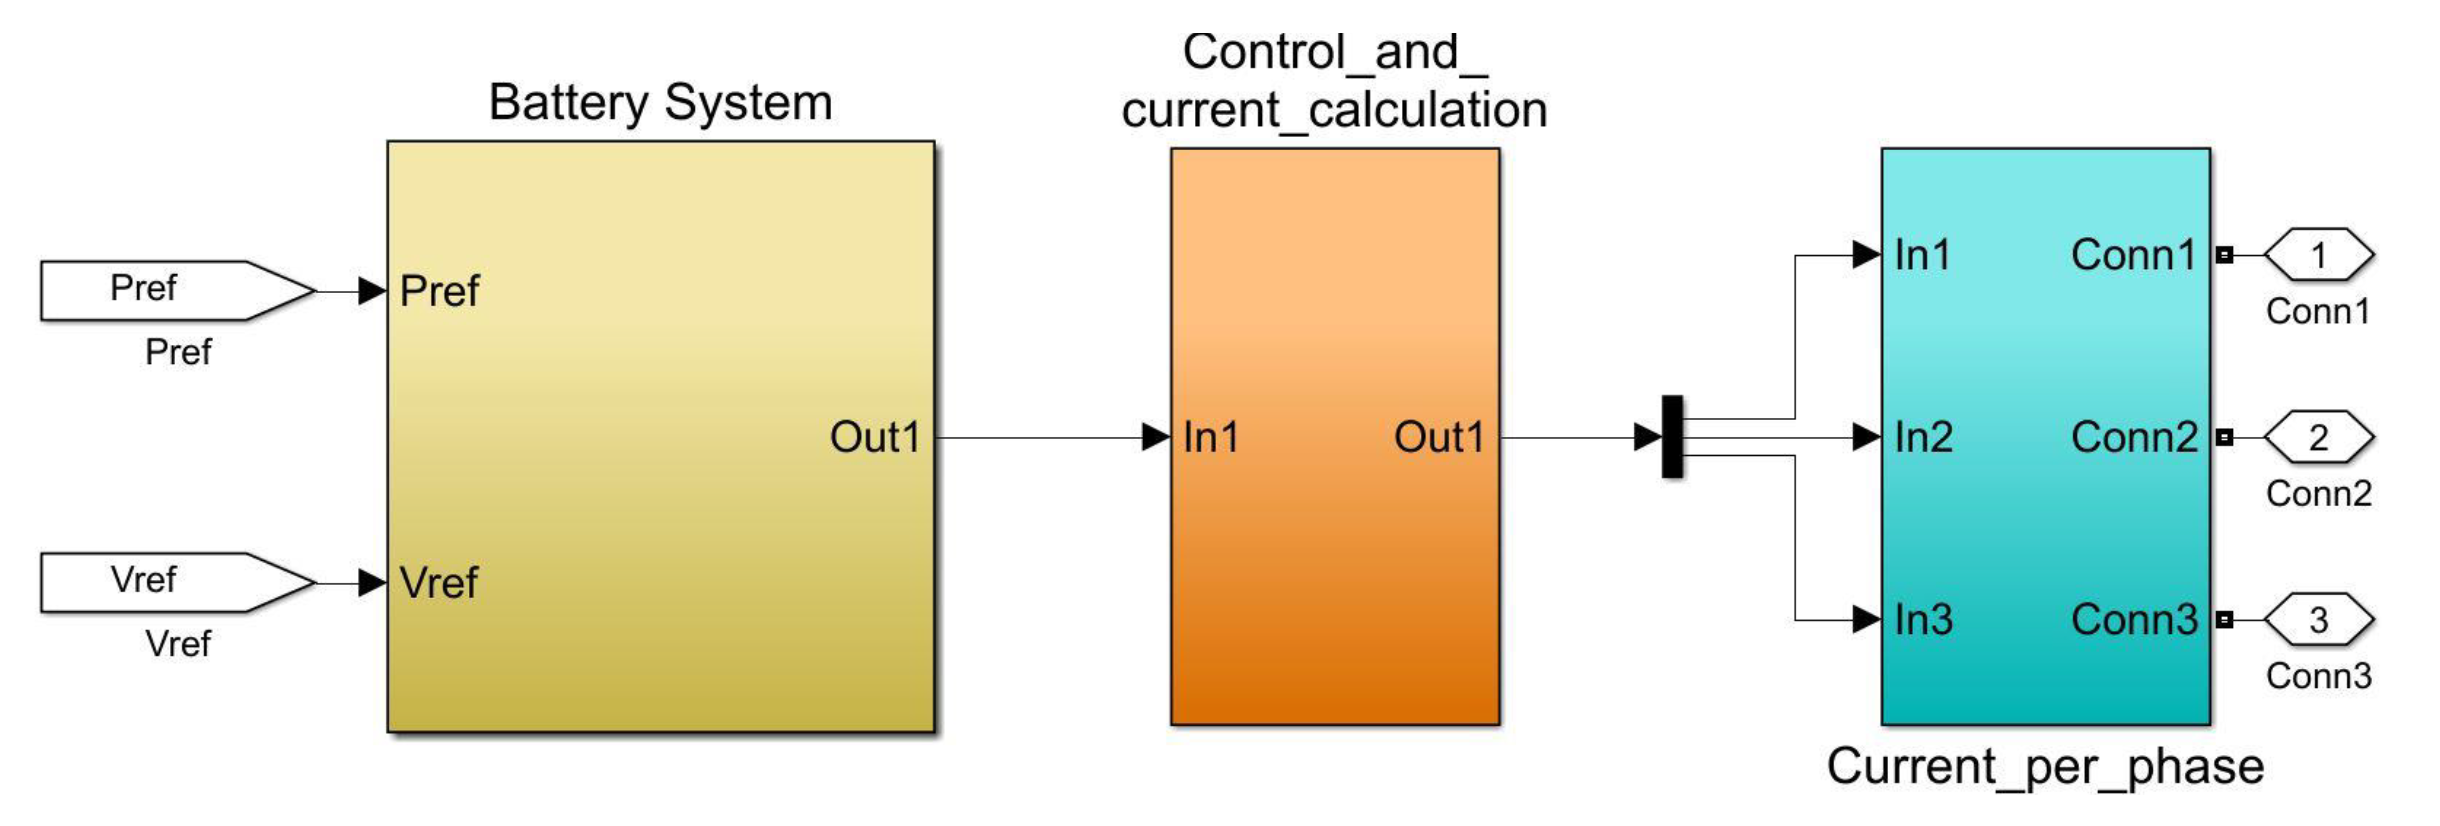
Internally, the battery has the blocks and operation shown in
Figure 4. This model was complemented with a control to determine how much energy the battery should inject and at what time. The battery model is represented in three main blocks. The control and current calculation block receive the signal of the battery system, and where the name displayed indicates who is in charge of the three-phase current calculation. Finally, the three-phase current is separated per phase in the last block as shown in
Figure 12. The battery used for this study was 3600 HLX PLUS-UL LITHIUM SOLAR BATTERY UL [
29]. In the data-sheet the manufacturer recommended discharge the battery only to 80% to conserve the maximum number of cycles of the battery.
4.4.1. Physical Space Available for the Installation of the Microgrid
To install a MG it is necessary to have adequate space for the implementation, considering that the MG proposed in this research consists of integrating PV, batteries, and CHP. Usable spaces can be available area on roofs, parking, and unbuilt land.
It was possible to identify the available spaces and obtain an approximation of the available capacity on roofs and parking lots.
Figure 13 show an example of the spaces available in parking and rooftop of the Library, Nursing, Chemistry and Biology buildings.
Table 2 shows a detailed description of the available spaces at UPRM. It contains location, available capacity in [kW], and the representation number. Adding the available capacity obtained through PV-Watts Calculator [
30], it is obtained that the available on the university campus is approximately 3000 [kW] or 3 [MW]. Additionally, the table includes the available area, this area was calculated using Google Maps tool.
4.4.2. Modifications in the Electrical System
For the electrical system, information was gathered with the university maintenance staff. The electrical drawings were obtained from AUTOCAD and a descriptive file of the conductors.
4.4.3. Guidelines as Current Standards and Regulations
Considering that the classification of a MG can be given according to the installed capacity, universities fall within the commercial MG category [
31]. According to this classification, normative rules must be accomplished. In the case of Puerto Rico, a normative was created for the regulation of MGs [
32]. In this case commercial MGs according to the normative are the same as third-party MGs.
5. Methodology Validation
The methodology proposed in this work was validated through simulations in Matlab-Simulink using RT-Lab technology. For the validation, 4 scenarios were used with different energy resources and a combination of resources.
Table 3 presents the proposed scenarios. During the validation of this methodology, components of the electrical system and of the MG were analyzed. For example, the behavior of the voltage profile was analyzed, the objective was for it to remain between the optimal ranges according to standards. Additionally, costs associated with each of the resources were considered, estimated initial cost of installation. Cost only considers installation. Ambient cost was neglected, but, could be consider in a future study as well as functionality and autonomy capacity in the face of critical loads. Another variable considered in the validation was the days of austerity to operate the MG in islanding mode and supply the critical loads during an emergency. Another component analyzed was which system took more advantage of the available energy resource, for this analysis is realized a comparison between the scenarios. In this section the results obtained by applying the proposed methodology to the UPRM are presented in detail.
In this section is presented the results obtained to different test scenarios. Highlighting the advantages and disadvantages of each.
5.1. Scenario 1: Solar Photovoltaic
This scenario consists of a MG with the capacity to supply the critical loads. The installed capacity of this is 1.4 MW, and is distributed in two PV arrays, of 700 kW each. Each array contains 1540 PV panels with a capacity of 455 W.
Medical Services and Biology have back-up generators of 20 and 1250 kW, respectively. These generators have been in service during emergencies and their behavior has been adequate. However, the other loads do not have back-up generators, nor do they have smart meters for telemetry. For this reason, a load study was conducted. A capacity around of 100 kW is necessary to supply this load.
Table 4 shows the configuration and technical parameters of the PV arrays. The PV array was designed considering variables such as capacity per PV panel, quantity of installed panels, available area, and location. This table shows that the configuration proposed could be installed in the library’s parking, known as White Area (WA) and the Biology parking lot (BP). Only a 41% and 66% of the available area is used, respectively, with the capacity of 700.7 kW each one and a total installed capacity of 1.4 MW.
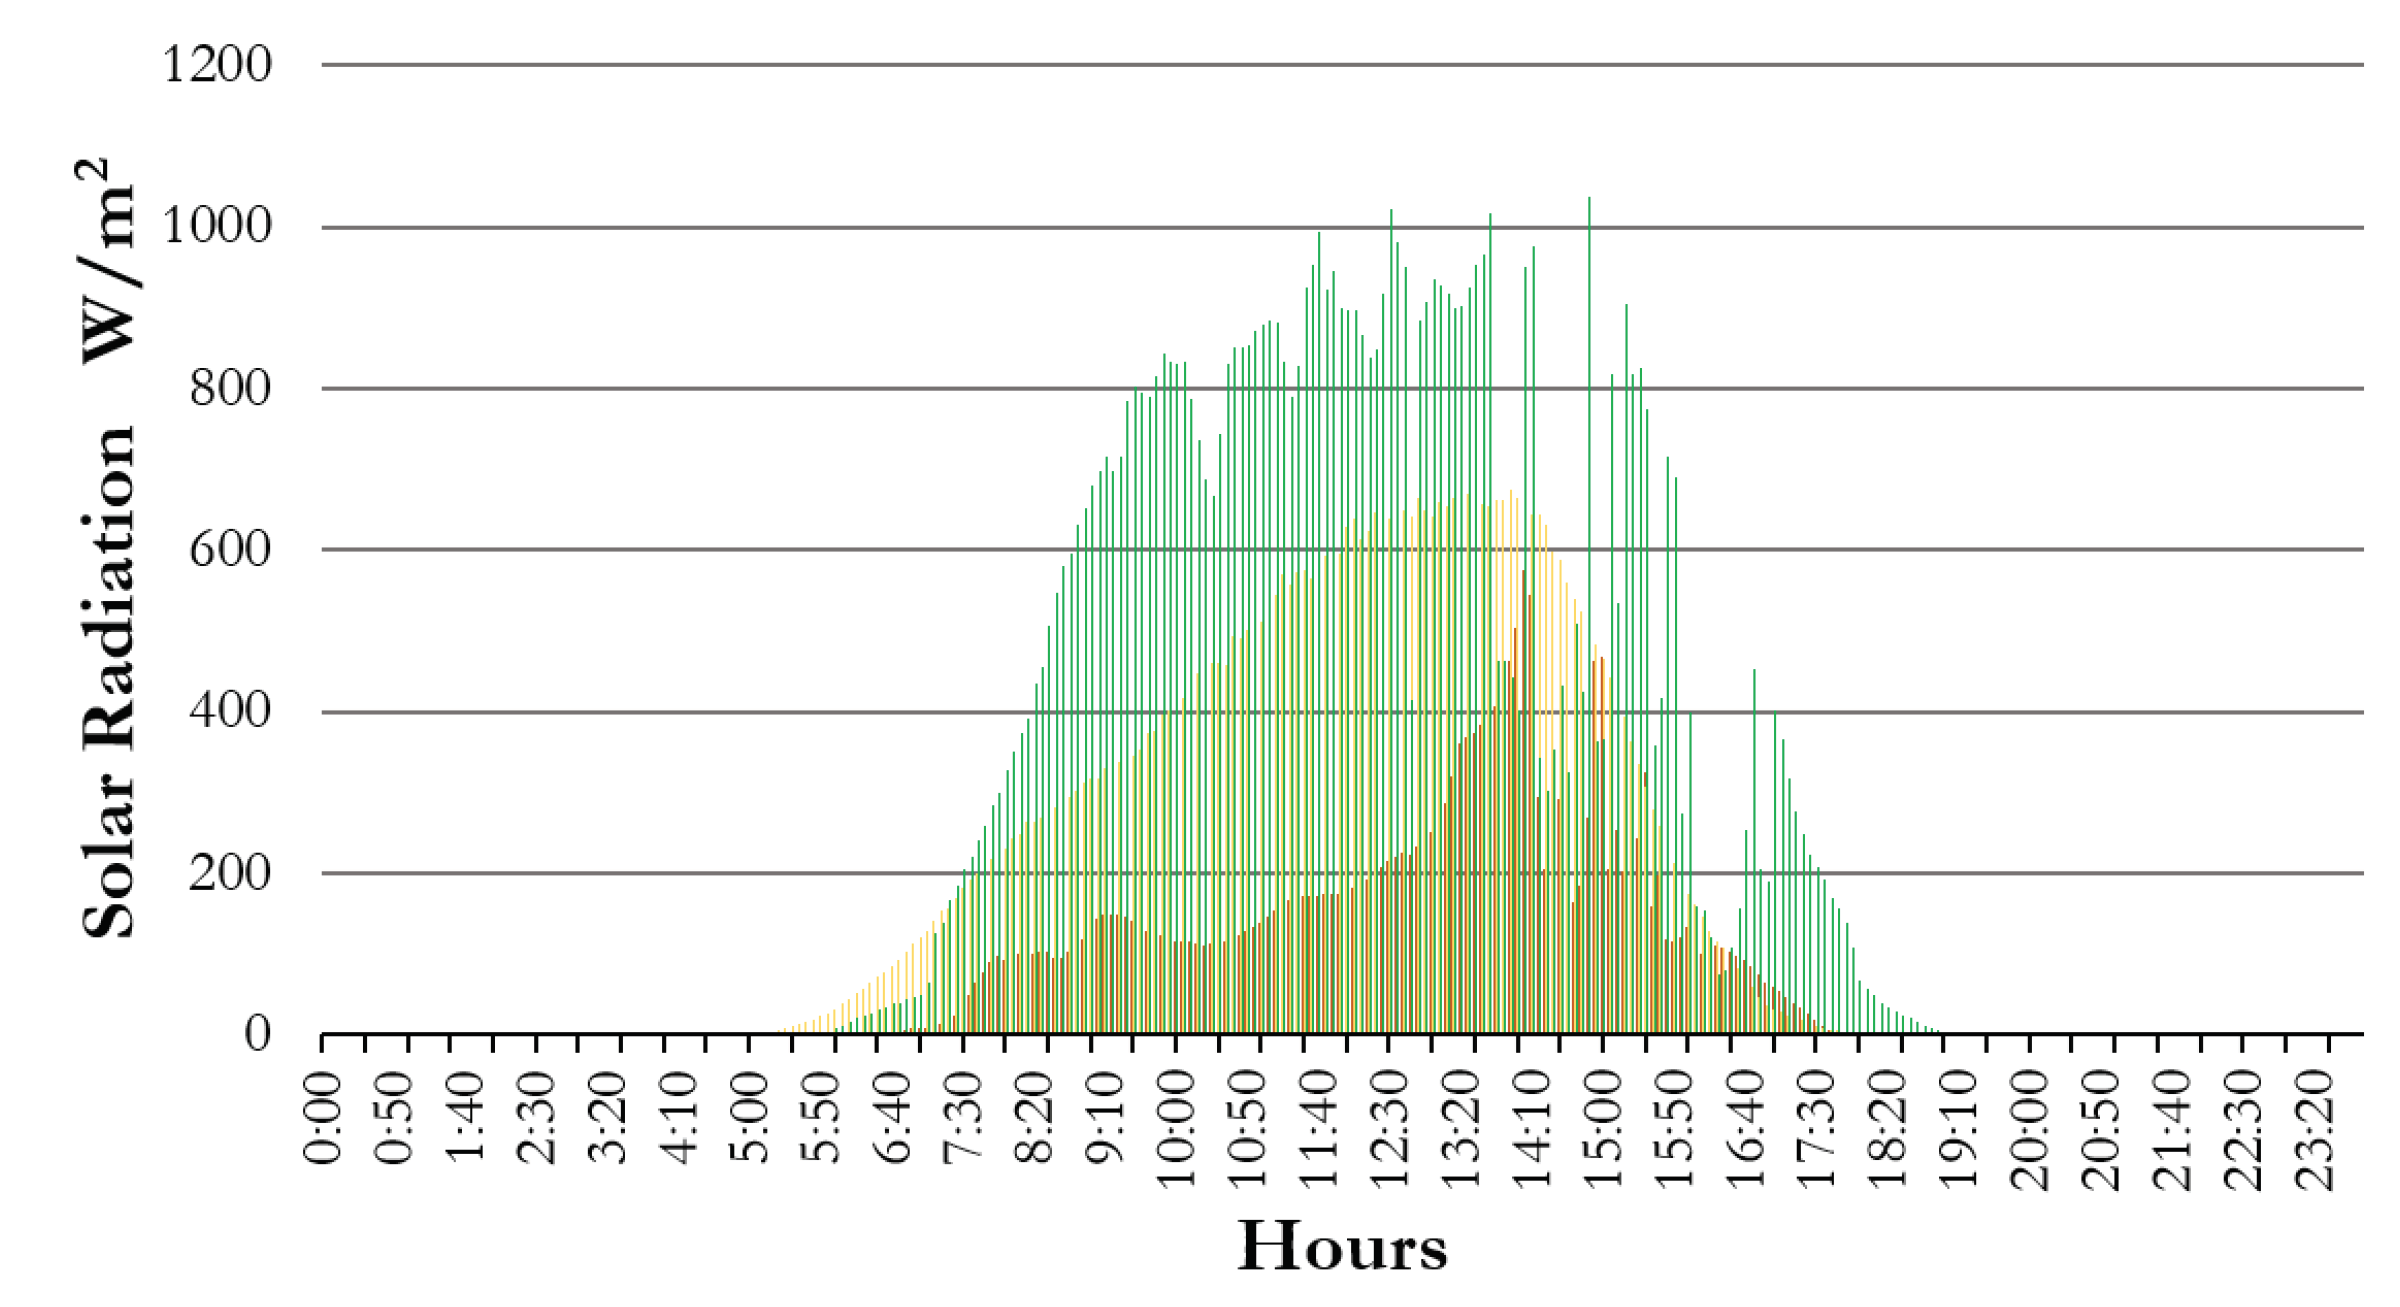
For the simulation, three profiles of irradiance in Mayagüez were considered, analyzing a database of ambient weather with information of one year [
33]. For the test, three different days were selected: one with major solar radiation, one with minor solar radiation, and one with average solar radiation. The profiles of solar radiation used are shown in
Figure 14. The green curve represents the day with major solar radiation, the orange curve represents the day with minor solar radiation, and yellow represents the curve of average solar radiation per year in Mayagüez.
The results shown in this section were obtained using the average solar radiation. The behavior was constructed using an average for each five minutes. The analysis for the solar radiation average per year was done.
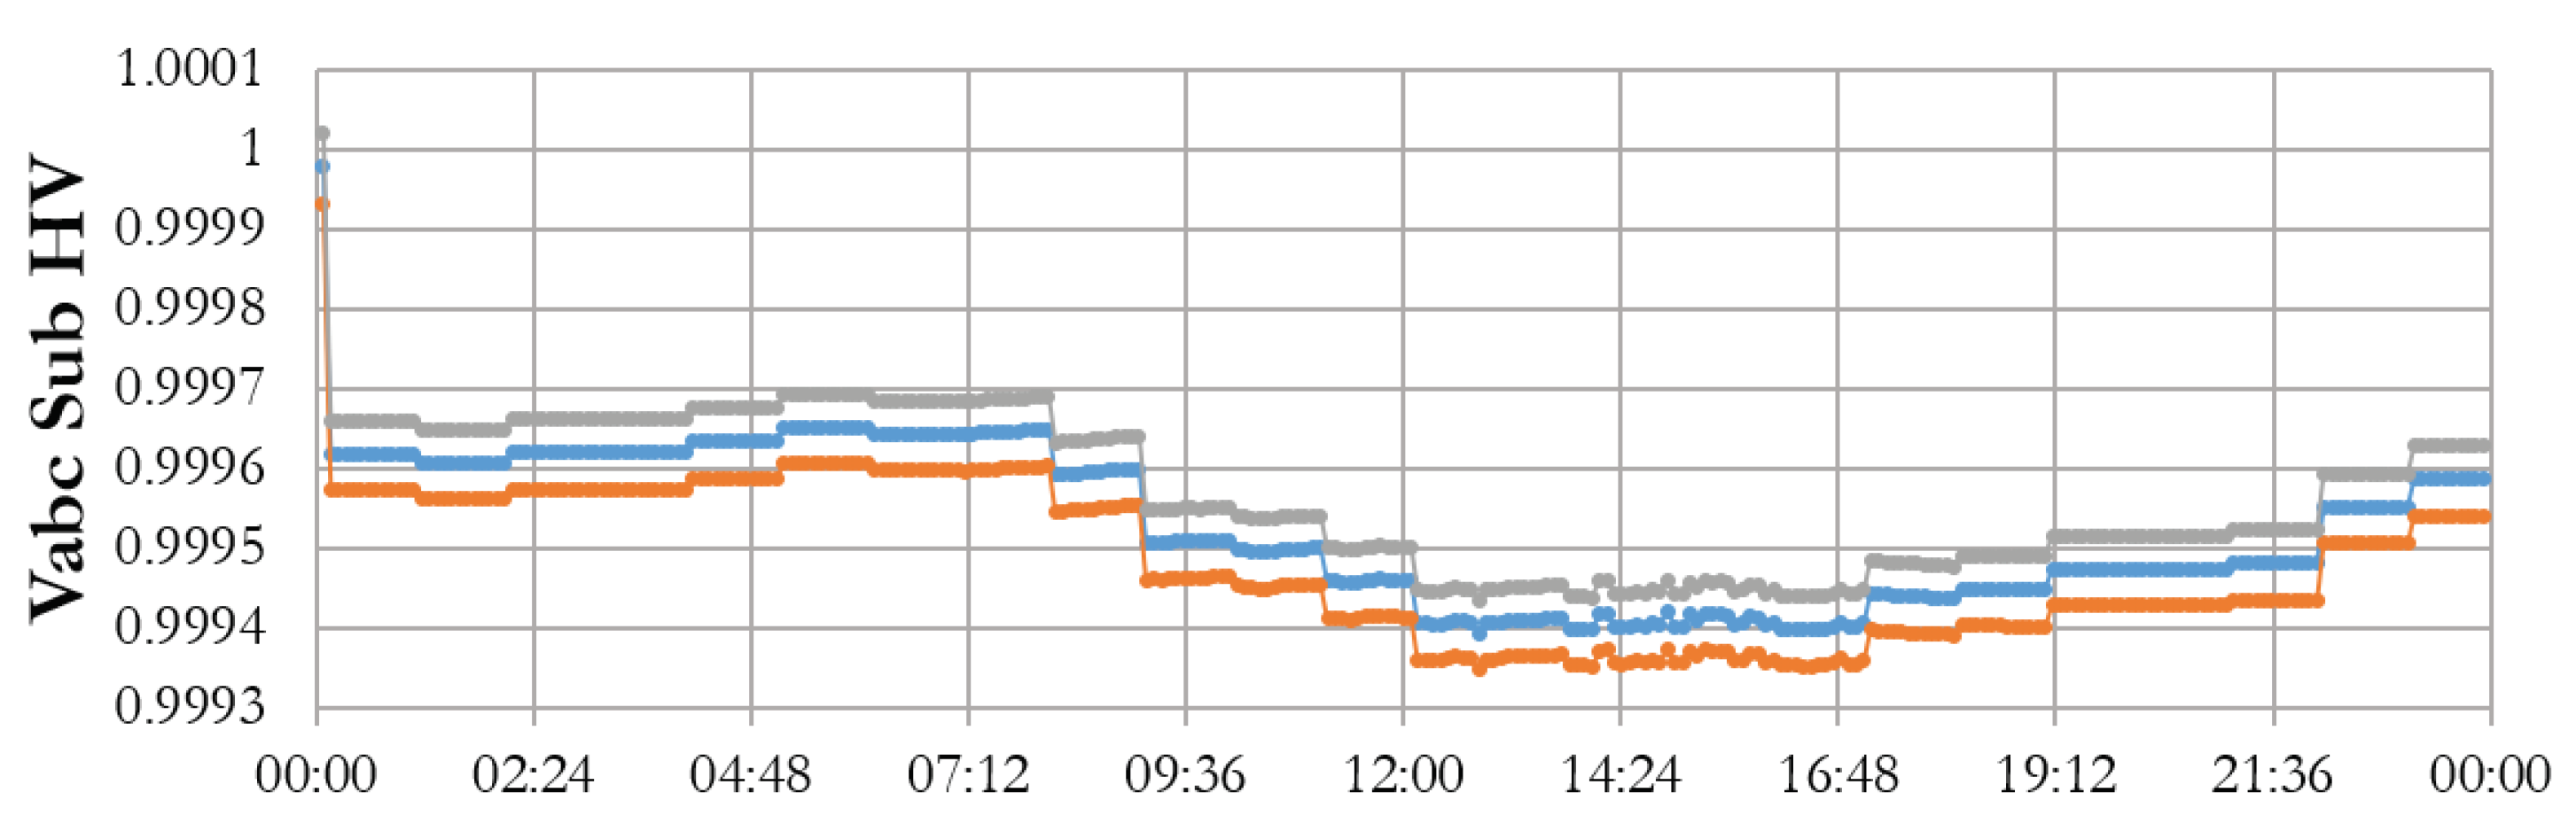
In
Figure 15, the colors blue, orange, and gray represent the phases A, B, C, respectively. We can see that the MG contributes to improve the voltage profile and allows that the voltage maintain between the limits of regulation.
On the other hand, the solar panel system at the university contributes to saving energy consumed from the main grid. The percentage of contribution per day is showed in
Table 5, where SS represents the consumption of the entire university in steady state and CL represents the consumption of the critical loads. PV systems do not negatively affect the system, the voltage profile stays within the permitted range, this is reflected in the voltage profile graphs (
Figure 15). One disadvantage with this test scenario is that the solar panel system cannot operate in islanded mode because it needs a system as a reference.
According to the MG regulation in Puerto Rico, the scenario met with the requirements. The regulation establishes that the energy produced for the MG should be at least seventy five percent (75%) of the total energy produced by MG ( Regulation 9028. Article 3. Section 3.03 [
32]). Analyzing cost per kWh of the PV system, savings in the first year could be USD 408,800, considering that the expected energy production in the first year is 2,555,000 kWh. This saving is considering that currently the cost per kWh of the authority is approximately USD 0.21 and the cost per kWh of PV system is approximately USD 0.04.
5.2. Scenario 2: Solar Photovoltaic and Battery Storage System
This scenario consists of a MG with the capacity to supply the critical loads during a contingency. When a contingency occurs, the main grid is off, in this case the MG should be in off-grid operation mode. For this reason, it needs a back-up: batteries. The batteries generate a reference to the PV MG to operate in islanded mode.
The capacity installed of the MG was determined contemplating the energy consumption for the critical load in one day. Additionally, the average solar radiation in one year in Mayagüez was considered. Calculations were done with the average solar radiation in Puerto Rico daily per year, the number of hours used was five.
The configuration of the arrays to the parking lot of Biology and white area are considered same to scenario number one. However, the space available in the university is distributed in different sectors, such as
Table 2 indicates. For example, the library parking and library roof (LR) are close, the total space between both is 14,349 m
2. Considering the space necessary for the panel, this space has a possible total installed capacity of 1.83 MW. Both spaces have a possible installation 1.4 MW with two PV arrays of 700 kW.
Table 6 presents summary of the design.
The scenario with PV and Batteries storage was proved in the simulation, the variables considered were annual solar radiation per day at Mayagüez, 3 MW of installed capacity for the PV MG, battery backup with the capacity (3.94 MW) of providing the energy necessary to supply load demand when the grid and PV MG are off, as well as provide support when the solar radiation is not enough to provide the load demand.
To test the MG in islanding mode, the simulation was run with the disconnection of the main grid. Initially, the total demand of the university is supplied, however, when the main grid is disconnected, the MG is in charge of supplying the demand required for the critical loads. It is important to mention that for the simulation the state of charge of the battery is between 20 and 80%. If the energy produced for the PV MG exceeds the energy demand for the load, this energy is used to charge the batteries. In addition, if the SOC of the battery is more than 99%, and the PV MG exceeds the energy demand to maintain a power balance, the PV MG is disconnected.
For the simulation, 30 days of solar radiation were used. The duration of the simulation could allow to analyze the behavior of the system during its timescale, however, the results are shown only the first three days, for a better visualization.
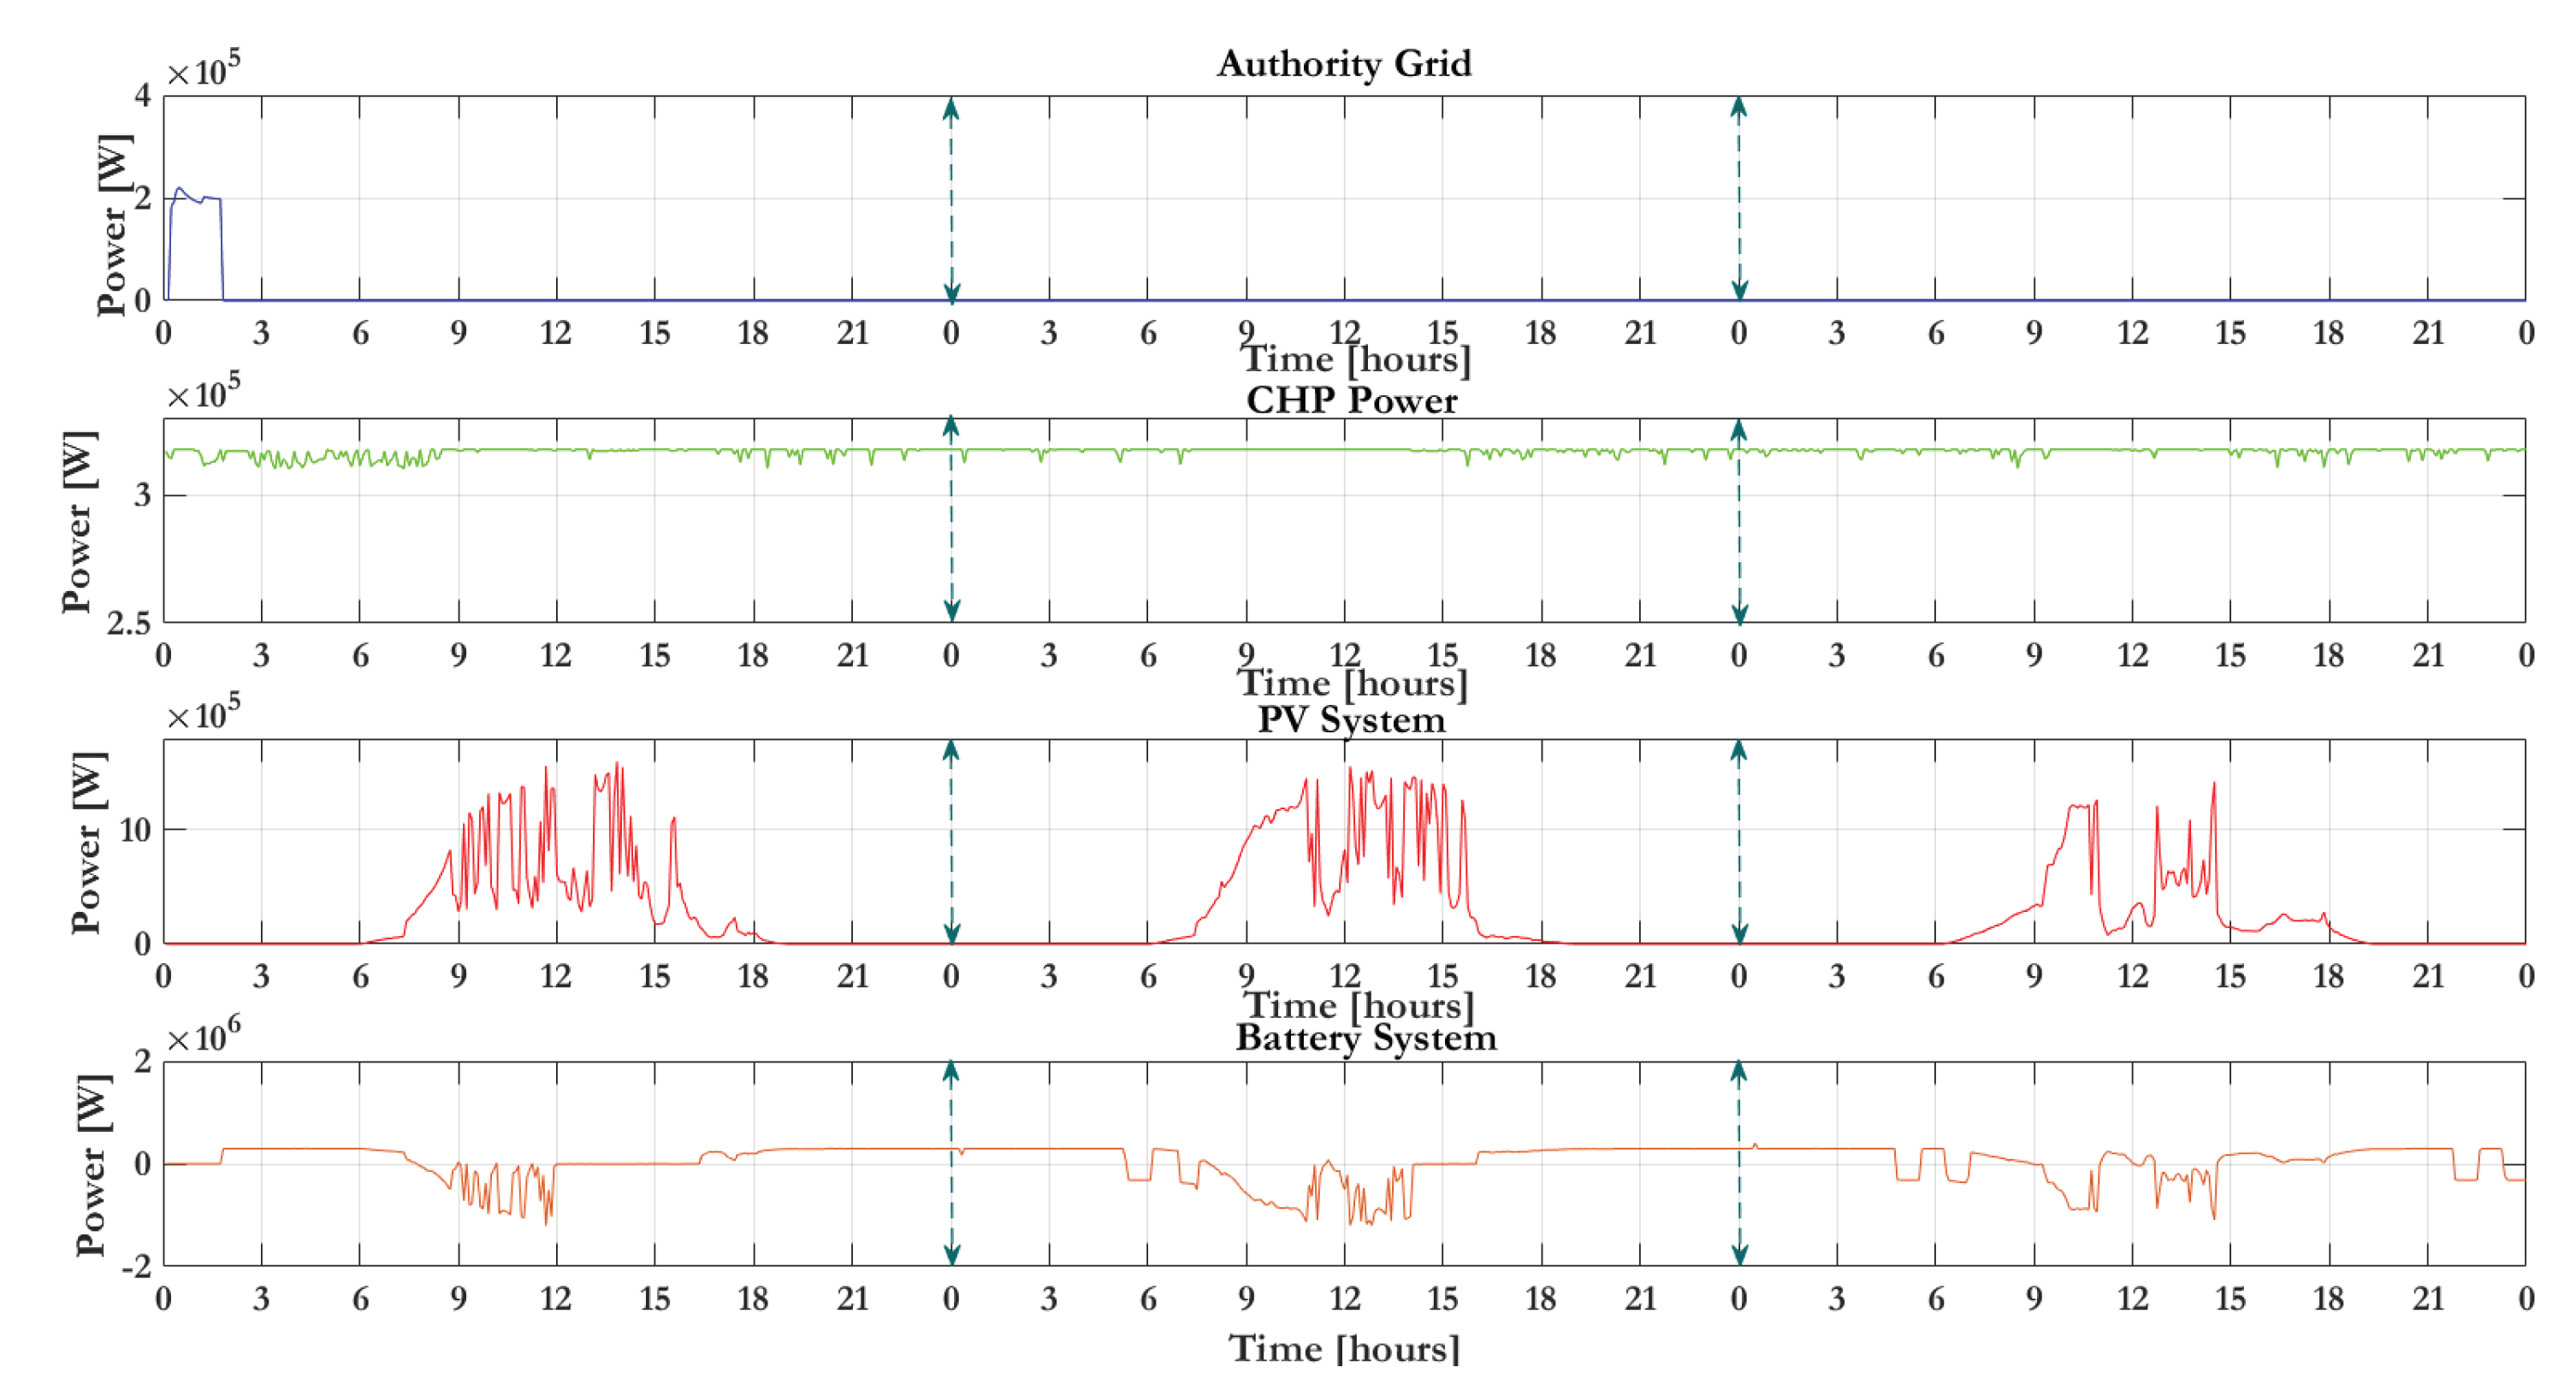
The behavior of the power supply for the main grid, as well as the power produced for the PV MG, and the power supply for the battery are shown in
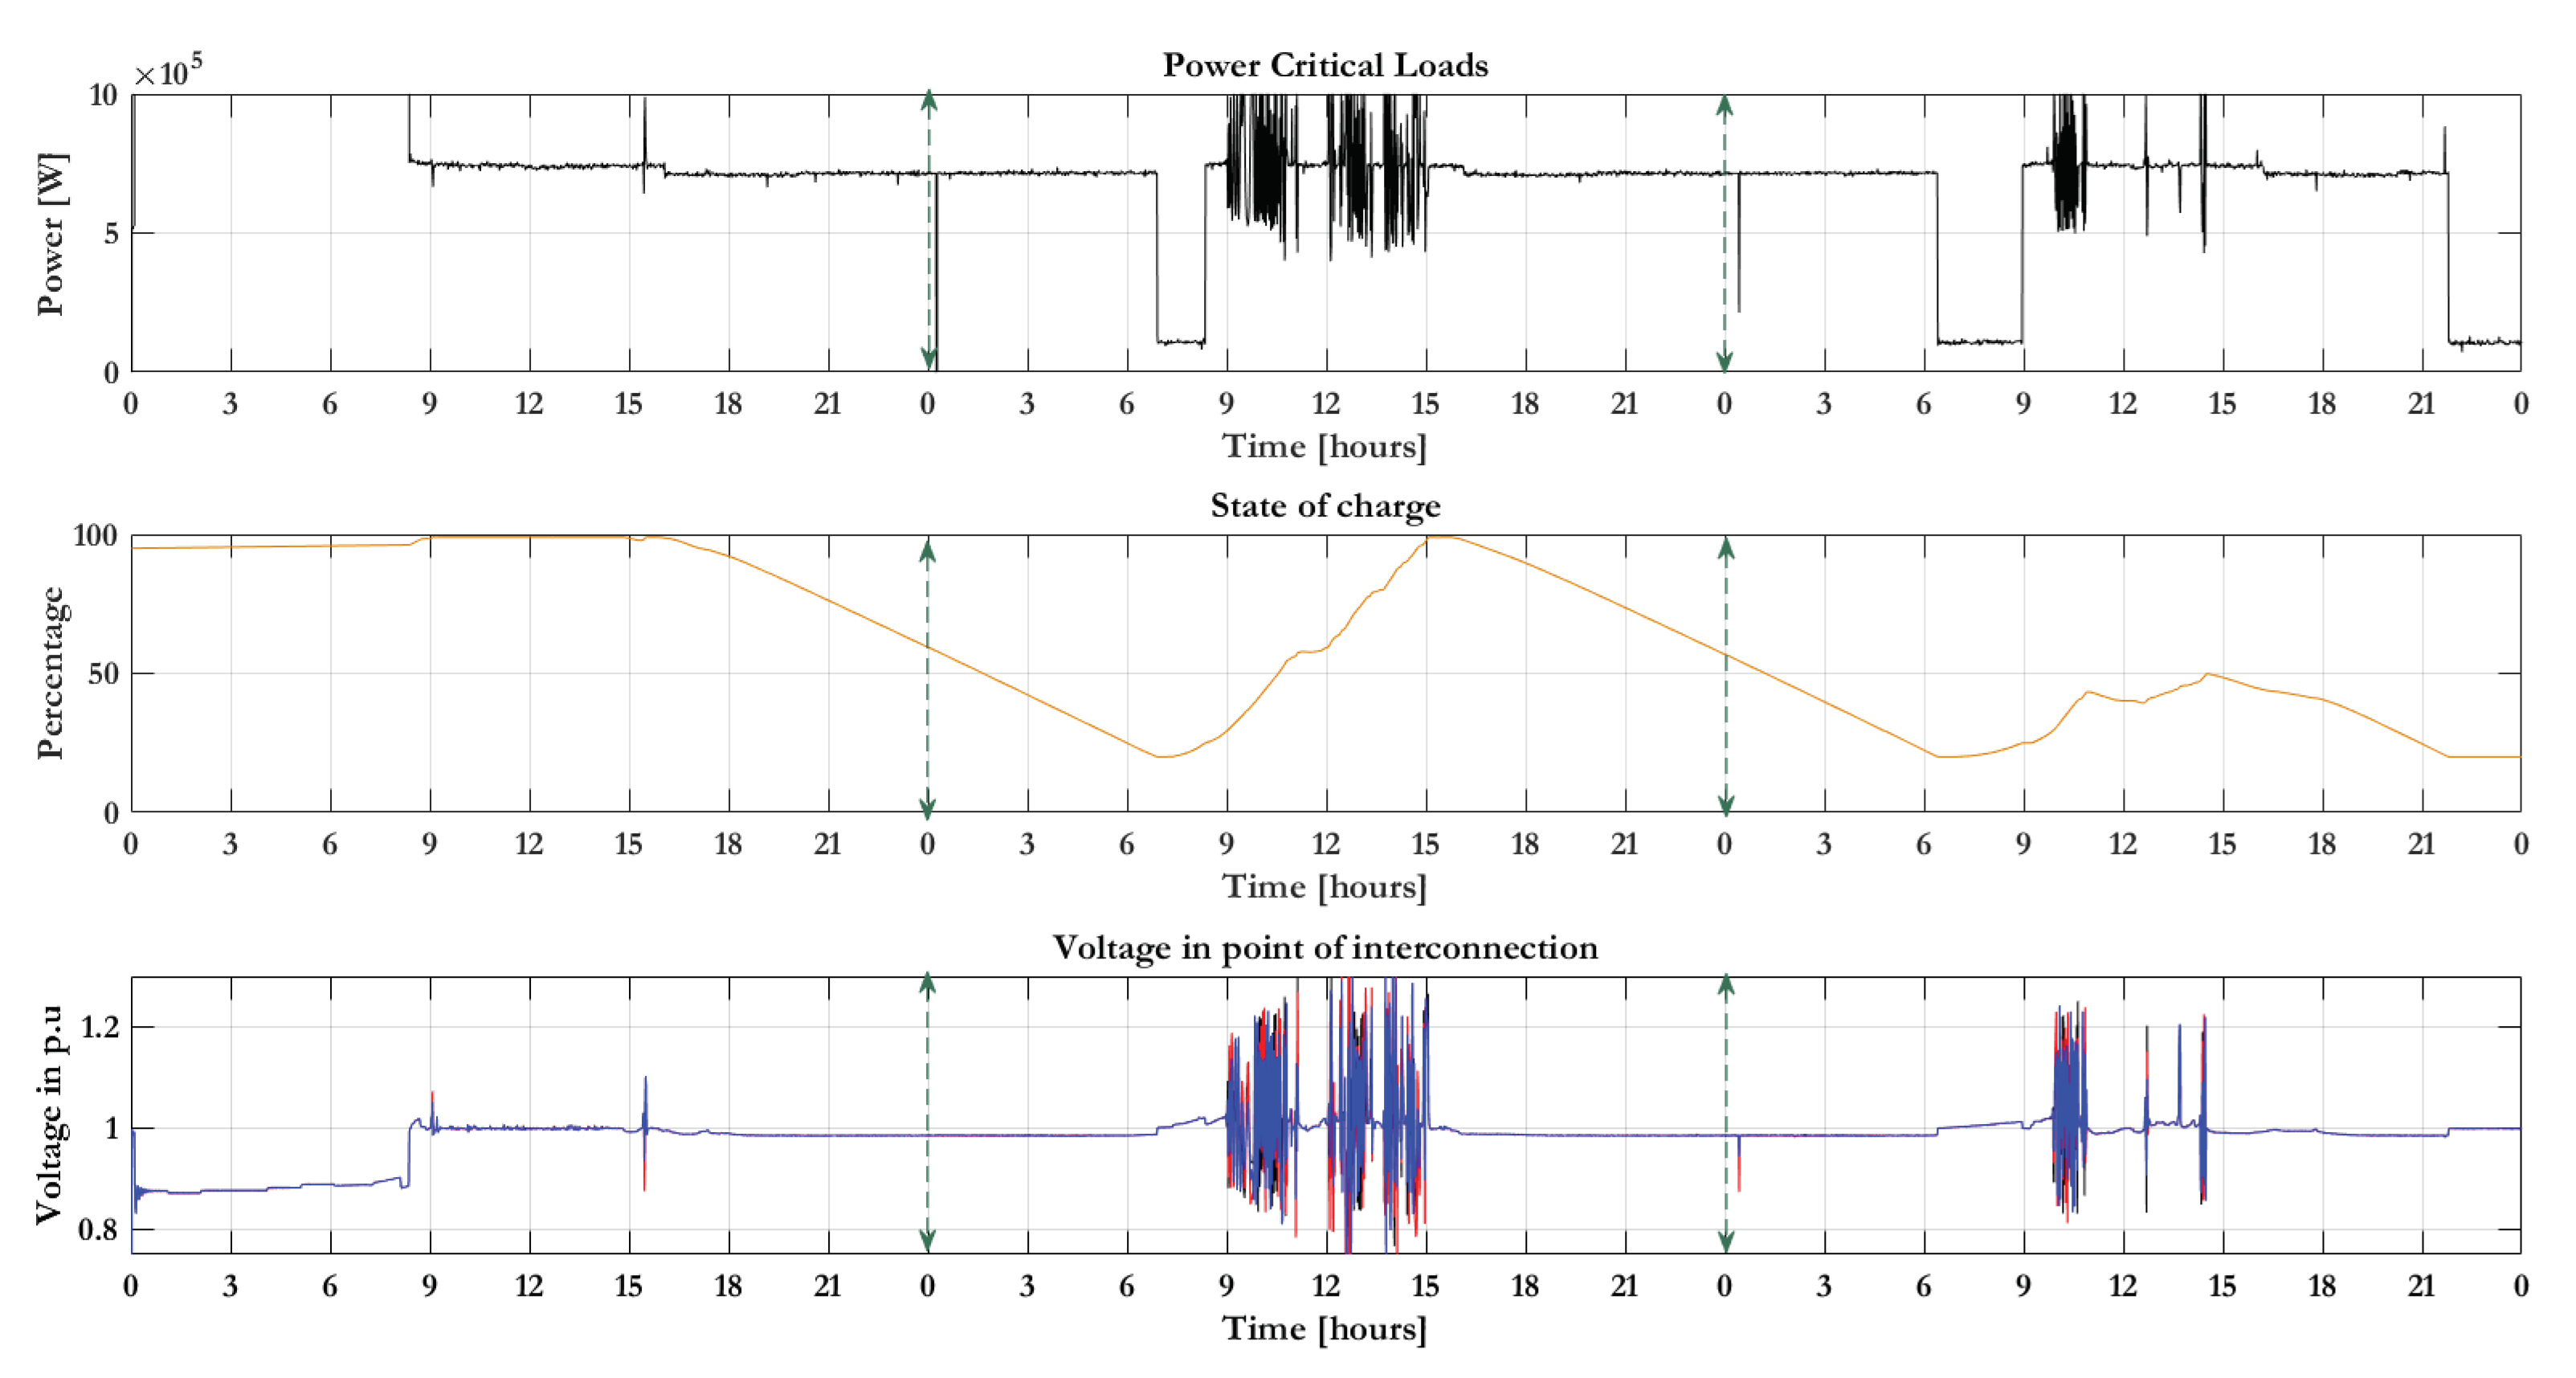
Figure 16. In addition, the power demand for the critical load, the state of charge of the battery, and voltage in the point of interconnection are shown in
Figure 17. The curves demonstrate that the power required for the critical loads is supplied for the PV MG during the day, and the battery supplies the load when the day is over.
The initial SOC of the battery is 100% when the grid is disconnected and the PV system is generating an excess of energy, so the battery system cannot store this excess energy. For this reason, curtailments to the PV system are applied, with the objective to conserve the energy balance. This only happens at the beginning of the simulation.
When a MG operates in islanding mode, it is necessary to know the days of austerity that it could provide. The days of austerity are defined as the days that the MG could be operated in islanding without load interruptions. In this scenario two austerity days were considered, as could be observed in
Figure 17, when the load is disconnected for around 86 min or 1.4 h. This disconnection occurs due to the state of charge of the battery being 20%, and it could not supply the energy required for the load. The load is reconnected when the battery reaches a state of charge equivalent to 25%.
The voltage profile in the substation in the low voltage side is shown in
Figure 17 indicating that the MG installation does not affect the correct functioning of the system, thus the voltage profile is improved. This occurs because initially all the load of the university was being supplied, however, when the disconnection of the main grid occurred, only the critical loads were supplied. In the same figure it could be observed that the voltage in p.u presented some violations. That occurs due to abrupt changes in the solar radiation such as what happened during day number two.
During the 30 days of simulation, all days have interruption of energy for critical loads. The days with major interruption are four and sixteen, with interruption of 7.38 and 7.1 h, respectively. In average during the month, the load had an interruption of approximately 166 min, corresponding to 2.75 h per day. This could be improved with an increase in battery capacity, but the cost of the project will also increase in approximately USD 1680 per additional kW installed.
5.3. Scenario 3: Combined Heat and Power
Under normal operations in connected mode, the CHP will be used as back-up and support, thus helping reduce the energy consumption of the grid. In emergency cases, the CHP could be operated in islanded mode, supplying the energy of critical loads.
To select the correct CHP, it is necessary to know the energy consumption of the critical load. Considering the energy profile for the critical loads and the CHP available on the market, one CPH of 800 kW was selected. The CHP adjusts the necessary power according to the energy consumptions of the loads. Considering that the average demand for the critical loads is 630 kW per hour, the CHP will operate in about 78% of the maximum capacity. In addition, it is important to considerer the space to locate the CHP. According to the datasheet of the CHP around 12 m
2 are necessary for the installation. For the cost, a project inform was used [
19]. In the same way as a PV system and battery, the energy cost was determined considering the annual fuel cost and the total energy produced per year. Obtaining a total cost per kWh, that includes operational and maintenance costs, installation cost, and fuel cost, to obtain a total cost per kWh, as shown in
Table 7.
In the same way to determine the initial cost of the system, a study conducted in UPRM [
34] was used. The values are summarized in
Table 8.
With the cost obtained from
Table 8 and the installed capacity projected for the MG, the initial estimated capital investment is calculated, obtaining the cost shown in
Table 9.
The area needed to install the CHP is minor to the area needed to install the PV system. However, the cost per kWh of CHP is more expensive than the kWh with PV system. As added advantage, the CHP generates additional energy, that will be used in an absorption chiller to refrigerate an additional place, this depends on the capacity of the CHP. In this case according to the capacity of CHP, the chiller could be producing 70 tons of cooling capacity for each bay 200 kW [
34]. The power produced for the chiller could be used to refrigerate an area around 13,000 m
2 which corresponds to approximately 5.35 times the area of the Coliseum Mangual located in UPRM.
To comply with MG Regulation in Puerto Rico, it is necessary to calculate the useful energy obtained by CHP. The regulation establishes that the useful thermal energy output of the system be greater than 50% if the total energy output. The useful thermal energy is equal to 62.96%. In addition, it is necessary to ensure that the heat rate of the machine should be no greater than 7000 BTU/kWh. The heat rate of the machine is 3389.4 BTU/kWh. According to the results, the requirements for MG regulation for thermal energy and heat rate of the CHP are accomplished.
5.4. Scenario 4: Solar Photovoltaic, Batteries Storage System, and Combined Heat and Power
This scenario is a combination of the three previous scenarios. The objective is always the same: to supply the critical loads. In the case of the combination of PV, energy storage and CHP, the installed capacity of each resource changed. It is important to mention that for this scenario the MG operated in islanding mode, and only considered energy for critical loads.
To test the behavior of the system according to the design, the CHP always supplied its maximum capacity. The PV system supplies the energy depending on the solar radiation. The battery is in charge of supplying the necessary energy for the load when the total energy from CHP and PV systems are not enough, or to absorb the excess energy from CHP and PV systems while the state of charge of the battery is less than 95%. Depending on whether it is necessary to supply additional energy or absorb excess, the battery will function accordingly. When CHP and PV systems generate energy higher than the necessary energy for the critical loads, and if the SOC of the battery is higher than 95% a new load is connected to conserve the energy balance. If the state of charge of the battery is less than 20%, the load is disconnected and the energy from CHP will be used to charge the battery, thus the load will be reconnected when the state of charge of the battery is at least 25%. According to the CHPs available on the market and the required average energy for the critical loads (630 kWh), one CHP of 420 kW was selected. The CHP will produce approximately 50% due to the mechanical limitations. The other 50% will be produced from the PV system during the day and the excess energy stored for use during the night. Hence, the capacity of the PV system selected is 1.4 MW, and considering 5h of average solar radiation, approximately 7 MWh will be produced. The parameters considered the simulation are shown in
Table 10.
To calculate the area needed for each system, the dimensions provided for the manufacturer available in the datasheet was used. The configuration and location for PV system is the same as scenario number one. Considering the area needed for the battery system and the previous study for scenario number two, the minimum area per building corresponded to 13%.
After the simulation, the behavior of the system was analyzed. It can be observed that initially, the main grid is connected, but between one and two in the morning, the main grid is disconnected. That is when the needed energy for the critical load is supplied by the MG. For the simulation 30 days were evaluated, however, the results are shown only for the three first days for a better visualization. In
Figure 18 the power from the grid is observed, as well as the power by CHP, the power by PV system, and the power supplied by battery system. In the same way,
Figure 19 shows the power in critical loads, the state of charge in the battery, the voltage per unit at interconnection point, and the unused power.
The days of austerity to supply the critical loads is almost two days, considering that the main grid was disconnected around 2:00 a.m., as observed in
Figure 18. This could be observed when the load was disconnected for around 90 min or 1.5 h. This disconnection occurs due to the state of charge of the battery being 20% and the CHP not being able to supply the energy required for the load. The energy of CHP is used to charge the battery. Then the charge is reconnected when the battery reaches a state of charge equivalent to 25%. The load interruption as observed in the beginning of the second day is blinker, which occurs due to lack of solar radiation and only the CHP has available power to supply the critical loads. However, the CHP cannot supply sufficient energy for the total demand. On the other hand, the voltage profile in the substation in the low voltage side is shown in
Figure 19, which indicates that the MG installation does not affect the correct functioning of the system, thus the voltage profile is improved. In the same figure, it is observed that the voltage in p.u does not present violations. During the 30 days, the voltage stays between the limits.
Just like scenario number two, 30 days were tested to observe the behavior of the system in its timescale. During the 30 days of simulation, from the second day, all days have interruption of energy for critical loads. The days with major interruption are days four and sixteen, with interruptions of 3.75 and 2.92 h respectively. On average during the month, the load had an interruption for approximately 88.83 min, corresponding to 1.48 h per day. The average unused energy per day is 3.8 MW. This energy could be used for another application or increase the installed capacity of the battery. In the same way, as scenario number three, the requirements from MG regulation were evaluated with the information extracted from the simulation. The useful thermal energy is equal to 80.19%, and the heat rate of the machine is 5105.7 BTU/kWh. Results demonstrate that the CHP used for the scenario and simulation complied with the MG requirements.
As in previous scenarios, the CHP used for scenario number four generated an additional energy, that could be used for another purpose. The cooling capacity was calculated using the same consideration as scenario number three. With this capacity, the energy supplied will be 4.5 times the library. This will be profitable in emergency cases because the conservation of some of the material of the library requires cooling.
It is necessary to highlight that the voltage in p.u. in the point of interconnection, shown in
Figure 19, presents some violations due to excess of energy generated by PV system and CHP. In addition, SOC is greater than 95%, thus the BESS can not absorb the excess of energy. In the same time window, unused power turns up as observed in
Figure 19.
5.5. Comparison between Scenarios
The comparison between the different scenarios considered variables, such as installed capacity, estimated initial cost, needed area per scenario, austerity days, and loads interruption. The comparison is summarized in
Table 11.
From the comparison, it could be observed that CHP MG has the minor initial cost, the needed area is the least, and could be maintained in islanding mode operation without zero interruption for critical loads. However, this case does not contemplate the cost for operation. This cost depends on the use of the machine, the fuel consumption, and the fuel cost. Suppose that the CHP operates 24/7 at nominal value, the estimated cost per year is USD 191,000. This value is considering that CHP is operating with natural gas and the cost of fuel is USD 0.26 per gallon, as well as that the fuel flow for the CHP selected is 5.3 kg/s. However, the CHP operated with propane gas, the estimated cost per year is USD 734,000.
Three of the proposed scenarios could be operated in islanding mode, however only scenario number two: PV and battery system does not require additional investment after initial cost. This scenario required a major area to be installed and presents interruption for the critical loads.
The scenario number four is cheaper than scenario number two, besides the fact that the area required to install the MG is around fifty percent of the area required for scenario number two. However, scenario number four does not consider the fuel cost per CHP in the initial cost, similar to the above case, the estimated cost per year for CHP of 420 kW and assuming that the fuel flow is around 2.78 kg/s, and the cost per gallon on natural gas is USD 0.26, the estimates fuel cost per year is USD 102,000. This value is considering that the CHP is always operating at nominal power. It is important to mention that the CHP produces and additional energy that could be used for refrigeration, for example the library. In addition, scenario number four has less load interruptions that scenario number two does not have.
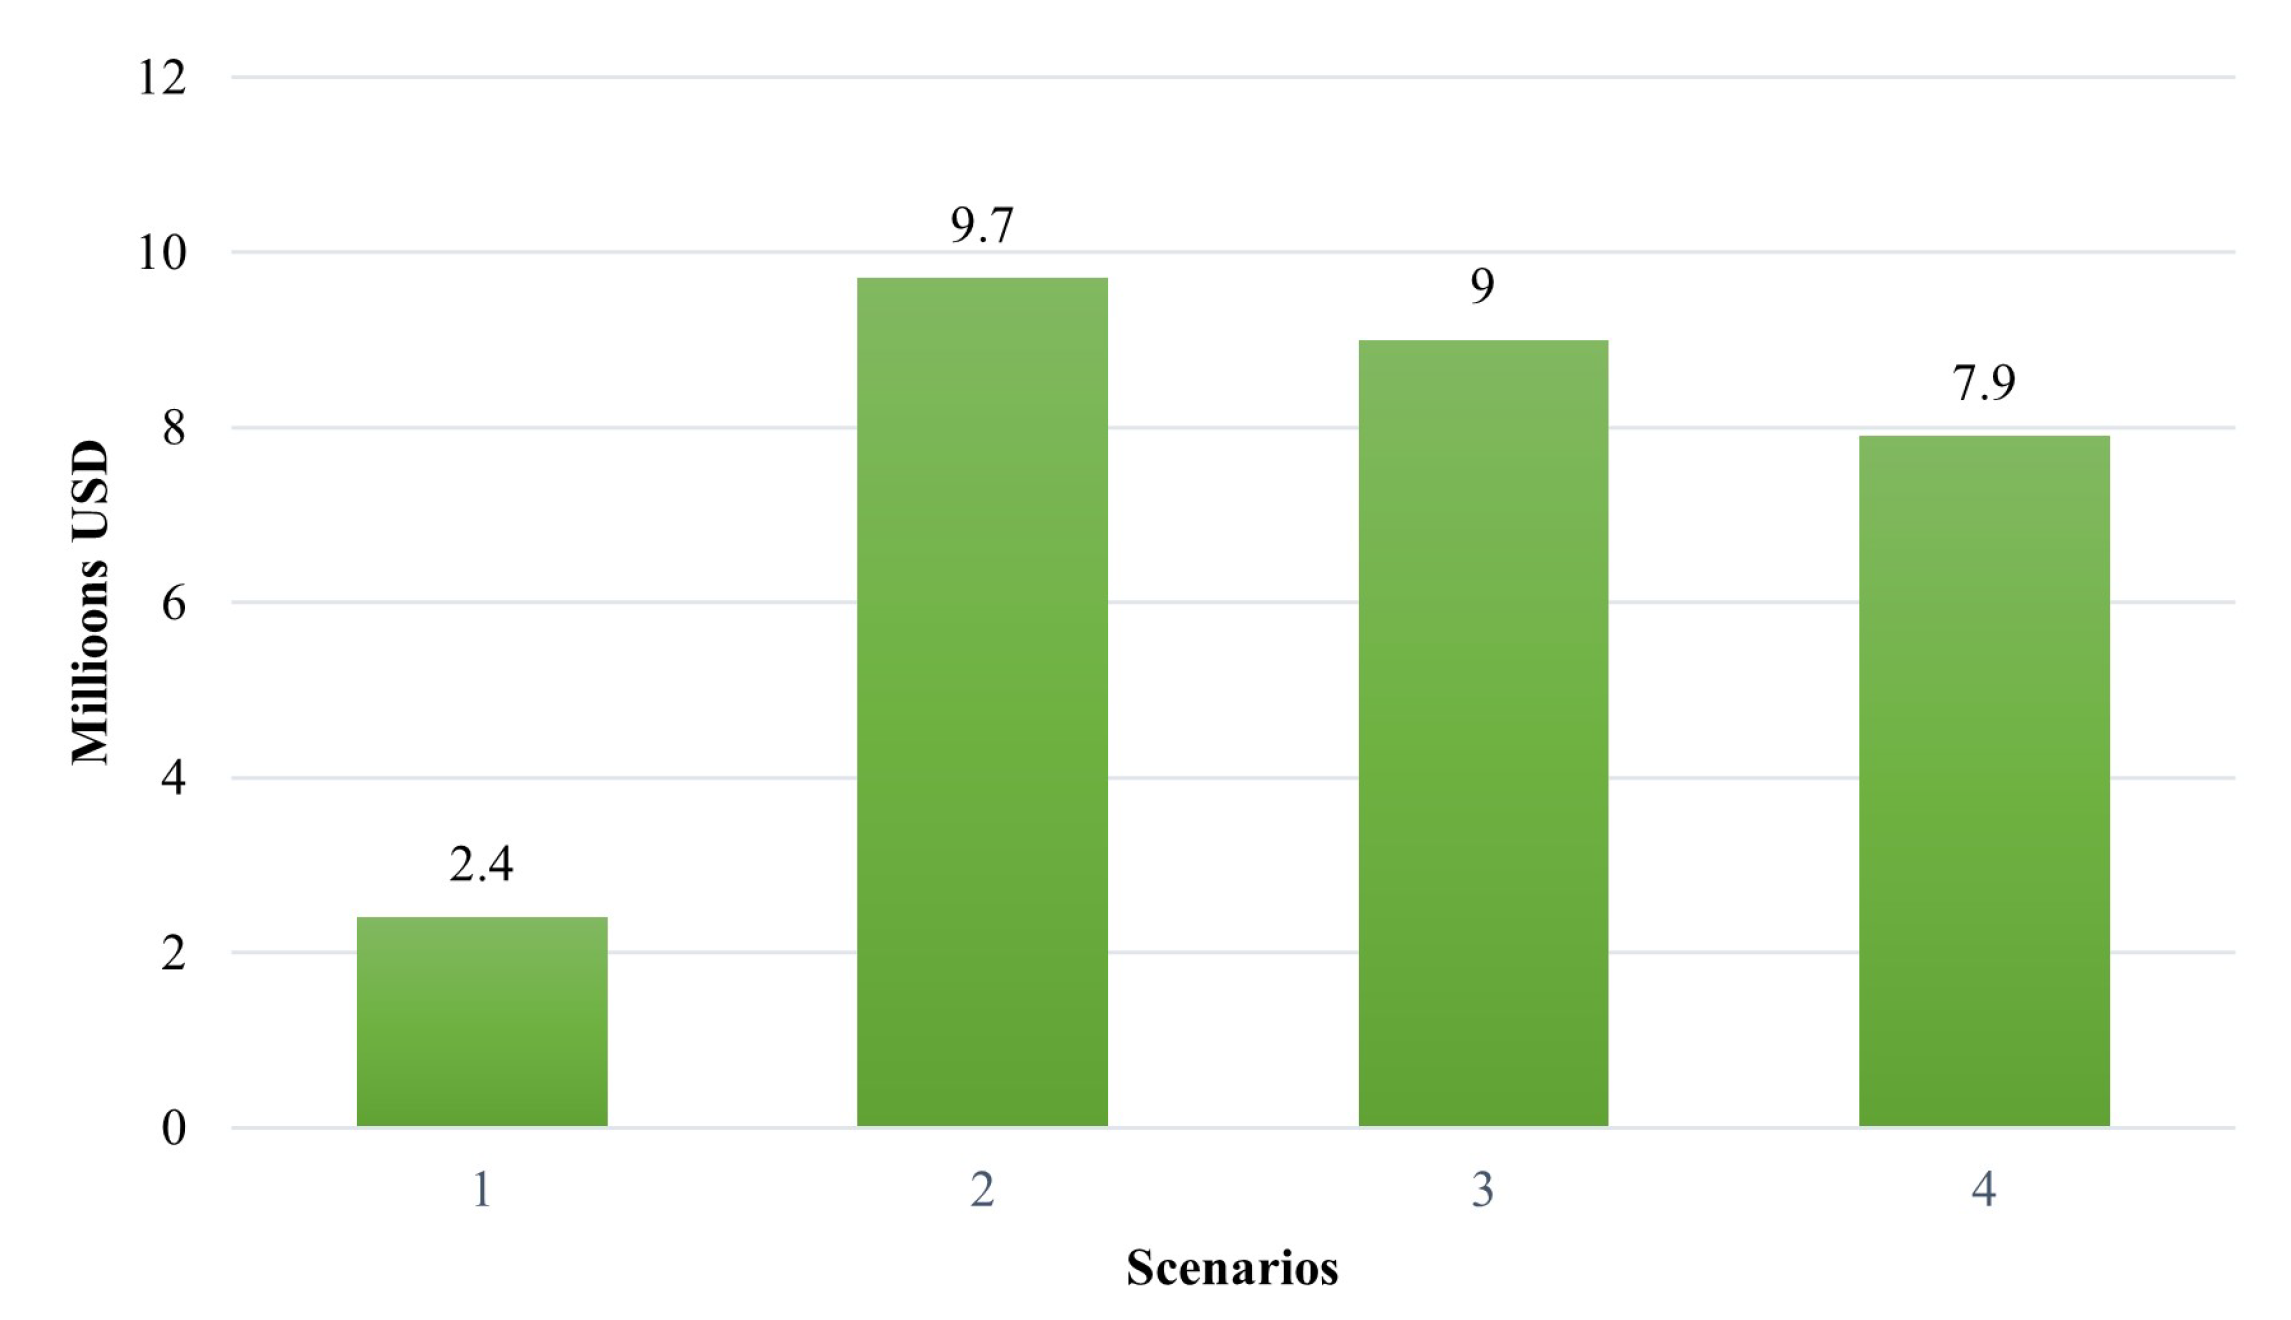
Considering the use of propane gas, a comparison is made between the scenarios with the initial cost and a projection of the fuel cost for scenarios number 2 and 4 in 10 years. This information is summarized in
Table 12 and
Figure 20. From the comparison, despite scenario number 3 having a lower initial cost, when carrying out the fuel cost projection, the most profitable in 10 years is scenario number 4.
6. Conclusions
The proposed methodology considers the design of a MG for university campuses, complying with MG regulations. This approach also includes the definition of critical loads, the analysis of the local resources, and the study of electrical distribution systems where the MG will be installed. This methodology was applied in the campus of the University of Puerto Rico at Mayagüez. As a results, the best options were PV, batteries, and CHP, if the technological advances and availability of resources for Puerto Rico are considerer. Four functional scenarios were designed and simulated to evaluate the best option for a MG in a university campus in MATLAB-Simulink. These models contain the distribution system of the University of Puerto Rico´s campus at Mayagüez Campus as a load. For each scenario, the generation resources were modeled.
After simulation, the CHP was determined as the best option as it allows islanding mode operation and generates additional energy for refrigeration. In addition, the area needed for installation is less than other scenarios. However, the CHP depends on fuel to generate electricity, and in emergency cases the availability of fuel could be affected. Puerto Rico is impacted by this fact since the fuel comes from other places, but the solar and battery resources are not disturbed by this phenomenon. Currently, the PV system has a profitable cost per kWh, and it cannot operate in islanding mode, since it needs a reference voltage. Though, the installation of PV system generates savings in the energy consumption of for a better price than the grid. It is expected that the cost of batteries will decrease, and in the future, it will compete with the CHP cost.
As future work, different scenarios can be evaluated based on the models created in this investigation, increasing the generation capacity, for example. Other alternatives are variate the scenario number three using greater installed capacity that allows no load interruptions and operate the entire campus in islanding mode. Furthermore, an economical analysis could be done, including the environmental costs and the implications of using the proposed technologies for the different presented scenarios.


