Article

An Adaptive UI Based on User-Satisfaction Prediction in Mixed Reality

1
BioComputing Lab, Department of Computer Science and Engineering, Korea University of Technology and Education (KOREATECH), Cheonan 31253, Korea
2
BioComputing Lab, Institute for Bio-Engineering Application Technology, Department of Computer Science and Engineering, Korea University of Technology and Education (KOREATECH), Cheonan 31253, Korea
*
Author to whom correspondence should be addressed.
Appl. Sci. 2022, 12(9), 4559; https://doi.org/10.3390/app12094559
Submission received: 7 April 2022 / Revised: 27 April 2022 / Accepted: 28 April 2022 / Published: 30 April 2022
(This article belongs to the Collection Virtual and Augmented Reality Systems)

Abstract

:
As people begin to notice mixed reality, various studies on user satisfaction in mixed reality (MR) have been conducted. User interface (UI) is one of the representative factors that affect interaction satisfaction in MR. In conventional platforms such as mobile devices and personal computers, various studies have been conducted on providing adaptive UI, and recently, such studies have also been conducted in MR environments. However, there have been few studies on providing an adaptive UI based on interaction satisfaction. Therefore, in this paper, we propose a method based on interaction-satisfaction prediction to provide an adaptive UI in MR. The proposed method predicts interaction satisfaction based on interaction information (gaze, hand, head, object) and provides an adaptive UI based on predicted interaction satisfaction. To develop the proposed method, an experiment to measure data was performed, and a user-satisfaction-prediction model was developed based on the data collected through the experiment. Next, to evaluate the proposed method, an adaptive UI providing an application using the developed user-satisfaction-prediction model was implemented. From the experimental results using the implemented application, it was confirmed that the proposed method could improve user satisfaction compared to the conventional method.

1. Introduction

Recently, as face-to-face activities have been restricted due to COVID-19, the demand for non-face-to-face (hereafter NFF) activities has increased [1,2]. Various solutions such as recorded video [3] and video-conferencing systems [4,5] have been proposed for NFF activities, but these solutions have limitations in terms of immersion and realism. In order to overcome them, research on applying mixed reality (MR) to NFF activities has been conducted [1,2,6]. In MR, a user must perform an interaction to achieve his/her own purpose. Such an interaction performed by the user can be classified into human-to-human, human-to-virtual-object, human-to-real-object, etc., based on the target. Among these interaction types, the human-to-virtual-object interaction is the most used in MR for NFF activities, and the user can be provided immersion in the work through interaction with various virtual objects.
One of the most frequently used virtual object types in MR is a user interface (UI). As shown in Figure 1, a UI for triggering an event in the MR environment can be expressed not only as simple button types but also as various types of interactive objects.
Since UI is a channel that connects users with MR, it can affect user satisfaction [7,8]. In order to improve user satisfaction, studies on adaptive UI that provide such a UI according to the context have been conducted on conventional platforms such as mobile devices and PCs [9,10,11]. Recently, studies to provide such an adaptive UI in MR have been conducted [12,13,14,15]. These conventional studies focused on proposing adaptive UI and evaluating the user satisfaction of the proposed adaptive UI. There were insufficient studies to provide real-time adaptive UI based on user satisfaction.
In order to provide adaptive UI based on satisfaction, it is required to consider the satisfaction-measurement method. Most user satisfaction for MR applications is measured through a post-questionnaire [16,17]. In this case, it is difficult to provide a real-time adaptive UI based on user satisfaction because a user answer is required. Meanwhile, it is also possible to analyze user satisfaction in real time by attaching a sensor such as an EEG to the MR-application user [18,19]. However, in this case, there is a possibility that user satisfaction may be lowered due to the attachment of an additional sensor. As described above, the existing satisfaction-measurement method has a limitation that it is difficult to measure satisfaction in real-time or that satisfaction may be promised in the measurement process. That is, the existing methods are not suitable as a satisfaction-measurement method for providing a real-time adaptive UI based on user satisfaction. Therefore, it is required to study a new approach to provide a satisfaction-based adaptive UI.
In this paper, we propose an adaptive UI based on user-satisfaction prediction in MR. The proposed method predicts user satisfaction based on interaction-related information such as gaze, hand, head, and object, and adaptively provides UI by correcting position based on the prediction results.
This paper is composed as follows. In Section 2, we introduce interaction-related information that is mainly used in conventional studies and the developed adaptive UI in conventional studies. In Section 3, we propose an adaptive UI provision method based on user satisfaction in MR. In Section 4, we conduct two experiments, one is to develop the proposed method and the other is to evaluate the proposed method, and we analyze the experimental results. Finally, in Section 5, we present conclusions and future works.

2. Related Works

2.1. Interaction-Related Information in Mixed Reality

In an MR environment, most goals are achieved by the user performing an interaction. That is, since the interaction is a means by which the users deliver their intention to the MR, it can significantly affect the user satisfaction in MR. Therefore, in order to improve user satisfaction in MR, it is required to analyze interaction-related information [7,20,21].
In conventional studies, interaction-related information was described in various forms, and was used for various purposes in each study. Bai, H. et al. [22] proposed a collaborative system that can share eye gaze and hand gestures to remote users and evaluated the usability of the proposed system. Kytö, M. et al. [23] focused on various multimodal techniques for precise target selection and confirmed that when head motion and eye gaze are used together, targeting accuracy can be increased compared to when only eye gaze is used. Blattgerste, J. et al. [24] compared eye-gaze-based-selection and head-gaze-based-selection methods in terms of speed, workload, required movement, and user satisfaction. Mo, G. B. et al. [25] proposed the Gesture Knitter, a tool that makes it easy to create a customized gesture recognizer for MR applications that require wearing a head-mounted headset. Samini, A. et al. [26] investigated the performance metrics for evaluating the interaction of virtual and augmented reality, and mentioned that the position, size, and direction of movement of the target object can be used as independent variables to evaluate the quality.
In the study mentioned above, mainly the following information was used as interaction-related information: gaze, head, hand, and object.

2.2. Adaptive UI in Mixed Reality

Most MR applications provide connectivity to MR devices such as see-through devices and allow users to interact through UI. That is, since the UI plays a role in connecting the user and the MR application, it has a major influence on user satisfaction with the MR application [7,8,26].
In order to improve user satisfaction within the MR application, research focusing on adaptively providing a UI has recently been conducted [12,13,14,15]. Lindlbauer, D. et al. [12] proposed an optimization-based approach to adjust the amount and location of information displayed in the MR environment and evaluated the proposed method through application. Pfeuffer, K. et al. [13] proposed ARtention, a tool for designing a gaze-adaptive UI, and evaluated the proposed method through three prototypes. Cheng, Y. et al. [14] proposed SemanticAdapt, an optimization-based method to provide an adaptive MR layout in different environments, and evaluated the proposed method by implementing the application. Krings, S. et al. [15] proposed AARCon, a development framework for context-aware augmented-reality applications for mobile AR, and implemented the application using the proposed framework.
Conventional studies such as the above focused on adaptive UI to increase user satisfaction when using applications, and studies focused on providing adaptive UI based on user satisfaction were insufficient. Therefore, it is required to try a new approach to provide an adaptive UI based on user satisfaction.

3. Proposed Method

In this section, we propose a method to provide an adaptive UI based on interaction-satisfaction prediction. In general, in order to examine user satisfaction in MR, it should be asked after the user performs an interaction. However, in the above method, it is difficult to provide an adaptive UI in real time when a user uses an application because satisfaction can be examined only after performing the interaction. Therefore, in the proposed method, we try to use a user-satisfaction-prediction method before the interaction is completed. Once user satisfaction is predicted, the time to obtain user satisfaction for providing adaptive UI can be shortened as shown in Figure 2 (highlighted in blue color).
Another method to examine user satisfaction is to attach a sensor such as an EEG and analyze the sensed data. The above method has the advantage of not requiring a response from the user but has a disadvantage that it can affect usability because an additional sensor is attached. Therefore, we try to predict user satisfaction based on information that can be measured in real time when performing an interaction and that does not require an additional device other than an MR device. Based on the conventional studies introduced in Section 2.1, the interaction information selected as the input in this study is shown in Figure 3.
Among them, gaze, hand, and head information are the ones based on user movement in the real world, so they are difficult to control in an MR environment. However, since object information is of the virtual world, it is easier to control in an MR environment than the other information. Therefore, the correction for providing an adaptive UI is performed based on object information. The procedure for providing the proposed adaptive UI described above is shown in Figure 4, and the detailed description is as follows.
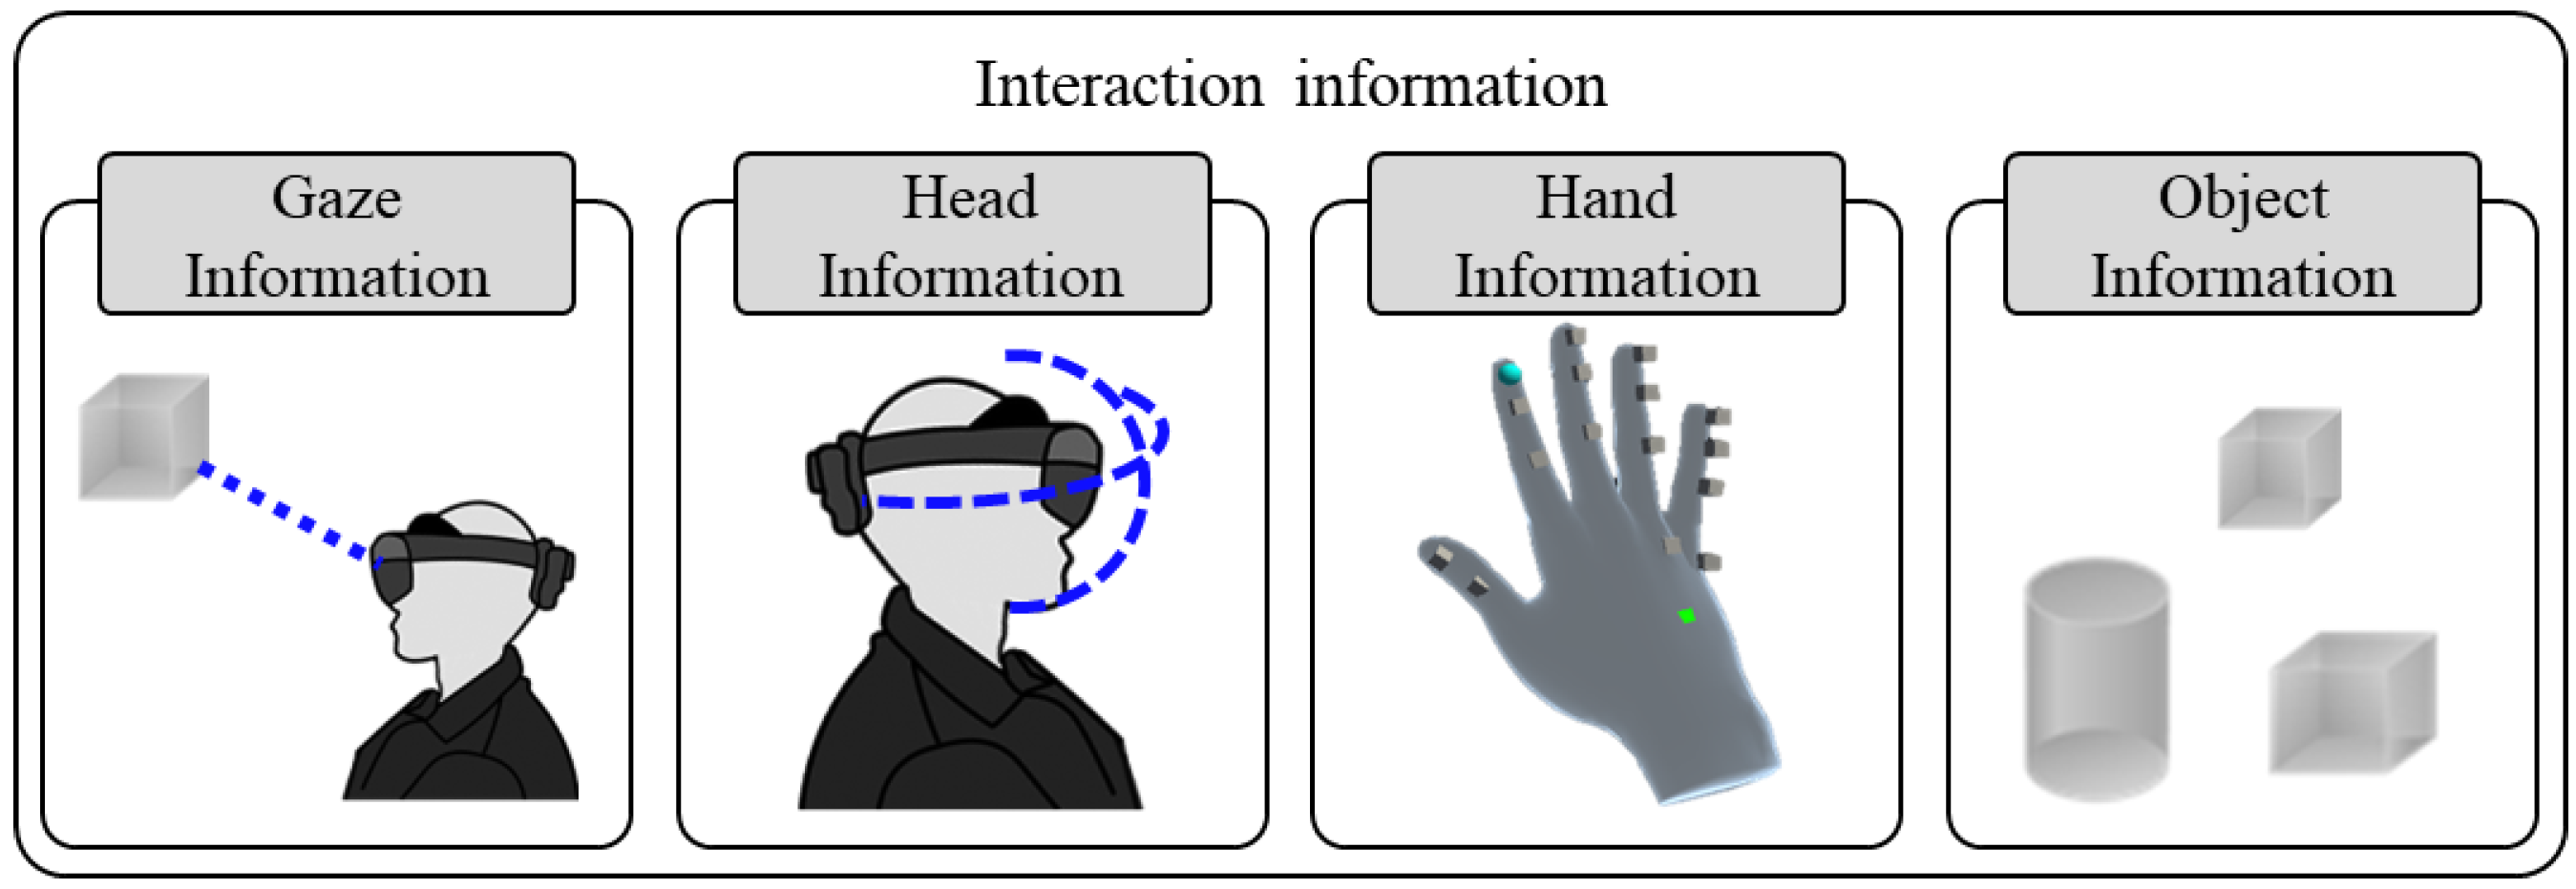
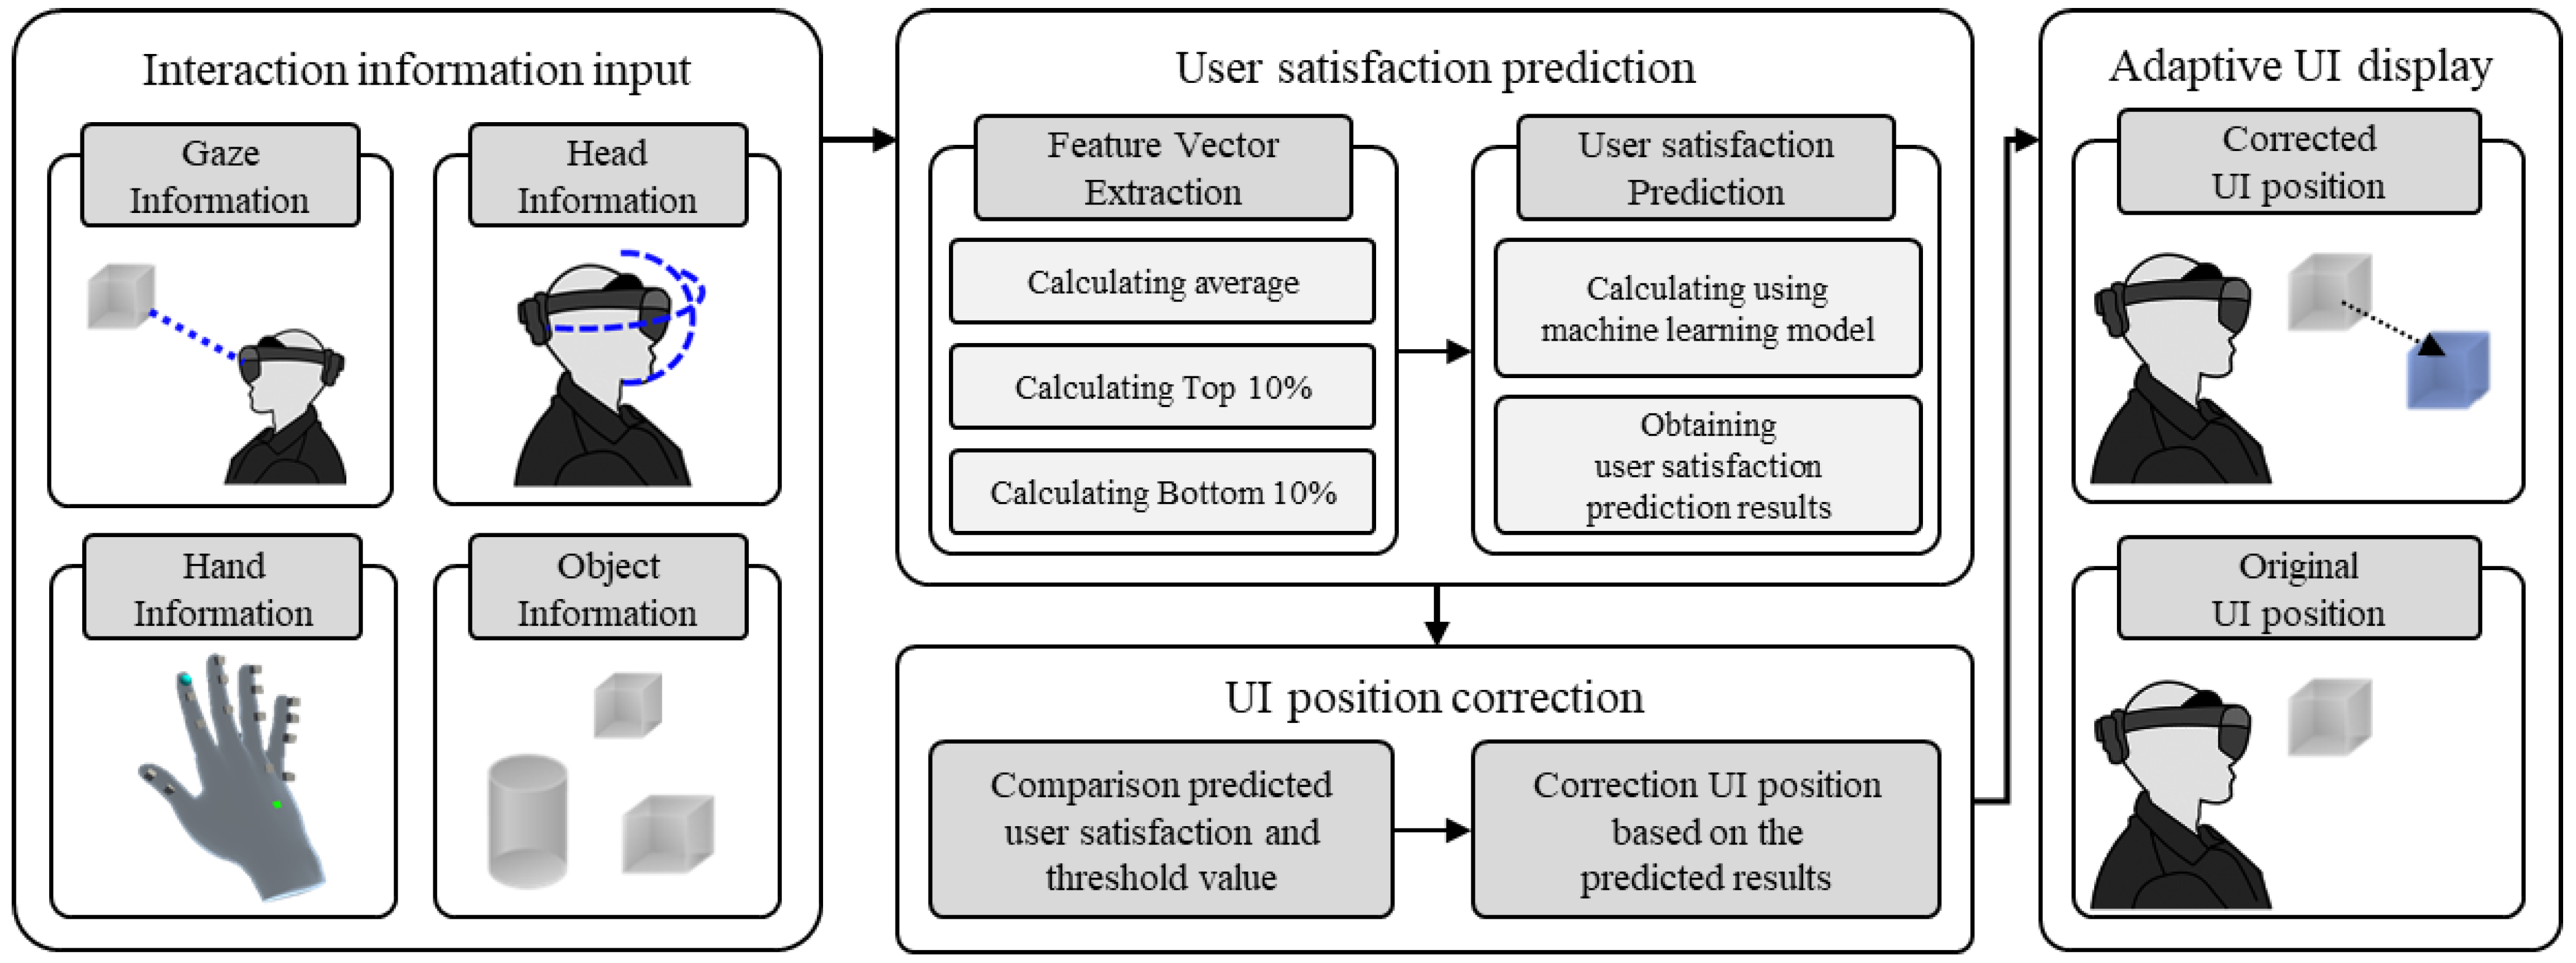
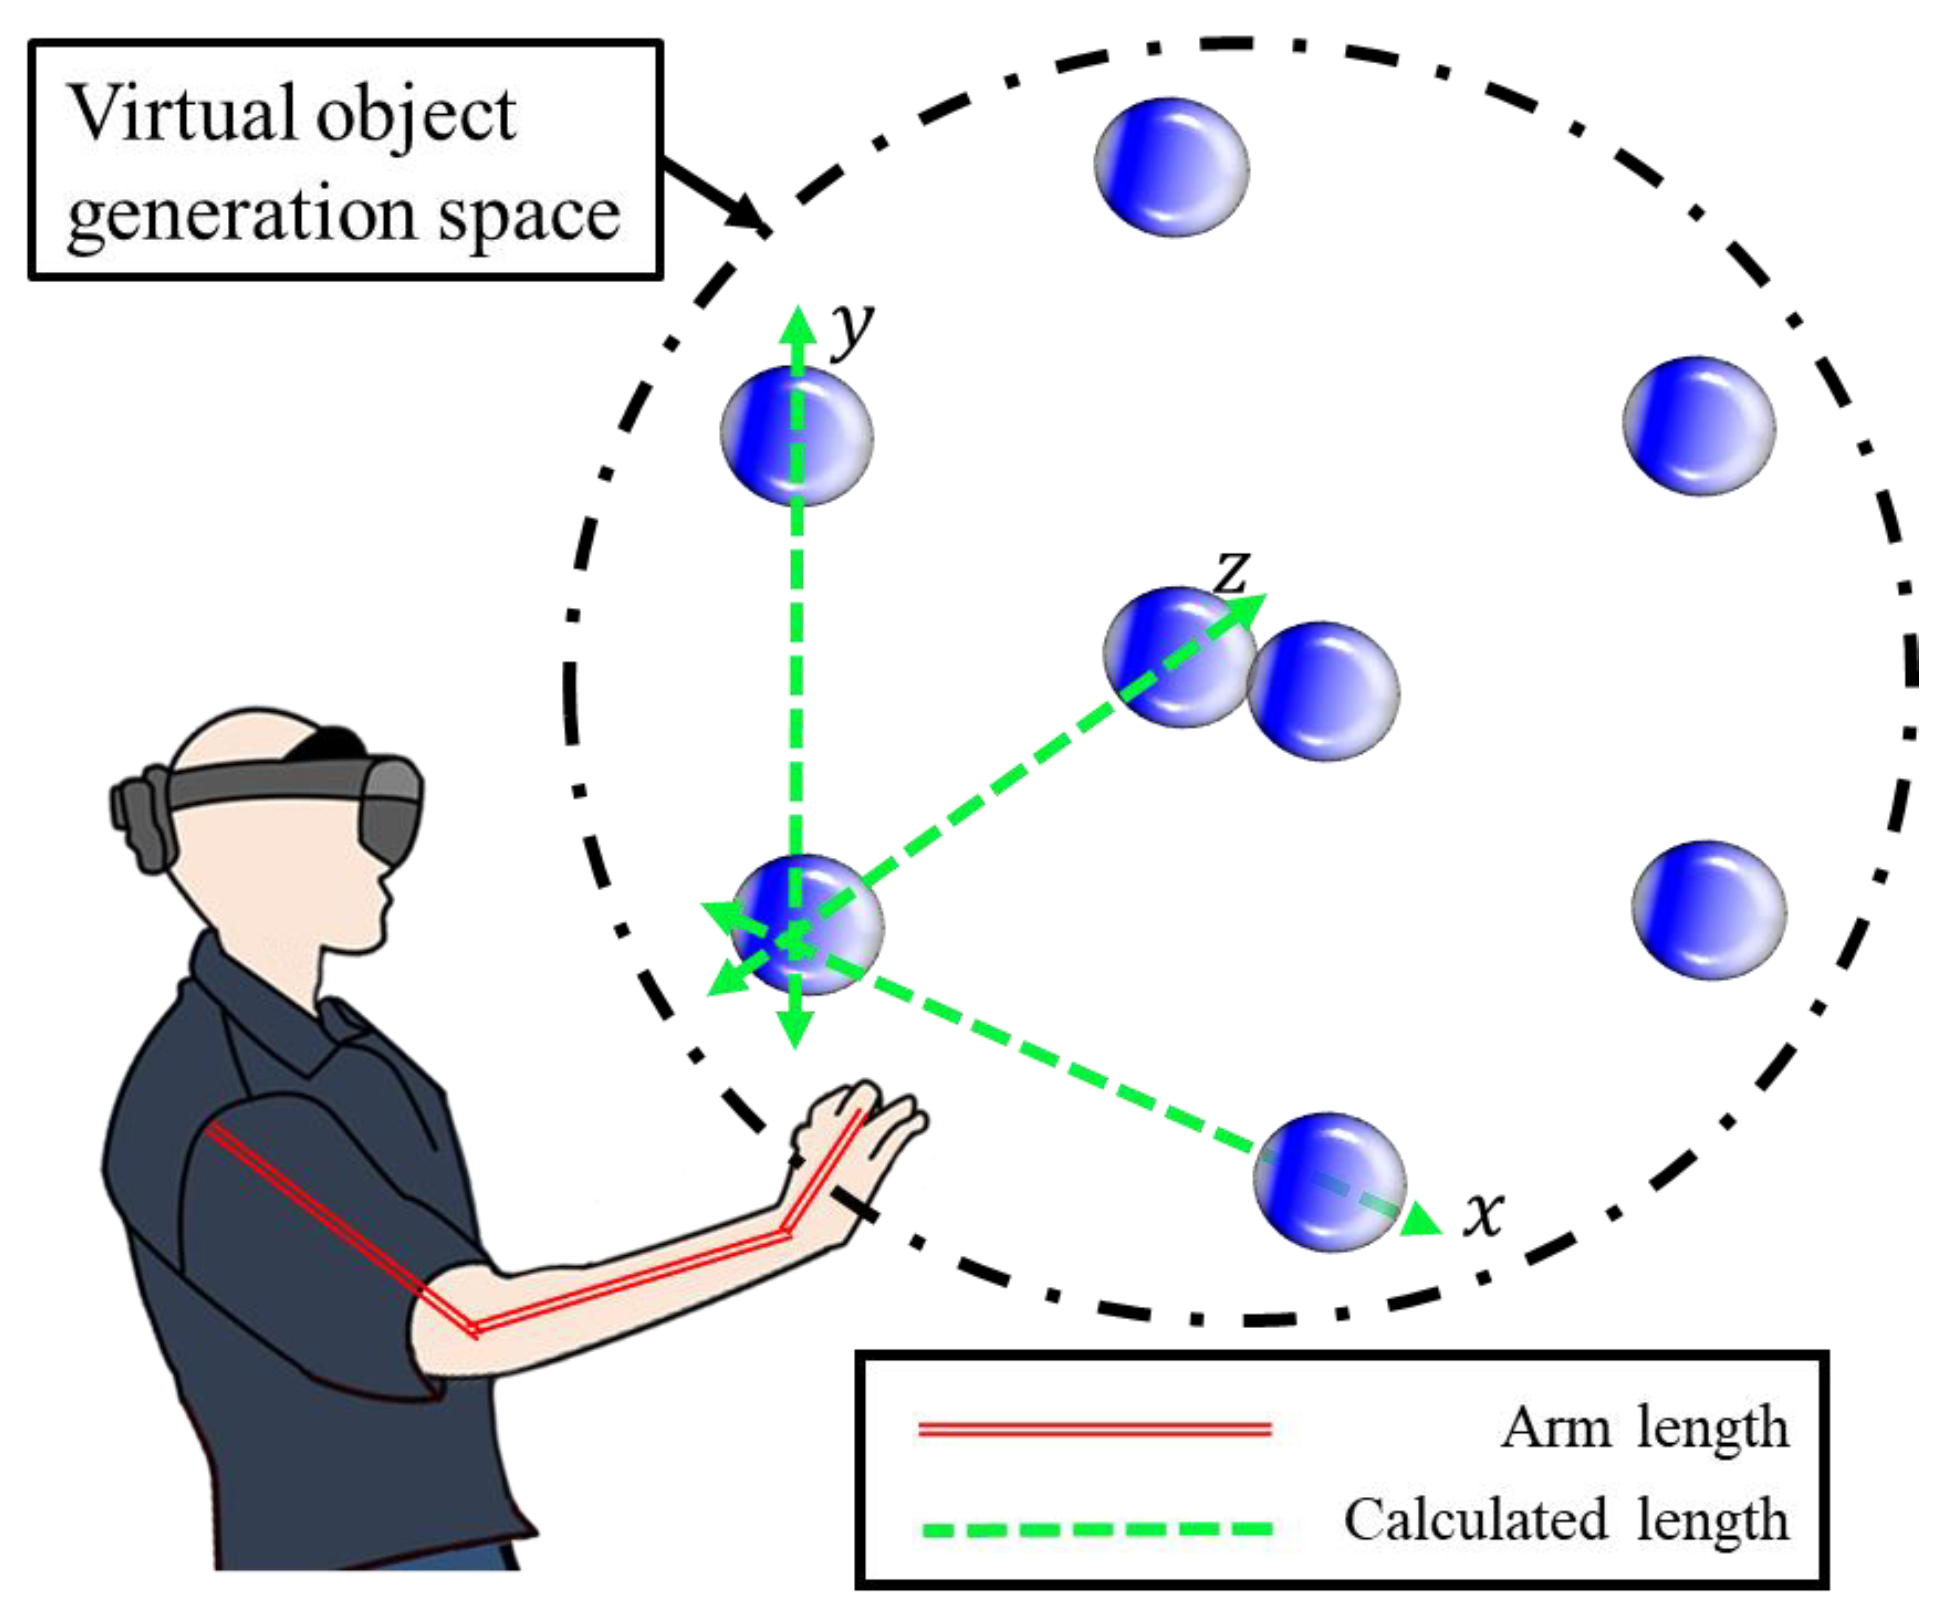
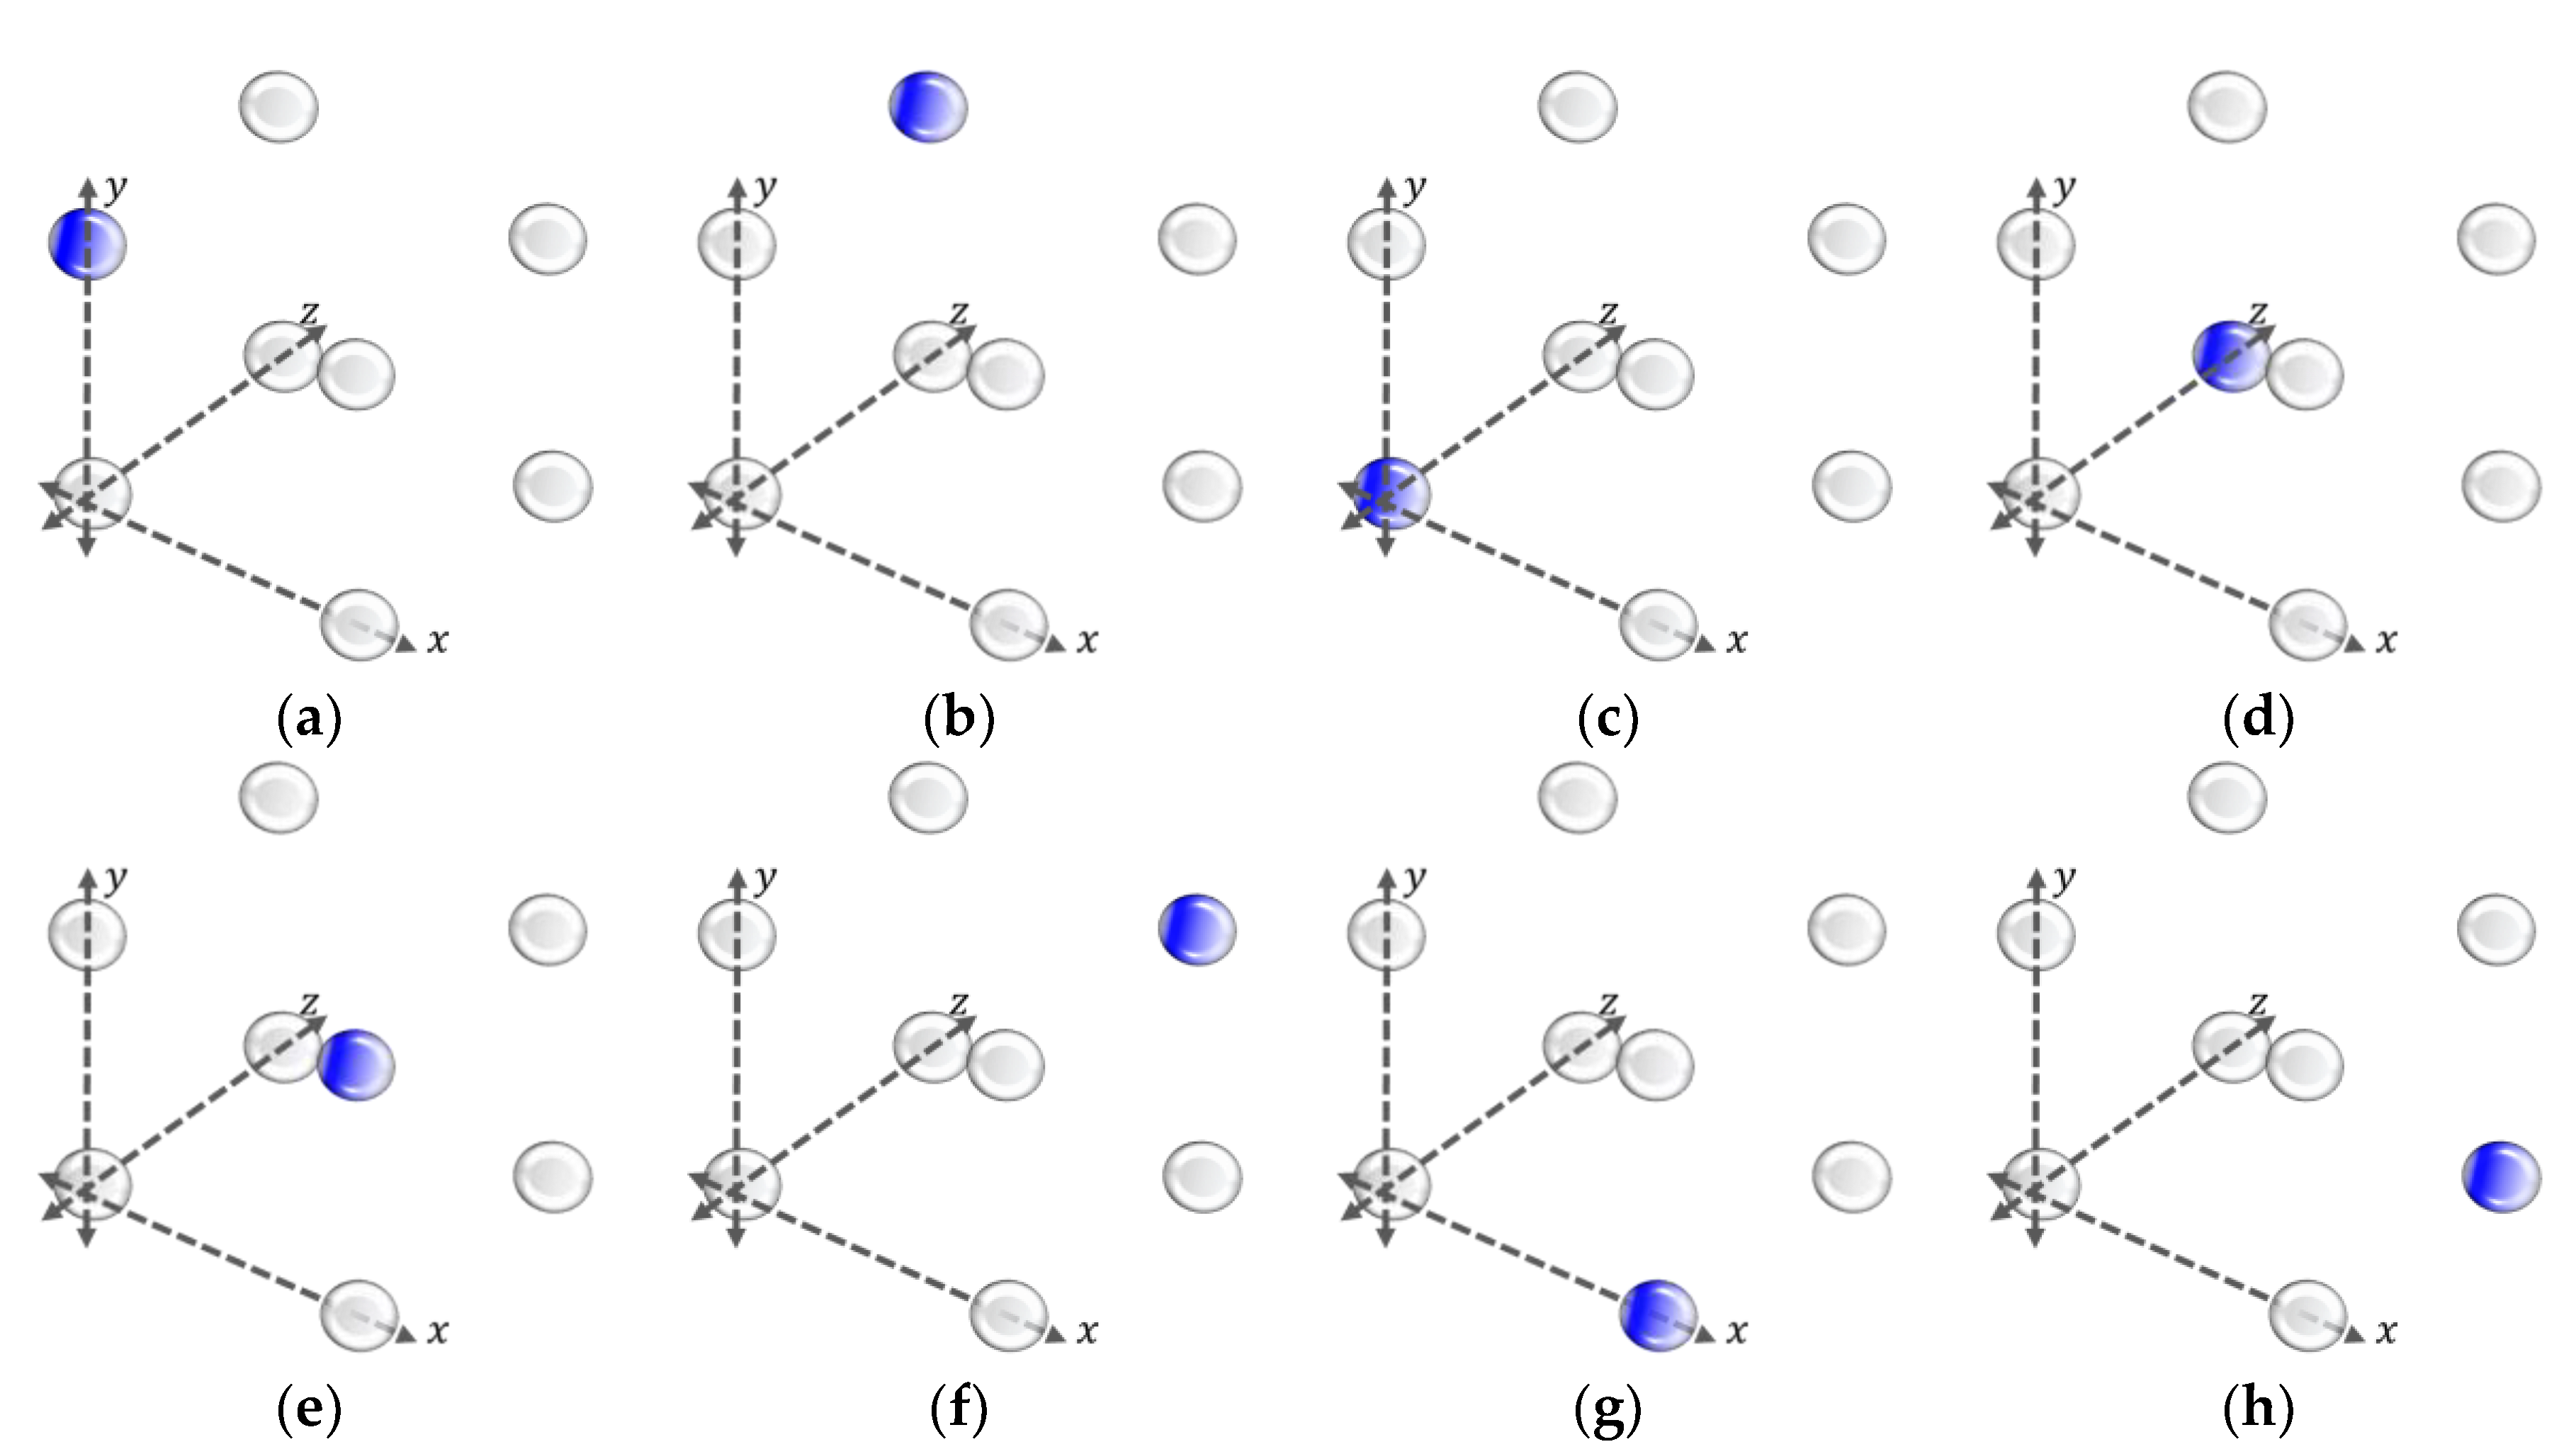
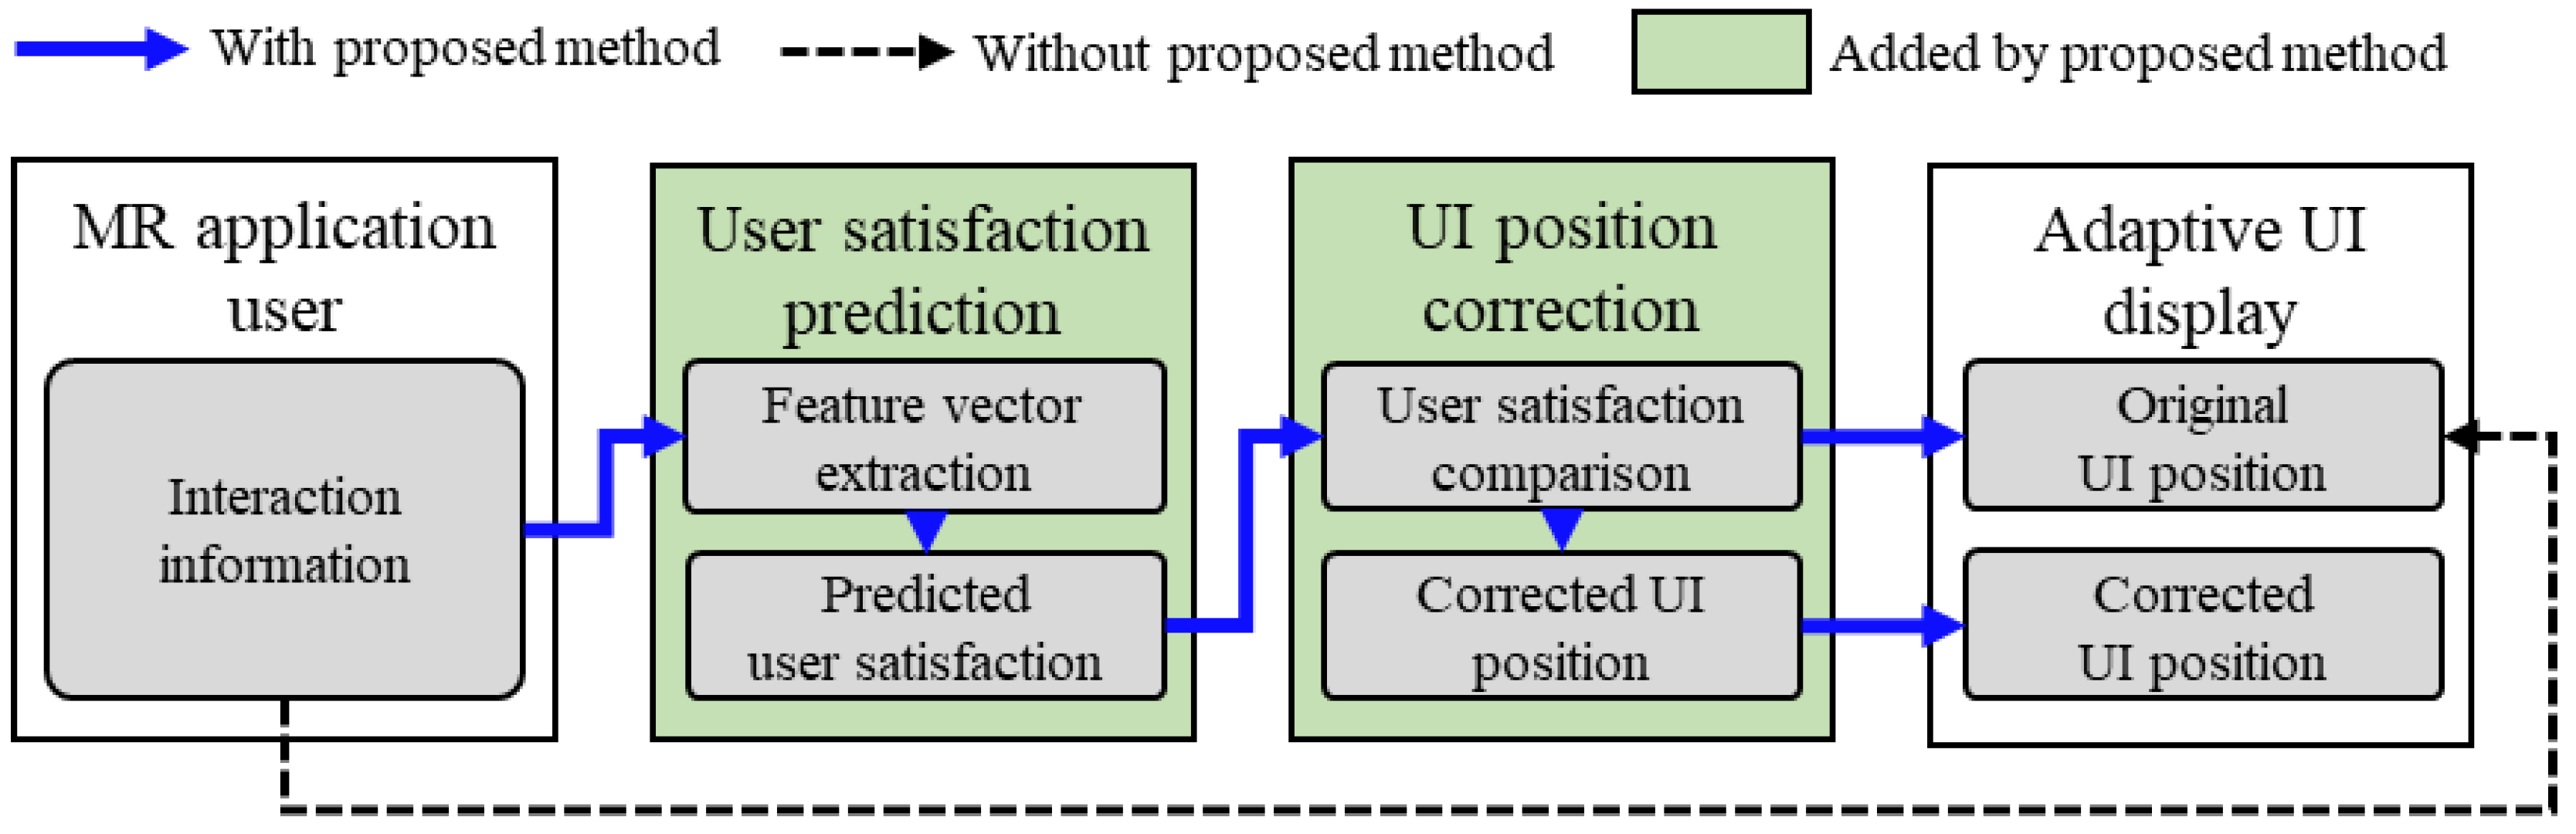
  • Interaction information input: raw data related to gaze, head, hand and object information are obtained when user performs an interaction.
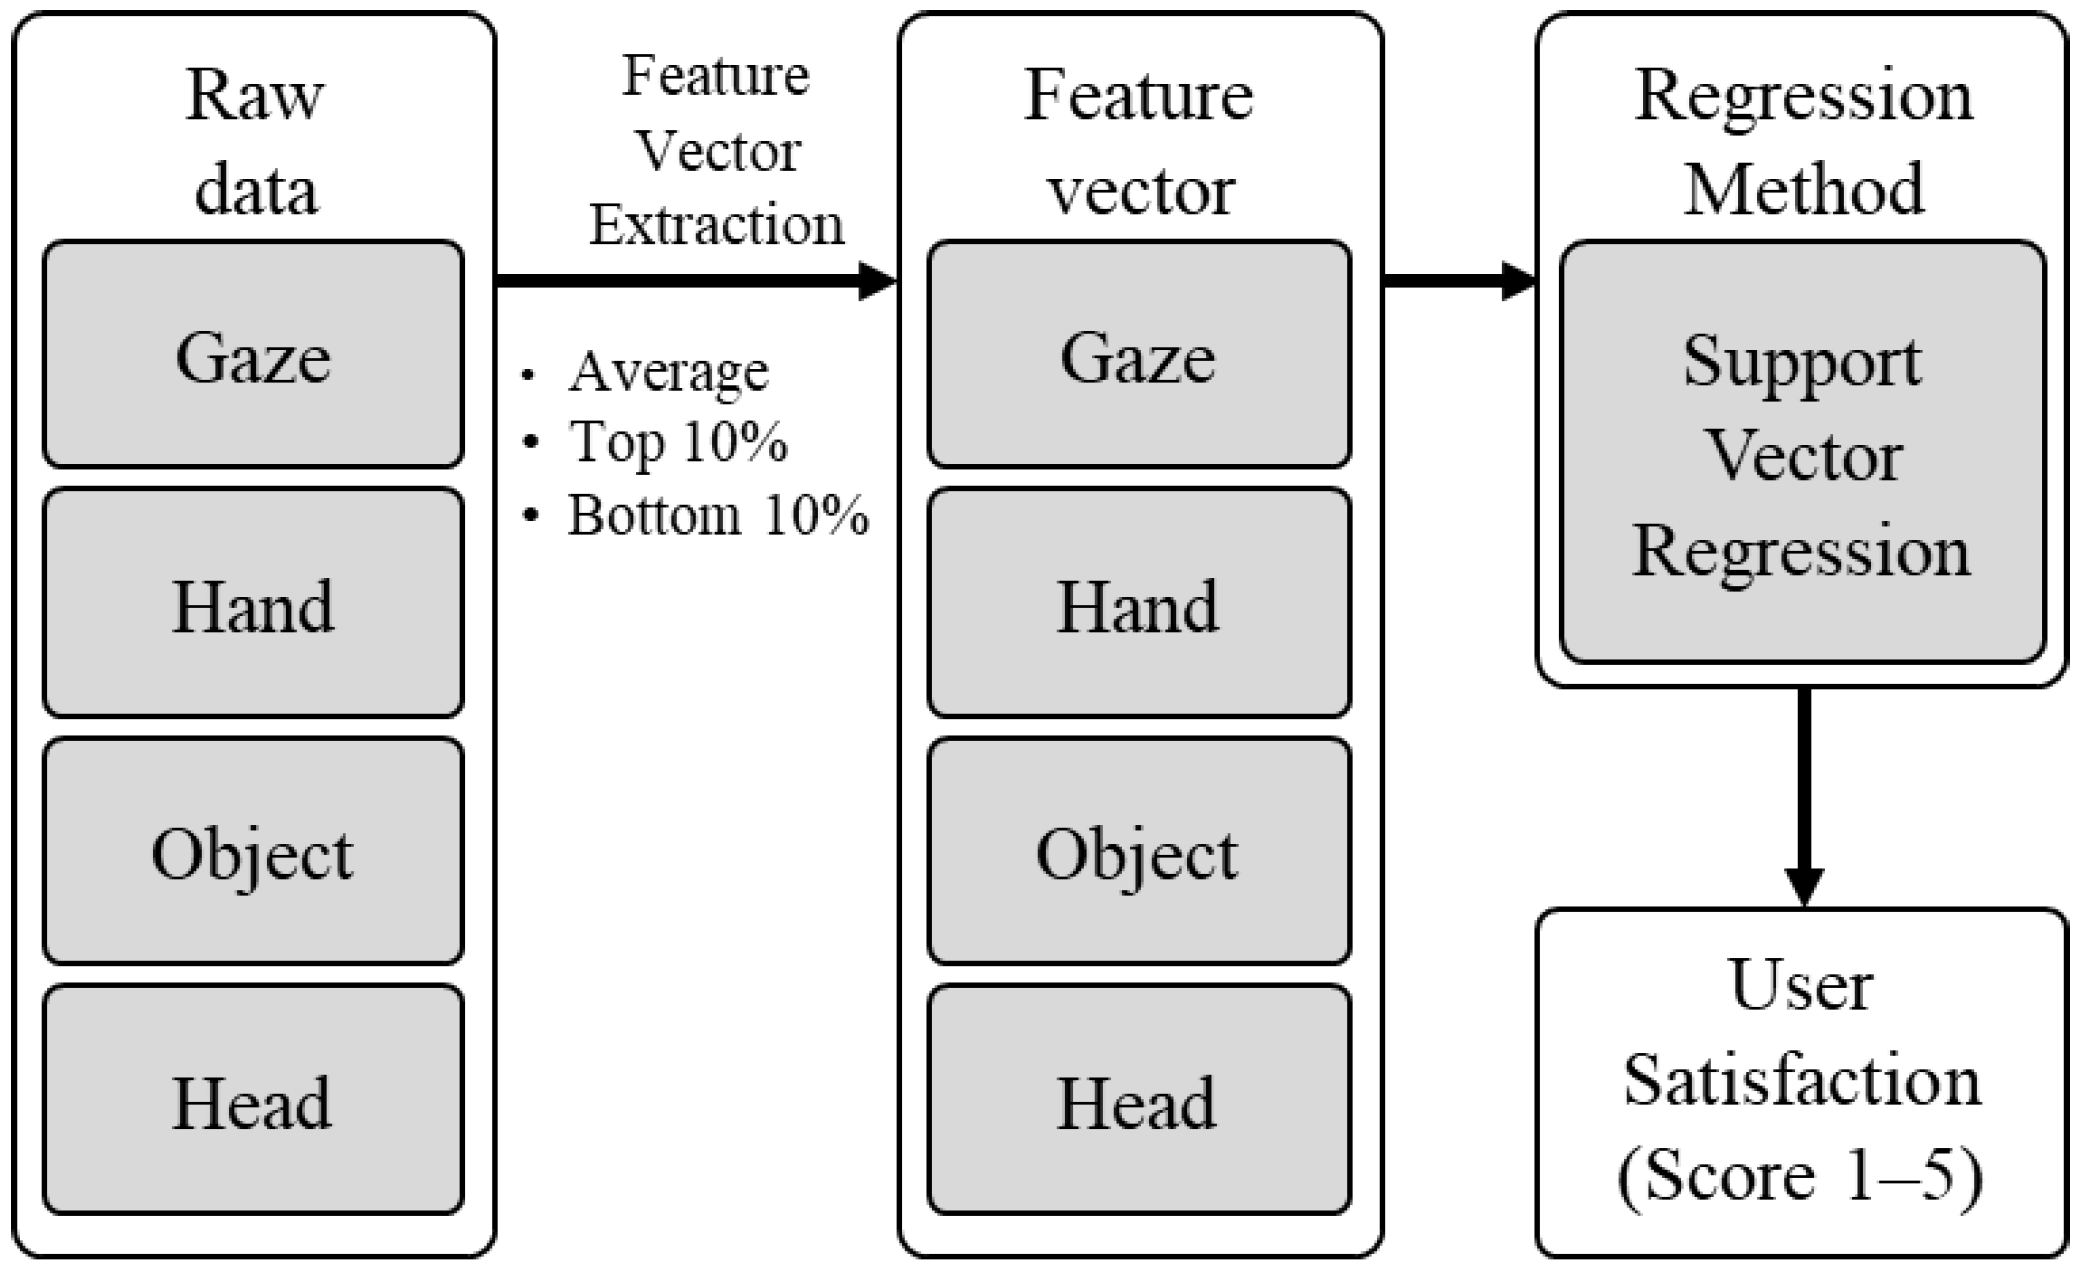
  • User-satisfaction prediction: feature vector is extracted from the obtained raw data, and user satisfaction is predicted form the extracted feature vector.
  • UI-position correction: predicted results are compared with threshold value, and UI position is corrected based on the comparison result.
  • Adaptive UI display: Adaptive UI is displayed to the user according to the result of UI-position-correction step. If the predicted user satisfaction is lower than the threshold value, UI position is corrected to improve user satisfaction. If the predicted user satisfaction is higher than the threshold value, UI position is not corrected.

4. Experimental Results and Discussion

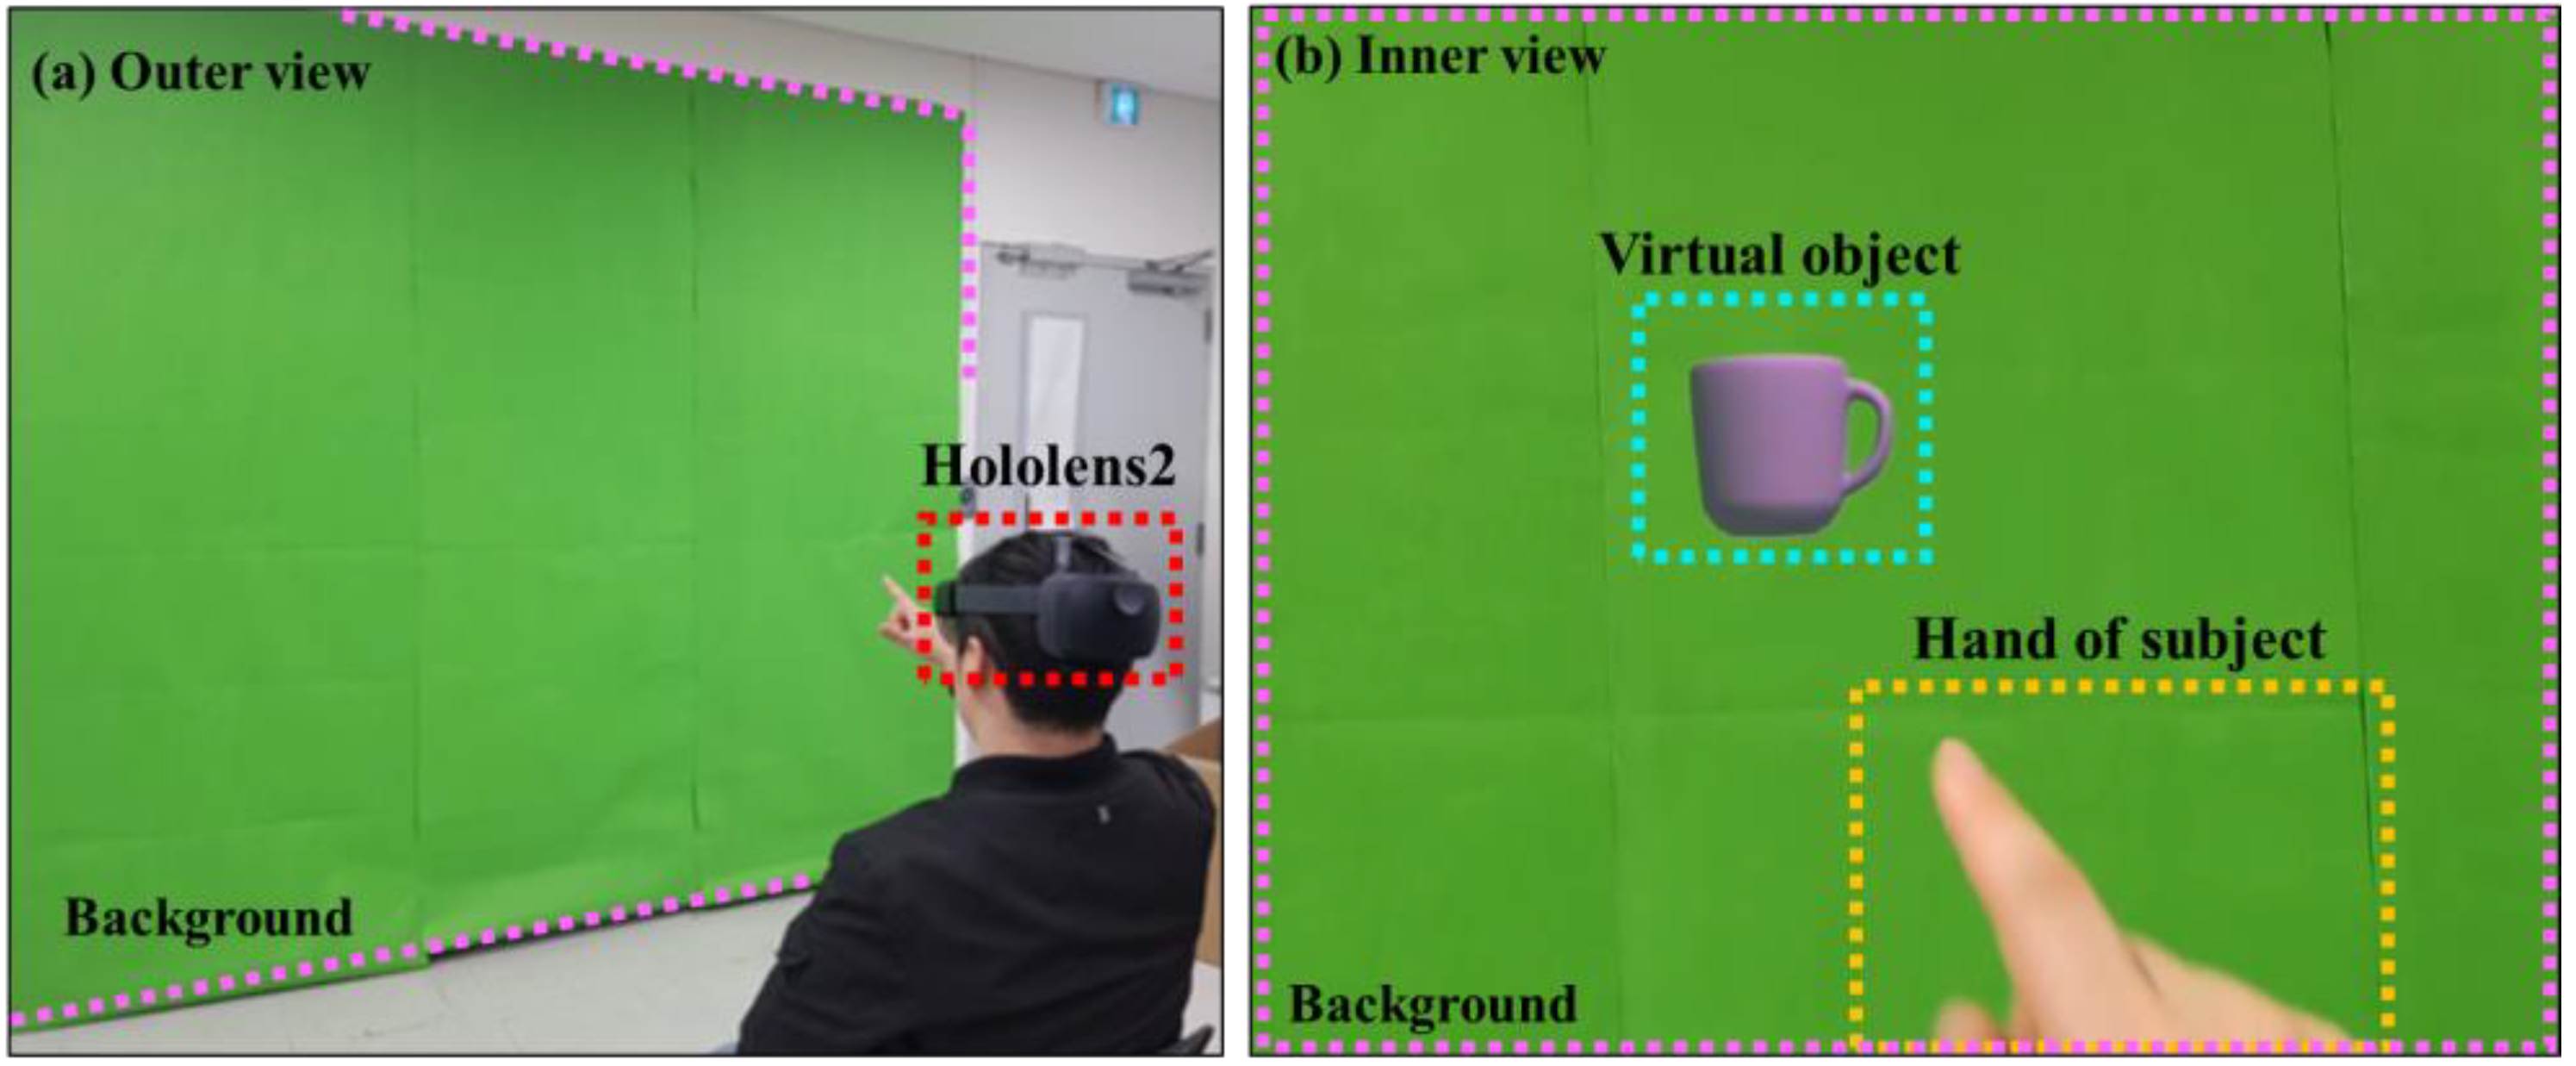
4.1. Common Experimental Environment and Methodology

In this paper, an experiment to develop the proposed method (described in Section 4.2) and an experiment to evaluate the proposed method (described in Section 4.3) were performed. In this section, we introduce the experimental environment and methodology that were commonly used in these two experiments.

4.1.1. Gesture Classification Using K-NN Algorithm

Both the experiment to develop the proposed method and the experiment to evaluate the proposed method were conducted using the implemented MR application. The implemented application was designed to perform selecting and moving interaction, which are performed most frequently in MR applications, and the experimental environment is shown in Figure 5.
The virtual-object-generation space was limited by the same method as in [27] to minimize the effect of differences in physical condition of each subject on the experimental results. That is, virtual objects (expressed as blue spheres in Figure 5) can only be generated in a virtual-object-generation space (black dashdotted line in Figure 5) set by a calculated length (green dashed line in Figure 5) based on the measured arm length of each subject (red double line in Figure 5). In addition, in order to prevent bias caused by the subject adapting to the experimental procedure, the virtual object was set to be randomly generated in one of the positions shown in Figure 6.
Figure 7 shows a snapshot of the experiment including a subject interacting in an MR environment. Subjects participated the experiment under the same posture (sitting) in the same location indoors while wearing Microsoft Hololens2 [28] as shown in Figure 7a, and the application was executed at 30 fps during the experimental procedure. Additionally, to prevent the experimental results from being spoiled by surrounding objects, a single-color (green) background was applied to the front of the experimental environment as shown in Figure 7 (pink dotted line in Figure 7).

4.1.2. Methodology

Subjects in their twenties to thirties were recruited [29] and all subjects were right-handed people for the consistency of the experiment. All subjects were sufficiently informed about the experiment in advance, such as the experimental procedure, the experimental environment, and the purpose of the experiment, and it was recommended to take a sufficient rest before the experiment. When the subjects arrived at the experimental location according to the experimental schedule, the experimental procedure was explained once again, and the experimental consent form and demographic questionnaires (including age, gender, contact information, etc.) were filled out by all subjects. After that, the subjects moved to the guided experimental space, measured arm length, and wore the Microsoft Hololens 2 [28] in a sitting position.
In the experiment, each subject was assigned tasks to select or to move a target virtual object generated in a random position as expressed in Figure 6. One task was composed of four interactions with virtual objects, and the number of tasks assigned to the subject was different depending on the purpose of the experiment. In addition, since the fixed experimental sequence may cause bias, the order of the selecting tasks and the moving tasks were randomly assigned. All of the research procedures described in Section 4.2 and Section 4.3 were conducted according to the guidelines of the Declaration of Helsinki, and before beginning research, approval by the Institutional Review Board of KOREATECH was obtained for all of the research procedures (approval on 26 May 2021).

4.2. Experiment for Implementation of Proposed Method

In this section, we describe the experiment to develop the proposed method. As discussed in Section 2.1, the following can be used as interaction information: gaze, hand, head, and object. In order to use this information for user-satisfaction prediction, it is required to confirm the correlation between each piece of information and user satisfaction. For confirmation of the correlation between interaction information and user satisfaction, 26 subjects in their twenties to thirties were recruited [29]. Of the recruited subjects, 17 were male, and 9 were female. In addition, 8 of the subjects had used MR devices more than 10 times, 11 of the subjects had used MR devices less than 10 times, and 7 of the subjects had no experience using MR devices at all.
In the experiment, six selecting tasks and six moving tasks were given to each subject, so that one subject performed a total of 48 interactions. During the experiment, the following information was measured: gaze information, hand information, head information, object information, task time, and user satisfaction.
  • Gaze information (3D point): composed to origin, direction, hit normal and hit position of gaze.
  • Hand information (3D point): composed to position and rotation of 25 keypoints of right hand.
  • Head information (3D point): composed to position and rotation of head.
  • Object information (3D point): composed to position and rotation of object.
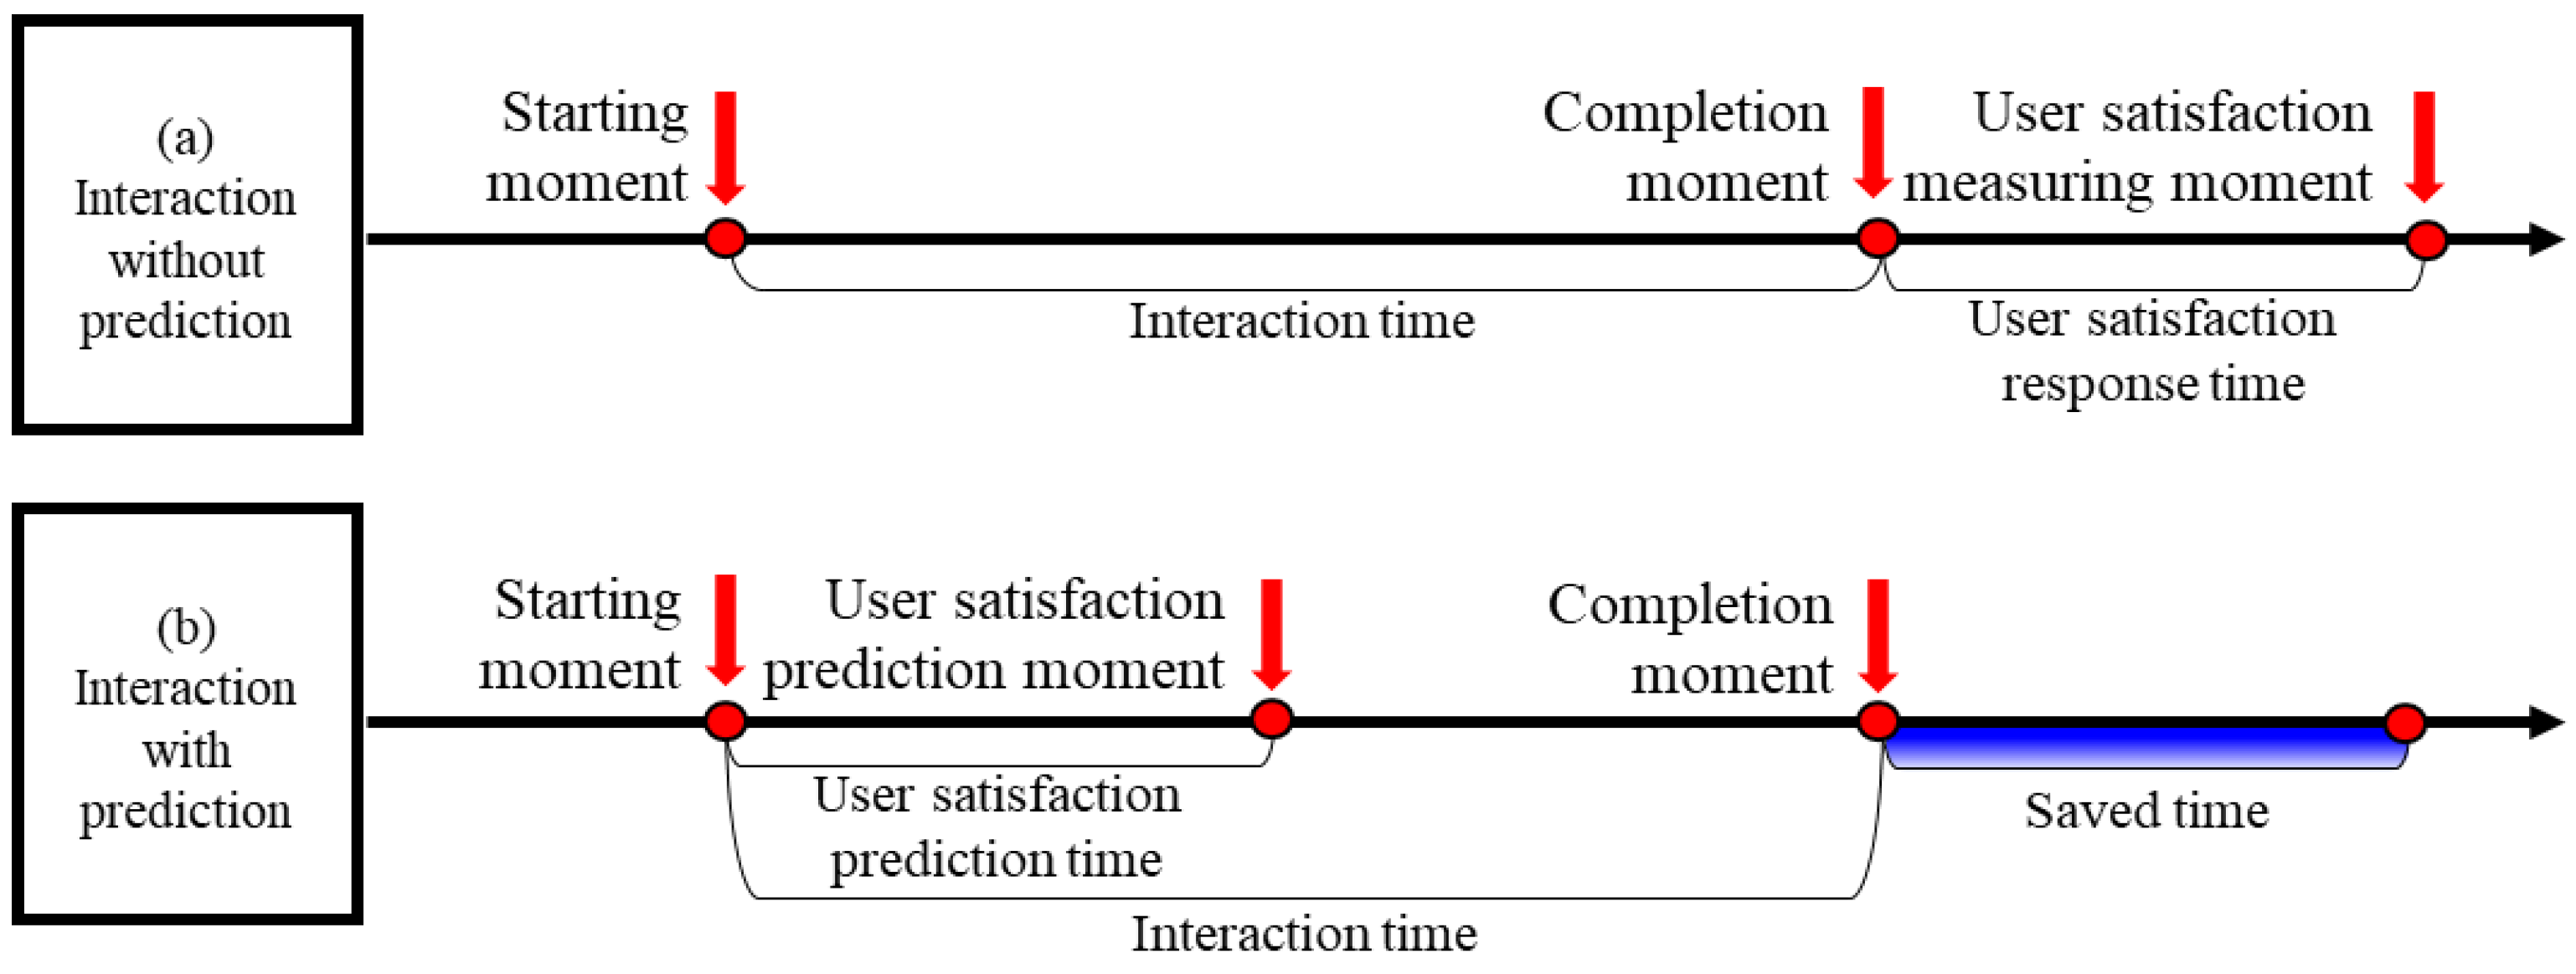
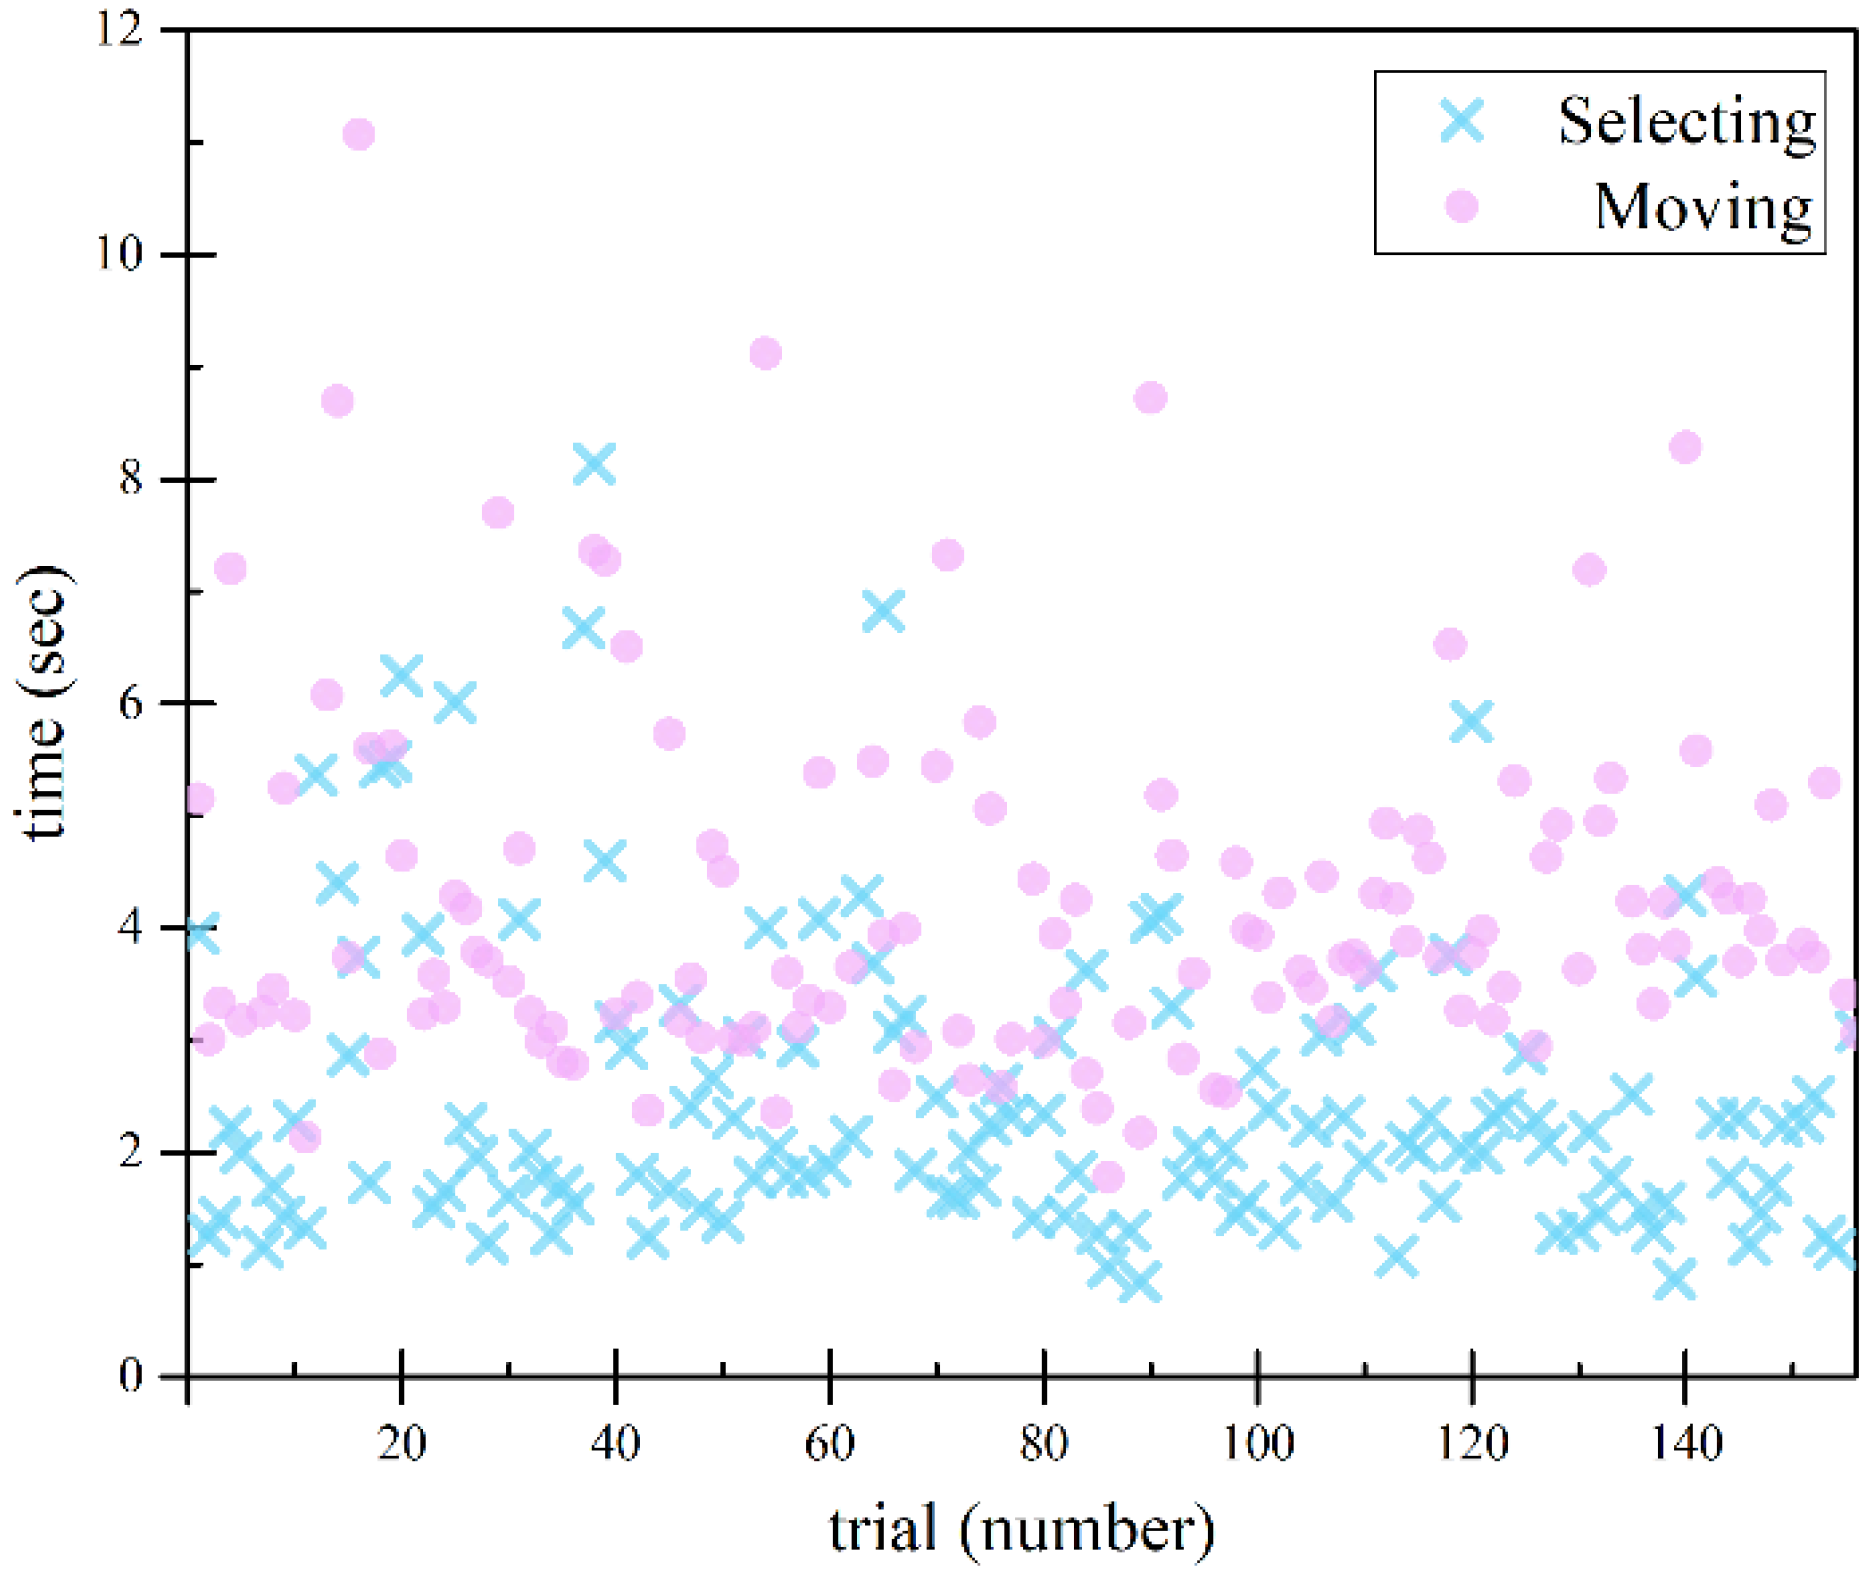
  • Time (sec): time between the moment when virtual object is generated and the moment when interaction is completed.
  • User satisfaction (Likert 5 scale): satisfaction scores rated by users for performing interactions.
Gaze, hand, head, object information and time were measured in real time during the experiment, and user satisfaction was directly input from the user. In order to analyze the correlation between the measured interaction information and the user satisfaction, it is required to convert the measured interaction information into a form comparable to the user satisfaction through the process shown in Figure 8.
At first, the feature vector was extracted by calculating the average, top 10%, and bottom 10% of the raw data, then the extracted feature vector was used as the input of the regression method. Then, as shown in Figure 8, support vector regression (SVR), which had been extended from support vector machine (SVM) to solve multivariate regression problems, was used as the regression model [30]. Because SVR is useful in solving regression problems with high-dimensional features, it has already been used in various fields such as time-series prediction [30,31,32], and recently, it was used as a method for predicting user satisfaction in various conventional studies [33,34,35]. For the implementation of the SVR model, the kernel function was set to linear and the cost was set to 1.0, and for the training of the implemented SVR model, the measured data were divided into the train set (80%) and test set (20%). Table 1 shows the results of analyzing the correlation between user satisfaction and the measured interaction information by using trained SVR.
From the correlation analysis, it was found that the highest Pearson correlation coefficient was achieved when all the interaction information was used. Therefore, all four elements of interaction information were used for implementing the proposed method. Results of Table 1 were obtained by using the data measured from the start of the interaction to the end of the interaction. To predict user satisfaction, it is necessary to use only the data measured at the initial range. To specify the initial range, the average interaction time measured during the experiment was analyzed as shown in Figure 9.
As a result of the analysis, the subjects consumed an average of 2.484 s for the selecting task and 4.267 s for the moving task on average. In order to successfully predict user satisfaction in as many tasks as possible, the initial range should be set so that the prediction can be performed correctly even when performing a shorter time-consuming selection task. The average consumption time of the selection task was 2.484 s, but the consumption time of the fastest selection task was 0.85 s, so the initial range was set to 10 frames and 20 frames, which is shorter than 0.85 s (25 frames at 30 fps). In order to evaluate prediction performance of SVR model using the set initial frame, the mean absolute error (MAE) expressed as Equation (1) was used.
MAE = 1 n i = 1 n P i A i
where, P i is i -th predicted user satisfaction; A i is i -th ground truth user satisfaction; n is the total number of predictions. Table 2 shows the results of user-satisfaction prediction using the initial frame, and the SVR model.
As a result of Table 2, it was confirmed that when the initial frame was set to 10 frames (MAE = 0.654), the prediction performance was improved than when the initial frame was set to 20 frames (MAE = 0.691).
To evaluate the suitability of this SVR model, the multi-layer perceptron (MLP) model was additionally designed [31,36]. Like SVR, MLP is being used to solve various problems in various fields, and recently, it was also used in research to predict satisfaction [35,37]. Data for the initial frames (10 frames and 20 frames) were input into the input layer of the MLP model as in the SVR model, and the predicted user satisfaction was outputted to the output layer. In addition, the hidden layer included two hidden layers composed of 32 neurons and one hidden layer composed of 8 neurons [38,39], and swish [40] was used as an activation function to prevent the vanishing-gradient problem from occurring. For the optimal MLP model, user-satisfaction prediction was performed by adjusting the epoch (1~30) and batch size (2, 4, 8, 16, 32), and the satisfaction prediction results of the top 3 models are shown in Table 3.
In Table 3, the MLP model with the best performance was set to use 10 frames and trained with 24 epochs and a batch size of 4, and the MAE of this model (MAE = 0.531) was reduced by 0.123 compared to the SVR model (MAE = 0.654). Therefore, in the proposed method, the MLP model, which was confirmed to have improved performance over the SVR model, was selected as the user-satisfaction-prediction method.
To provide an adaptive UI based on this user-satisfaction-prediction result, correction is performed based on object information among input information in the proposed method. Before the object-information-based correction, user satisfaction according to object information must be analyzed. For this, as shown in Figure 10, eight object-generation positions were classified into a total of six type, and the result of the user-satisfaction analysis based on this classification is shown in Figure 11.
As shown in Figure 11, in most cases, user satisfaction was improved when the object generated on the right side rather than the left side, the bottom side rather than the top side, and the front side rather than the back side, respectively. To confirm whether the difference is significant, the result of the Wilcoxon signed-rank test, which is a non-parametric test, is shown in Table 4.
As shown in Table 4, the significance level of the Wilcoxon signed-rank test was less than 0.05 in all combinations of left–right, top–bottom, and front–back. That is, it was confirmed that user satisfaction was improved when interacting with objects generated in the right, bottom, and front sides compared to the left, top, and back sides. Based on this, the proposed method corrects the object position in the left, bottom, and front directions when the predicted user satisfaction is lower than the threshold. Here, it is judged that the high preference for the right side compared to the left side is because only right-handed subjects were recruited. Since the subsequent experiment process (Section 4.3) was conducted by recruiting only right-handed subjects as before, this result was used as is. However, when targeting left-handed people in the future, it is necessary to reverse the left–right correction direction.

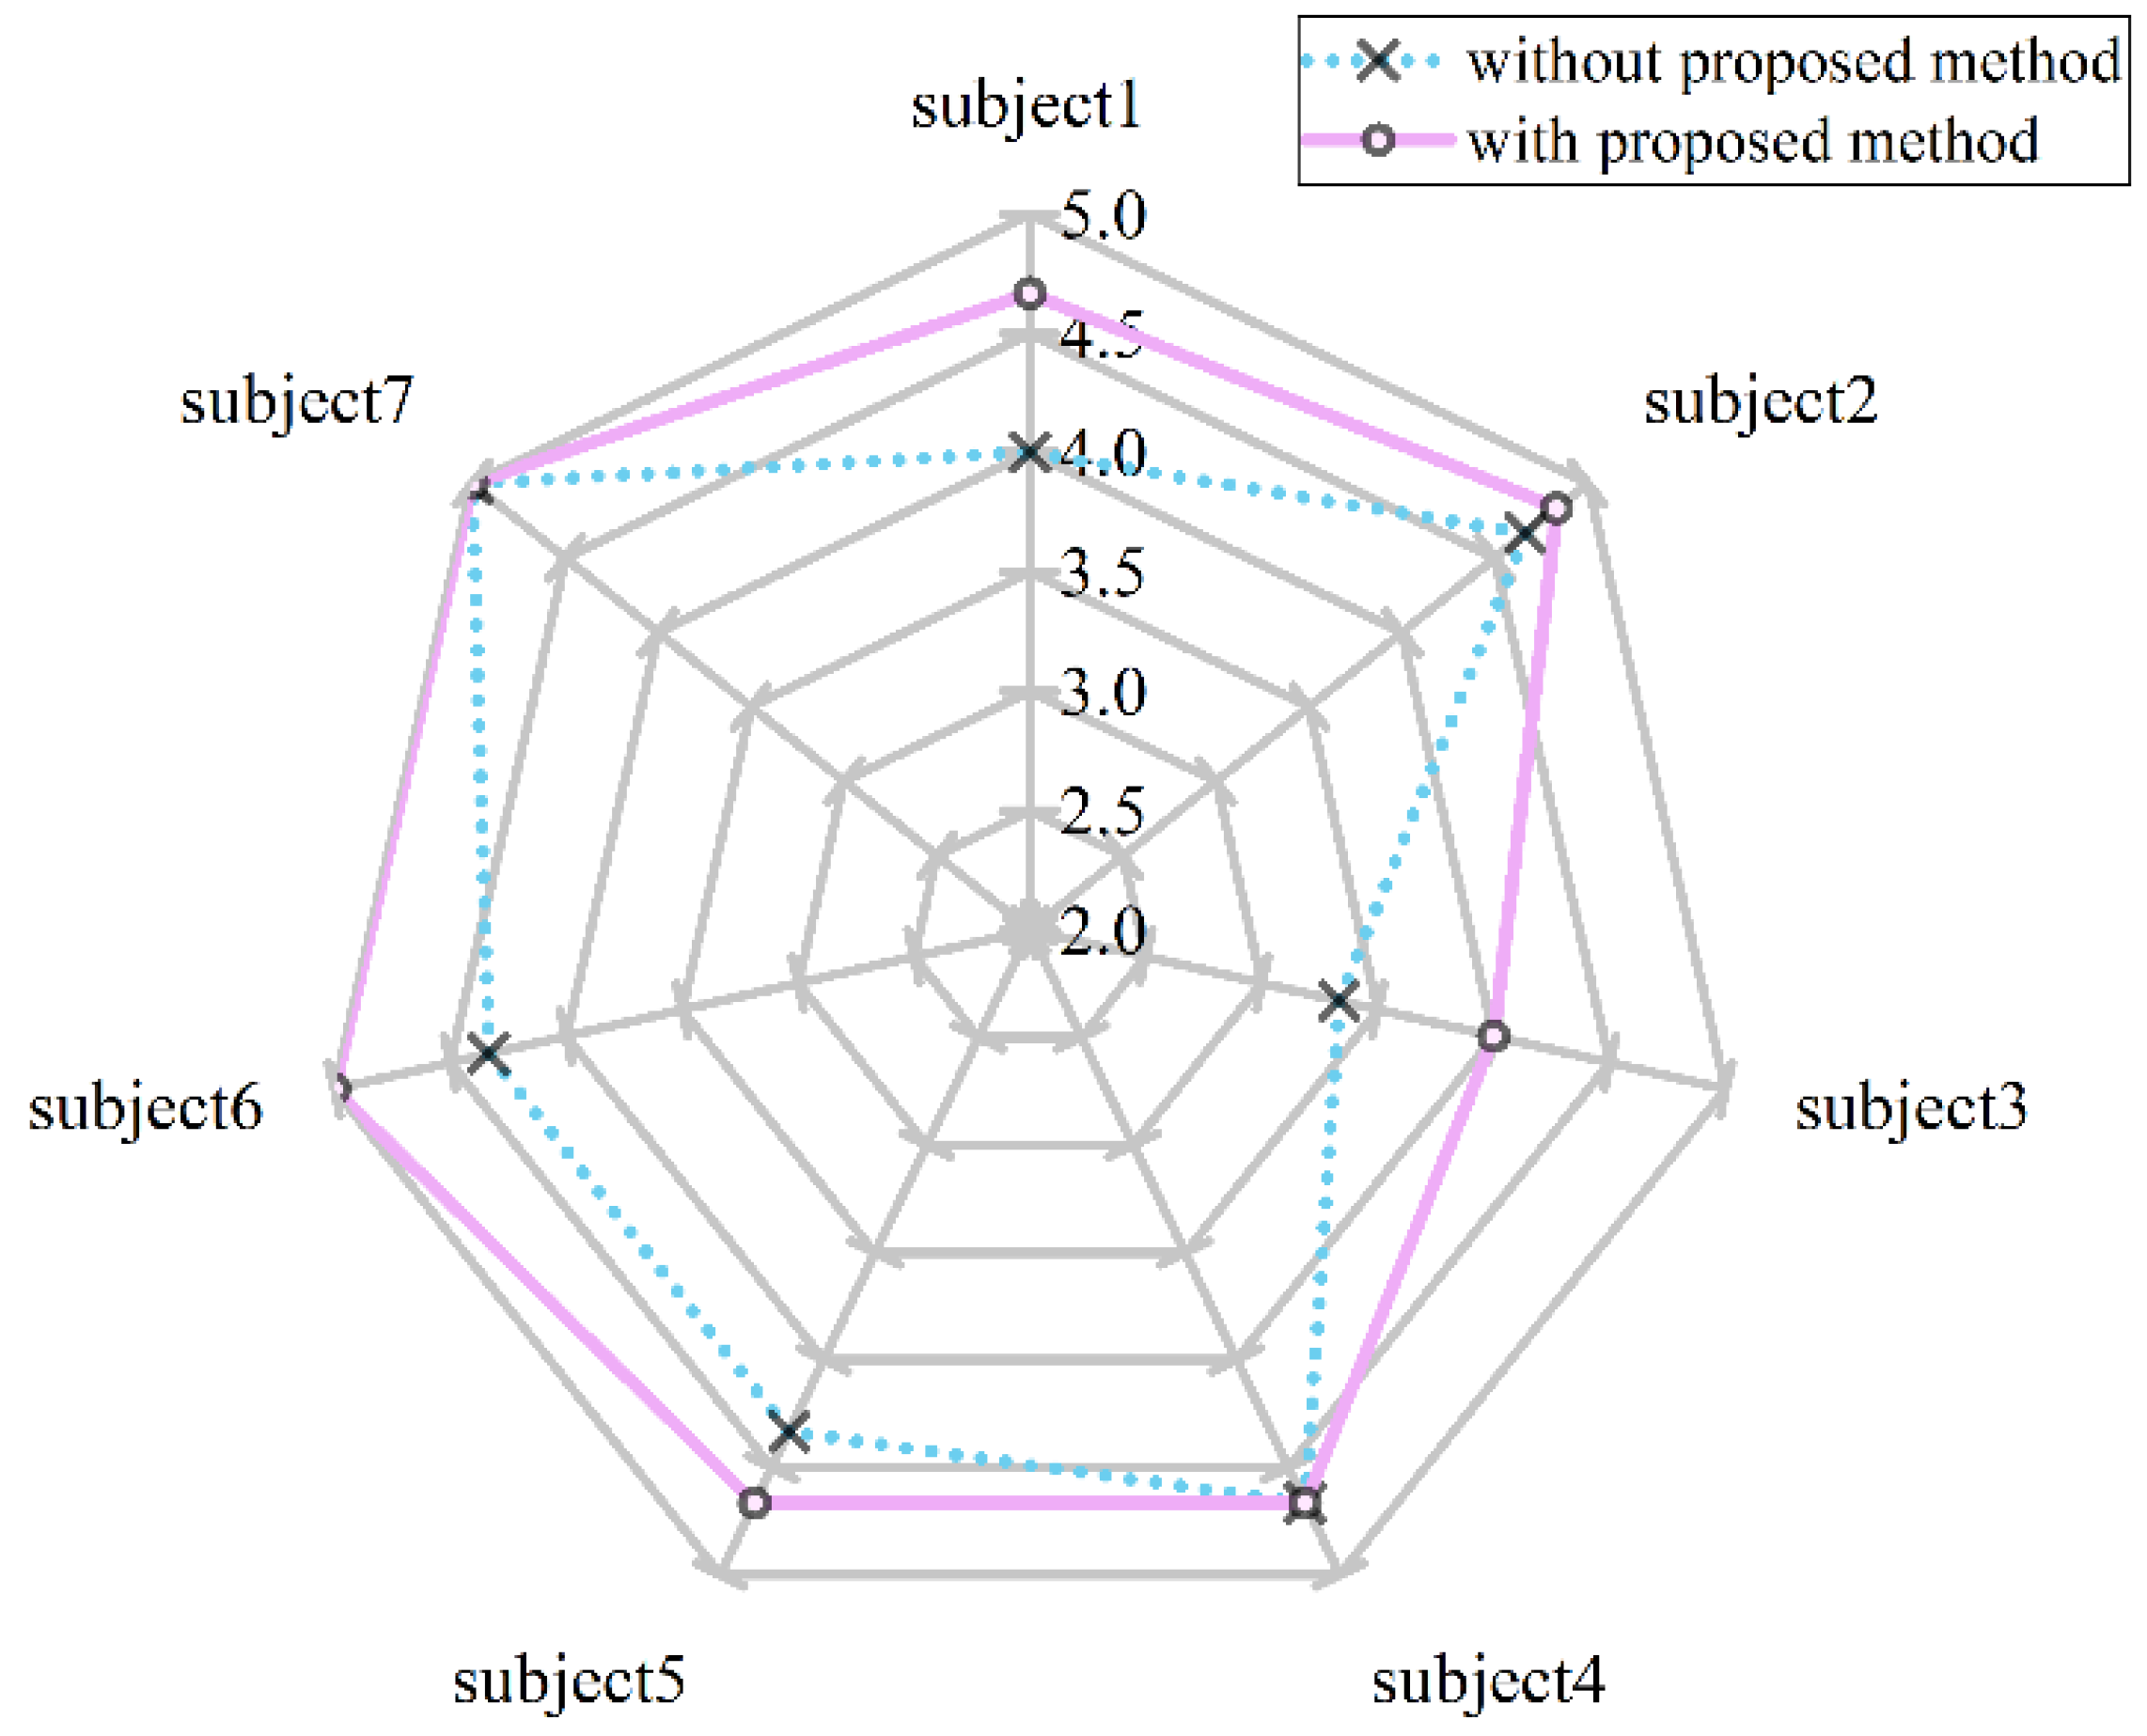
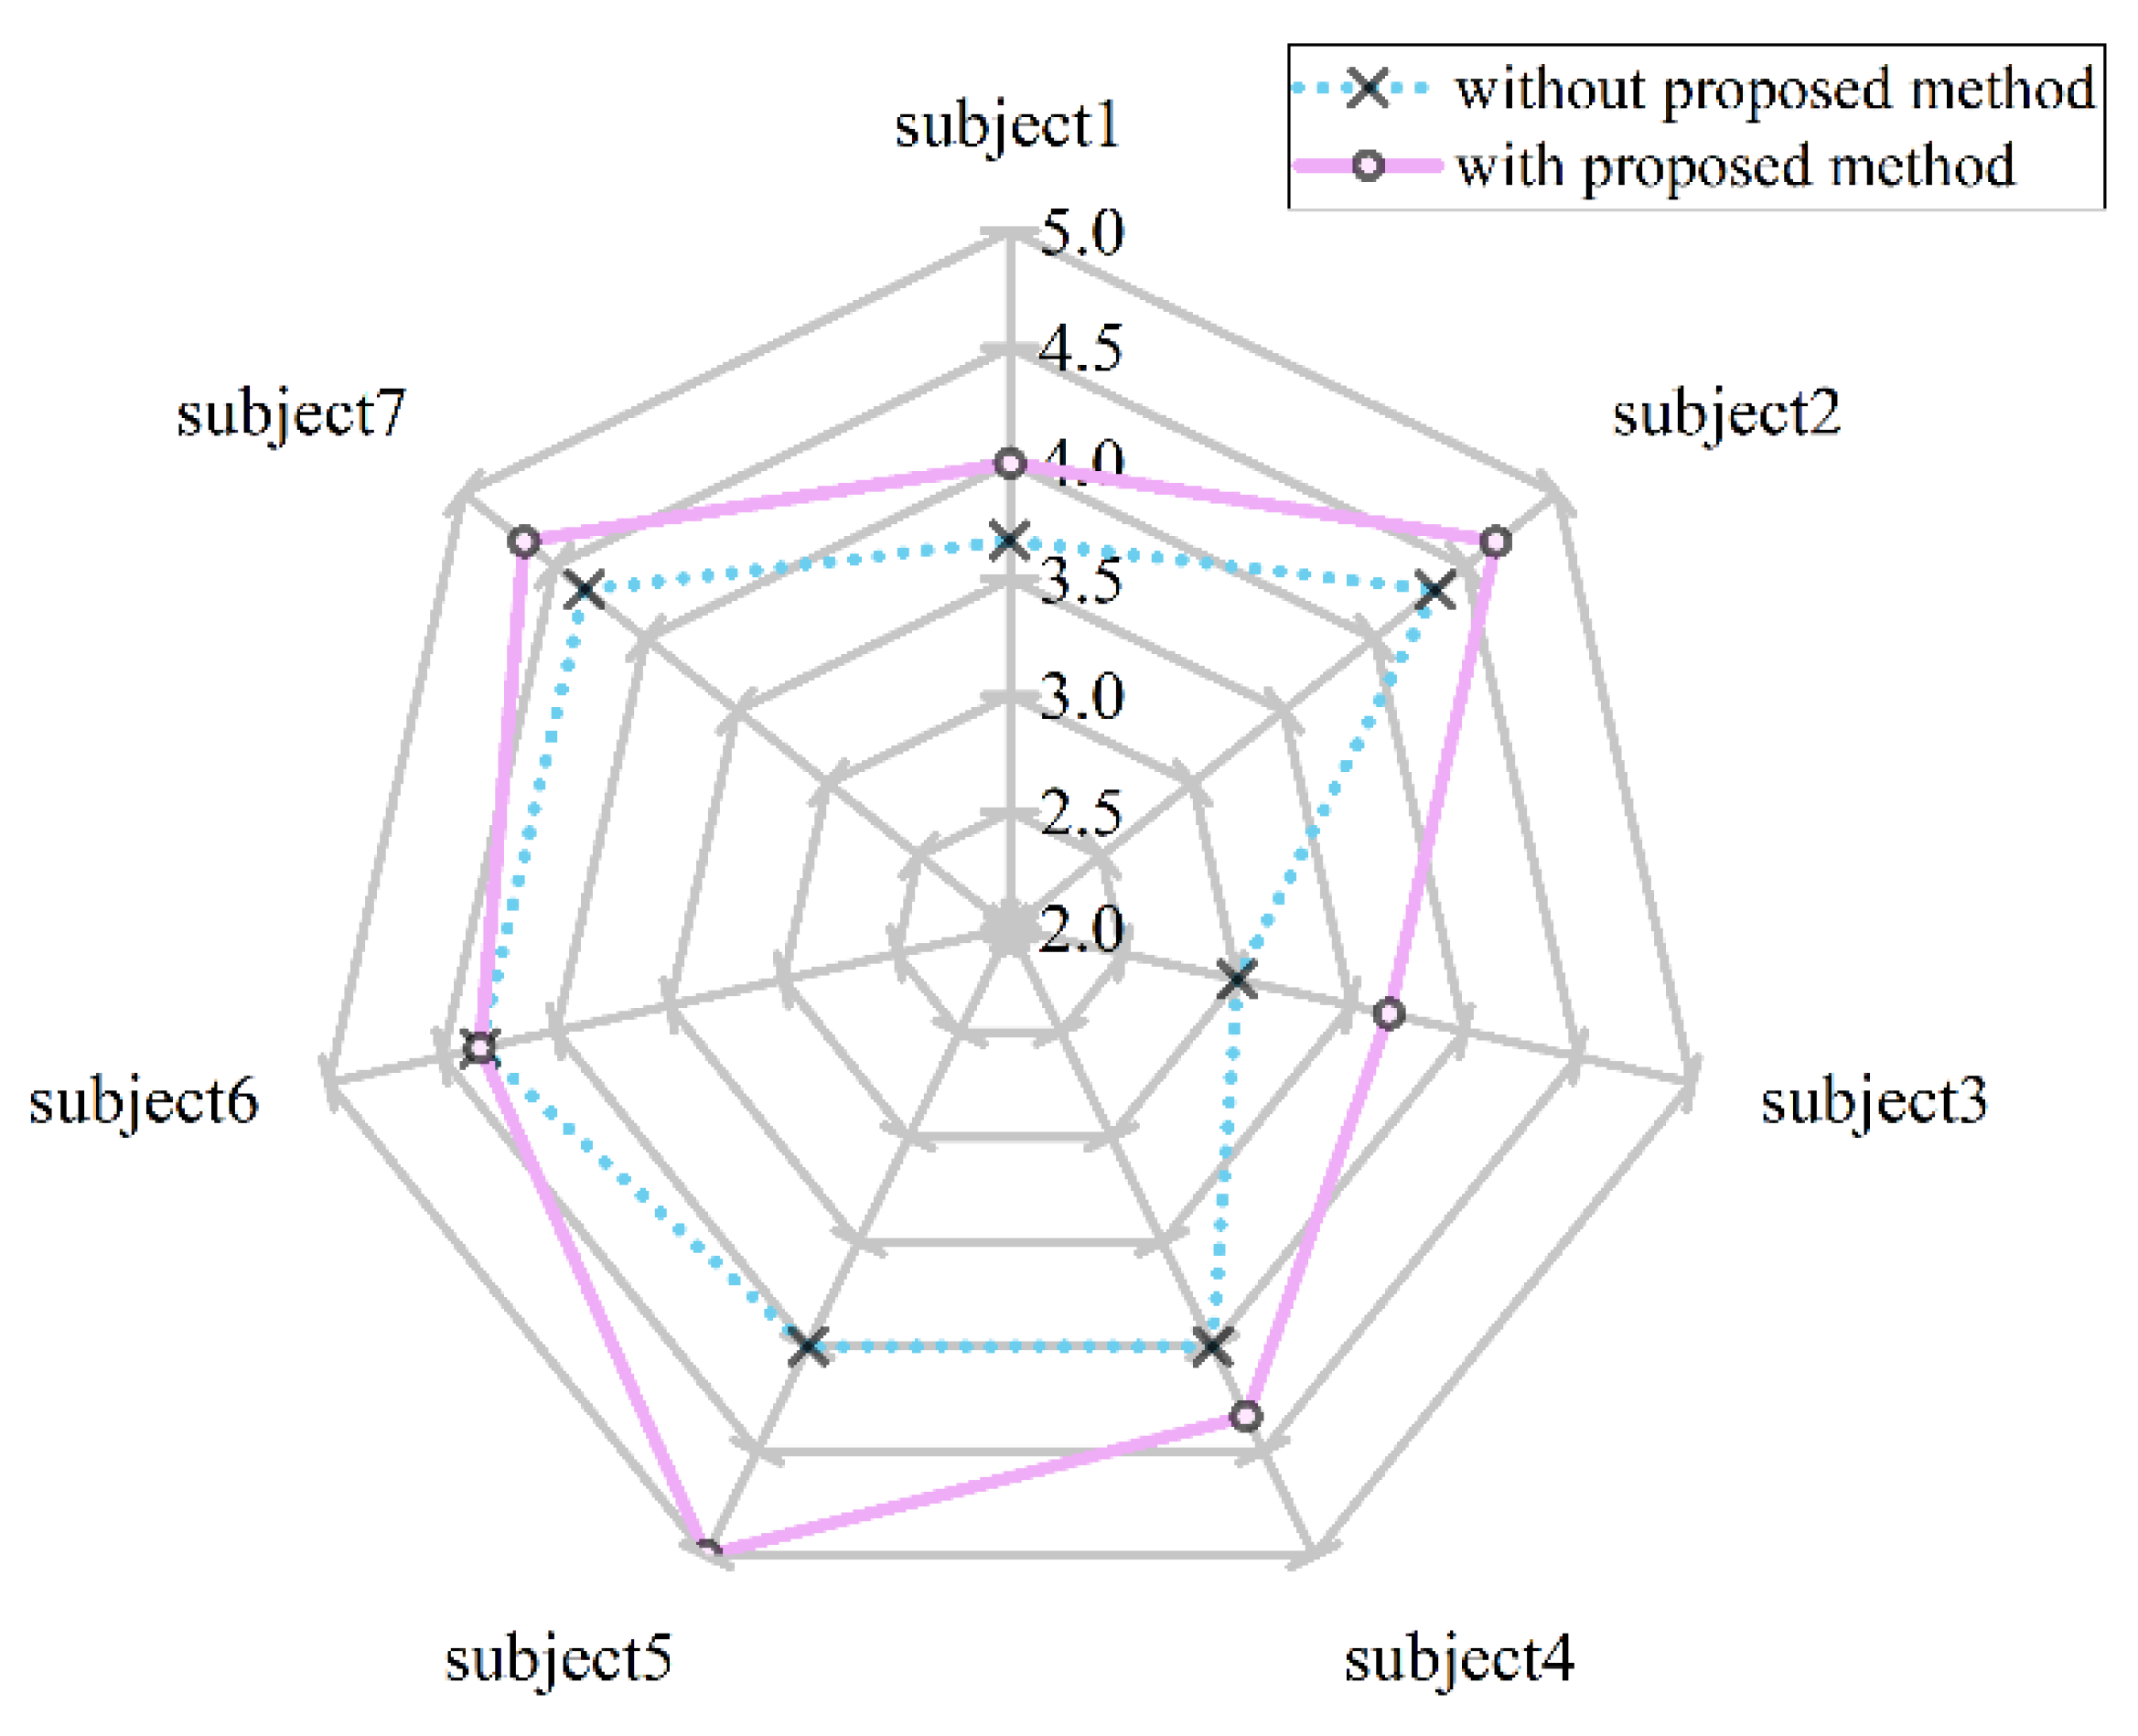
4.3. Experiment for Evaluation of Proposed Method

In this section, we describe the experiment to evaluate the proposed method. Figure 12 shows the procedure of applying the proposed adaptive UI based on the results of Section 4.2.
The black dashed arrow in Figure 12 is an example of a case without the proposed method, and the interaction information of the MR-application user is directly input to the UI-display part. On the other hand, blue arrow is an example of the proposed-method case, and MR-user-interaction information is input to the user-satisfaction-prediction part. In the user-satisfaction-prediction part, the input value is used for feature-vector extraction, and the MLP model predicts user satisfaction with the extracted feature vector as an input. The predicted user satisfaction is input to the UI-position-correction part and compared with the threshold. If the predicted user satisfaction is higher than the threshold, no correction is performed. Otherwise, the UI position is corrected in the UI-position-correction part, and the result is used as an input for the adaptive-UI-display part.
For comparison of the user satisfaction with and without the proposed method, seven subjects in their twenties to thirties were recruited [29]. Of the recruited subjects, six were male, and one was female. In addition, two of the subjects used MR devices more than ten times, four of the subjects used MR devices less than ten times, and one of the subjects had no experience of using MR devices at all. In the experiment, three selecting tasks and three moving tasks were given to each subject, with and without proposed method, respectively, so that one subject performed a total of 48 interactions. During the experiment, a user satisfaction (Likert 5 scale) input for interaction performance was requested from the subject. User satisfaction with and without the proposed method was measured as shown in Figure 13 and Figure 14.
From Figure 13 and Figure 14, it was confirmed that the average user-satisfaction scores improved in both selecting tasks and moving tasks when the proposed method was applied. In order to confirm whether the time difference was significant, the Wilcoxon signed-rank test was performed, which is a non-parametric test, and the result is shown in Table 5.
As shown in Table 5, the significance level of Wilcoxon sign rank test was less than 0.05 in both selecting and moving tasks. Based on this results, it was confirmed that user satisfaction is improved when applying proposed method compared to not applying proposed method (selecting: 4.333 to 4.714, moving: 3.952 to 4.381).

5. Conclusions and Future Works

In this paper, we proposed the adaptive UI based on user-satisfaction prediction in MR. The proposed method predicts user satisfaction based on interaction information, and provides adaptive UI based on the prediction results. In this paper, two experiments were performed for the proposed method: the experiment for the implementation of proposed method and the experiment for the evaluation of the proposed method. In the experiment for the implementation of the proposed method, SVR and MLP were used to predict user satisfaction based on interaction information. As a result of the experiment, it was confirmed that the prediction performance of MLP (MAE = 0.531) was higher than SVR (MAE = 0.654). In the experiment for evaluation of the proposed method, user satisfaction with and without proposed method was compared. As a result of the experiment, user satisfaction for selecting and moving tasks was increased by 8.793% and 10.725%, respectively, with the proposed method (selecting: 4.714, moving: 4.381) compared to without the proposed method (selecting: 4.333, moving: 3.952), and through this, it was confirmed that the proposed adaptive UI was effective in improving satisfaction. From the results, we expect that proposed adaptive UI based on user-satisfaction prediction to improve user satisfaction in MR environments. For example, it can contribute to higher user satisfaction when combined with scenarios such as in our previous study of predicting gestures. In addition, it can contribute to providing a real-time corrected UI based on each user’s satisfaction in applications with various target users, such as adults and children, without additional manipulation. In this study, we proposed an adaptive UI that corrects only one element (UI position), and in the future, we intend to extend our method which uses various correction elements including position, size, color, etc. Additionally, the study results were obtained from a small number of subjects. Thus, one of the future works may include extensions into a larger number of subjects.

Author Contributions

Conceptualization, Y.C. and Y.S.K.; methodology, Y.C. and Y.S.K.; software, Y.C.; validation, Y.C.; formal analysis, Y.C.; investigation, Y.S.K.; resources, Y.S.K.; data curation, Y.C.; writing—original draft preparation, Y.C. and Y.S.K.; writing—review and editing, Y.S.K.; visualization, Y.C.; supervision, Y.S.K.; project administration, Y.S.K.; funding acquisition, Y.S.K. All authors have read and agreed to the published version of the manuscript.

Funding

This research received no external funding.

Institutional Review Board Statement

The study was conducted according to the guidelines of the Declaration of Helsinki, and approved by the Institutional Review Board of KOREATECH (approval on 26 May 2021).

Informed Consent Statement

Informed consent was obtained from all subjects involved in the study.

Data Availability Statement

Not applicable.

Acknowledgments

This work was supported by Electronics and Telecommunications Research Institute(ETRI) grant funded by ICT R&D program of MSIT/IITP [2020-0-00537].

Conflicts of Interest

The authors declare no conflict of interest.

References

  1. García-Peñalvo, F.J.; Corell, A.; Abella-García, V.; Grande-de-Prado, M. Recommendations for mandatory online assessment in higher education during the COVID-19 pandemic. In Radical Solutions for Education in a Crisis Context; Burgos, D., Tlili, A., Tabacco, A., Eds.; Springer: Singapore, 2020; pp. 85–98. [Google Scholar]
  2. Wu, W.L.; Hsu, Y.; Yang, Q.F.; Chen, J.J. A Spherical Video-Based Immersive Virtual Reality Learning System to Support Landscape Architecture Students’ Learning Performance during the COVID-19 Era. Land 2021, 10, 561. [Google Scholar] [CrossRef]
  3. Azlan, C.A.; Wong, J.H.D.; Tan, L.K.; Huri, M.S.N.A.; Ung, N.M.; Pallath, V.; Tan, C.P.L.; Yeong, C.H.; Ng, K.H. Teaching and learning of postgraduate medical physics using Internet-based e-learning during the COVID-19 pandemic–A case study from Malaysia. Phys. Med. 2020, 80, 10–16. [Google Scholar] [CrossRef] [PubMed]
  4. Zoom. Available online: https://zoom.us (accessed on 12 March 2022).
  5. GoToMeeting. Available online: https://www.gotomeeting.com/ (accessed on 12 March 2022).
  6. Pidel, C.; Ackermann, P. Collaboration in virtual and augmented reality: A systematic overview. In Proceedings of the Augmented Reality, Virtual Reality, and Computer Graphics, Lecce, Italy, 7–10 September 2020; AVR 2020 Lecture Notes in Computer Science. Springer: Cham, Switzerland, 2020; Volume 12242, pp. 141–156. [Google Scholar]
  7. Rokhsaritalemi, S.; Sadeghi-Niaraki, A.; Choi, S.M. A review on mixed reality: Current trends, challenges and prospects. Appl. Sci. 2020, 10, 636. [Google Scholar] [CrossRef] [Green Version]
  8. Ejaz, A.; Ali, S.A.; Ejaz, M.Y.; Siddiqui, F.A. Graphic user interface design principles for designing augmented reality applications. Int. J. Adv. Comput. Sci. Appl. (IJACSA) 2019, 10, 209–216. [Google Scholar] [CrossRef] [Green Version]
  9. Kolekar, S.V.; Pai, R.M.; MM, M.P. Rule based adaptive user interface for adaptive E-learning system. Educ. Inf. Technol. 2019, 24, 613–641. [Google Scholar] [CrossRef]
  10. Machado, E.; Singh, D.; Cruciani, F.; Chen, L.; Hanke, S.; Salvago, F.; Kropf, J.; Holzinger, A. A conceptual framework for adaptive user interfaces for older adults. In Proceedings of the 2018 IEEE International Conference on Pervasive Computing and Communications Workshops (PerCom Workshops), Athens, Greece, 19–23 March 2018; IEEE: Piscataway, NJ, USA, 2018; pp. 782–787. [Google Scholar]
  11. Deuschel, T. On the Influence of Human Factors in Adaptive User Interface Design. In Proceedings of the 26th Conference on User Modeling, Adaptation and Personalization, Singapore, 8–11 July 2018; Association for Computing Machinery: New York, NY, USA, 2018; pp. 187–190. [Google Scholar]
  12. Lindlbauer, D.; Feit, A.M.; Hilliges, O. Context-aware online adaptation of mixed reality interfaces. In Proceedings of the 32nd Annual ACM Symposium on User Interface Software and Technology, New Orleans, LA, USA, 20–23 October 2019; Association for Computing Machinery: New York, NY, USA, 2019; pp. 147–160. [Google Scholar]
  13. Pfeuffer, K.; Abdrabou, Y.; Esteves, A.; Rivu, R.; Abdelrahman, Y.; Meitner, S.; Saadi, A.; Alt, F. ARtention: A design space for gaze-adaptive user interfaces in augmented reality. Comput. Graph. 2021, 95, 1–12. [Google Scholar] [CrossRef]
  14. Cheng, Y.; Yan, Y.; Yi, X.; Shi, Y.; Lindlbauer, D. SemanticAdapt: Optimization-based Adaptation of Mixed Reality Layouts Leveraging Virtual-Physical Semantic Connections. In Proceedings of the 34th Annual ACM Symposium on User Interface Software and Technology, Virtual Event, USA, 10–14 October 2021; Association for Computing Machinery: New York, NY, USA, 2021; pp. 282–297. [Google Scholar]
  15. Krings, S.; Yigitbas, E.; Jovanovikj, I.; Sauer, S.; Engels, G. Development framework for context-aware augmented reality applications. In Proceedings of the 12th ACM SIGCHI Symposium on Engineering Interactive Computing Systems, Sophia Antipolis, France, 23–26 June 2020; Association for Computing Machinery: New York, NY, USA, 2020; pp. 1–6. [Google Scholar]
  16. Bozgeyikli, E.; Bozgeyikli, L.L. Evaluating Object Manipulation Interaction Techniques in Mixed Reality: Tangible User Interfaces and Gesture. In Proceedings of the IEEE Virtual Reality and 3D User Interfaces (VR), Lisboa, Portugal, 27 March–1 April 2021; IEEE: Piscataway, NJ, USA, 2021; pp. 778–787. [Google Scholar]
  17. Xue, H.; Sharma, P.; Wild, F. User satisfaction in augmented reality-based training using microsoft HoloLens. Computers 2019, 8, 9. [Google Scholar] [CrossRef] [Green Version]
  18. Putze, F. Methods and tools for using BCI with augmented and virtual reality. In Brain Art; Nijholt, A., Ed.; Springer: Cham, Switzerland, 2019; pp. 433–446. [Google Scholar]
  19. Satti, F.A.; Hussain, J.; Bilal, H.S.M.; Khan, W.A.; Khattak, A.M.; Yeon, J.E.; Lee, S. Holistic User eXperience in Mobile Augmented Reality Using User eXperience Measurement Index. In Proceedings of the Conference on Next Generation Computing Applications (NextComp), Balaclava, Mauritius, 19–21 September 2019; IEEE: Piscataway, NJ, USA, 2019; pp. 1–6. [Google Scholar]
  20. Evangelidis, K.; Papadopoulos, T.; Sylaiou, S. Mixed Reality: A Reconsideration Based on Mixed Objects and Geospatial Modalities. Appl. Sci. 2021, 11, 2417. [Google Scholar] [CrossRef]
  21. Pamparău, C.; Vatavu, R.D. A Research Agenda Is Needed for Designing for the User Experience of Augmented and Mixed Reality: A Position Paper. In Proceedings of the 19th International Conference on Mobile and Ubiquitous Multimedia, Essen, Germany, 22–25 November 2020; Association for Computing Machinery: New York, NY, USA, 2020; pp. 323–325. [Google Scholar]
  22. Bai, H.; Sasikumar, P.; Yang, J.; Billinghurst, M. A user study on mixed reality remote collaboration with eye gaze and hand gesture sharing. In Proceedings of the 2020 CHI Conference on Human Factors in Computing Systems, Honolulu, HI, USA, 25–30 April 2020; Association for Computing Machinery: New York, NY, USA, 2020; pp. 1–13. [Google Scholar]
  23. Kytö, M.; Ens, B.; Piumsomboon, T.; Lee, G.A.; Billinghurst, M. Pinpointing: Precise head-and eye-based target selection for augmented reality. In Proceedings of the 2018 CHI Conference on Human Factors in Computing Systems, Montreal, QC, Canada, 21–26 April 2018; Association for Computing Machinery: New York, NY, USA, 2018; pp. 1–14. [Google Scholar]
  24. Blattgerste, J.; Renner, P.; Pfeiffer, T. Advantages of eye-gaze over head-gaze-based selection in virtual and augmented reality under varying field of views. In Proceedings of the Workshop on Communication by Gaze Interaction, Warsaw, Poland, 15 June 2018; Association for Computing Machinery: New York, NY, USA, 2018; pp. 1–9. [Google Scholar]
  25. Mo, G.B.; Dudley, J.J.; Kristensson, P.O. Gesture Knitter: A Hand Gesture Design Tool for Head-Mounted Mixed Reality Applications. In Proceedings of the 2021 CHI Conference on Human Factors in Computing Systems, Yokohama, Japan, 8–13 May 2021; Association for Computing Machinery: New York, NY, USA, 2021; pp. 1–13. [Google Scholar]
  26. Samini, A.; Palmerius, K.L. Popular performance metrics for evaluation of interaction in virtual and augmented reality. In Proceedings of the International Conference on Cyberworlds (CW), Chester, UK, 20–22 September 2017; IEEE: Piscataway, NJ, USA, 2017; pp. 206–209. [Google Scholar]
  27. Choi, Y.; Son, W.; Kim, Y.S. A Study on Interaction Prediction for Reducing Interaction Latency in Remote Mixed Reality Collaboration. Appl. Sci. 2021, 11, 10693. [Google Scholar] [CrossRef]
  28. Microsoft HoloLens2. Available online: https://www.microsoft.com/en-us/hololens/hardware (accessed on 12 March 2022).
  29. Dey, A.; Billinghurst, M.; Lindeman, R.W.; Swan, J. A systematic review of 10 years of augmented reality usability studies: 2005 to 2014. Front. Robot. AI 2018, 5, 37. [Google Scholar] [CrossRef] [PubMed] [Green Version]
  30. Awad, M.; Khanna, R. Support vector regression. In Efficient Learning Machines; Apress: Berkeley, CA, USA, 2015; pp. 67–80. [Google Scholar]
  31. Ahmed, N.K.; Atiya, A.F.; Gayar, N.E.; El-Shishiny, H. An Empirical Comparison of Machine Learning Models for Time Series Forecasting. Econom. Rev. 2010, 29, 594–621. [Google Scholar] [CrossRef]
  32. Maity, R.; Bhagwat, P.P.; Bhatnagar, A. Potential of support vector regression for prediction of monthly streamflow using endogenous property. Hydrol. Processes Int. J. 2010, 24, 917–923. [Google Scholar] [CrossRef]
  33. Fan, C.; Zhang, Y.; Hamzaoui, R.; Ziou, D.; Jiang, Q. Satisfied user ratio prediction with support vector regression for compressed stereo images. In Proceedings of the IEEE International Conference on Multimedia & Expo Workshops (ICMEW), London, UK, 6–10 July 2020; IEEE: Piscataway, NJ, USA, 2020; pp. 1–6. [Google Scholar]
  34. Yang, C.C.; Shieh, M.D. A support vector regression based prediction model of affective responses for product form design. Comput. Ind. Eng. 2010, 59, 682–689. [Google Scholar] [CrossRef]
  35. Ho, I.M.K.; Cheong, K.Y.; Weldon, A. Predicting student satisfaction of emergency remote learning in higher education during COVID-19 using machine learning techniques. PLoS ONE 2021, 16, e0249423. [Google Scholar] [CrossRef] [PubMed]
  36. Ramchoun, H.; Amine, M.; Idrissi, J.; Ghanou, Y.; Ettaouil, M. Multilayer Perceptron: Architecture Optimization and Training. Int. J. Interact. Multimed. Artif. Intell. 2016, 4, 26–30. [Google Scholar] [CrossRef]
  37. Koonsanit, K.; Nishiuchi, N. Predicting Final User Satisfaction Using Momentary UX Data and Machine Learning Techniques. J. Theor. Appl. Electron. Commer. Res. 2021, 16, 3136–3156. [Google Scholar] [CrossRef]
  38. Arifin, F.; Robbani, H.; Annisa, T.; Ma’Arof, N.N.M.I. Variations in the number of layers and the number of neurons in artificial neural networks: Case study of pattern recognition. In Proceedings of the International Conference on Electrical, Electronic, Informatic and Vocational Education, Yogyakarta, Indonesia, 14 September 2019; IOP Publishing: Bristol, UK, 2019; p. 012016. [Google Scholar]
  39. Uzair, M.; Jamil, N. Effects of hidden layers on the efficiency of neural networks. In Proceedings of the IEEE 23rd International Multitopic Conference (INMIC), Bahawalpur, Pakistan, 5–7 November 2020; IEEE: Piscataway, NJ, USA, 2020; pp. 1–6. [Google Scholar]
  40. Ramachandran, P.; Zoph, B.; Le, Q.V. Searching for activation functions. arXiv 2017, arXiv:1710.05941. [Google Scholar]
Figure 1. Examples of UI in MR environment.
Applsci 12 04559 g001
Figure 2. Example of saved time when applying prediction: (a) interaction without prediction, (b) interaction with prediction.
Applsci 12 04559 g002
Figure 3. Interaction information used as input for predicting user satisfaction.
Applsci 12 04559 g003
Figure 4. Procedure to provide adaptive UI by the proposed method.
Applsci 12 04559 g004
Figure 5. Experimental environment.
Applsci 12 04559 g005
Figure 6. Various position examples where virtual objects were generated (8 cases): (a) left-top-front; (b) left-top-back; (c) left-bottom-front; (d) left-bottom-back; (e) right-top-front; (f) right-top-back; (g) right-bottom-front; (h) right-bottom-back.
Applsci 12 04559 g006
Figure 7. Subject’s two views of subject in MR experiment: outer view and inner view through Hololens2: (a) outer view, (b) inner view.
Applsci 12 04559 g007
Figure 8. Process of converting interaction information to user satisfaction using SVR.
Applsci 12 04559 g008
Figure 9. Interaction time measured during experiment.
Applsci 12 04559 g009
Figure 10. Classification of positions where virtual objects are generated (six types): (a) left side; (b) top side; (c) front side; (d) right side; (e) bottom side; (f) back side.
Applsci 12 04559 g010
Figure 11. Average user satisfaction obtained from six types of positions (virtual object-generation positions).
Applsci 12 04559 g011
Figure 12. Procedure applying the proposed adaptive UI.
Applsci 12 04559 g012
Figure 13. Average user satisfactions with and without proposed method: selecting tasks.
Applsci 12 04559 g013
Figure 14. Average user satisfactions with and without proposed method: moving tasks.
Applsci 12 04559 g014
Table 1. Correlation between each measured interaction-information combination and user satisfaction.
No.GazeHeadHandObjectPearson
1 0.33
2 0.46
3 0.23
4 0.05
5 0.51
6 0.11
7 0.23
8 0.54
9 0.45
10 0.21
11 0.55
12 0.53
13 0.21
14 0.43
150.58
Table 2. Results of user-satisfaction prediction of SVR model using initial frame.
Initial FrameMAE
10 frames0.654
20 frames0.691
Table 3. Top three results of user-satisfaction prediction of MLP model using initial frame.
Initial FrameParameterMAE
EpochBatch
10 frames2440.531
28160.538
1740.538
20 frames2220.540
2980.543
1740.549
Table 4. Results of Wilcoxon signed-rank test of user satisfaction based on object position.
User Satisfaction
Left-Right
User Satisfaction
Top-Bottom
User Satisfaction
Front-Back
Z−2.496 1−1.999 1−2.952 2
Asymp. Sig. (2-tailed)0.0130.0460.003
1 Based on positive ranks. 2 Based on negative ranks.
Table 5. Results of Wilcoxon signed-rank test of user satisfaction based on tasks.
Selecting
With 1-Without 2
Moving
With 1-Without 2
Z−2.111 3−2.714 3
Asymp. Sig. (2-tailed)0.0350.007
1 With proposed method. 2 Without proposed method. 3 Based on negative ranks.
Publisher’s Note: MDPI stays neutral with regard to jurisdictional claims in published maps and institutional affiliations.

