Abstract
The presented article provides a comprehensive study on the stability analysis of earth-fill dams under rapid drawdown and transient flow conditions used to prepare stability analysis charts by conducting coupled finite-element numerical and analytical limit equilibrium procedures. In this regard, the impacts of different rapid drawdown conditions on the safety factor of the Alavian earth-fill dam are determined. The slope stability charts present for both shallow and deep slip surfaces with various permeabilities are verified by ground information obtained with extensive instrumentation on the dam’s site. The results showed that by decreasing the permeability of the core’s material, despite preventing seepage, the instability risk of the upstream slope as a result of rapid drawdown intensifies. Also, as stability charts can be stated, with increasing the slip surface’s depth and decreasing the hydraulic hydration, the reliability decreases, and the sliding surfaces’ sensitivity increases based on the drawdown rates, which have been revealed to be from 0.2 to 0.6, the most critical state for safety factors, showing significant declines.
1. Introduction
The dam engineering application of different circumstances in the design stages is an important subject to provide a safe and proper construction that leads to stable geotechnical structures against environmental changes that will last a long time [1,2]. The evaluation of the safety parameters of dams in a given design involves intensive computation and consideration of various uncertainties in the dam’s site [3,4]. One of the most sensitive acts in the earth-fill dam, which is associated with many uncertainties and leads to different behaviors in the dam body, is the stability condition of the dam’s slopes, which tend to slide under various hydraulic gradient changes, steady-state seepage, rapid fill, or rapid drawdown [5]. In these cases, providing safety interactions is very effective in preventing the slope instability’s occurrence [6]. The rapid drawdown in earth-fill dams is considered one of the main causes of slope failure in dam bodies [7,8] and a lack of attention to this matter eventually ends in dam failure [9]. Rapid drawdown in earthen dams demonstrates that the external water level drops so fast that impermeable soils within the earthen dam’s slopes do not have sufficient time to drain. The variation in the water level in a dam’s reservoir provides the different hydrostatic pressures that force the dam to undergo damage or failure when the seepage occurrence exceeds the limits [10]. These rapid rises and falls in the upstream water level lead to a significant seepage pressure in the dam body, which reduces the downstream slope’s stability status [11]. In rapid drawdown, the critical condition for stability occurs on the upstream slope where saturated conditions prevail. Thus, the pore pressure will decrease immediately by an amount equal to the decrease in confining stress (∆σ3) and will also increase or decrease in response to the deviation stress (∆σ1 − ∆σ3) changes. This issue leads to dire safety conditions on the dam’s downstream slope.
Sherard and Woodward [12] describe several upstream slope failures attributed to rapid drawdown conditions applied on 12 earth-fill dams based on field surveys and instrumentations. Interestingly, in most of the reported failures, the drawdown did not reach the maximum water depth but approximately half of it (from maximum-reservoir elevation to approximately mid-dam level). According to the obtained results, the main failure in dam slopes occurred during drawdown between a 10 and 15 cm/day discharge from the reservoir. The researchers showed that even a discharge speed of 10 cm/day can be considered a rapid drawdown in earth-fill dams and can cause failures in the upstream slope. Moregenstern [13] provided stability charts that show the variations in the safety factor with the drawdown level for simple homogeneous slopes. As the reservoir level is lowered, the safety factor decreases provided that no dissipation of the pore pressure occurs during drawdown. Stability charts were presented to facilitate the computation of the safety factor of earth slopes during rapid drawdown. He stated that during the drawdown, two things occurred: (i) the drawdown creates new boundary conditions for the water flow inside the slope and causes the unstable flow, and (ii) the stress variations due to the rapid drawdown create pore pressure. Lane and Griffiths [14], contrary to earlier researchers who all used limit equilibrium methods (LEM) for estimations of the safety factor of the slope under a range of conditions to produce a series of charts for practicing engineers to utilize, used the finite element method (FEM) to analyze a simple 2:1 slope under different submergence and different drawdown ratios to produce operating charts for such circumstances that should apply to real structures. These researchers then provided a static stability analysis of the dam slopes under a steady-state condition with both slow and rapid drawdowns. The results of the analysis showed that in the early stages of discharge (L/H < 0.7) the effect of the embankment’s weight is greater than the friction, thus reducing the F.S. But, at high discharge levels (L/H ≥ 0.7), increasing the frictional resistance has a greater effect than increasing the weight, thus increasing the F.S. Therefore, it can be concluded that the dam slope is stable in a dry state or if there is a full reservoir. It will be unstable in a critical condition of drawdown (discharge rate typically 70%). The F.Smin obtained for the slope depends on the strength of the materials at different levels of water in the reservoir. Chahar [15] mentioned that the earthen dam can be modified versus the downstream slope failures by considering the seepage reduction in the dam mass by supplying a horizontal drainage blanket at the slope’s toe. The author provided graphical solutions to estimate the downstream horizontal drain and stability for homogeneous earth-fill dams. Berilgen [16] presented numerical procedures to evaluate the drawdown ratio, permeability status, transient deformation, seepage analyses, and different loading conditions. In this regard, Berilgen considered three different discharge modes including slow, fast, and mixed drawdowns which were applied on two 3:1 slopes with two different NWL and two different discharge speeds (R = 0.1 and 1.0 m/day). The results were used to develop the displacement contours for different drawdown ratios and permeability coefficients. Hussain et al. [17] provided optimized approaches for homogeneous earth-fill dams with impervious foundations and drains. The optimization was performed with the aim of maintaining safe slopes upstream and downstream and a relevant distance between the normal water levels on both dams’ sides. Pinyol et al. [18] utilized numerical modeling to investigate the rapid drawdown conditions on submerged slopes with changing water levels on the slope upstream.
Zomorodian and Abodollahzadeh [19] applied the FEM and LEM to estimate the horizontal drain effects on the upstream slopes of earthen dams to provide a safe status during rapid drawdown. The authors used the GeoStudio package to prepare a comprehensive stability and behavioral analysis. Fredlund et al. [20] utilized Duncan’s [21] LEM-based three-stage procedure to estimate the rapid drawdown conditions for a combined stability and transient flow analysis of earth-fill dams. Using the SEEP-2D finite element computer program, Noori and Ismaeel [22] demonstrated that seepage could cause the weakening of the earth dam’s structure in rapid drawdown. Chugh [23] used three-dimensional numerical models to investigate the effects of geotechnical parameters on the stability and changes in the location of circular failures on the downstream slope of an earth-fill dam. Fattah et al. [24,25] utilized the FEM computer modeling by SEEP/W to estimate the flow through earth dams. The software provides variation charts to map the rapid drawdown condition on the dam’s body. The authors conducted different drawdown conditions on earthen dams to predict the statical stability and trends of the hydraulic flow on the dam by using a parallel analysis of SEEP/W and SLOP/W. Fattah et al. [26] evaluated the critical stability condition of an earth-fill dam’s stability by using various analytical methods to prepare the safety variation charts during and beyond rapid drawdown. Calamak et al. [5] used analytical procedures to investigate the safety status of the Hancagiz Dam in Turkey under steady-state, rapid-fill, and rapid drawdown conditions, which are reinforced by upstream berms. In this study, the authors used the various berms to obtain a high value for the dam’s safety. Pakmanesh et al. [27] presented experimental and numerical models for upstream slope stability in an earth dam reservoir under rapid drawdown conditions. The experimental model was used to measure the seepage conditions on the earth-fill slope and the numerical model provided the stability status based on the experimental results implemented in SEEP/W. Ahmad et al. [28] applied the FEM method to estimate the stability analysis of the earthen dam by SEEP/W on a studied case of Latamber Dam in Pakistan. Sammen et al. [29] used the GeoStudio package to prepare the flow and seismic stability analysis on the Hemren earth-fill dam, which led to the variation charts for the presentation of rapid drawdown under seismic loading conditions.
The presented study attempted to use coupled numerical FEM and LEM analytical procedures to provide comparative graphical charts to demonstrate the seepage, rapid drawdown, transient flow conditions, and stability status of an earth-fill dam, which were implemented in the case of the Alavian dam in Iran. In this regard, the overall safety factor variation is estimated based on the different stages of the drawdown conditions, which are compared and justified by field instrument measurements.
2. Materials and Methods
Applications of numerical and analytical methods such as FEM and LEM to estimate the slope stabilities are the most common procedures used by various scholars. In the meantime, different approaches and various commercial software have been developed based on the principles of limit and numerical balance. LEM methods are one of the oldest and most basic analytical approaches for slope stability analyses that are widely used in slope stability studies because of their simplicity, low complexity of formulation, and shorter analysis times. LEM based on massive analysis or slices investigates a possible slippery mass at the top of the assumed slip surface and the polyhedral force vector closure or incurring moments in the equilibrium state, which are capable of being utilized in static and dynamic conditions for two-dimensional and three-dimensional spaces [30]. The LEM method provides a closed-form calculation of the safety factor (F.S) by considering the probable sliding surface implemented in both massive and slice procedures [31]. The method provides the static/dynamic formulation of the sliding mass in a slope body driven by mobilize/resist–force and moment equilibriums [32]. The possibilities of calculating the F.Smin for the sliding mass, presenting the probable slip surface along with the lowest F.S coefficient, considering the unique F.S for the entire active mass, and involving cohesive and frictional components in slope mass strength characteristics, are some of the benefits of using limit equilibrium methods. The LEM methods have been developed extensively by various researchers since 1936 [33]. Scholars attempted to conduct complicated formulations based on LEM principles [30]. Also, LEM-based commercial software such as SLOPE/W is used worldwide. On the other hand, the application of the FEM approach provides near approximations to calculate the stress distributions, stress-strain relationships, displacements, and plastic points on slope mass based on finite-element equations; however, these parameters must be assumed in the LEM method [33]. Thus, using both methodologies (FEM-LEM) can help to provide realistic and more accurate results for slope stability assessments. The presented study used the two-dimensional FEM models (by SEEP/W and PLAXIS software) to estimate the rapid drawdown conditions in the Alavian earth-fill dam. The study led to an evaluation of the stability charts used for the rapid drawdown-based instability analysis. In the seepage analysis, the various stages of rapid drawdown conditions are provided and all variables are considered in calculating the flow conditions. These conditions are obtained from SEEP/W, and PLAXIS is used for slope stability modeling and extracting the graphical charts for the demonstration of the stability charts in earth-fill dams.
2.1. Studied Case
In the presented study, the Alavian dam was considered as a case study to provide a better understanding of the earth-fill dam’s behavior during rapid drawdown conditions and its impact on the upstream and downstream slope of the dam. The Alavian dam (37°26′12″ N–46°15′23″ E) is situated on the Soofian-Chay River, on the southern hillside of Sahand Mountain southeast of Urmia Lake at a distance of 120 km from Tabriz city and 3 km from Maragheh city in East Azerbaijan province, north-western Iran [34]. The earth-fill dam was constructed between 1990 and 1995 and has been active since 1996 [35]. The geometrical characteristics of the Alavian dam and lake are presented in Table 1. The dam serves to provide flood control and water supply for municipal and irrigation uses. After construction, it was noticed that the dam had settled five times more than expected. The Alavian dam is a non-homogenous (layered) earthen dam with a central impervious core flanked by previous shells. To protect the upstream slope, a 1.5 m thick layer of stone riprap is used. An injection gallery was built with concrete blocks under the core and on the bedrock. The dam is mainly composed of two layers: the internal layer as the core is made of clay, and the outer layer is a semi-pervious region made of sand and gravel, which is shown in Figure 1. Table 2 provides the geotechnical properties of the embankment’s geo-materials which are obtained by performing various geotechnical in situ and laboratory tests based on the American Society for Testing and Materials (ASTM) instructions. A number of standardized laboratory tests for the core, shell, and filter materials have been conducted in order to investigate the hydraulic and mechanical properties. The series of tests that are included in core materials are index tests, compaction, determination of specific gravity, permeability, triaxial, oedometer, and direct-shear tests. A large direct shear test was performed on shell and filter materials. The dam’s embankment soils are assumed to be isotropic and homogeneous in the stability and seepage analyses.

Table 1.
Geometrical characteristics for the Alavian dam and lake.
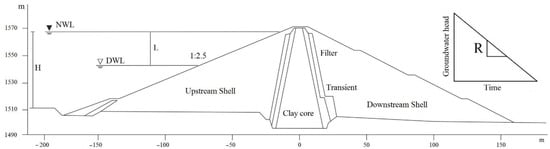
Figure 1.
The cross-sectional layout for the Alavian Dam.
Table 2.
Geotechnical properties for the Alavian dam’s seepage and slope stability analyses.
2.2. Processing and Application
The presented study conducted a stability analysis to estimate the effects of rapid drawdown and seepage conditions on the Alavian earth-fill dam as a case study. The purpose of the application is to investigate the earth dam’s stability during drawdown conditions depending on factors such as soil permeability, drawdown rate, and drawdown ratio. Also, the transient drawdown corresponds to different rates and ratios of drawdown relative to the permeability in the dam’s core material, which is considered in the calculations. To this end, a coupled transient seepage and deformation analysis was performed to conduct a stability analysis of the studied dam by using both LEM and FEM models. In this regard, the GeoStudio package and PLAXIS software were used to evaluate the problems. As part of the processing of the modeling, three different stages were conducted to provide the earth dam’s stability in simulations. In the first step, the geometry of the dam specifies the exact design plan based on the information in Figure 1 and Table 1, which is called the geometrical model. Secondly, specify the boundary conditions and perform the material behavioral model for describing the failure criterion. The modified Cam-Clay model, one of the most-advanced nonlinear elastoplastic material models, was chosen for the core material in order to compute the stress-induced pore-water pressure as realistically as possible. For shell materials, the Mohr–Coulomb model was selected. The material properties are assigned to the model according to Table 2, and the models are unscrambled for static stability analysis based on different rapid drawdown conditions. The results are used to provide the graphical charts to present the F.S variations versus the rapid drawdown parameters. Finally, in order to verify the models and the analysis, the estimated pore-water pressure during the real drawdown of the reservoir is compared to the real in situ measured pore-water pressure data from the dam. This data was gathered in 4 months from 1 June 2007 to 20 September 2007, by conducting onsite instrumentations.
2.3. Coupled Model Preparation
It is apparent and intuitively understood that the stability of a slope should be influenced by the stress-versus-strain characteristics of the soil. In conjunction with the stress–strain analysis approach, there are two other procedures. One is the consideration of stress level on the potential failure surface, and the other is the strength-reduction technique [9,33]. In the first procedure, a finite element stress analysis combined with a limit equilibrium analysis is called the enhanced limit method (ELM) or coupled LEM/FEM method. The ELM provides greater certainty and flexibility regarding the internal distribution of stresses within the soil mass. The normal force along any selected slip surface can be calculated from the stress distribution that has been calculated using a linear or nonlinear stress analysis (Figure 2). The overall safety factor is defined in accordance with the finite element slope stability method described by Kulhawy [33] and expressed as the ratio of the sum of the increment resisting shear strength (Sr) to the sum of the mobilized shear forces (Sn) along the slip surface, as presented in Equation (1).
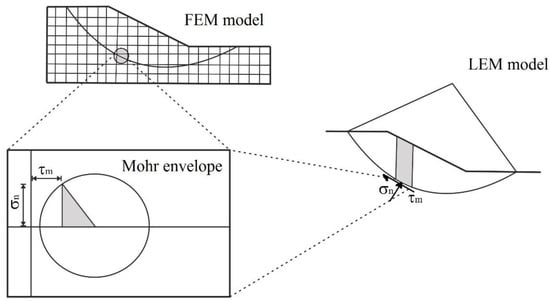
Figure 2.
The stability analysis based on LEM/FEM [33].
One of the essential ingredients for a successful finite element analysis of a geotechnical problem is an appropriate soil constitutive model. There is not a single constitutive model currently available that can reproduce all aspects of real soil behavior. It is, therefore, important to recognize in the analysis what aspects of the problem are of major interest and to choose a model accordingly. It is apparent that the FEM analysis of stresses, deformations, and hydraulics in embankments is an exceedingly complex problem. So, it must consider both saturated and unsaturated conditions and perform a coupled analysis [36].
Regarding the LEM/FEM modeling by using the GeoStudio package and PLAXIS software, it can be stated that the modeling is implemented in four steps that include geometrical modeling, boundary conditions, material specifications, and mechanical modeling that leads to solving the stability analysis. The geometric model is based on the actual conditions of the dam. In the study dam, three main areas of the core, shell, and foundation are considered. The geometric dimensions of the model are determined based on the dimensions designed for the dam, and the closed and open boundary conditions are assigned to the dam, the same as in Table 1. The fine mesh is selected in a numerical model for a detailed analysis. Also, both triangular and rectangular grids are selected for the FEM model. The combination of the two in networking results in a regular, continuous, and coordinated network between borders. Material specifications are assigned based on field survey, sampling, and geotechnical characteristics (Table 2) to provide an accurate view of the dam in simulations. For the samples taken from the Alavian earth-fill dam site, various geotechnical tests based on ASTM instructions such as triaxial, permeability, oedometery, direct-shear, etc. were conducted. These specifications are used in the model as the material characteristics for the core, shell, and foundation. After these preparations, the model was solved. The results of simulations were used in stability assessments of the dam. The rapid drawdown condition is implemented in each R and k value individually that is used for preparing the stability charts. Figure 3 provides an example of the modeling view of the rapid drawdown conditions.
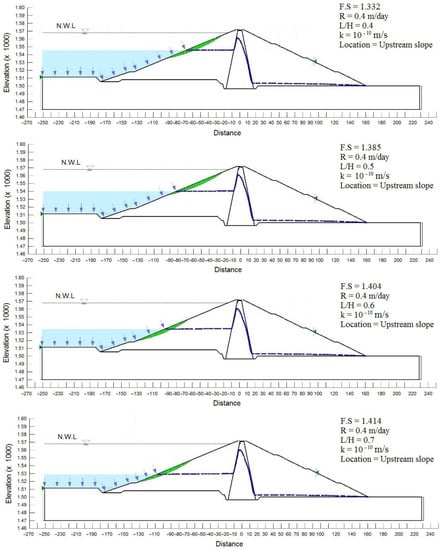
Figure 3.
A simple view of the comprehensive modeling for rapid drawdown conditions.
2.4. Drawdown Analysis
Dam geometry, soil permeability, drawdown rate, and drawdown ratio are important factors in the occurrence of the rapid drawdown condition [37]. To investigate the effect of rapid drawdown on the earth dam’s stability, each of these factors is taken into account. The drawdown ratio (L/H) is represented based on L as the final drop in the external water level (or drawdown water level, DWL) below the initial position of the normal water level (NWL) and H is the height of the NWL (see Figure 1) [14]. The concept of drawdown rate is the ratio of water level (groundwater head) changes over time and it is nominated as R [16] and is presented in Figure 1. The model is implemented based on “transient” time, so that the time is considered in all steps of the modeling. In modeling, regarding the dam’s height, the discharge rate and the discharge volume are taken into account; time is implicitly observed. The discharge rate is considered as R, which is in meters per day. This discharge is calculated for different rates of R. Therefore, time is included in this variable. For example, for R = 1 the time is 56 days (by definition). So, for R = 0.4, the discharge time is 140 days. Therefore, it can be concluded that the minimum discharge time for the dam is 65 days (R = 1), which is also the longest time for the discharge rate (R = 0.01). In the drawdown analysis for the Alavian dam model, with five different drawdown rates, R = {0.01, 0.1, 0.2, 0.4, 1} metres per day, and various drawdown ratios L/H = {0.1, 0.2, …, 1}, with 3 distinct hydraulic permeabilities of core material k = 10−10, 10−9, 10−8 m/s, being considered. Although it is possible to consider the anisotropy in hydraulic conductivity in this study for the seepage and consolidation analysis, the soil medium was assumed to be isotropic.
Referring to Vanden Berge et al. [38], soil compressibility and hydraulic conductivity control how quickly saturated soil can deform and respond to changes in pore pressure caused by changes in boundary conditions. Inaccurate modeling of compressibility will lead to an inaccurate prediction of the variations in pore pressure with time, and inaccurate evaluations of stability. In this paper, wherever hydraulic conductivity was discussed, it was associated with compressibility. The water content function or van Genuchten parameters for core materials are specified by the van Genuchten model. The van Genuchten model parameters (α, n, and m) were assumed based on values for a CL-CH with similar unit weight and Atterberg limits [38,39], whereas the mv coefficient is obtained from Carter and Bentley [40]. As reported by Vanden et al. [38], it should be noted that both soil compressibility and hydraulic conductivity control how quickly saturated soil can deform and respond to changes in pore pressure caused by changes in boundary conditions. Inaccurate modeling of compressibility will lead to an inaccurate prediction of the variations in pore pressure with time and inaccurate evaluations of stability. The water content function for the core materials was specified by the van Genuchten model (α = 28.57 kPa, n = 1.213, m = 0.176). The parameter m is set equal to 1 − n−1. Moreover, the hydraulic conductivity function of the core materials was modified and shifted appropriately for the three values of kcore = 10−8; 10−9; 10−10; m/s and kshell = 2.75 × 10⁻⁴ m/s was used, where the main factor in hydraulic conductivity is focused on the dam’s core. Also, the water content function for the shell materials is specified by the grain-sized analysis method according to d10, d60, and volumetric water content.
3. Results and Discussion
3.1. Phreatic-Line Status under Rapid Drawdown
The occurrence of a phreatic line within an earth-fill dam’s core is mostly dependent on hydraulic permeability associated with material compressibility and drawdown rate. Low permeable soil has no chance for drainage under rapid drawdown conditions, which consequently affects the phreatic line within the low permeable core, which remains near its initial condition. As an example, the final phreatic line for cores with different hydraulic conductivities at the same drawdown rate (e.g., R = 1 cm/day) and L/H = 1 is conformable to the phreatic line within the shell material with high permeability (10−8 m/s) at any moment of drawdown. Hence, it can be concluded that the pore-water pressure can rapidly dissipate because the shell materials are relatively permeable. On the other hand, even at a drawdown rate of R = 1 cm/day, it has led to a rapid drawdown. So, by increasing the permeability of the core’s material, despite still preventing seepage, the instability risk of the upstream slope as a result of the rapid drawdown effect intensifies.
For a better understanding of the problem, the phreatic-line variations under rapid drawdown are defined as h/H, where h is defined as a phreatic-line variation in the core materials compared to steady-state, and h is defined as a phreatic-line variation in the reservoir. Figure 4 and Figure 5 present the h/H variations with respect to drawdown rate and permeability coefficient at the end of drawdown, respectively. Figure 4 presents the discharge rate (R) impact on the reliability by considering the various permeabilities for the critical failure conditions obtained using the Morgenstern–Price method (LEM). On the other hand, in Figure 5, the h/H is obtained based on various permeabilities with respect to the different R (0.1, 0.2, 0.4, and 1 m/day). From these figures, it can be concluded that the only case that is close to slow drawdown (h/H = 1) is based on drawdown with kcore = 10−8 m/s and R = 1 cm/day. On the contrary, as shown in the figures, this rate, in the case of kcore = 10–10 m/s, is considered a full rapid drawdown. Figure 4 indicates that a low permeable core (kcore = 10−9; kcore = 10−10 m/s) is more sensitive to an increase in drawdown rate than a relatively permeable core (kcore = 10−8 m/s). Also, in the low permeable core, as the drawdown rate exceeds 20 cm/day, the curve becomes almost horizontal, which means that a low permeable core with a drawdown rate of R = 20 cm/day will not have the opportunity to drain; however, in a relatively permeable case (kcore = 10−8 m/s), even at a drawdown rate of R = 1 m/day, the core materials are able to drain. According to Figure 5, at constant permeability, the phreatic-line drop rate within the core is reduced as the drawdown rate increases. Moreover, at a constant drawdown rate, the curve sharply declines when permeability decreases, and the most substantial part of this decline occurs between kcore = 10−8 and 10−10, which shows that at a constant drawdown rate, the permeability coefficients between these coefficients are critical under rapid drawdown.
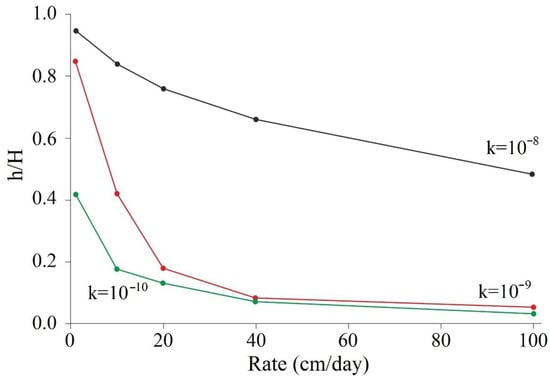
Figure 4.
Dependency of a drawdown on the discharge rate with different permeability coefficients.
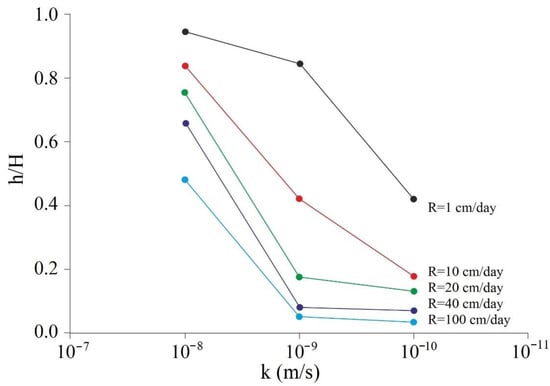
Figure 5.
The Dependency of a drawdown on the permeability coefficient with different discharge rates.
3.2. Safety Factor Variations
In LEM analyses, by assuming the critical slip surface to be the entire mobilized mass, the constant drawdown ratio is obtained from the all-movable mass under unique F.S. This assessment is considered the same for the movable mass regardless of drawdown rate and permeability coefficients. The reason for this is that the critical slip surfaces are shallow and the shell is large enough. Even seepage-induced downward forces acting on the upstream slope are not effective since the shell materials are permeable during LEM-based analysis. For instance, the critical slip surface for all analyses is considered L/H = 0.5 regardless of the drawdown rate and core permeability. All estimated safety factors for critical slip surfaces were obtained by the Morgenstern–Price method. Entire permeability coefficients versus drawdown ratios are estimated by LEM stability assessments and presented in Figure 6. In addition, by conducting the coupled analysis for the LEM and FEM procedures, the critical F.S was considered and monitored.
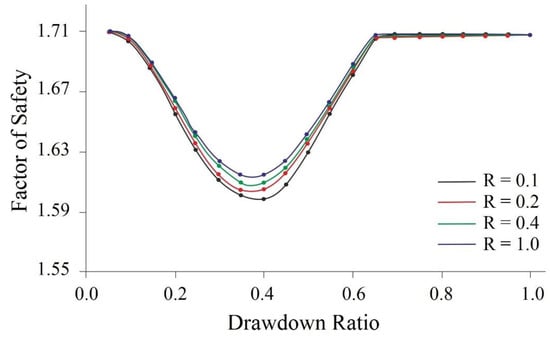
Figure 6.
F.S variation versus drawdown ratio regarding R by Morgenstern–Price (LEM) method (Note: R rate is m/day).
Referring to the results of the stability analysis with SLOPE/W, the slip surface in the studied dam is a shallow surface, but in every analysis with different k and R the selected slip surfaces are different from each other, resulting in a variation in the F.S. For instance, the critical slip surface at the end of drawdown for various k and R variations is considered individually and different safety factors are estimated as well. To investigate the impact of these parameter variations on rapid drawdown, the trend of safety factors versus drawdown ratio is obtained, which is illustrated in Figure 7. By using this figure, results can be estimated of the drawdown rate and permeability under different R values. By looking at the comparative results presented in Figure 7, it can be mentioned that the drawdown rate from 0.2 to 0.6 is the most critical state for safety factors, which shows significant declines. A possible explanation for the observed minimum is the weight of the soil and the trade-off between the soil weight and soil shear strength as the drawdown level varies. In the initial stage of drawdown (L/H < 0.5) the increased weight of the slope has a proportionately greater destabilizing effect than the increased frictional strength and factor of safety falls. At a higher drawdown ratio (L/H > 0.5); however, the increased frictional strength starts to have a greater influence than the increased weight, and the F.S rises.
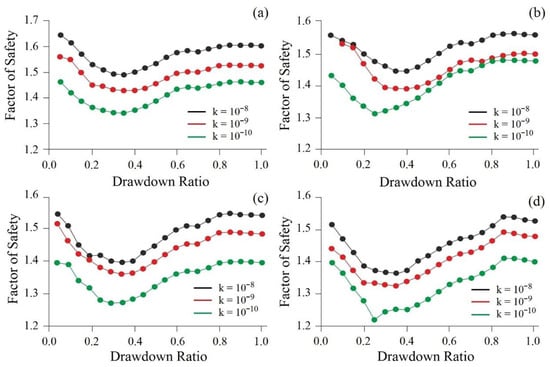
Figure 7.
The trend of safety factors versus drawdown ratio by FEM: (a) R = 0.1 m/day, (b) R = 0.2 m/day, (c) R = 0.4 m/day, (d) R = 1 m/day.
3.3. LEM/FEM-Based Rapid Drawdown Analysis
In order to investigate the capability of LEM/FEM procedures to evaluate the safety factors’ changes based on rapid drawdown, a comparison of permeability and different drawdown rates on different R values is presented in Figure 8. As presented in Figure 8, which illustrates the F.S variations based on R (m/day), the FEM-based modeling provides more conservative results than the LEM-based modeling for estimating the F.S under various drawdown rates for the earthen dam. Regarding this figure, the main variations in the F.S follow a close trend, but the LEM results indicated that various harmonic safety factors with different R and FEM models provided lower F.S with wider estimations. A closer look at the LEM/FEM models indicated two stages for probable sliding surfaces on dams, which can be classified as shallow and deep slip surfaces. Figure 9 and Figure 10 provide detailed analyses of both instability statuses of the dams, which lead to the stability charts for these cases. According to these figures, it was stated that by increasing the slip surface’s depth, the F.S increases, and by decreasing the hydraulic hydration, the reliability decreases. Also, the sensitivity of F.S for the shallow and deep sliding situations is influenced by the drawdown rates. Paying closer attention to the graphs presented in Figure 9 and Figure 10 indicates that the more superficial the slip surface becomes, the lower the confidence level. It can be clearly seen that the drawdown rate has a significant impact on the stability of the dam and the drawdown rate causes a significant impact on the F.S values.
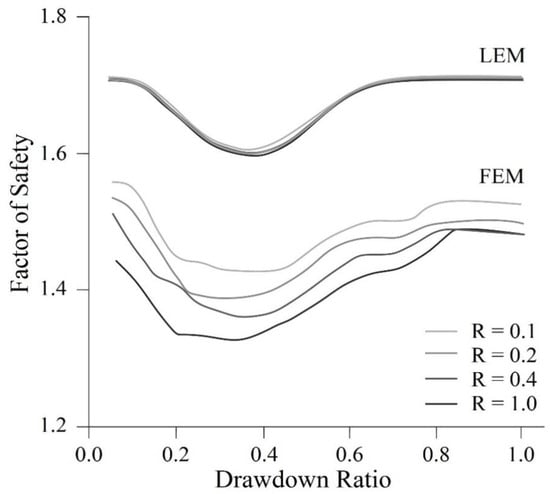
Figure 8.
The comparative variation of F.S based on LEM/FEM models (Note: the results of the FEM model are more conservative than the LEM model).
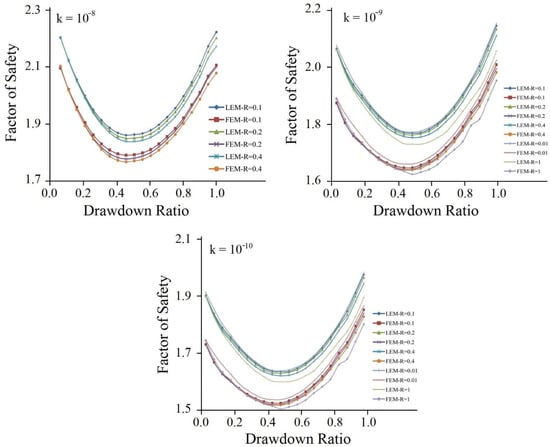
Figure 9.
The F.S vs. drawdown ratio in the shallow sliding surface based on LEM/FEM models.
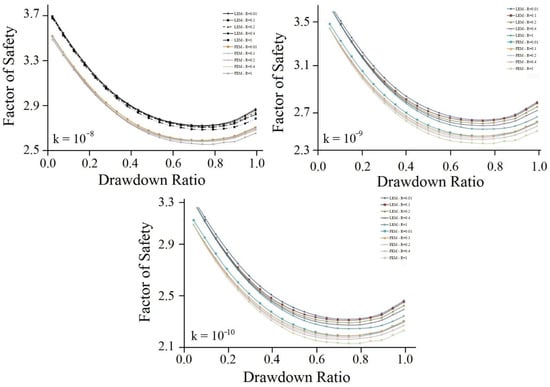
Figure 10.
The F.S vs. drawdown ratio in deep sliding surface based on LEM/FEM models.
3.4. Real-Data Verifications
In order to understand the capability and performance of stability and the charts provided by the couple models, these models were verified by conducting a comparative analysis and justification of the ground information obtained from the extensive Alavian earth-fill dam body and lake to observe its behavior during the construction and service phases. Among these instrumentations, the vibrating-wire piezometers, mechanical piezometers, hydrogeological boreholes, and stand-pipe piezometers are used for measurement of the water level in the dam body and lake. A total water-level drawdown of about 25.45 m in 114 days was measured and applied to the models. This drawdown was imposed at a different rate (with an average rate of 0.22 m/day) because of the modeling of the existing conditions. Details of changing water levels in the reservoir and the measured pore-water pressures are indicated in the set of figures prepared to analyze the case. Figure 11 provides information about the locations of the instrumentations that were installed to measure the pore-water pressure in the dam and reservoir. To estimate the rapid drawdown conditions, the model was verified by measured data in pure flow and hydrostatic pore-pressure variations in the dam’s upstream shell and core. The pure flow defined in the coupled analysis systematically leads to lower water pressure than the uncoupled (pure flow) approximation during the first stages of the dissipation. On the other hand, the classical hypothesis for the drawdown analysis is considered an undrained or pure flow. This is due to the effect of the initial state after drawdown, controlled by the change in stress. Since pressures dissipate faster the stiffer the soil, this situation changes after some time and the water pressure records may cross at a particular time, which depends on the position of the considered point in the slope. Note also that full steady-state conditions were not reached at the end of the simulation period [18]. Figure 12 provides the comparative results of the coupled FEM/LEM modeling with instrumentation results on the shell and core of the studied dam. According to this figure, the applied models provide reliable results to estimate the rapid drawdown simulations and critical state stability analysis.
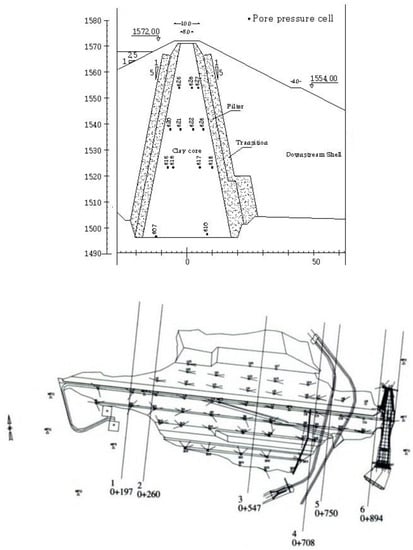
Figure 11.
The location of the instrumentations on the studied dam.
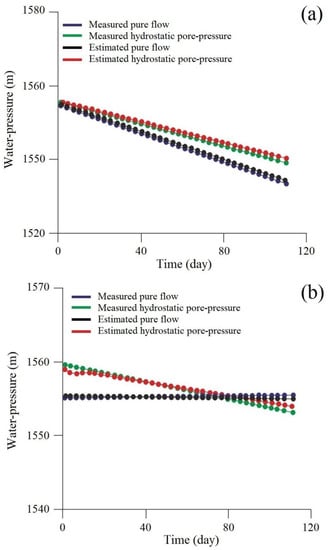
Figure 12.
The comparative results of coupled FEM/LEM modeling with instrumentation: (a) upstream shell, (b) core.
4. Conclusions
This study investigated the effects of the different variables of rapid drawdown and various drawdown rates on stability status in earth-fill dams to provide comprehensive stability charts based on different seepage, drawdown rates, and permeability conditions. To this end, three permeabilities were used to estimate the safety terms regarding the various drawdown rates (R = 0.1, 0.2, 0.4, and 1 m/day). The calculation was performed based on the coupled stability analyses with FEM/LEM methods implemented in SEEP/W, SLOPE/W, and PLAXIS commercial software. The results were applied to draw the stability charts for both shallow and deep sliding surfaces. According to the results, the following can be stated:
- -
- Regarding the drawdown ratio estimated for both LEM and FEM methods, the results indicated that the FEM provided is more conservative than the LEM. Regarding this evaluation, the main variations in the F.S follows a close trend, but the LEM results indicated various harmonic safety factors, with different R and FEM models providing lower F.S.
- -
- Referring to the LEM/FEM modeling results for various R-values, 0.2 to 0.6 is the most critical state for safety factors.
- -
- By increasing the slip surface’s depth and decreasing the hydraulic hydration, the reliability decreases, and sliding surfaces’ sensitivity increases based on the drawdown rates.
- -
- Looking at the stability charts, it can be mentioned the drawdown rate from 0.2 to 0.6 is the most critical state for safety factors that are showing significant declines.
- -
- The LEM/FEM stability charts estimated for the drawdown ratio in shallow sliding indicated that the high rate of 0.4–0.6 for the drawdown ratio is shown with a reduction in F.S. This rate for deep sliding is 0.6–0.8.
- -
- Referring to the comparison of the modeling results with instrumentation, it can be stated that the measured and estimated rates for water pressure follow a close trend for the dam which is from 1560 to 1550 m.
- -
- The results were verified by conducting a comparative analysis and justification with ground information obtained using extensive instrumentation of the Alavian earth-fill dam, which is considered a case study. Based on justifications, the applied models provide reliable results to estimate the rapid drawdown simulations and critical state stability analysis.
Author Contributions
A.A. and A.E.I.: writing—original draft preparation, methodology, conceptualization, investigation, resources; M.A.: validation, visualization, formal analysis, methodology; M.H.B.: conceptualization, methodology, validation, visualization, supervision, writing—review and editing; F.B.S.: validation, visualization, supervision, writing—review and editing; R.D.: supervision, writing—review and editing. All authors have read and agreed to the published version of the manuscript.
Funding
This research received no external funding.
Institutional Review Board Statement
Not applicable.
Informed Consent Statement
Not applicable.
Data Availability Statement
The study did not report any data.
Acknowledgments
The authors wish to thank the Department of Civil Engineering, University of Tabriz for providing permission to conduct the geotechnical investigations. Also, the authors would like to thank the anonymous reviewers for providing invaluable review comments and recommendations for improving the scientific level of the article.
Conflicts of Interest
The authors declare no conflict of interest.
References
- Wang, G.; Tian, S.; Hu, B.; Kong, X.; Chen, J. An experimental study on tailings deposition characteristics and variation of tailings dam saturation line. Geomech. Eng. 2020, 23, 85–92. [Google Scholar]
- Huang, X.; Zheng, D.; Yang, M.; Gu, H.; Su, H.; Cui, X.; Cao, W. Displacement aging component-based stability analysis for the concrete dam. Geomech. Eng. 2018, 14, 241–246. [Google Scholar]
- Athani, S.S.; Shivamanth, S.; Solanki, C.H.; Dodagoudar, G.R. Seepage and Stability Analyses of Earth Dam Using Finite Element Method. Aquat. Procedia 2015, 4, 876–883. [Google Scholar] [CrossRef]
- Mouyeaux, A.; Carvajal, C.; Bressolette, P.; Peyras, L.; Breul, P.; Bacconnet, C. Probabilistic stability analysis of an earth dam by Stochastic Finite Element Method based on field data. Comput. Geotech. 2018, 101, 34–47. [Google Scholar] [CrossRef]
- Calamak, M.; Kilic, Y.; Yanmaz, A.M. On the Stability of Moderate Height Berm-Type Earthen Dams: The Hancagiz Dam Example. Geotech. Geol. Eng. 2020, 38, 4169–4179. [Google Scholar] [CrossRef]
- Sica, S.; Pagano, L.; Rotili, F. Rapid drawdown on earth dam stability after a strong earthquake. Comput. Geotech. 2019, 116, 103187. [Google Scholar] [CrossRef]
- Omofunmi, O.E.; Kolo, J.G.; Oladipo, A.S.; Diabana, P.D.; Ojo, A.S. A Review on Effects and Control of Seepage through Earth-fill Dam. Curr. J. Appl. Sci. Technol. 2017, 22, 1–11. [Google Scholar] [CrossRef]
- Al-Janabi, A.M.S.; Ghazali, A.H.; Ghazaw, Y.M.; Afan, H.A.; Al-Ansari, N.; Yaseen, Z.M. Experimental and Numerical Analysis for Earth-Fill Dam Seepage. Sustainability 2020, 12, 2490. [Google Scholar] [CrossRef] [Green Version]
- Rahimi, H. Earth Fill Dams, 1st ed.; University of Tehran Press: Tehran, Iran, 2003. (In Persian) [Google Scholar]
- Fathani, T.F.; Legono, D. Pengaruh Fluktuasi Muka Air Reservoir Terhadap Stabilitas Bendungan Tanah Uji Model Di Laboratorium; Penelitian DPP/SPP Fakultas Teknik UGM: Yogyakarta, Indonesia, 2010. (In Indonesian) [Google Scholar]
- Terzi, N.U.; Selcuk, M.E. Nonlinear dynamic behavior of Pamukcay Earthfill Dam. Geomech. Eng. 2015, 9, 83–100. [Google Scholar] [CrossRef]
- Sherard, J.L.; Woodward, R.J. Earth-Rock Dams: Engineering Problems of Design and Construction; Wiley: New York, NY, USA, 1963. [Google Scholar]
- Moregenstern, N. Stability charts for earth slopes during rapid drawdown. Geotechnique 1963, 13, 121–131. [Google Scholar] [CrossRef]
- Lane, P.A.; Griffiths, D.V. Assessment of stability of slopes under drawdown conditions. J. Geotech. Geoenviron. Eng. 2000, 126, 443–450. [Google Scholar] [CrossRef]
- Chahar, B.R. Determination of Length of a Horizontal Drain in Homogeneous Earth Dams. J. Irrig. Drain. Eng. 2004, 130, 530–536. [Google Scholar] [CrossRef]
- Berilgen, M.M. Investigation of stability of slopes under drawdown conditions. Comput. Geotech. 2007, 34, 81–91. [Google Scholar] [CrossRef]
- Hussain, I.A.; Kashyap, D.; Prasad, K.S.H. Seepage Modeling Assisted Optimal Design of a Homogeneous Earth Dam: Procedure Evolution. J. Irrig. Drain. Eng. 2007, 133, 116–130. [Google Scholar] [CrossRef]
- Pinyol, N.M.; Alonso, E.E.; Olivella, S. Rapid drawdown in slopes and embankments. Water Resour. Res. 2008, 44, W00D03. [Google Scholar] [CrossRef]
- Zomorodian, A.; Abodollahzadeh, S.M. Effect of Horizontal Drains on Upstream Slope Stability during Rapid Drawdown Condition. J. Civ. Environ. Eng. 2010, 42, 29–34. [Google Scholar]
- Fredlund, M.; Lu, H.; Feng, T. Combined Seepage and Slope Stability Analysis of Rapid Drawdown Scenarios for Levee Design. In Proceedings of the Geo-Frontiers Congress 2011, Dallas, TX, USA, 13–16 March 2011; pp. 1595–1604. [Google Scholar]
- Duncan, J.M. State of the Art: Limit Equilibrium and Finite-Element Analysis of Slopes. J. Geotech. Eng. 1996, 122, 577–596. [Google Scholar] [CrossRef]
- Noori, B.M.A.; Ismaeel, K.S. Evaluation of Seepage and Stability of Duhok Dam. Al-Rafidain Eng. J. 2011, 19, 42–58. [Google Scholar]
- Chugh, A.K. Stability Assessment of a Circular Earth Dam. Int. J. Num. Anal. Methods Geomech. 2013, 37, 2833–2859. [Google Scholar] [CrossRef]
- Fattah, M.Y.; Al-Labban, S.N.Y.; Salman, F.A. Seepage Analysis of a Zoned Earth Dam by Finite Elements. Int. J. Civil Eng. Technol. 2014, 5, 128–139. [Google Scholar]
- Fattah, M.Y.; Omran, H.A.; Hassan, M.A. Behavior of an Earth Dam during Rapid Drawdown of Water in Reservoir–Case Study. Int. J. Adv. Res. 2015, 3, 110–122. [Google Scholar]
- Fattah, M.Y.; Omran, H.A.; Hassan, M.A. Flow and stability of Al-Wand earth dam during rapid drawdown of water in reservoir. Acta Montan. Slov. 2017, 22, 43–57. [Google Scholar]
- Pakmanesh, M.; Jahromi, S.H.M.; Khosrojerdi, A.; Darvishi, H.H.; Babazadeh, H. Experimental and numerical study of upstream slope stability in an earth dam reservoir under rapid drawdown conditions. Innovaciencia 2020, 8, 1–15. [Google Scholar] [CrossRef]
- Ahmad, A.; Ali, S.; Khan, M.; Harahap, I.S.H.; Aslam, M.S. Re-Assessment of an Earth fill Dam using Finite Element Method and Limit Equilibrium Method (Case study of Latamber Dam, Pakistan). J. Adv. Res. Fluid Mech. Therm. Sci. 2020, 71, 87–102. [Google Scholar] [CrossRef]
- Sammen, S.S.; Majeed, M.Q.; Majeed, Q.G. Stability Assessment of Zoned Earth Dam under Water Particles Fluidity Effect: Hemren Dam as Case Study. J. Adv. Res. Fluid Mech. Therm. Sci. 2021, 79, 27–38. [Google Scholar] [CrossRef]
- Azarafza, M.; Akgün, H.; Ghazifard, A.; Asghari-Kaljahi, E.; Rahnamarad, J.; Derakhshani, R. Discontinuous rock slope stability analysis by limit equilibrium approaches—A review. Int. J. Digit. Earth 2021, 14, 1918–1941. [Google Scholar] [CrossRef]
- Azarafza, M.; Asghari-Kaljahi, E.; Akgün, H. Assessment of discontinuous rock slope stability with block theory and numerical modeling: A case study for the South Pars Gas Complex, Assalouyeh, Iran. Environ. Earth Sci. 2017, 76, 397. [Google Scholar] [CrossRef]
- Azarafza, M.; Asghari-Kaljahi, E.; Akgün, H. Numerical modeling of discontinuous rock slopes utilizing the 3DDGM (three-dimensional discontinuity geometrical modeling) method. Bull. Eng. Geol. Environ. 2017, 76, 989–1007. [Google Scholar] [CrossRef]
- Kulhawy, F.H. Finite Element Analysis of the Behavior of Embankments. Ph.D. Thesis, University of California, Berkeley, CA, USA, 1969. [Google Scholar]
- Huang, Y.H. Slope Stability Analysis by the Limit Equilibrium Method: Fundamentals and Methods; American Society of Civil Engineers Press: Reston, VA, USA, 2014. [Google Scholar]
- MahabGhods Consulting Engineers Co. The Technical Report for Engineering Geology for Alavian Earth-Fill Dam; Alavian Dam Technical Report; MahabGhods Consulting Engineers Co.: Tabriz, Iran, 1994. [Google Scholar]
- MahabGhods Consulting Engineers Co. The Technical Report for Geotechnical Site Investigation for Alavian Earth-Fill Dam; Alavian Dam Technical Report; MahabGhods Consulting Engineers Co.: Tabriz, Iran, 1994. [Google Scholar]
- Sheng, D. Review of fundamental principles in modelling unsaturated soil behaviour. Comput. Geotech. 2011, 38, 757–776. [Google Scholar] [CrossRef]
- Vanden Berge, D.R.; Duncan, J.M.; Brandon, T.L. Limitations of Transient Seepage Analyses for Calculating Pore Pressures during External Water Level Changes. J. Geotech. Geoenviron. Eng. 2015, 141, 04015005. [Google Scholar] [CrossRef]
- Carsel, R.F.; Parrish, R.S. Developing joint probability distributions of soil water retention characteristics. Water Resour. Res. 1988, 24, 755–769. [Google Scholar] [CrossRef] [Green Version]
- Carter, M.; Bentley, S.P. Soil Properties and Their Correlations, 2nd ed.; John Wiley and Sons: Chichester, UK, 2016. [Google Scholar]
Publisher’s Note: MDPI stays neutral with regard to jurisdictional claims in published maps and institutional affiliations. |
© 2022 by the authors. Licensee MDPI, Basel, Switzerland. This article is an open access article distributed under the terms and conditions of the Creative Commons Attribution (CC BY) license (https://creativecommons.org/licenses/by/4.0/).