
Outcome Prediction for SARS-CoV-2 Patients Using Machine Learning Modeling of Clinical, Radiological, and Radiomic Features Derived from Chest CT Images

 , , ,
, , ,  , , ,
, , ,  ,
,
Abstract
:Featured Application
Abstract
1. Introduction
2. Materials and Methods
2.1. Study Design
2.2. Patient Cohort
2.3. Image Segmentation
2.4. Patient and Image Characteristics
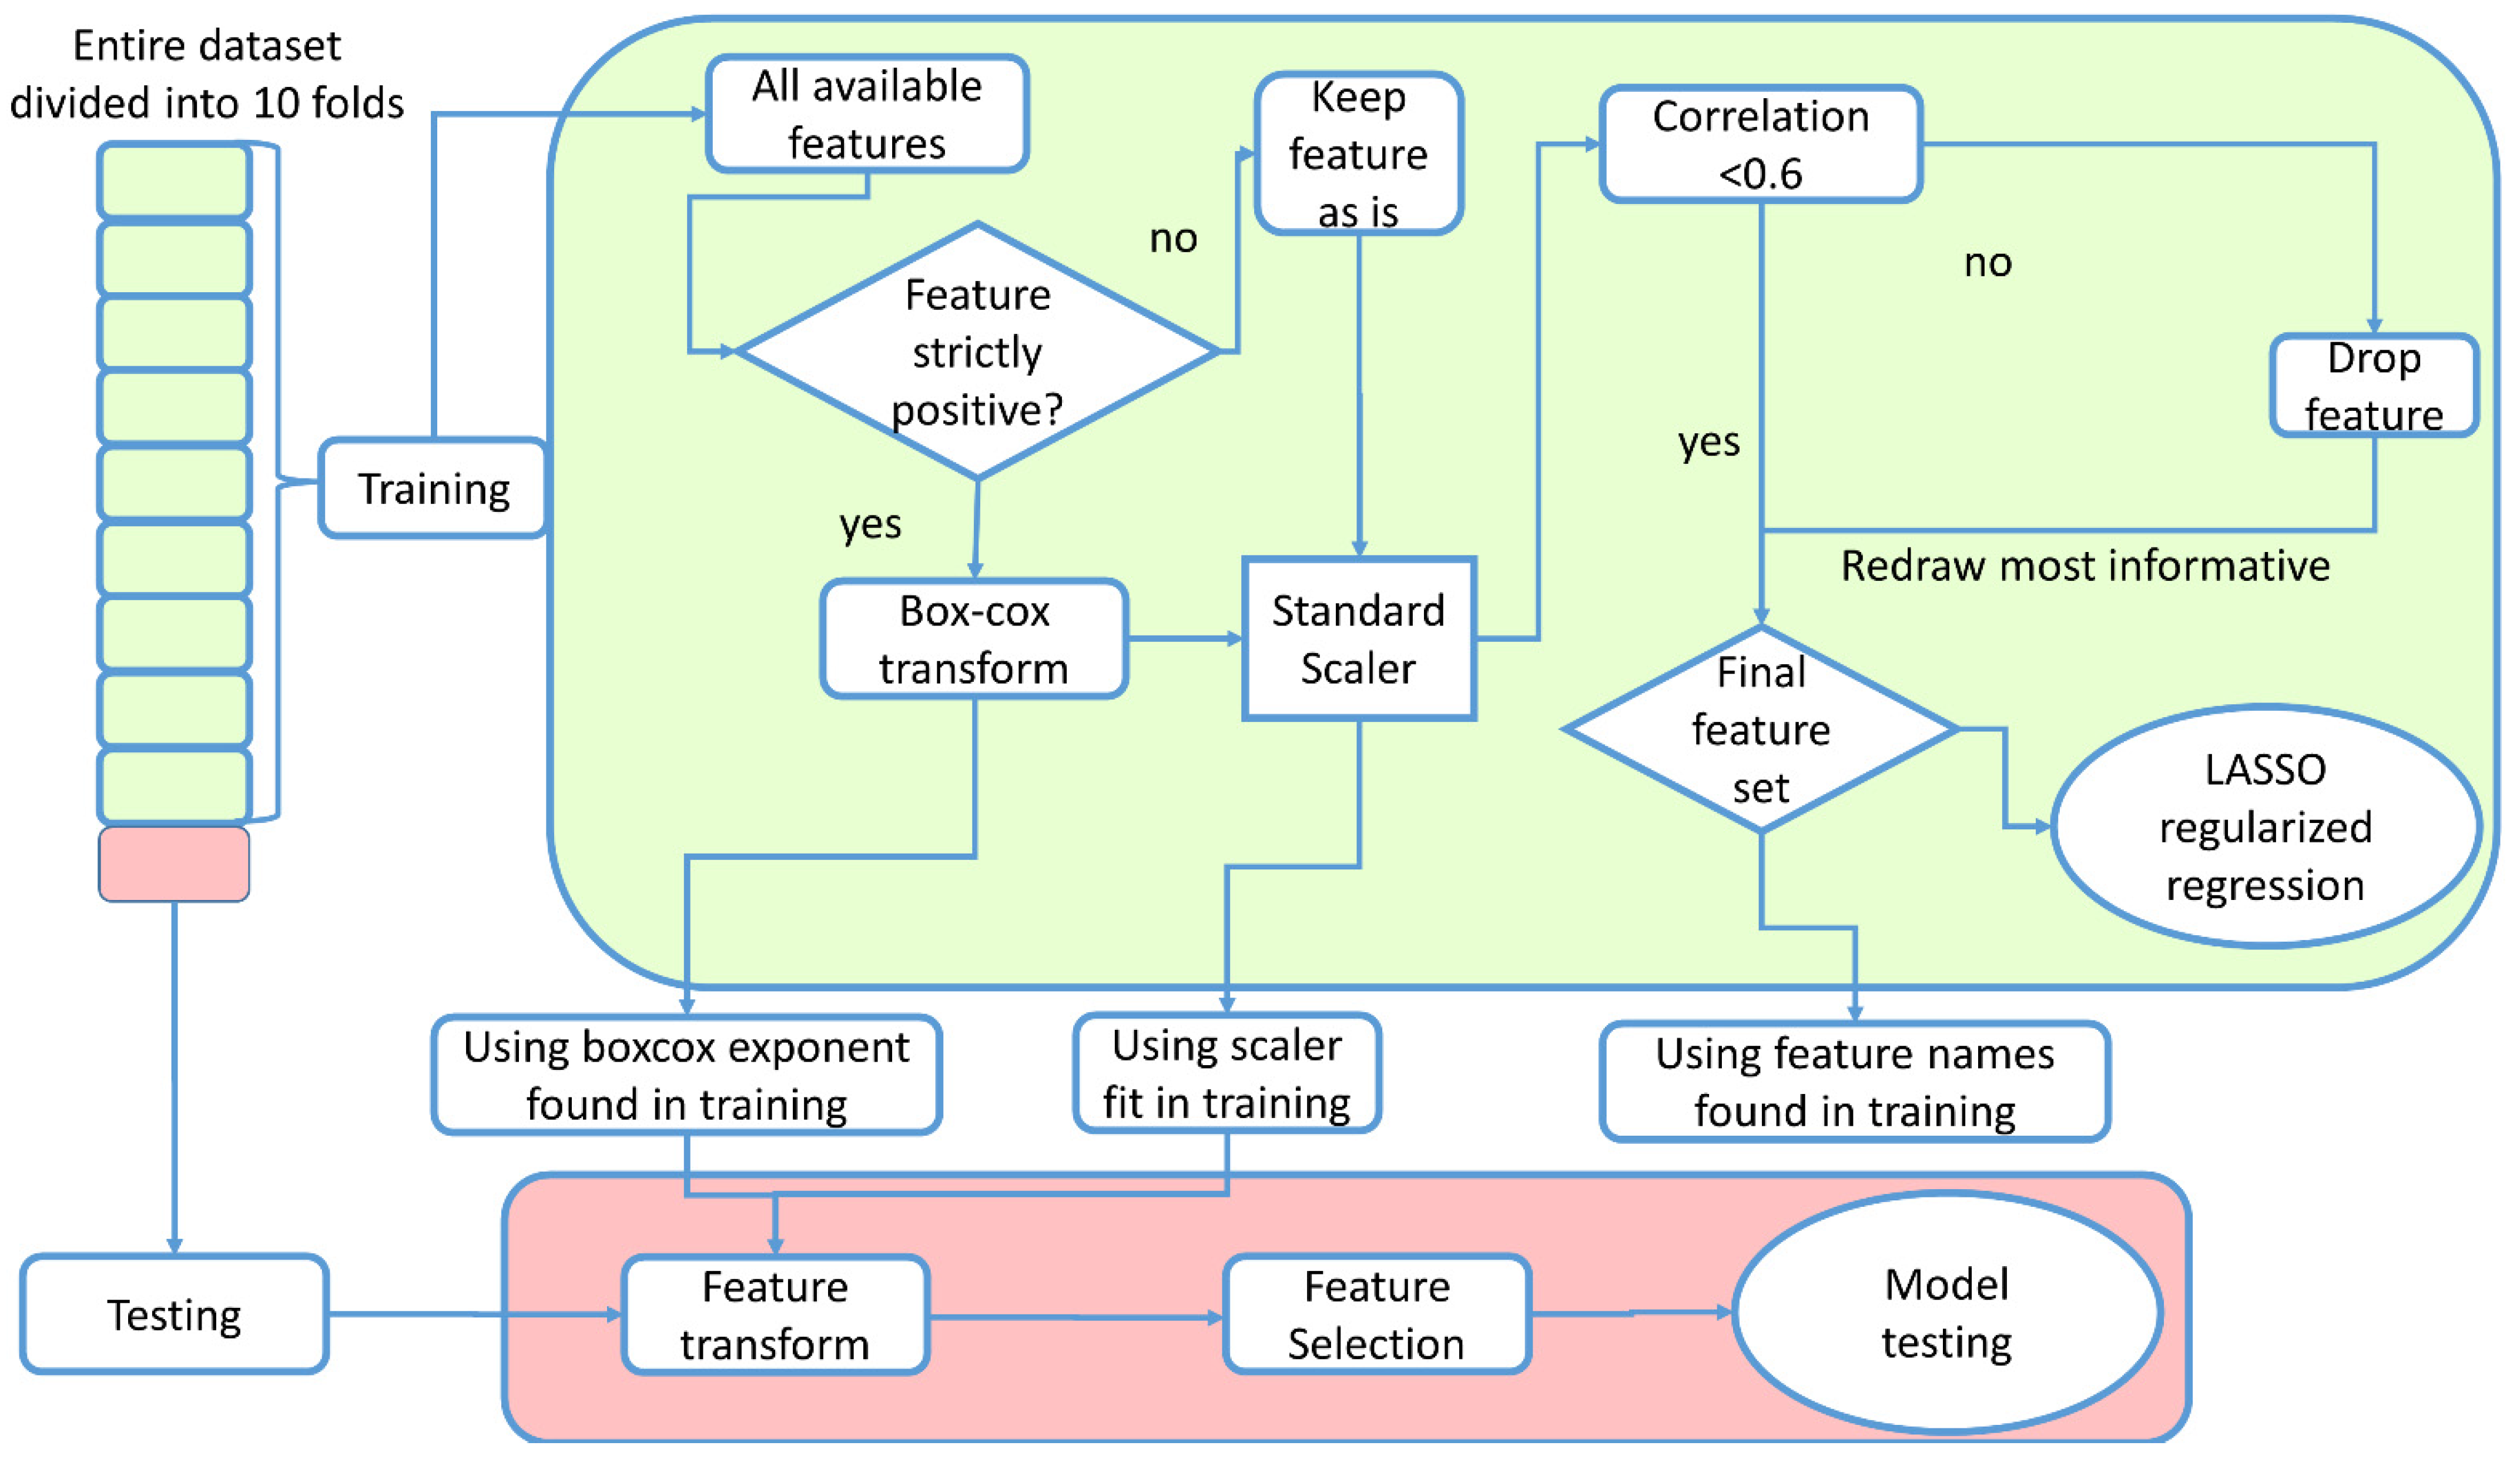
2.5. Predictive Models
3. Results
4. Discussion
5. Conclusions
Supplementary Materials
Author Contributions
Funding
Institutional Review Board Statement
Informed Consent Statement
Data Availability Statement
Acknowledgments
Conflicts of Interest
References
- Corman, V.M.; Landt, O.; Kaiser, M.; Molenkamp, R.; Meijer, A.; Chu, D.K.; Bleicker, T.; Brünink, S.; Schneider, J.; Schmidt, M.L.; et al. Detection of 2019 novel coronavirus (2019-nCoV) by real-time RT-PCR. Eurosurveillance 2020, 25, 2000045. [Google Scholar] [CrossRef] [PubMed] [Green Version]
- Ai, T.; Yang, Z.; Hou, H.; Zhan, C.; Chen, C.; Lv, W.; Tao, Q.; Sun, Z.; Xia, L. Correlation of Chest CT and RT-PCR Testing for Coronavirus Disease 2019 (COVID-19) in China: A Report of 1014 Cases. Radiology 2020, 296, E32–E40. [Google Scholar] [CrossRef] [PubMed] [Green Version]
- Revel, M.P.; Parkar, A.P.; Prosch, H.; Silva, M.; Sverzellati, N.; Gleeson, F.; Brady, A. COVID-19 patients and the radiology department—Advice from the European Society of Radiology (ESR) and the European Society of Thoracic Imaging (ESTI). Eur. Radiol. 2020, 30, 4903–4909. [Google Scholar] [CrossRef] [PubMed] [Green Version]
- Zwanenburg, A.; Vallières, M.; Abdalah, M.A.; Aerts, H.; Andrearczyk, V.; Apte, A.; Ashrafinia, S.; Bakas, S.; Beukinga, R.J.; Boellaard, R.; et al. The Image Biomarker Standardization Initiative: Standardized Quantitative Radiomics for High-Throughput Image-based Phenotyping. Radiology 2020, 295, 328–338. [Google Scholar] [CrossRef] [Green Version]
- Wang, S.; Dong, D.; Li, L.; Li, H.; Bai, Y.; Hu, Y.; Huang, Y.; Yu, X.; Liu, S.; Qiu, X.; et al. A Deep Learning Radiomics Model to Identify Poor Outcome in COVID-19 Patients With Underlying Health Conditions: A Multicenter Study. IEEE J. Biomed. Health Inform. 2021, 25, 2353–2362. [Google Scholar] [CrossRef]
- Ke, Z.; Li, L.; Wang, L.; Liu, H.; Lu, X.; Zeng, F.; Zha, Y. Radiomics analysis enables fatal outcome prediction for hospitalized patients with coronavirus disease 2019 (COVID-19). Acta Radiol. 2021, 63, 319–327. [Google Scholar] [CrossRef]
- Xiao, F.; Sun, R.; Sun, W.; Xu, D.; Lan, L.; Li, H.; Liu, H.; Xu, H. Radiomics analysis of chest CT to predict the overall survival for the severe patients of COVID-19 pneumonia. Phys. Med. Biol. 2021, 66, 10. [Google Scholar] [CrossRef]
- Shiri, I.; Sorouri, M.; Geramifar, P.; Nazari, M.; Abdollahi, M.; Salimi, Y.; Khosravi, B.; Askari, D.; Aghaghazvini, L.; Hajianfar, G.; et al. Machine learning-based prognostic modeling using clinical data and quantitative radiomic features from chest CT images in COVID-19 patients. Comput. Biol. Med. 2021, 132, 104304. [Google Scholar] [CrossRef]
- Wang, D.; Huang, C.; Bao, S.; Fan, T.; Sun, Z.; Wang, Y.; Jiang, H.; Wang, S. Study on the prognosis predictive model of COVID-19 patients based on CT radiomics. Sci. Rep. 2021, 11, 11591. [Google Scholar] [CrossRef]
- Li, C.; Dong, D.; Li, L.; Gong, W.; Li, X.; Bai, Y.; Wang, M.; Hu, Z.; Zha, Y.; Tian, J. Classification of Severe and Critical COVID-19 Using Deep Learning and Radiomics. IEEE J. Biomed. Health Inform. 2020, 24, 3585–3594. [Google Scholar] [CrossRef]
- Gamberini, L.; Coniglio, C.; Cilloni, N.; Semeraro, F.; Moro, F.; Tartaglione, M.; Chiarini, V.; Lupi, C.; Bua, V.; Gordini, G. Remodelling of a regional emergency hub in response to the COVID-19 outbreak in Emilia-Romagna. Emerg. Med. J. 2021, 38, 308. [Google Scholar] [CrossRef] [PubMed]
- Bettinelli, A.; Marturano, F.; Avanzo, M.; Loi, E.; Menghi, E.; Mezzenga, E.; Pirrone, G.; Sarnelli, A.; Strigari, L.; Strolin, S.; et al. A Novel Benchmarking Approach to Assess the Agreement among Radiomic Tools. Radiology 2022, 211604. [Google Scholar] [CrossRef] [PubMed]
- Van Rossum, G.A.D.; Fred, L. Python 3 Reference Manual; CreateSpace: Scotts Valley, CA, USA, 2009. [Google Scholar]
- Pedregosa, F.; Varoquaux, G.; Gramfort, A.; Michel, V.; Thirion, B.; Grisel, O.; Blondel, M.; Prettenhofer, P.; Weiss, R.; Dubourg, V.; et al. Scikit-learn: Machine learning in Python. J. Mach. Learn. Res. 2011, 12, 2825–2830. [Google Scholar]
- Lemaître, G.; Nogueira, F.; Aridas, C.K. Imbalanced-learn: A Python Toolbox to Tackle the Curse of Imbalanced Datasets in Machine Learning. J. Mach. Learn. Res. 2017, 18, 1–5. [Google Scholar]
- McKinney, W.A.O. Data Structures for Statistical Computing in Python. In Proceedings of the 9th Python in Science Conference, Austin, TX, USA, 28 June–3 July 2010; Volume 445, pp. 51–56. [Google Scholar]
- Harris, C.R.; Millman, K.J.; van der Walt, S.J.; Gommers, R.; Virtanen, P.; Cournapeau, D.; Wieser, E.; Taylor, J.; Berg, S.; Smith, N.J.; et al. Array programming with NumPy. Nature 2020, 585, 357–362. [Google Scholar] [CrossRef] [PubMed]
- Virtanen, P.; Gommers, R.; Oliphant, T.E.; Haberland, M.; Reddy, T.; Cournapeau, D.; Burovski, E.; Peterson, P.; Weckesser, W.; Bright, J.; et al. SciPy 1.0: Fundamental algorithms for scientific computing in Python. Nat. Methods 2020, 17, 261–272. [Google Scholar] [CrossRef] [Green Version]
- Fan, A.; Jernite, Y.; Perez, E.; Grangier, D.; Weston, J.; Auli, M. ELI5: Long Form Question Answering. arXiv 2019, arXiv:1907.09190. [Google Scholar]
- Hunter, J.D. Matplotlib: A 2D Graphics Environment. Comput. Sci. Eng. 2007, 9, 90–95. [Google Scholar] [CrossRef]
- Waskom, M.; Botvinnik, O.; O’Kane, D.; Hobson, P.; Lukauskas, S.; Gemperline, D.C.; Augspurger, T.; Halchenko, Y.; Cole, J.B.; Warmenhoven, J.; et al. Mwaskom/Seaborn: v0.8.1 (September 2017); Zenodo: Geneva, Switzerland, 2017. [Google Scholar]
- Tibshirani, R. Regression Shrinkage and Selection via the Lasso. J. R. Stat. Society. Ser. B 1996, 58, 267–288. [Google Scholar] [CrossRef]
- Tin Kam, H. Random decision forests. In Proceedings of the 3rd International Conference on Document Analysis and Recognition, Montreal, QC, Canada, 14–16 August 1995; Volume 271, pp. 278–282. [Google Scholar]
- Haykin, S. Neural Networks: A Comprehensive Foundation; Prentice Hall PTR: Lebanon, IN, USA, 1994. [Google Scholar]
- Chawla, N.; Bowyer, K.; Hall, L.; Kegelmeyer, W. SMOTE: Synthetic Minority Over-sampling Technique. J. Artif. Intell. Res. (JAIR) 2002, 16, 321–357. [Google Scholar] [CrossRef]
- Balacchi, C.; Brandi, N.; Ciccarese, F.; Coppola, F.; Lucidi, V.; Bartalena, L.; Parmeggiani, A.; Paccapelo, A.; Golfieri, R. Comparing the first and the second waves of COVID-19 in Italy: Differences in epidemiological features and CT findings using a semi-quantitative score. Emerg. Radiol. 2021, 28, 1055–1061. [Google Scholar] [CrossRef] [PubMed]
- Boulesteix, A.L.; Janitza, S.; Kruppa, J.; König, I.R. Overview of random forest methodology and practical guidance with emphasis on computational biology and bioinformatics. Wiley Interdiscip. Rev. Data Min. Knowl. Discov. 2012, 2, 493–507. [Google Scholar] [CrossRef] [Green Version]
- Bae, J.; Kapse, S.; Singh, G.; Gattu, R.; Ali, S.; Shah, N.; Marshall, C.; Pierce, J.; Phatak, T.; Gupta, A.; et al. Predicting Mechanical Ventilation and Mortality in COVID-19 Using Radiomics and Deep Learning on Chest Radiographs: A Multi-Institutional Study. Diagnostics 2021, 11, 1812. [Google Scholar] [CrossRef] [PubMed]
- Homayounieh, F.; Ebrahimian, S.; Babaei, R.; Mobin, H.K.; Zhang, E.; Bizzo, B.C.; Mohseni, I.; Digumarthy, S.R.; Kalra, M.K. CT Radiomics, Radiologists, and Clinical Information in Predicting Outcome of Patients with COVID-19 Pneumonia. Radiol. Cardiothorac. Imaging 2020, 2, e200322. [Google Scholar] [CrossRef]
- World Health Organization, Coronavirus Disease (COVID-19) Advice for the Public, Mythbusters. Available online: https://www.who.int/emergencies/diseases/novel-coronavirus-2019/advice-for-public/myth-busters (accessed on 10 March 2022).
- Manco, L.; Maffei, N.; Strolin, S.; Vichi, S.; Bottazzi, L.; Strigari, L. Basic of machine learning and deep learning in imaging for medical physicists. Phys. Med. 2021, 83, 194–205. [Google Scholar] [CrossRef]
- Santoro, M.; Strolin, S.; Paolani, G.; Della Gala, G.; Bartoloni, A.; Giacometti, C.; Ammendolia, I.; Morganti, A.G.; Strigari, L. Recent Applications of Artificial Intelligence in Radiotherapy: Where We Are and Beyond. Appl. Sci. 2022, 12, 3223. [Google Scholar] [CrossRef]
- Varghese, B.A.; Shin, H.; Desai, B.; Gholamrezanezhad, A.; Lei, X.; Perkins, M.; Oberai, A.; Nanda, N.; Cen, S.; Duddalwar, V. Predicting clinical outcomes in COVID-19 using radiomics on chest radiographs. Br. J. Radiol. 2021, 94, 20210221. [Google Scholar] [CrossRef]

| Variables | Median (Min–Max) |
|---|---|
| Age (years) | 68.5 (21–99) |
| Respiratory rate (Breaths/m) | 20 (10–98) |
| Days of hospitalization | 13 (0.25–99) |
| Yes N (%)—No N (%) | |
| Hypertension | 241 (55.3%)—195 (44.7%) |
| History of smoking | 347 (79.5%)—89 (20.5%) |
| Obesity | 363 (83.3%)—73 (16.7%) |
| Sex | Male 286 (65.6%)—Female 150 (34.4%) |
| Fever | 251 (57.6%)—185 (42.4%) |
| Lung Consolidation | 225 (51.6%)—211 (48.4%) |
| Ground Glass Opacity (GGO) | 382 (87.6%)—54 (12.4%) |
| Crazy Paving | 336 (77.1%)—100 (22.9%) |
| Bilateral involvement | 403 (92.4%)—33 (7.6%) |
| Model Name | Training AUC | Testing AUC | Sens | Spec | |
|---|---|---|---|---|---|
| Random Forest classifier | Clinical | 0.98 ± 0.01 | 0.63 ± 0.09 | 44% | 83% |
| Radiomic | 1.00 ± 0.01 | 0.64 ± 0.08 | 41% | 86% | |
| Radiological | 0.93 ± 0.01 | 0.49 ±0.07 | 19% | 79% | |
| All | 1.00 ± 0.01 | 0.67 ± 0.11 | 44% | 88% | |
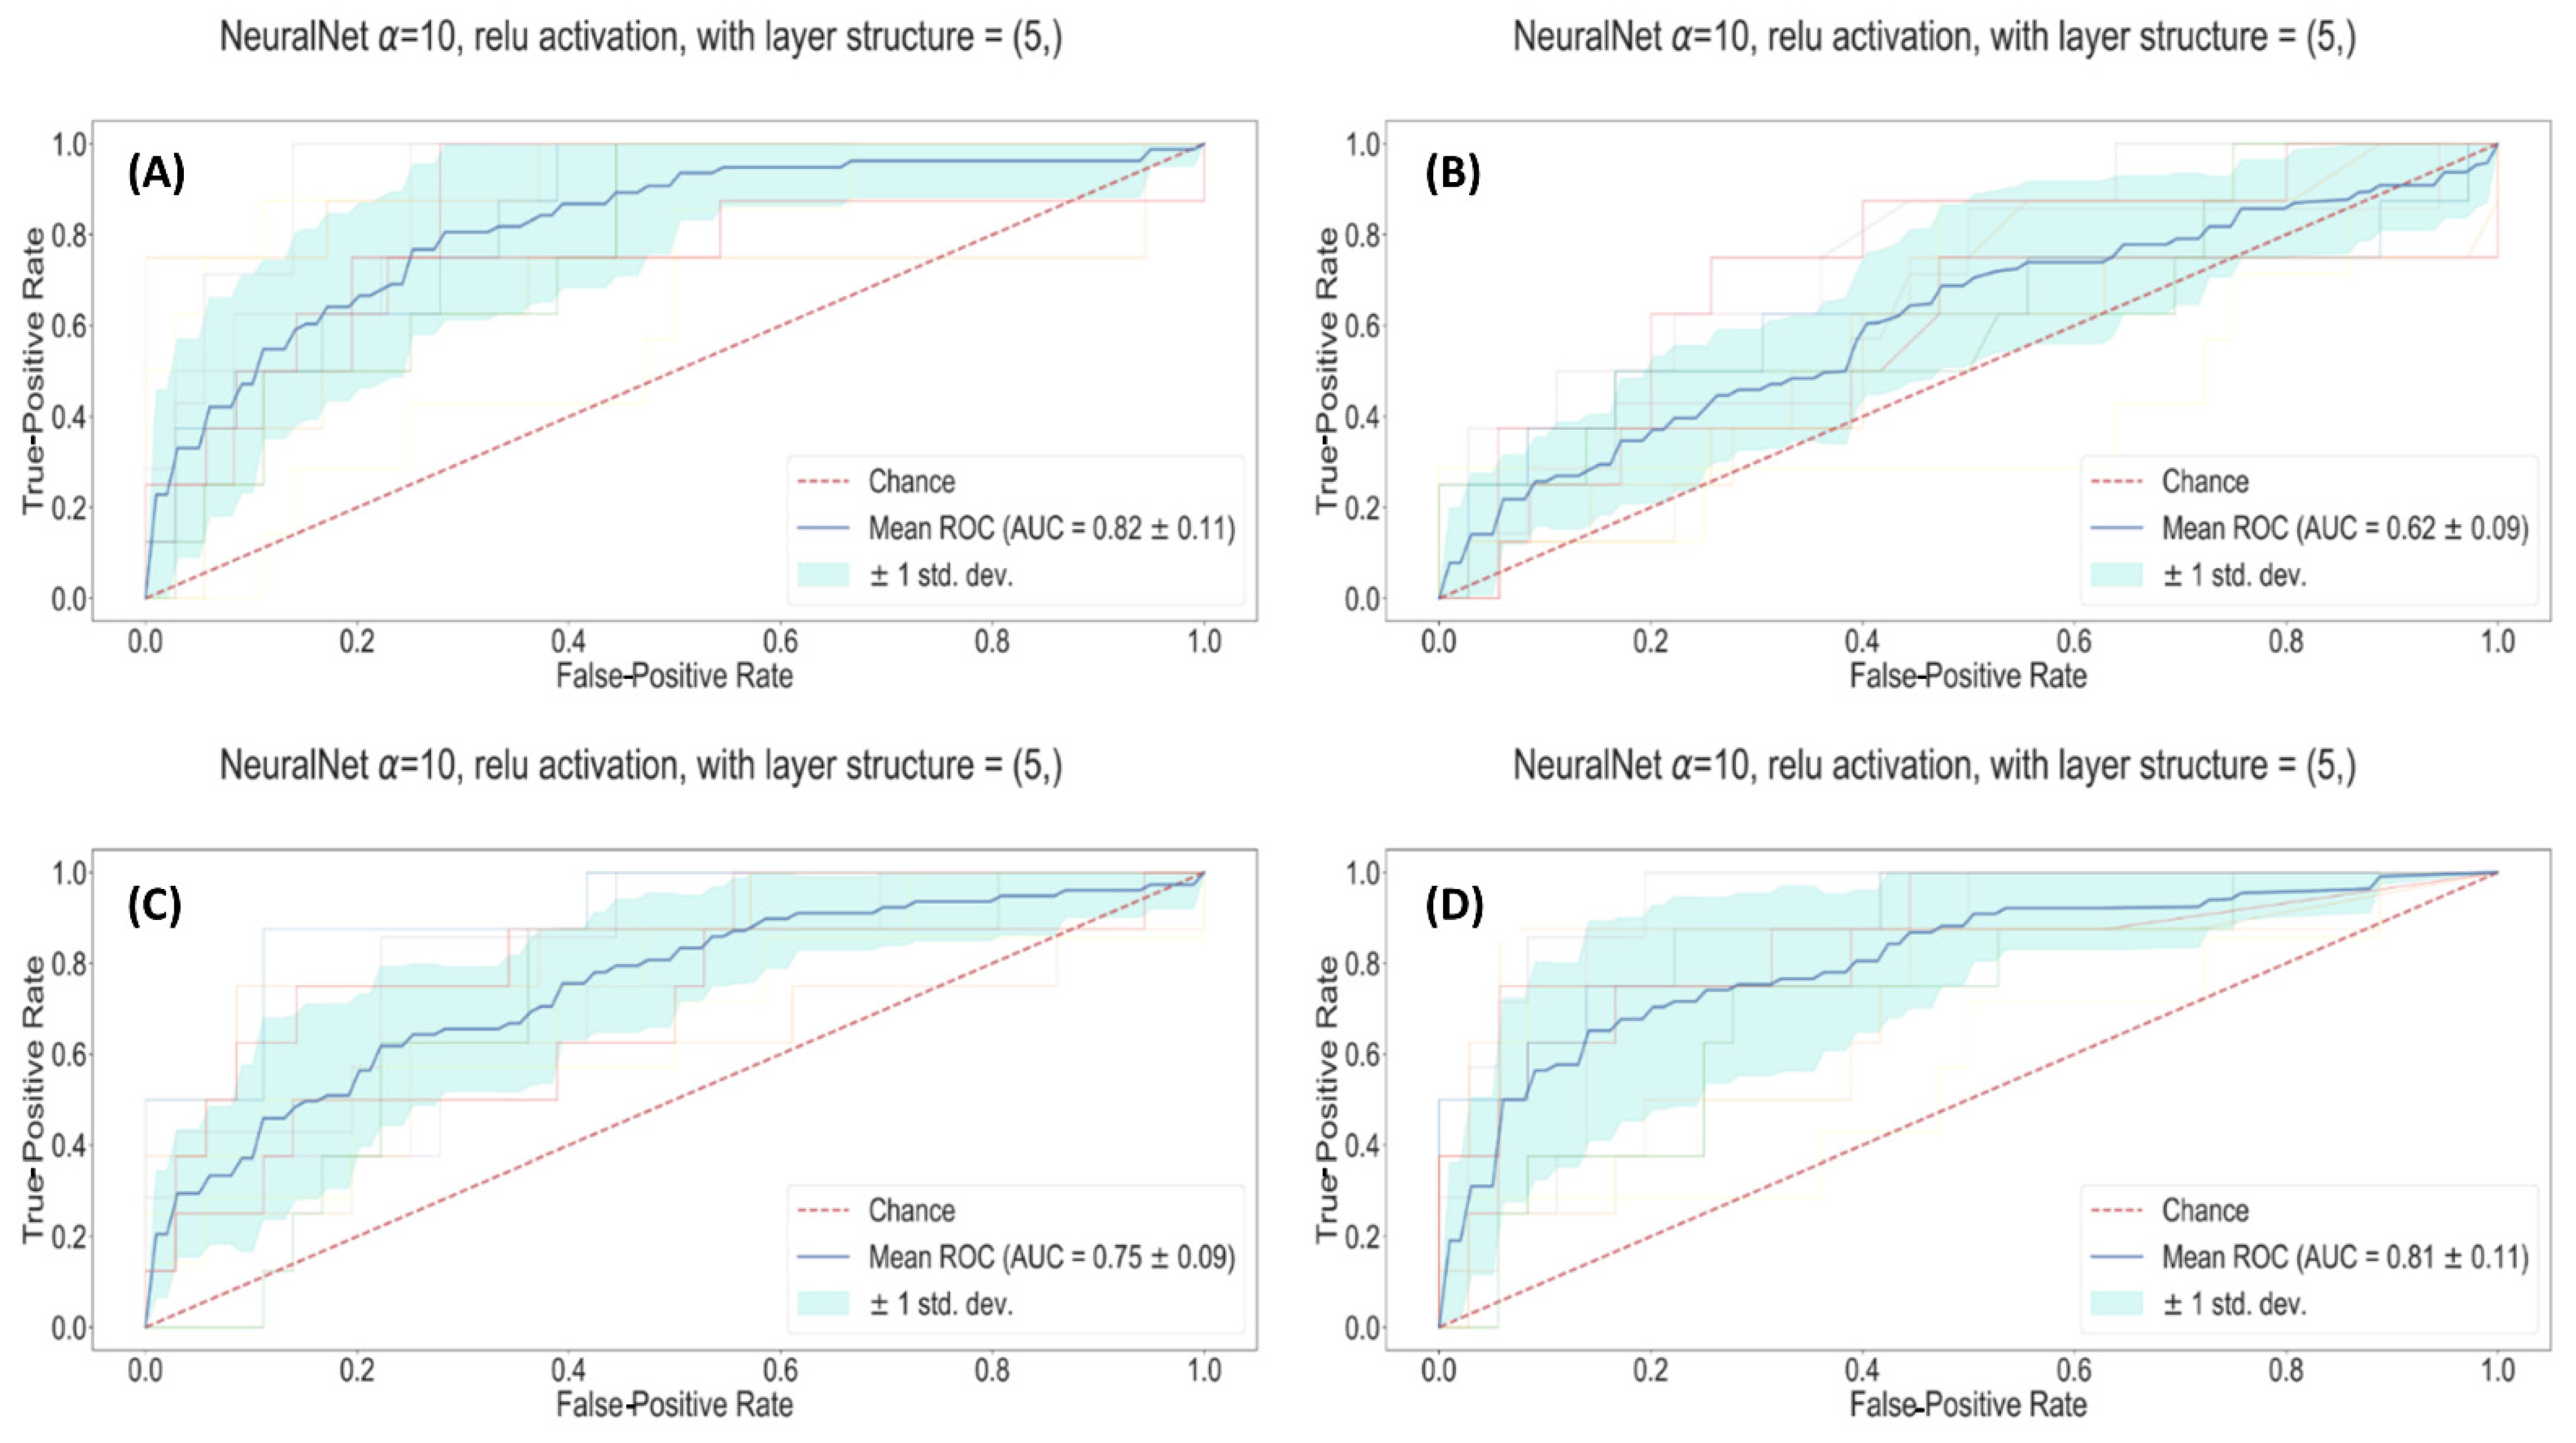
| Fully connected Neural Network | Clinical | 0.82 ± 0.11 | 0.82 ± 0.01 | 76% | 75% |
| Radiomic | 0.83 ± 0.09 | 0.75 ± 0.01 | 77% | 64% | |
| Radiological | 0.69 ± 0.09 | 0.62 ± 0.02 | 63% | 56% | |
| All | 0.91 ± 0.11 | 0.81 ± 0.01 | 69% | 83% | |
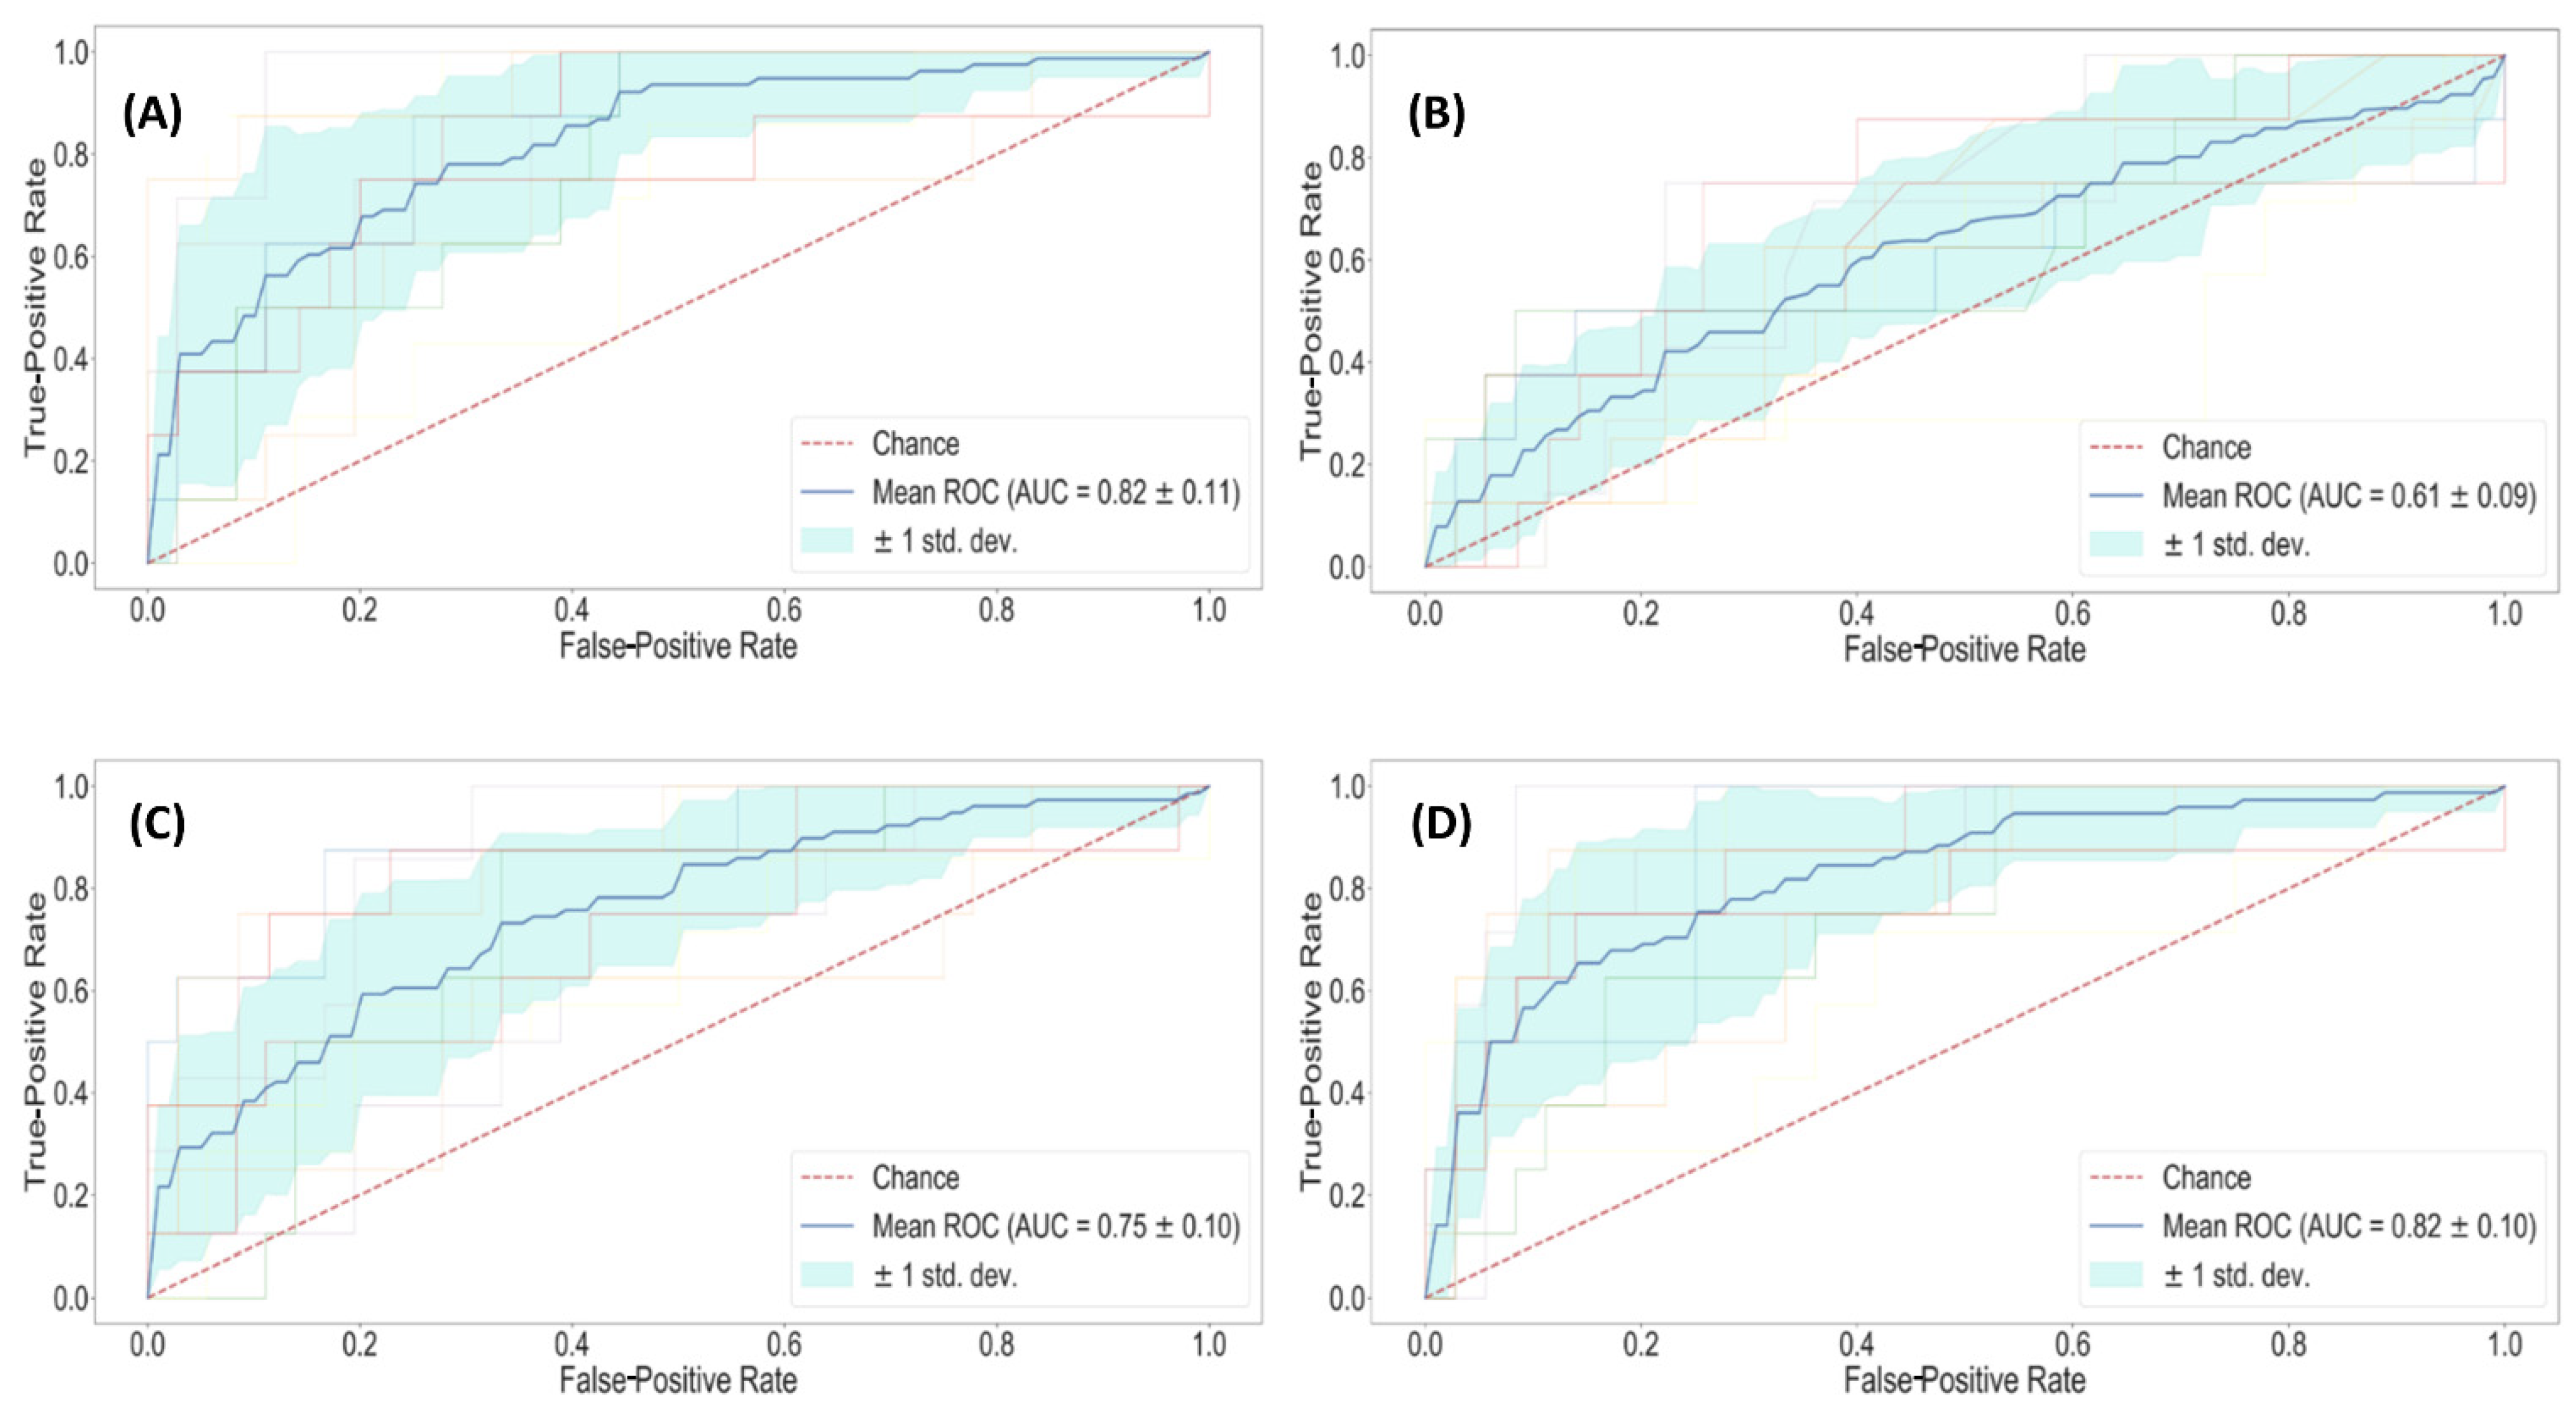
| Lasso regularized classifier | Clinical | 0.84 ± 0.01 | 0.82 ± 0.11 | 69% | 83% |
| Radiomic | 0.81 ± 0.01 | 0.75 ± 0.10 | 64% | 78% | |
| Radiological | 0.67 ± 0.01 | 0.61 ± 0.09 | 70% | 51% | |
| All | 0.88 ± 0.01 | 0.82 ± 0.10 | 85% | 68% |
| Model Name | Relevant Features (Coefficient) |
|---|---|
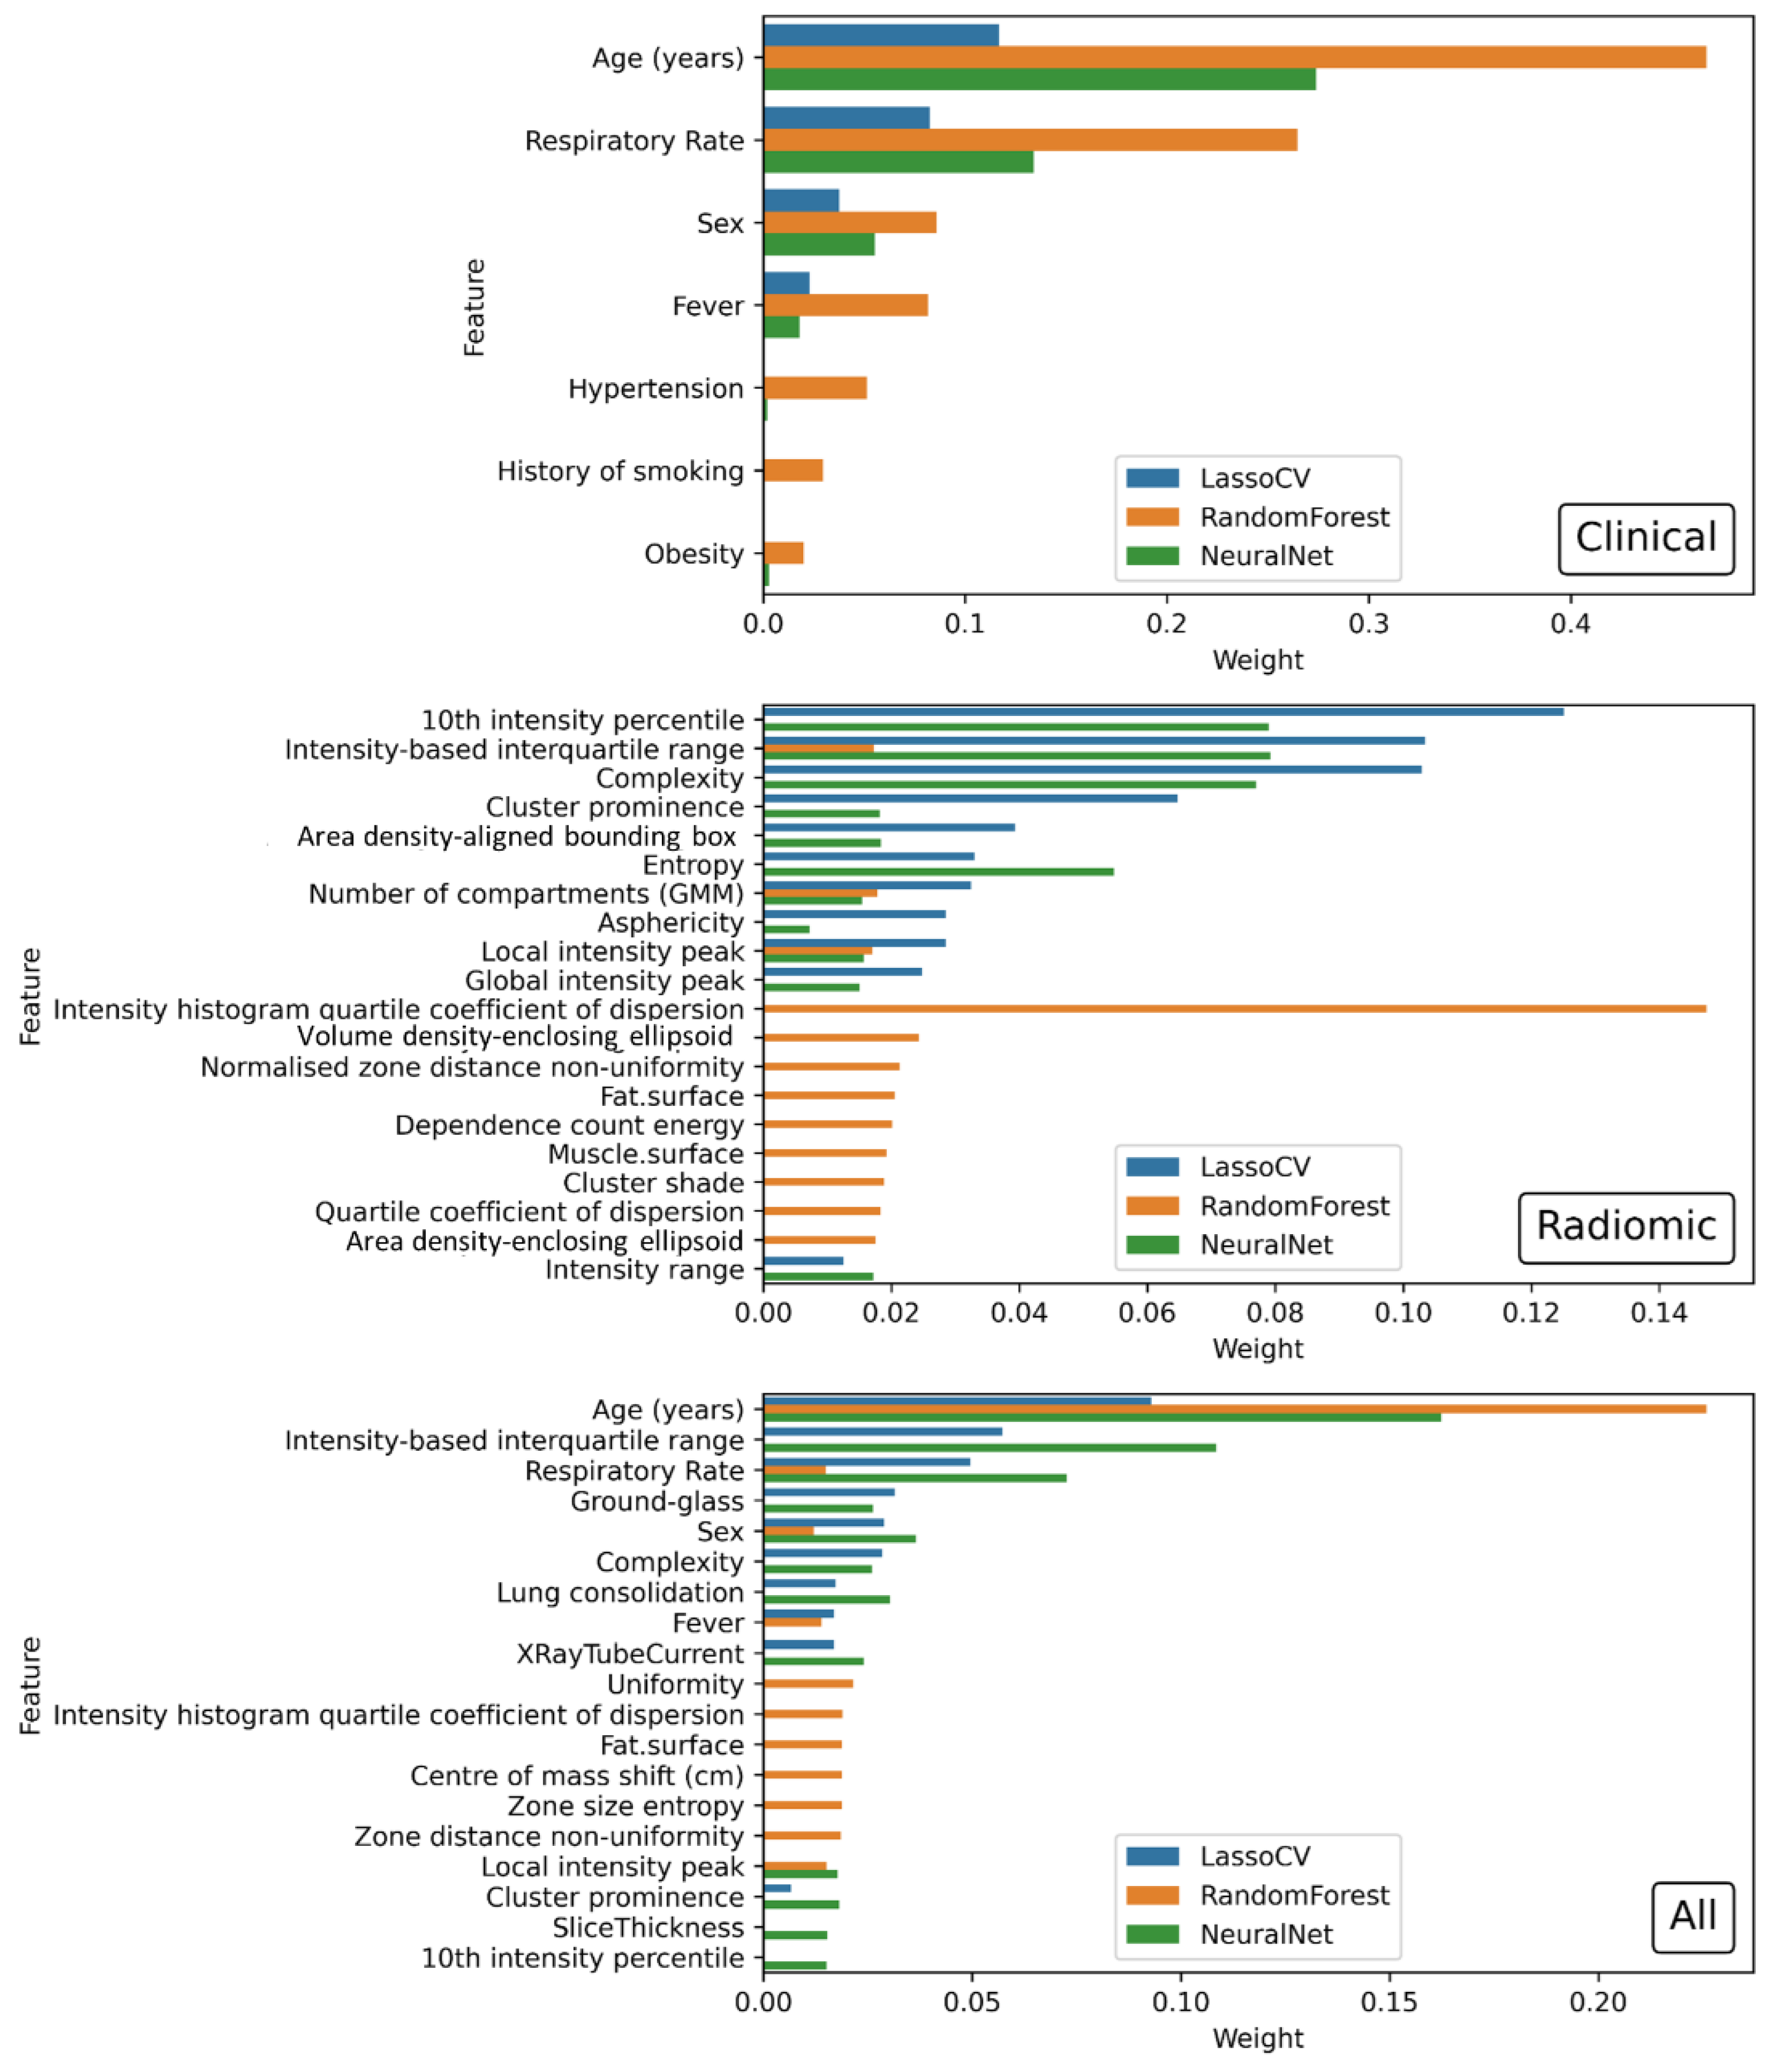
| Clinical | Age (years) (0.116771), Respiratory Rate (0.082292), Sex (−0.037591), Fever (−0.022923) |
| Radiomic | 10th intensity percentile (−0.125094), Intensity-based interquartile range (0.103349), Complexity (−0.102924), Cluster prominence (−0.064690), Area density-aligned bounding box (−0.039374), Entropy (0.033002), Number of compartments (GMM) (−0.032441), Asphericity (0.028517), Local intensity peak (0.028478), Global intensity peak (−0.024832), Intensity range (0.012509), Fat surface (0.007267) |
| Radiological | Ground-glass opacity (−0.043875), Lung consolidation (0.038143), X-ray Tube Current (−0.017264), kVp (0.004995) |
| All | Age (years) (0.092963), Intensity-based interquartile range (0.057260), Respiratory Rate (0.049603), Ground-glass opacity (−0.031423), Sex (−0.028895), Complexity (−0.028606), Lung consolidation (0.017272), Fever (−0.016933), X-ray Tube Current (−0.016908), Area density—aligned bounding box (−0.009676), Cluster prominence (−0.006663), Fat surface (0.004984), Number of compartments (GMM) (−0.001448), Local intensity peak (0.000195) |
Publisher’s Note: MDPI stays neutral with regard to jurisdictional claims in published maps and institutional affiliations. |
© 2022 by the authors. Licensee MDPI, Basel, Switzerland. This article is an open access article distributed under the terms and conditions of the Creative Commons Attribution (CC BY) license (https://creativecommons.org/licenses/by/4.0/).
Share and Cite
Spagnoli, L.; Morrone, M.F.; Giampieri, E.; Paolani, G.; Santoro, M.; Curti, N.; Coppola, F.; Ciccarese, F.; Vara, G.; Brandi, N.; et al. Outcome Prediction for SARS-CoV-2 Patients Using Machine Learning Modeling of Clinical, Radiological, and Radiomic Features Derived from Chest CT Images. Appl. Sci. 2022, 12, 4493. https://doi.org/10.3390/app12094493
Spagnoli L, Morrone MF, Giampieri E, Paolani G, Santoro M, Curti N, Coppola F, Ciccarese F, Vara G, Brandi N, et al. Outcome Prediction for SARS-CoV-2 Patients Using Machine Learning Modeling of Clinical, Radiological, and Radiomic Features Derived from Chest CT Images. Applied Sciences. 2022; 12(9):4493. https://doi.org/10.3390/app12094493
Chicago/Turabian StyleSpagnoli, Lorenzo, Maria Francesca Morrone, Enrico Giampieri, Giulia Paolani, Miriam Santoro, Nico Curti, Francesca Coppola, Federica Ciccarese, Giulio Vara, Nicolò Brandi, and et al. 2022. "Outcome Prediction for SARS-CoV-2 Patients Using Machine Learning Modeling of Clinical, Radiological, and Radiomic Features Derived from Chest CT Images" Applied Sciences 12, no. 9: 4493. https://doi.org/10.3390/app12094493
APA StyleSpagnoli, L., Morrone, M. F., Giampieri, E., Paolani, G., Santoro, M., Curti, N., Coppola, F., Ciccarese, F., Vara, G., Brandi, N., Golfieri, R., Bartoletti, M., Viale, P., & Strigari, L. (2022). Outcome Prediction for SARS-CoV-2 Patients Using Machine Learning Modeling of Clinical, Radiological, and Radiomic Features Derived from Chest CT Images. Applied Sciences, 12(9), 4493. https://doi.org/10.3390/app12094493