Abstract
To remedy the defects of conventional pneumatic ABS (anti-lock Braking system) controller testing equipment for commercial vehicles, such as low efficiency and difficult testing condition configurations, a workflow was proposed based on the unit integration test mode. The relationship among the operation logic of the ABS valves, test conditions, and wheel speed was derived through the simulation of a multi-condition configuration. Then, a wheel speed simulation model was set up by taking the test conditions as inputs, and it was implanted into an embedded control unit. Next, the hardware module and the underlying drivers as well as an application algorithm for the application layer were designed. A prototype of the EOL (end-of-line) test system was built. The test results show that the prototype can not only achieve a rapid test condition configuration and accurate fault location but that it can also meet the requirements for test efficiency.
1. Introduction
The end-of-line (EOL) test for pneumatic anti-lock braking system (ABS) controllers refers an operation logic test for ABS valves at the end of the production line. It is especially designed for the rapid function verification of assembled pneumatic ABS controllers and to verify the quality traceability of controller products. At present, most EOL test equipment for pneumatic ABS controllers is set up on platforms such as dSPACE or IPG/TruckMaker [1,2], which mainly provide the simulated wheel speed. ZHANG W et al. used a servo motor to simulate wheel rotation and integrated the real ring gear and wheel speed sensor into a pneumatic ABS hardware-in-the-loop system, improving the dynamic response capability of the wheel speed signal and simulating the rapid changes in the wheel speed [3]. Xiong Y et al. used the V/F board to send simulated wheel speed signals to a pneumatic ABS controller that was based on the wheel speed simulated by a vehicle braking model and improved the pneumatic ABS controller test system [4]. Zheng H Y et al. designed a hardware-in-the-loop platform for the fault diagnosis and fatigue testing of pneumatic ABS controllers based on open-loop and closed-loop testing methods [5]. Shen C Y added a vehicle control mechanism and a steering feedback mechanism to the pneumatic ABS hardware-in-the-loop system that improved the authenticity of the hardware-in-the-loop system [6]. Yang S C established a vehicle braking model based on TruckSim and ran it through the LabVIEW real-time simulation system, and the system can interact with an ABS controller to conduct the hardware-in-the-loop test [7]. Montani M et al. completed the development and testing of three types of ABS, where vehicle acceleration, velocity, and longitudinal slip were controlled by a PID-based Simulink model, and the testing was carried out through a hardware-in-the-loop system [8].
Due to the high cost of equipment procurement and complex testing processes [9], the ABS test systems mentioned above are mainly designed for model verification and not for batch production. Therefore, it is crucial to develop a special and efficient pneumatic ABS controller EOL test system for commercial vehicles. In this paper, a prototype of the EOL test system has been built to meet batch production requirements.
In order to standardize the EOL testing process of pneumatic ABS controllers, the mechanism of the EOL test was investigated in this paper as well as the relationship among ABS valve operation logic, test conditions, and wheel speed. A test workflow was proposed based on the unit integration test mode, according to the recommended test conditions. Moreover, a vehicle wheel speed simulation model was built and coded into the embedded system. The function verification of the EOL test system was carried out through a simulated fault injection test.
2. EOL Test Scheme Establishment
The pneumatic ABS controller is a core component in electronic-controlled pneumatic braking systems. It can be divided into a software algorithm layer and hardware execution layer, as illustrated in Figure 1.
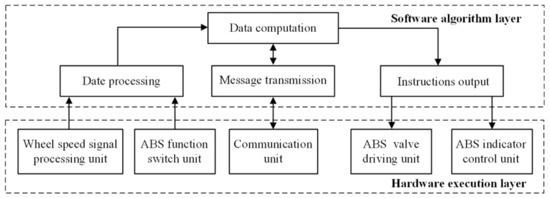
Figure 1.
Framework of a pneumatic ABS controller.
During the braking process, the speed signal monitored by the wheel speed sensor is sent to the controller in real-time. After being processed by the conditioning circuit, the speed signal is utilized to judge the wheel rotation state and to calculate the slip ratio using a special algorithm. If the detected wheel slip ratio exceeds the safety threshold, then the driving unit of the controller will output pulse-width modulation (PWM) signals. The PWM signals will be shaped and amplified to drive the ABS valve to adjust the braking pressure.
To verify the functions of the hardware execution layer and to quickly locate fault units under simulated operating environments, the EOL test system should be able to simulate the recommended test conditions (Table 1) and realize the rapid test condition configuration.

Table 1.
Recommended test conditions in GB13594-2003.
According to IEEE24765 [10] and ISO26262 [11], the EOL test will verify the functions of each unit and carry out integration test for all units. Thus, the EOL test route was designed based on the unit integration test mode.
During the unit testing process, communication verification between the test system and the controller was first implemented through the handshake protocol [12,13]. After the communication unit had been qualified, the simulated wheel speed was generated according to the parameters of the target vehicle and the configured test conditions. Then, it was sent to the controller. After being processed, the wheel speed data feedback was sent to the test system through the CAN (Controller Area Network) bus. Thus, the function of the wheel speed signal processing unit could be verified by comparing the data before and after transmission. Specific control instructions were generated according to the difference, and they were then sent to the corresponding units, i.e., the ABS valve drive unit, ABS switch function unit, and ABS indicator light control unit. The test system would check whether the output values were consistent with the expected ones.
In the next stage, a functional integration test was carried out on the drive unit, the wheel speed processing unit, and the ABS switch function unit. Under simulated operation environments, the EOL test system output simulated wheel speed signals for the ABS controller as well as ABS valve theoretical drive signals for later comparisons. The functions of the ABS controller were verified by comparing the actual drive signals generated by the ABS controller with theoretical ones. The optimized EOL test workflow is shown in Figure 2.
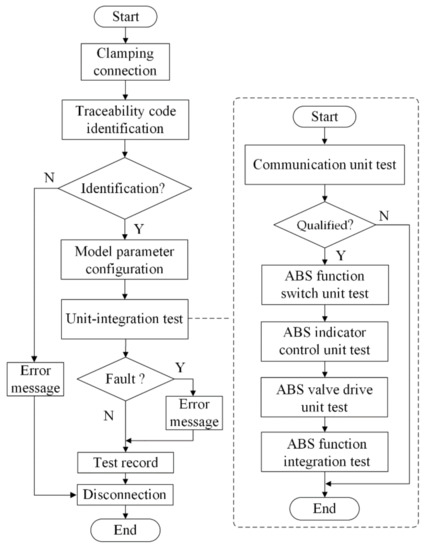
Figure 2.
Workflow of the EOL test.
As shown in Figure 3, the designed EOL test system mainly includes hardware modules and embedded programs.
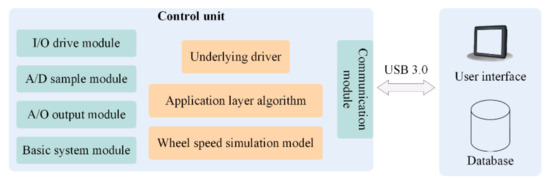
Figure 3.
Framework of an EOL test system for a control unit.
In the control unit, the I/O driver module outputs specific control signals; the A/D sampling module is responsible for collecting test signals; the A/O output module is used for the reoccurrence of the analog wheel speed signals; and the basic system module supplies an embedded hardware platform for the EOL test system, while the communication module supplies multiple communication interfaces that can support protocols such as CAN, K-line, RS232, and USB 3.0.
The underlying driver is responsible for receiving instructions from the application layer to drive the hardware module. The wheel speed simulation model is responsible for generating corresponding wheel speed data according to the vehicle parameters and configured test conditions.
3. Wheel Speed Simulation
3.1. Wheel Speed Simulation Model
The wheel speed simulation model is the basis for generating wheel speed signals and ABS valve theoretical drive signals under specific test environments. In order to derive the relationship among the test conditions, the wheel speed, and ABS valve operation logic, a wheel speed simulation model was built based on vehicle dynamics and the working principles of the pneumatic ABS system. The test conditions were used as inputs, while the wheel linear velocity and ABS valve operation logic acted as outputs. The wheel speed simulation model is shown in Figure 4.
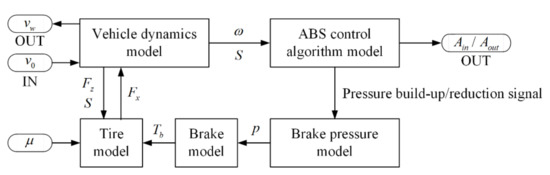
Figure 4.
Structure of wheel speed simulation model.
As the test conditions proposed in this paper all belong to linear braking conditions, the lateral motion, the yaw motion, and the roll motion of the vehicle were not considered when establishing the dynamic equations. The aerodynamic force was also ignored. The vehicle’s motion equation can be obtained by force analysis, which is expressed as follows:
where (kg) is the mass of the whole vehicle, (m·s−2) is the acceleration of the vehicle, and (i = 1, 2, 3, 4) (N) is the longitudinal force of each tire.
The moment balance of the wheel rotation is as follows:
where (N·rad−1) is the moment of inertia, (N·m) is the braking torque of each wheel, (rad/s) is the angular velocity of each wheel, and (m) is the effective radius of the wheel.
During the braking process, the vertical load of each wheel changes due to acceleration. Considering the influence of vertical load transfer, the vertical load of each wheel can be defined as follows:
where (N) and (N) are the vertical loads of each wheel, (N) is the change in the vertical reaction, and (m) and (m) are the distance from front and rear axle to centroid.
It is assumed that the road surface is ideal, i.e., there is no horizontal deformation or normal ground deformation. According to the magic formula [14], the relationship between the slip rate and tire longitudinal force can be expressed as follows:
where is the road adhesion coefficient, is the slip rate, and is the vertical load.
The tire force data can be obtained by IPG/TruckMaker. The coefficients in the mathematical model of the tire force are obtained by fitting them as seen below:
The coefficients in Equation (5) are shown in Table 2.
Table 2.
Coefficients of the longitudinal force formula.
Since the braking torque lag has little effect on the EOL test system, the brake model can be obtained by ignoring it. The model can be expressed as:
where is the efficiency coefficient from brake chamber to brake, (Pa) is the pressure of chamber, (m2) is the brake area, (m) is the effective brake radius, is the friction coefficient, and is the brake efficiency coefficient.
System identification [15] is a method for establishing the mathematical mode according to the input–output relationship of a dynamic system. The most commonly used identification methods include the step response method and frequency response method. Since the change trend in the former curve is consistent with that of the braking pressure dynamic response curve, they can be adopted to establish the braking pressure identification model. The pressure–time model of the step-up process and step-down process is shown in Equations (7) and (8):
where (Pa) is the braking pressure at the current moment; (Pa) is the braking pressure at the previous moment; (Pa) is the maximum braking pressure of the brake system; is time constant, which is obtained by orthogonal test; and is the sample time.
To analyze pressure regulation characteristics of the identification model, a test bench was built. As shown in Figure 5, a dSPACE real-time system, an air tank, and an ABS valve were included in the test bench. Furthermore, the pressure of the air tank was regulated to 400, 500, and 600 kPa. The braking pressure was characterized by the inlet pressure of the brake chamber measured by the dSPACE real-time system. By controlling the operation logic of the ABS valve, the braking pressure started to increase at 0 s and decrease at 2 s. Through the fitting parameters of the identification model, the value of the time constant of the pressure build-up process and the time constant of the pressure reduction process were 0.17 and 0.12, respectively.
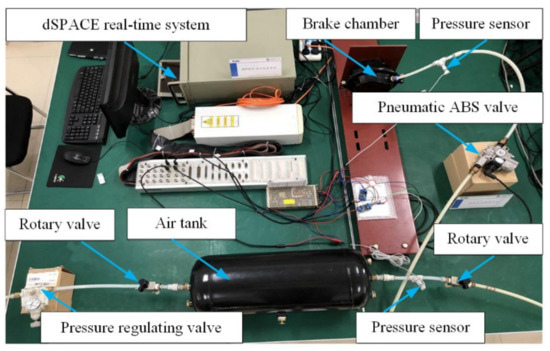
Figure 5.
Test bench for braking pressure.
As shown in Figure 6, the braking pressure curve simulated by the identification model is basically consistent with the test curve. Due to the volume change caused by the deformation of the elastic diaphragm in the brake chamber, the deviation of the two curves was slightly larger during pressurization. Therefore, there is an instantaneous pressure holding process in the test curve during pressurization, and the deviation has little influence on the wheel speed simulation model built in this paper. Thus, the identification model obtained can be used to characterize braking pressure.
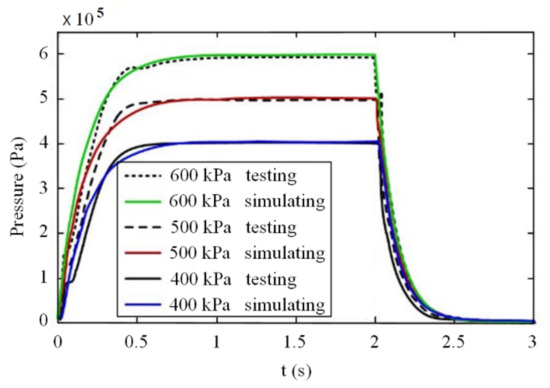
Figure 6.
Verification of the simulation model for the pressure regulation characteristics.
3.2. Configuration of Vehicle Parameters and Test Conditions
A wheel speed simulation model was built based on the theoretical one. Taking the pneumatic ABS controller of a two-axle commercial vehicle as the test object, the vehicle parameters and test conditions were configured in the wheel speed simulation model. The parameters of the commercial vehicle are shown in Table 3.
Table 3.
Parameters of a two-axle commercial vehicle.
According to the requirements stated in GB13594-2003 regarding the road adhesion coefficient and maximum speed, four recommended test conditions were designed, as shown in Table 4.
Table 4.
Recommended test conditions and parameters.
3.3. Analysis of Simulation Results
The initial braking speed and the road adhesion coefficient were set according to the recommended test conditions. The theoretical relationships among test conditions, wheel speed, and ABS valve operation logic were obtained by simulation.
Figure 7 shows that left wheels of the first and second axle are on the high-adhesion road and that the number of ABS cycles during braking is lower. The right wheels of the first and second axle on the low-adhesion road are more sensitive to the braking pressure, and there are more ABS cycles. The simulation results show that the changing curve of the wheel speed and the braking pressure during braking conform to the characteristics of vehicle motion under the corresponding operating conditions and is extremely close to the actual ABS braking effect. Thus, the wheel speed simulation model can be coded into an embedded system [16,17], and the ABS valve operation logic obtained from the simulation can be utilized as the theoretical basis for verifying the correctness of the real control logic of the ABS valve.
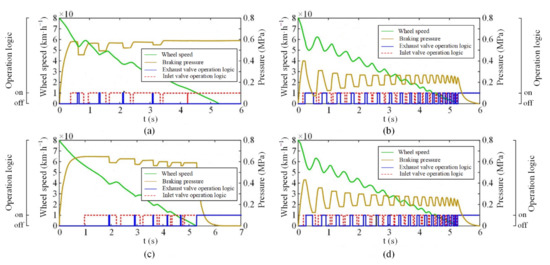
Figure 7.
Simulation results of wheel speed simulation model on bisectional road: (a) first axle left wheel; (b) first axle right wheel; (c) second axle left wheel; (d) second axle right wheel.
4. Development and Functional Verification of EOL Test System
4.1. Hardware Design
The hardware framework of the control unit was designed with an ARM MK20 series microprocessor as the embedded control core, as shown in Figure 8.
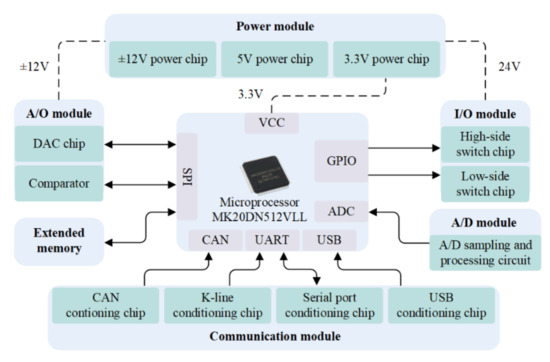
Figure 8.
Hardware framework of the control unit.
The microprocessor integrates the GPIO (General-purpose Input/Output), ADC (Analog-to-Digital Converter), UART (Universal Asynchronous Receiver/Transmitter), and other peripheral interfaces, in which the GPIO is connected to a high-side switch chip and low-side switch chip to realize the input and output of the digital signals. The ADC is connected to a sampling circuit to collect the voltage analog signal, and the analog signal is transformed by an external signal conditioning module. The SPI (Serial Peripheral Interface) is connected to extended memory and a DAC (Digital-to-Analog Converter), which is controlled by the output analog signal to simulate the wheel speed sensor signal. The UART is connected to a serial port conditioning chip and a K-line conditioning chip to realize the serial communication and K-line communication, respectively.
The drive signal of the ABS valve and control signals of the ABS indicator are sampled by an ADC module integrated with a microprocessor MK20DN512. The analog wheel speed signal is generated by the DAC chip, and the comparator is used to amplify analog signal until it can be recognized by the controller. The Switch signal of the ABS function is generated by the high-side switch chip.
4.2. Development of Embedded Program
In order to simplify the program structure and to improve the running efficiency of the program, the modular programming method was adopted to design a control unit program for the EOL test system, and the key parameters were set as global variables. The control unit program mainly includes the application layer algorithm and the underlying drivers, as shown in Figure 9.
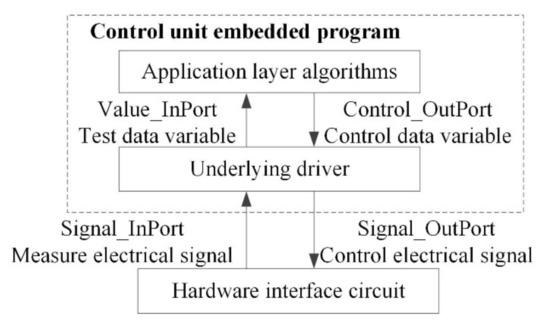
Figure 9.
Structural relationships of embedded programs.
The underlying driver can achieve the initialization of the embedded control core, the driving of I/O signals, voltage signal acquisition, SPI communication, and other functions. The application layer algorithm, which mainly includes the timing control function and wheel speed signal output function, is a crucial module for data processing and automatic function execution. The timing control function enables the test system to execute the testing process conforming to the EOL workflow, and the wheel speed signal output function can generate a simulated signal with reference to the wheel speed data from the simulation model.
The underlying driver is responsible for the information interaction between the application layer and the control unit [18]. The state electrical signal in the EOL test process can be detected by the hardware interface circuit. It is provided to the underlying driver, and it is converted into variables that can be identified by the application layer algorithm. After the data is processed by the application layer algorithm and the logical operation is executed, the target values of the variables are formed, and the hardware interface circuit is controlled by electrical signals from the underlying layer.
4.3. Prototype Construction
A prototype of the EOL test system is shown in Figure 10 and mainly includes a pneumatic automatic fixture, a programmable power supply, and a barcode scanner. The pneumatic automatic fixture is used to realize the positioning and clamping of the pneumatic ABS controller and its automatic docking with test interface. The programmable power supply can adapt to different types of products. The barcode scanner can achieve product traceability by identifying the controller’s traceability code.
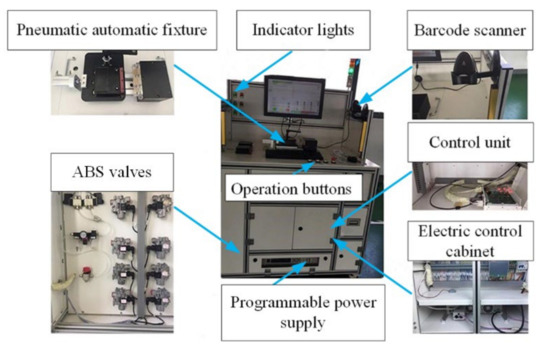
Figure 10.
The prototype of the EOL test system for a pneumatic ABS controller.
The user interface of the EOL test system was designed using C# [19], and test results are visually displayed by indicator lights. The system can customize the initial braking speed and road adhesion coefficient according to the actual test object.
4.4. Multi-Condition EOL Test and Verification
To verify the testing effect of the EOL test system under multiple operating conditions, eight samples from three types of commercial vehicle pneumatic ABS controllers were selected as the test objects, and five of them were injected with simulated faults by removing the solder onto the corresponding pins. The traceability code of the controller and the simulated faults are presented in Table 5.
Table 5.
Record of initial faults of controllers.
The developed EOL test system was deployed at the end of the production line, and EOL tests were carried out under different test conditions. The controller with the traceability code 6,936,281,408,300 was taken as the sample. A bisectional road was selected as the test condition. The functions of the ABS controller integration testing were judged by collecting the operation logic of the ABS valves.
As shown in Figure 11, the solid and dotted line represents the theoretical and the actual measured operation logic, respectively. It is obvious that the theoretical operation logic of the ABS valve is in good agreement with the actual operation logic. The correctness of the operating condition configuration function of the EOL test system was verified. Moreover, the fault codes of all eight controllers are consistent with experimental expectations. Thus, the fault location can be successfully achieved.
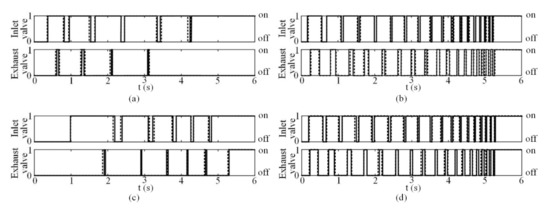
Figure 11.
Results of ABS valve operation logic test on bisectional road: (a) first axle left wheel; (b) first axle right wheel; (c) second axle left wheel; (d) second axle right wheel.
5. Discussion
The evaluation index of the test efficiency is defined according to number of the controllers tested per hour. The calculation formula is as follows:
where is the number of products tested in a single production line; is the qualification rate; is the re-sampling rate; and (h) is the working hours.
Based on production data of the three similar-scale manufacturers, the number of pneumatic ABS controllers tested in a single production line per day was about 1500, and 8 working hours were tested per day. After all of the controller products were inspected, a sampling inspection was carried out at the rate of 5%. was determined to be more than 196 per hour, which can be calculated by Equation (9).
In order to further verify the actual work efficiency of the EOL test system, a field test scheme was designed that could adapt to the working hours of general enterprises. Each EOL test system ran for 4 h, and the test items were implemented six times. The number of tested controllers was recorded, as shown in Table 6.
Table 6.
Record of test quantity.
The average test efficiency of the EOL test system expressed by is 239 per hour, which can meet field requirements for the test efficiency of pneumatic ABS controllers.
6. Conclusions
In this paper, the workflow of an EOL test based on the unit integration test mode was optimized through the investigation on the EOL test mechanism. Based on the recommended operating conditions and step response method, the corresponding wheel speed simulation model was established. Moreover, the relationship among operation conditions, wheel speed, and ABS valve operation logic was obtained. Then, the EOL test system was designed, which removed the dependency on the wheel speed reproduction device, and theoretical operation logic of the ABS valve was in good agreement with the measured results. Finally, the fault injection test ensures the correctness of results of the EOL test system; the field tests showed that the average test efficiency of the EOL test system is 239 per hour, so the operation efficiency can meet the actual demands of batch production for pneumatic ABS controllers.
Author Contributions
Conceptualization, J.X.; data curation, Q.X.; methodology, J.X.; project administration, G.L.; writing—review and editing, J.X. and G.L. All authors have read and agreed to the published version of the manuscript.
Funding
This research received no external funding.
Conflicts of Interest
The authors declare no conflict of interest.
References
- Hao, R.; Zhao, X.; Zhou, Z. Bench Detection and Road Comparison Test for Auto Anti-lock Braking System. Trans. Chin. Soc. Agric. Mach. 2013, 44, 21–26. [Google Scholar]
- Xu, J.; Li, W.; Dong, J.; Zhai, J. Design of a hardware-in-loop test bench for air ABS. Res. Explor. Lab. 2017, 36, 90–93. [Google Scholar]
- Zhang, W.; Ding, N.; Chen, M.; Yu, G.; Xu, X. Development of a Low-cost Hardware-in-the-loop Simulation System as a Test Bench for Anti-lock Braking System. Chin. J. Mech. Eng. 2011, 24, 98–104. [Google Scholar] [CrossRef]
- Xiong, Y.; Li, X.; He, Y.; Wu, M.; Long, Y. Design and application of testing system for pneumatic ABS ECU. In Proceedings of the 11th World Congress on Intelligent Control and Automation, Shenyang, China, 29 June–4 July 2014; pp. 3612–3617. [Google Scholar]
- Zheng, H.Y.; Zong, C.F.; Zhao, W.Q.; Chen, L. HILS Test Bench Based on Open and close Loop Test for Air ABS System. In Advanced Materials Research; Trans Tech Publications: Freienbach, Switzerland, 2013; pp. 1484–1487. [Google Scholar]
- Shen, C.Y. Development of HIL Test Bench for Pneumatic ABS and Vehicle Attitude Warning Device. Master’s Thesis, Jilin University, Jilin, China, 2012. [Google Scholar]
- Yang, S.C. Research on Test and Evaluation Method of Pneumatic ABS System Based on HIL. Master’s Thesis, Jilin University, Jilin, China, 2015. [Google Scholar]
- Montani, M.; Vitaliti, D.; Capitani, R.; Annicchiarico, C. Performance Review of Three Car Integrated ABS Types: Development of a Tire Independent Wheel Speed Control. Energies 2020, 13, 6183. [Google Scholar] [CrossRef]
- Chu, L.; Hou, Y.; Liu, M.; Li, J.; Gao, Y.; Ehsani, M. Development of air-ABS-HIL-simulation test bench. In Proceedings of the 2007 IEEE Vehicle Power and Propulsion Conference, Arlington, TX, USA, 9–12 September 2007; pp. 691–695. [Google Scholar]
- IEEE24765; ISO/IEC/IEEE International standard systems and software engineering—Vocabulary. C/S2ESC—Software & Systems Engineering Standards Committee: Geneva, Switzerland, 2017.
- ISO26262; Automotive safety integrity level. International Organization for Standardization: Geneva, Switzerland, 2011.
- Merayo, M.G.; Núñez, A. Passive testing of communicating systems with timeouts. Inf. Softw. Technol. 2015, 64, 19–35. [Google Scholar] [CrossRef]
- Che, X.; Maag, S. Passive performance testing of network protocols. Comput. Commun. 2014, 51, 36–47. [Google Scholar] [CrossRef]
- Pacejka, H.; Besselink, I. Magic formula tyre model with transient properties. Veh. Syst. Dyn. 1997, 27, 234–249. [Google Scholar] [CrossRef]
- Ding, F. Decision, Complexity, convergence and computational efficiency for system identification algorithms. Control 2016, 31, 1729–1741. [Google Scholar]
- Li, J.; Li, Y.; Wen, G. Design of automobile control system based on automatic code generation technology. Electron. Des. Eng. 2019, 27, 166–169. [Google Scholar]
- Liu, Y.; Li, Y.Q.; Zhuang, R.K. The application of automatic code generation technology in the development of the automotive electronics software. In Applied Mechanics and Materials; Trans Tech Publications: Freienbach, Switzerland, 2013; pp. 1574–1577. [Google Scholar]
- Wang, L.; Zhang, Y.; Yin, C.; Zhang, H.; Wang, C. Hardware-in-the-loop simulation for the design and verification of the control system of a series–parallel hybrid electric city-bus. Simul. Model. Pract. 2012, 25, 148–162. [Google Scholar] [CrossRef]
- Hu, Z.; Shi, T. The design and implementation of motor control system monitoring software based on WPF. Hans J. Wirel. Commun. 2016, 6, 1–9. [Google Scholar] [CrossRef]
Publisher’s Note: MDPI stays neutral with regard to jurisdictional claims in published maps and institutional affiliations. |
© 2022 by the authors. Licensee MDPI, Basel, Switzerland. This article is an open access article distributed under the terms and conditions of the Creative Commons Attribution (CC BY) license (https://creativecommons.org/licenses/by/4.0/).