Article

Dynamic Viewpoint Selection for Sweet Pepper Maturity Classification Using Online Economic Decisions

1
Farm Technology Group, Wageningen University and Research, 6700 AA Wageningen, The Netherlands
2
Department of Industrial Engineering and Management, Ben-Gurion University of the Negev, Beer Sheva 8410501, Israel
*
Author to whom correspondence should be addressed.
These authors contributed equally to this work.
Appl. Sci. 2022, 12(9), 4414; https://doi.org/10.3390/app12094414
Submission received: 31 March 2022 / Revised: 21 April 2022 / Accepted: 22 April 2022 / Published: 27 April 2022
(This article belongs to the Special Issue New Development in Smart Farming for Sustainable Agriculture)

Abstract

:
This paper presents a rule-based methodology for dynamic viewpoint selection for maturity classification of red and yellow sweet peppers. The method makes an online decision to capture an additional next-best viewpoint based on an economic analysis that considers potential misclassification and robot operational costs. The next-best viewpoint is selected based on color variations on the pepper. Peppers were classified into mature and immature using a random forest classifier based on principle components of various color features derived from an RGB-D camera. The method first attempts to classify maturity based on a single viewpoint. An additional viewpoint is acquired and added to the point cloud only when it is deemed profitable. The methodology was evaluated using leave-one-out cross-validation on datasets of 69 red and 70 yellow sweet peppers from three different maturity stages. Classification accuracy was increased by 6% and 5% using dynamic viewpoint selection along with 52% and 12% decrease in economic costs for red and yellow peppers, respectively, compared to using a single viewpoint. Sensitivity analyses were performed for misclassification and robot operational costs.

1. Introduction

Due to high labor costs and labor scarcity, there is a growing need for robotization in greenhouse production [1]. A particular labor-intensive operation involves selective harvesting of high-value crops, such as cucumber, tomato, and sweet pepper [2]. Intensive research has been conducted towards development of harvesting robots to overcome the lack of human labor and increasing harvesting costs [1,3,4,5]. Most research to date has focused on robot design, sensing, path planning, and grasping, with several reported attempts at fully integrated systems [3,6]. An important step in selective harvesting is determining the fruit maturity, an important factor in a fruit’s quality. For example, when a sweet pepper fruit is harvested before it is mature, it will not develop an acceptable flavor and will remain smaller compared to mature peppers, leading to a decrease in market value [7]. Despite intensive research on harvesting robots, only few of these studies have implemented maturity determination [3].

1.1. Maturity Classification

Different sensors have been employed for nondestructive maturity classification of fruits, including electronic noses [8], radio frequencies [9], and spectral systems [10,11,12,13,14]. Since most robotic systems incorporate a vision system on the end effector (eye-in-hand configuration) for fruit detection and localization [4,15,16], using vision for maturity classification as well is preferable. Furthermore, machine vision enables to predict both internal and external quality attributes [10].
Color is often used as a maturity indicator for several crops [3,5,17]. It has been used, for instance, in classifying maturity of fruits such as strawberry [18,19], apples [20], tomatoes [21,22,23], dates [24], plums [25], mango [26], and pineapple [27]. Many of these fruits mature in a uniform manner, allowing to assess the maturity from a single viewpoint. Sweet peppers, on the other hand, do not mature uniformly [7,13,28]; some parts of the pepper can be fully colored red or yellow, while other parts are still green (see examples in Figure 1). These heterogeneous ripening patterns hinder the possibility to determine maturity accurately from a single viewpoint since the information from this single side-view might be misleading. Although a single bottom-view can be used to differentiate between mature and immature peppers [29,30], a viewpoint directly below the pepper (facing upwards) is most likely not applicable for robotic harvesting because this viewpoint is often occluded by leaves [31]. Furthermore, it is not efficient since it requires the robot to move the camera from the bottom of the pepper all the way up to the peduncle to harvest the pepper when it is mature.
Adding viewpoints for maturity classification of sweet peppers has proven to yield improved performance [31]. Taking additional viewpoints, however, takes time, leading to increased cycle times. To make a robotic harvester economically feasible, it is important to limit the cycle time [32]. Therefore, an additional viewpoint should only be acquired when deemed profitable. Consequently, it is important to dynamically select the viewpoints that are expected to reveal the most information about the pepper’s maturity [31]. Harel et al. [31], however, did not deal with the dynamic viewpoint selection.

1.2. Dynamic Viewpoint Selection

Dynamic viewpoint selection, denoted also as active sensing, active perception, dynamic sensing, or next-best-viewpoint planning, is a well-investigated research topic in robotics research [33,34,35]. Active-vision systems assume data measurements to be expensive or slow, and therefore aim to predict the next viewpoint so as to learn as much as possible [36] by controlling the camera’s pose towards an object [33]. To date, most robotics research has focused on incorporating dynamic viewpoint selection for object grasping in structured scenes and/or for objects that can be modeled [37,38]. Selecting the next-best viewpoint is difficult in agricultural applications due to the complex and uncertain environment, which limits the ability to model the scene [38]. The agriculture scene is highly variable and unstructured [1,38] due to variations within the crop (variability in colors, shape, and texture inherent to the biological nature of the product) and the environment (caused by changing illumination, layout of plants, obstructions). To apply the concept of dynamic viewpoint selection in agricultural scenes, methods should be able to deal with these variations to predict a next-best viewpoint.
The concept of dynamic viewpoint selection was introduced for sweet pepper detection and has proven to improve detection by 19% with 5–10% decreased costs [38]. The decision whether or not to take an additional viewpoint considered the economic costs for moving the camera to the next viewpoint and the economic benefit of additional peppers revealed from an additional viewpoint.

1.3. Contributions of This Paper

From the literature above, we can conclude that maturity classification of sweet peppers improves by adding multiple viewpoints, and the concept of dynamic viewpoint selection can be used to limit the number of viewpoints for detecting sweet peppers. In this work, we combined these two insights to develop a maturity classification method that obtains sufficient maturity information of a pepper from a minimum number of viewpoints. Currently, to the best of our knowledge, no such method was presented.
The objective of this paper is to develop and evaluate a dynamic viewpoint selection methodology for planning the next-best view based on economic profitability. This method is composed of two decisions: (i) an online economic consideration to add additional viewpoints, and (ii) if so, which viewpoint to add. The economic consideration is based on the current uncertainty of maturity classification, the costs associated with misclassification, and the robot’s operational costs. The next viewpoint is selected based on color variations on the pepper. We study (1) the benefit of adding a viewpoint to the maturity classification in terms of classification accuracy and cost, (2) the sensitivity of the method to the misclassification and robot costs, and (3) the robustness of the method towards different initial viewpoints. The proposed method is compared to several other methods: using a single viewpoint, adding five instead of two additional viewpoints, adding a random viewpoint, and the upper bound indicating the highest possible classification accuracy using two viewpoints.

2. Methods

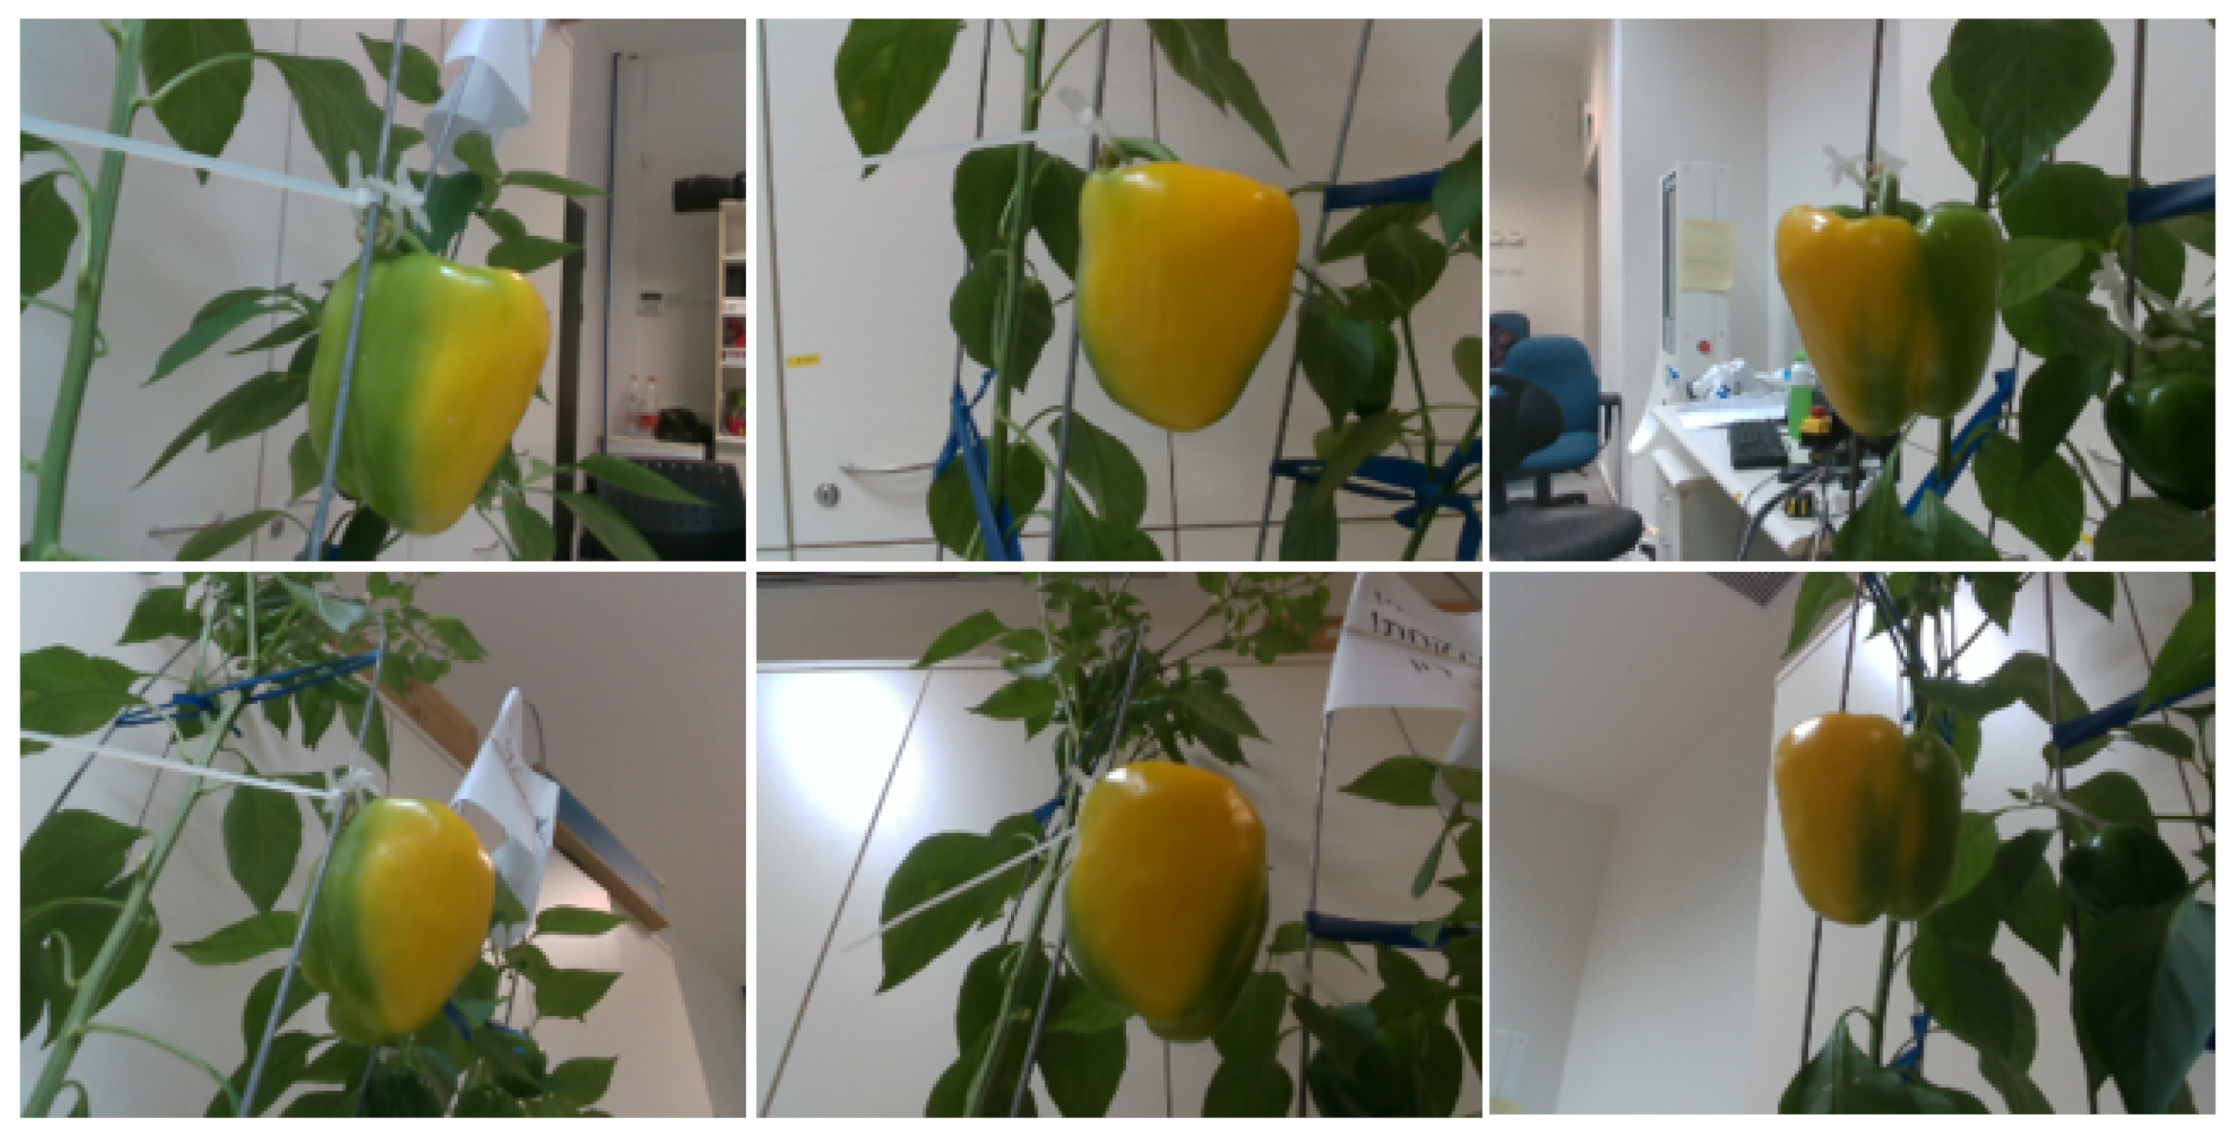
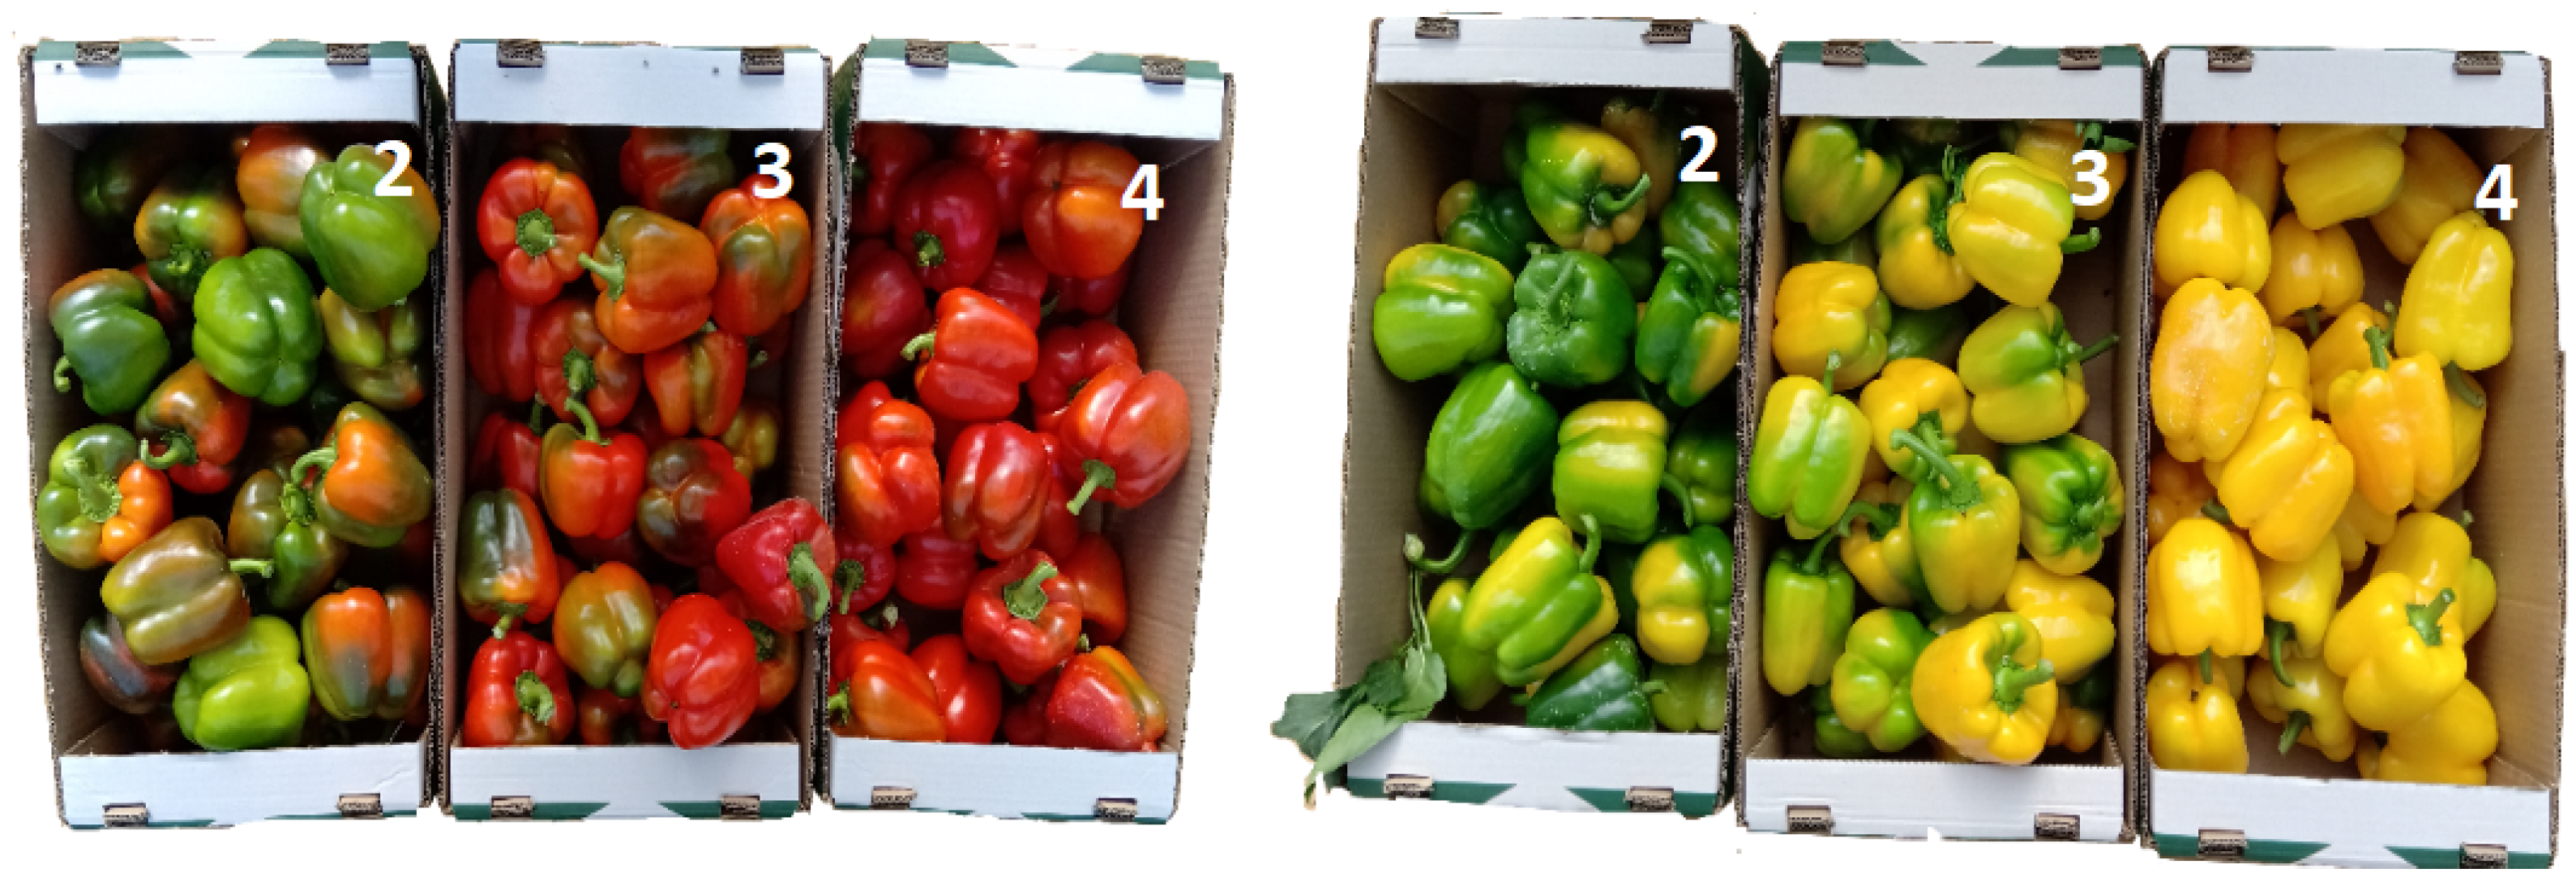
2.1. Data Collection

A total of 69 red and 70 yellow sweet peppers were harvested in a commercial greenhouse in Kmehin, Israel, on 18 November 2019. The peppers were manually classified into maturity classes 2–4 (Table 1, Figure 2), which are defined in Harel et al. [30], by manually observing all sides of the pepper. Peppers belonging to class 2 (50–95% green) are considered as immature and peppers belonging to classes 3 (50–95% colored) and 4 (more than 95% colored) are considered mature. Immature peppers were purposely not included in the analysis since they are not supposed to be detected by the robotic harvester. Furthermore, we focused on the more challenging classification between classes 2–4.
To focus on the economic decision process instead of the image processing aspects, the peppers were mounted on a pepper plant and photographed in a lab environment (Figure 3) without controlled illumination. The color and depth (RGB-D) images were acquired with an Intel RealSense D435 camera mounted on a 7-degree-of-freedom Sawyer robotic arm (Rethink Robotics). Since 360-degree characterization of a pepper is not possible in a real greenhouse, the viewpoints are limited to 6 different viewpoints from one side of the pepper: 3 horizontal viewpoints with different azimuth angle (Figure 4a), and 3 additional viewpoints using a different tilt angle (Figure 4b). The camera has a distance of 25 cm from the pepper which corresponds to the minimum depth distance of the camera. These viewpoints are comparable with the viewpoints used by Hemming et al. [39], Kurtser and Edan [40], and three of the six viewpoints of this dataset were also used in Harel et al. [31]. The initial viewpoint is defined as the viewpoint with a 0° azimuth and 0° tilt angle. The five remaining viewpoints were used as additional viewpoints for the maturity classification (Section 2.2). Figure 1 shows an example of the six images of a yellow pepper.
A total of 834 RGB-D images of the 139 sweet peppers were acquired. For selecting the classification model hyperparameters (Section 2.2.3), 15 peppers (5 from each class) were used as a validation dataset. Additionally, these peppers are added to the training set in the leave-one-out cross-classification (Section 2.3.2). In addition, a smaller repeatability dataset was constructed with a subset of the peppers to test how the initial viewpoint influences results (since this depends on the specific orientation of an individual pepper, which cannot be determined in advance). This dataset included 14 peppers of class 2, 14 peppers of class 3, and 7 peppers of class 4, for both red and yellow peppers. Images of these peppers were acquired from all the viewpoints; this was repeated three times, while twisting the pepper 120° around the z-axis each repetition. In this way, each of these peppers have 3 repetitions with another side of the pepper facing the camera at the initial viewpoint [31].

2.2. Active Maturity Classification

Maturity classification included the following steps: (1) color- and depth-based segmentation to obtain a 3D colored point-cloud representation of the bell peppers, (2) color feature extraction, (3) dynamic viewpoint selection, and (4) maturity classification.

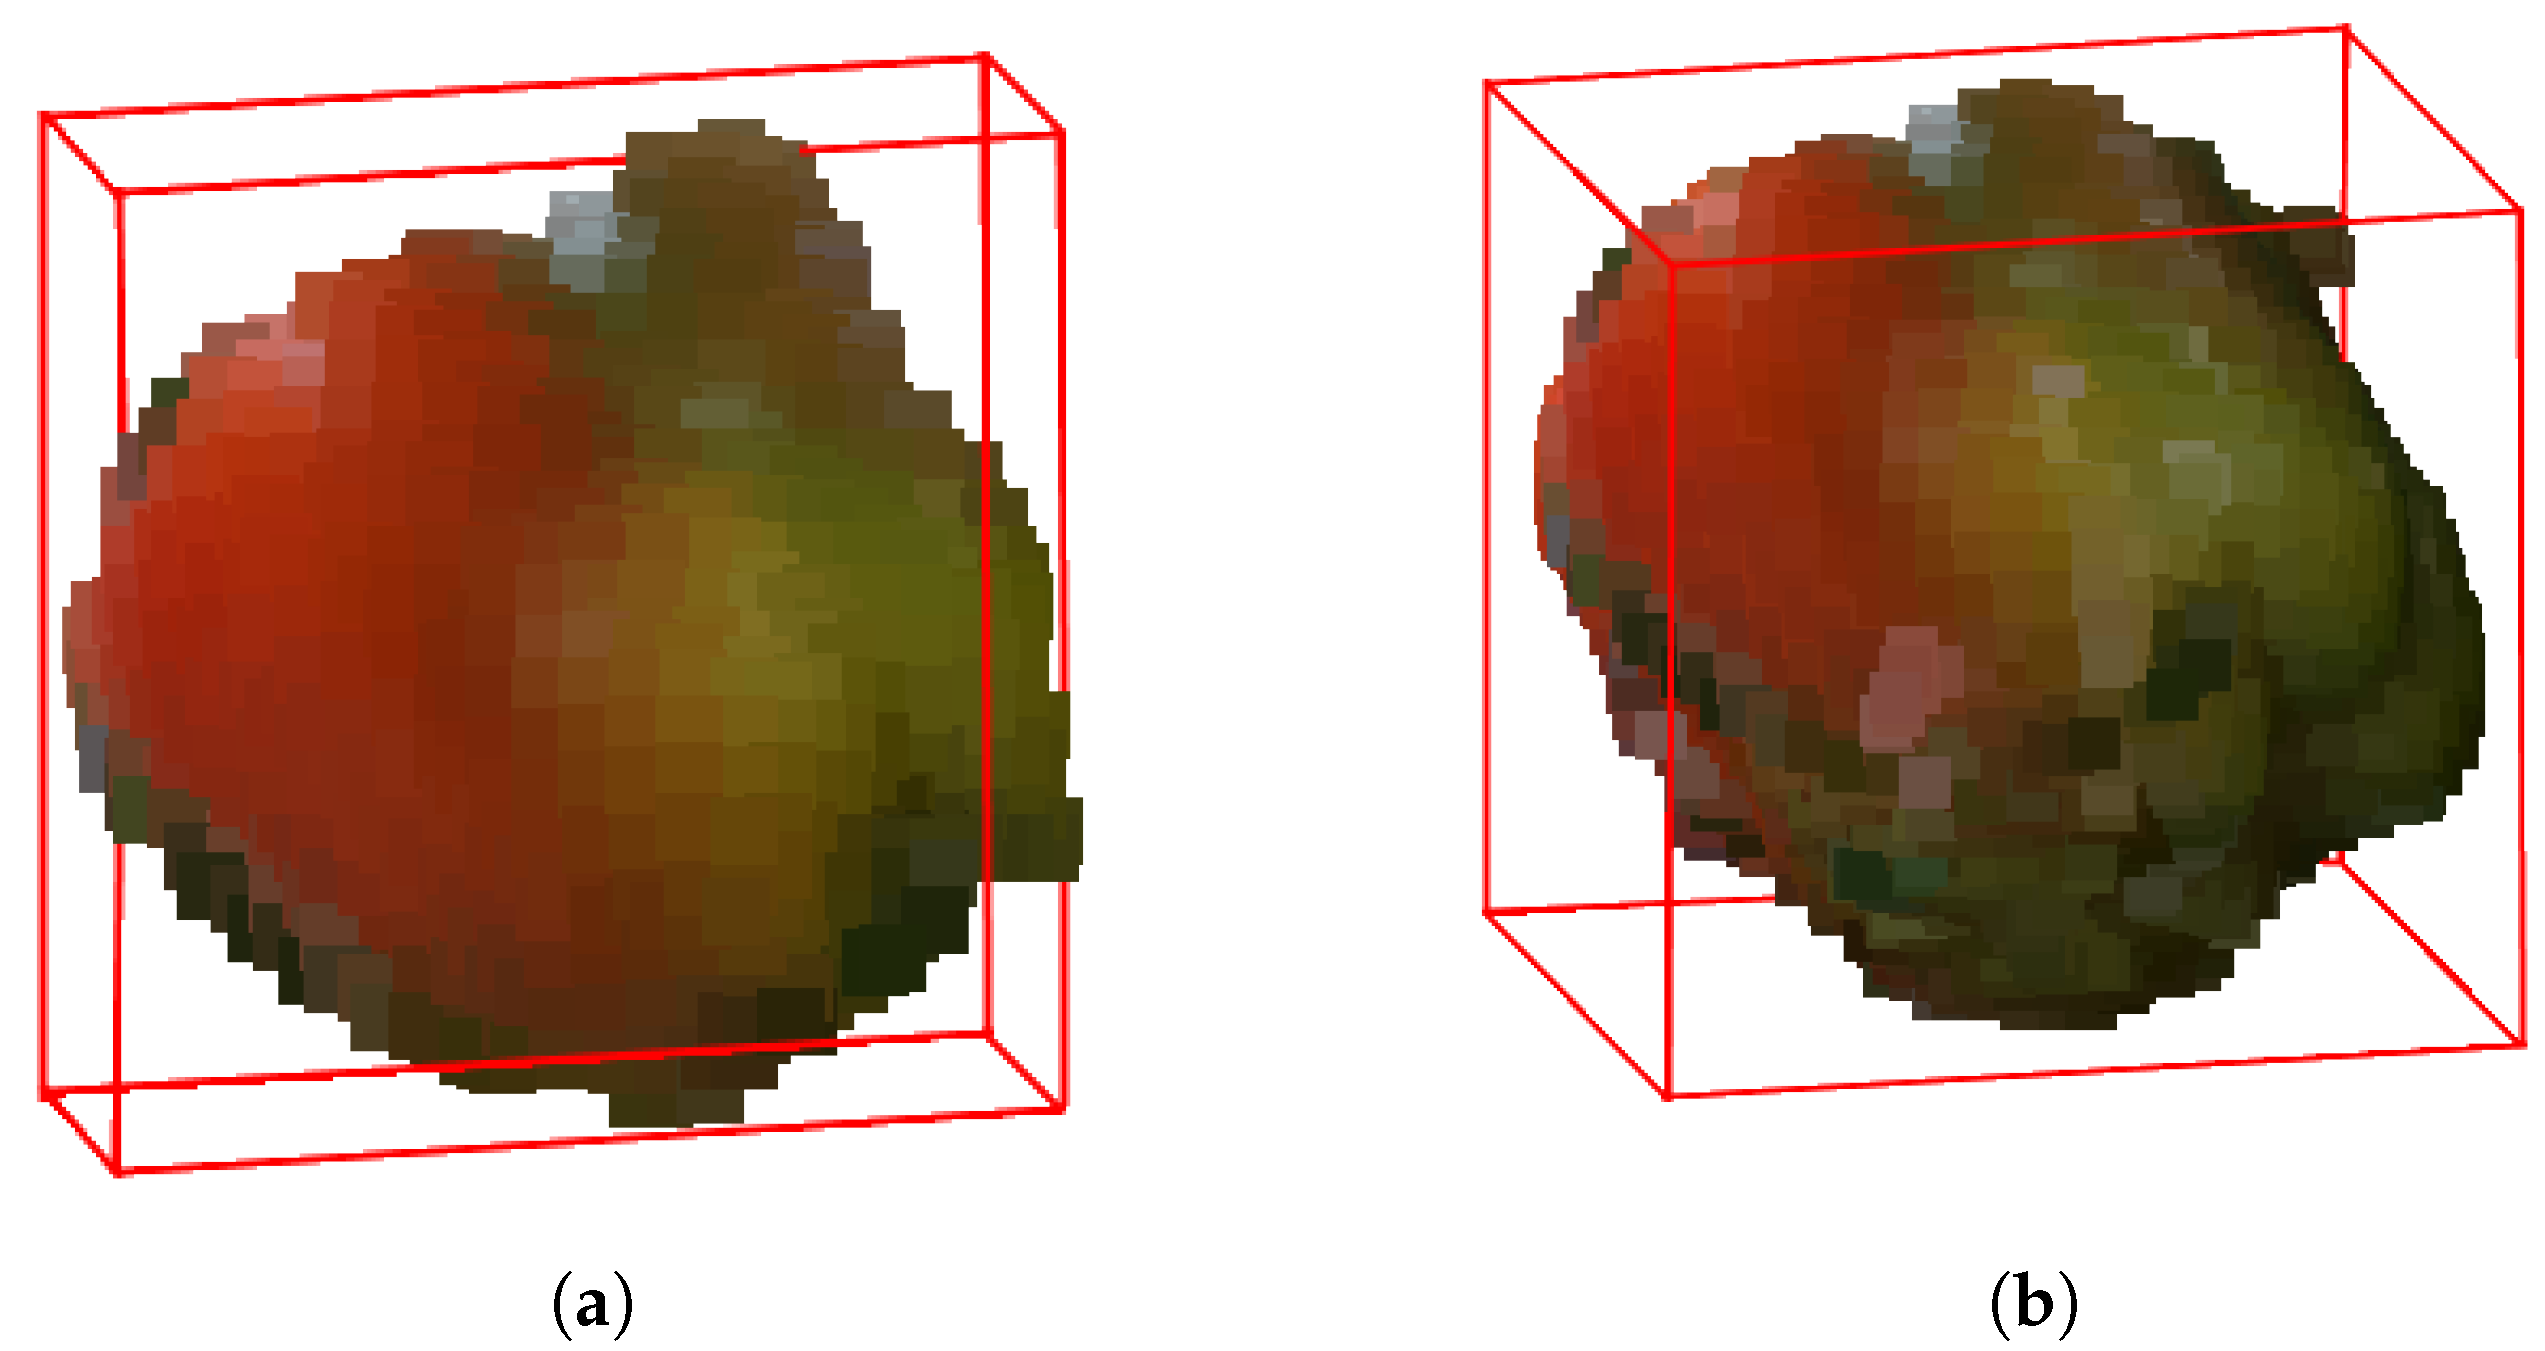
2.2.1. 3D Point-Cloud Representation

The sweet peppers were segmented from the background and plant using a combination of empirically chosen depth and color thresholds for each of the six viewpoints followed by Canny edge detection on the depth image to separate the leaves from the peppers similar to Harel et al. [31]. The resulting mask was applied on the depth image and all pixels were projected to a 3D point cloud using the intrinsic camera parameters and the robot pose. When a second viewpoint was acquired, the point cloud of this new viewpoint was merged with the previous point cloud, creating a more complete representation of the pepper. Adding an additional viewpoint increased the number of points in the point cloud by approximately 50%.
To create a uniform point density and to limit the amount of points, the point cloud is downsampled using a voxel-grid filter with a cell size of 5 × 5 × 5 mm. The position and RGB color values of the points inside each occupied grid cell are averaged to form the filtered point cloud. Next, isolated points are removed using a statistical outlier-removal filter. The filter uses the 50 closest points and a maximum distance of one standard deviation to the mean of these 50 closest points. An example of a segmented point cloud is given in Figure 5.

2.2.2. Color Feature Extraction

Inspired by Harel et al. [13,31], three different color channels were extracted from the point clouds; hue, red, and red minus green. From each of the three channels, the following four features were calculated for each pepper: mean, standard deviation, median, and the 5% trimmed mean (mean excluding lower and upper 5% of data). Principal component analysis (PCA) was used to convert these 12 features into the five principal components that explain the largest part of the variance within the features (>99%); these were used for the maturity classification described in the next section.

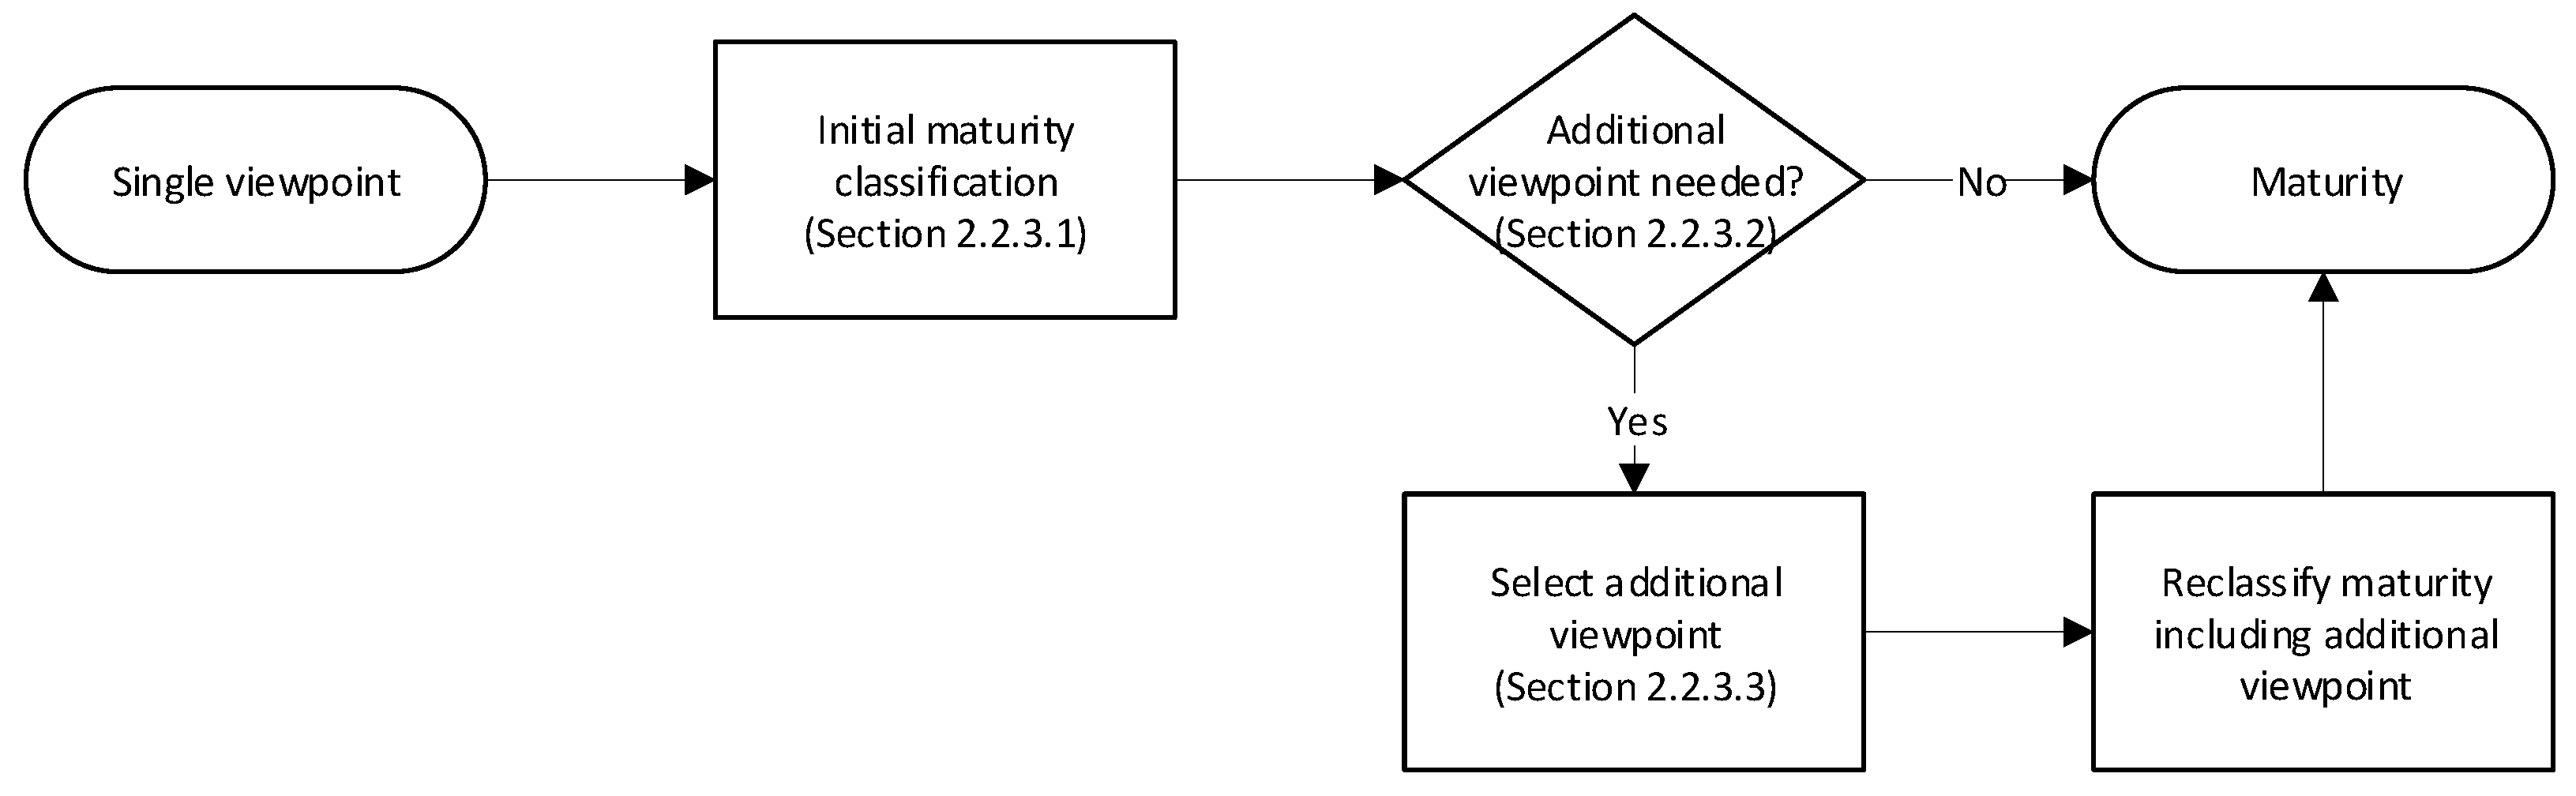
2.2.3. Dynamic Viewpoint Selection and Maturity Classification

Figure 6 shows the developed dynamic viewpoint selection algorithm for the maturity classification. The decision whether an additional viewpoint is required uses the classification uncertainty resulting from the initial maturity classification based on the first viewpoint (Section 2.2.3.1) and an economic analysis (Section 2.2.3.2). If an additional viewpoint is deemed profitable, the next viewpoint is selected based on a spatial analysis of the variability in color (Section 2.2.3.3). The maturity of the pepper is then reclassified by combining the additional viewpoint with the original single viewpoint (Section 2.2.1) using the same classification model as for the initial maturity classification.
Although this algorithm can be easily adapted to include more viewpoints, we considered a single additional viewpoint. This is based on prior research that showed no significant improvement in the classification accuracy using more than two viewpoints [31]. Furthermore, adding more viewpoints increases cycle times, and hence this was not considered.

2.2.3.1. Initial Maturity Classification

Pepper maturity was classified into mature or immature using a random forest (RF) classifier based on features (Section 2.2.2) from the initial viewpoint (defined as viewpoint 0). The RF model hyperparameters were selected using the validation dataset. The selected RF classifier was composed of 1000 trees with 1 randomly sampled variable at each node for red peppers and 2 variables for yellow peppers.
Training was performed using the color features from different combinations of viewpoints (viewpoint 0, all six viewpoints combined, and all combinations of two viewpoints—each of the five viewpoints combined with viewpoint 0). The classification certainty, p c l a s s , was derived from the percentage of trees holding the same classification.

2.2.3.2. Additional Viewpoint Decision

An additional viewpoint is acquired when the expected revenue from the additional viewpoint is higher than the costs to take the viewpoint, according to the following rule:
( p a d v p c l a s s ) · c p e p p e r > t a v · c r o b o t ,
where p c l a s s is the classification certainty from the initial viewpoint, c p e p p e r is the cost of misclassifying one pepper, c r o b o t is the cost of one second of robot operation time, and t a v is the time of adding an additional viewpoint (viewpoint specific, measured on forehand).
Adding a viewpoint improves the classification accuracy; however, it does not bring the classification error to zero [31]. The lower the classification certainty in viewpoint 0, the more improvement in classification accuracy can be expected when adding an additional viewpoint. The classification certainty when using the additional viewpoint, p a d v , is predicted using a linear regression model using p c l a s s and is trained on the training set. The cost of misclassifying one pepper, c p e p p e r , is set to the market price of a single pepper. This price is highly variable with prices for red sweet peppers in 2019, ranging from EUR 0.048 to EUR 0.599 per piece with an average of EUR 0.196 per piece [41]. Yellow peppers prices ranged from EUR 0.056 to EUR 0.542 per piece with an average of EUR 0.202 per piece in 2019 [41]. With an expected cost of a sweet-pepper-harvesting robot between EUR 75,000 and EUR 100,000, an operational time of 20 h/day and payback time of 7 years [42], the costs of one second of robot operation, c r o b o t , is estimated between EUR 4.08 × 10 4 and EUR 5.44 × 10 4 with an average of EUR 4.76 × 10 4 .

2.2.3.3. Additional Viewpoint Selection

When an additional viewpoint is required, the point cloud from the initial viewpoint (0° azimuth and 0° tilt angle) is split into six equally sized boxes; see Figure 7. Boxes 1–5 correspond to viewpoints that reveal additional information about that side of the pepper. Box 1 corresponds to the viewpoint at 60° azimuth angle and 0° tilt angle (Figure 4), box 2 with the viewpoint with 60° azimuth angle and 45° tilt angle, and so on.
The principle for selecting the next viewpoint is that we want to take a new viewpoint at the side of the bell pepper that is most heterogeneously colored, assuming that this viewpoint will provide the most decisive information about the maturity. Inspired by Vázquez et al. [34], we calculate the color variability using the Shannon entropy [43] of the hue channel, H i , for every box i { 1 , 2 , 3 , 4 , 5 } :
H i = k = 0 255 p k i log ( p k i ) ,
where p k i is the probability of a pixel in box i to have the hue-value k, which is derived from the hue histogram of all the pixels in the box. The viewpoint belonging to the box, j, with the highest entropy is selected as the next-best viewpoint:
j = arg max i = 1 5 H i

2.3. Evaluation

2.3.1. Performance Measures

The classification accuracy ( CA ), the true-positive rate ( TPR ), and the true-negative rate ( TNR ) were calculated from the confusion matrix (Table 2):
CA = TP + TN TP + FP + FN + TN ,
TPR = TP TP + FP ,
TNR = TN FN + TN ,
where TP is the number of true positives, TN is the number of true negatives, FP is the number of false positives, and FN is the number of false negatives.
The total classification costs, c t o t a l , is the sum of the costs associated with misclassification and sensing:
c t o t a l = ( FN + FP ) · c p e p p e r + i = 1 5 n i · t i · c r o b o t ,
where n i is the number of classifications that used the additional viewpoint i and t i the corresponding sensing time.
As a measure for repeatability, the consistent classification factor (CCF) is introduced. The CCF is defined as the percentage of the peppers where all three repetitions yield identical classification. The higher the CCF, the more consistent a classification is and the more independent the algorithm is on the pepper’s orientation on the plant. Ideally, the CCF would be 1, implying consistent classification independent of the side of the pepper facing the row. The relation between the consistency and the CA is derived by the majority classification accuracy (MCA), defined as the CA where the most common classification from the three repetitions is derived.

2.3.2. Analyses

Three different analyses were performed: a performance analysis, a sensitivity analysis, and a repeatability analysis. The performance and sensitivity analyses used leave-one-out cross-validation (LOOCV) to maximally use the available data. The repeatability analysis was performed on a specially acquired dataset (Section 2.1).
The performance analysis results are presented by comparing the results of the dynamic viewpoint method with classification results using (a) a single viewpoint, (b) by adding a randomly selected additional viewpoint (instead of selecting one using the aforementioned method), and (c) the combination of all six viewpoints. Additionally, the upper bound is indicated for all analyses. The upper bound is the best result that could have been achieved with two viewpoints and is calculated by assuming that the next viewpoint is the viewpoint with the lowest sensing time, t a v , with a correct classification (if any). Since it is not always possible to yield a correct maturity classification based on the data of two viewpoints, the results were compared to the upper bound instead of a perfect classification.
Sensitivity analyses were performed for pepper prices, c p e p p e r , and robot costs, c r o b o t (influences cycle times), by changing the pepper prices between EUR 0.0 and EUR 1.00 per piece and the robot costs between EUR 1 × 10 4 and EUR 10 × 10 4 per second.
The repeatability analysis was conducted to assess the algorithm’s dependence on the pepper’s orientation on the plant (Section 2.1).

3. Results

3.1. Dynamic Viewpoint Selection

For both red and yellow sweet peppers, taking multiple viewpoints improves the performance compared to a single viewpoint by 6% and 5% (Table 3). Peppers with maturity class 4 are classified perfectly for both red and yellow peppers. The distinction between classes 2 and 3 was more challenging. For red peppers, all performance metrics improved when adding one additional viewpoint, resulting in similar performance to when all viewpoints are used. For yellow peppers, the CA and TNR increase while the TPR decreases slightly; maturity classification of yellow peppers when using all viewpoints yielded slightly lower performance.
Selecting the next viewpoint using the proposed dynamic viewpoint selection method yields only a small advantage over adding a randomly selected second viewpoint for the red peppers. For yellow peppers, randomly selecting the next-best viewpoint outperformed the proposed method, implying that for yellow peppers, any additional viewpoint is beneficial for maturity classification, not only the viewpoint with most variability in color.
The high performance of the upper bound shows the potential of dynamically selecting an additional viewpoint. Respectively, 6% and 7% of the red and yellow peppers were classified wrongly using a single viewpoint and were classified correctly using dynamic viewpoint selection. On the other hand, 0% and 4% of the peppers were classified correctly using one viewpoint and were classified wrongly using the dynamic viewpoint selection method. In general, the CA for red peppers was higher than for yellow peppers. This is likely due to the more subtle color differences for different maturity levels of yellow peppers since color differences between yellow and green are smaller than red and green.
An additional viewpoint was acquired for 39% of the red peppers and 62% of the yellow peppers (Table 4). This increased the robot’s cycle time by an average of 3.14 and 5.06 s for red and yellow peppers, respectively (3–21% for a harvesting cycle time of 24–94 s [4,15,16,44]), compared to the cycle time for a single viewpoint. Using dynamic viewpoint selection decreases the total costs by 52% and 69% compared to single and all viewpoints, respectively, for red peppers. For yellow peppers, the decrease in cost is 12% and 38%, respectively. The upper bound costs are lower than the costs yielded using the current method for dynamic viewpoint selection, indicating that the method we used to determine the next-best viewpoint can be improved.
The dynamic viewpoint selection method selected the same viewpoint as the upper bound in 29% and 18% of the cases. This partially explains the difference in performance with the current method for dynamic viewpoint selection, but in most cases, there is more than a single additional viewpoint that yields a correct classification. In these cases, the dynamic viewpoint selection is still correct but there was a viewpoint that had lower sensing costs.

3.2. Sensitivity Analysis

As expected, the number of times it is worthy to acquire an additional viewpoint increases as the pepper price increases (Figure 8). For red peppers, the increasing number of additional viewpoints resulted in an increase in CA until a maximum is reached at the price of EUR 0.08 per pepper. After that, more viewpoints did not yield higher CA. The upper bound showed a similar pattern.
For yellow peppers, an additional viewpoint is worthy to acquire until the price per pepper increases to EUR 0.08. After that price, only classifications with a low certainty will use the additional viewpoint. When using entropy for selecting the next-best viewpoint, the pepper price does not influence the classification accuracy. However, the CA of the upper bound increases till EUR 0.08 per pepper. At higher pepper prices, an additional viewpoint is not added, and consequently, the CA remains constant.
Figure 9 shows the influence of robot costs on the average number of times it is worthy to acquire an additional viewpoint and the related dynamic and upper bound CA for red and yellow peppers. As expected, increasing the robot costs decreases the number of times it is worthy to acquire an additional viewpoint, since taking an additional viewpoint becomes more expensive. The CA of the red peppers decreased at high robot costs, but within the range of robot costs, as defined in Section 2.2.3.2, the CA is stable. For the yellow peppers, within the defined realistic cost range, the CA is stable. Since the upper bound is consistently higher than the dynamic viewpoint, adding a viewpoint that reveals the appropriate information will probably contribute to the classification. Even at robot costs of EUR 0.01/s, the highest examined cost, an additional viewpoint is applied for 5% of the peppers. Apparently, the certainty from the first viewpoint of these peppers was really low, and therefore an additional viewpoint was worthy regardless of the robot cost.

3.3. Repeatability

Table 5 shows the CCF and MCA for the different maturity classes of the red and yellow sweet peppers for the different methods. Maturity class 4 is always classified correctly regardless of the pepper orientation on the plant, resulting in a CCF and MCA of 1.00 for both red and yellow peppers. This makes sense, as class 4 refers to uniformly colored red/yellow peppers, so the initial viewpoint does not matter. In classes 2 and 3, the CCF is lower, implying more cases where a different orientation of the pepper leads to different classification. The upper bound consistency is higher than using a single viewpoint, implying that dynamically selecting the next viewpoint has the potential to improve consistency. The implemented dynamic viewpoint method, however, does not improve the classification consistency. This result is caused since, in some instances, the single viewpoint correctly represents the pepper’s color level, and by adding another viewpoint, the additional information may lead to the wrong classification, since it does not represent the full pepper [31].

4. Discussion

Applying dynamic viewpoint selection to maturity classification improves the classification while reducing the economic costs. By taking an additional viewpoint only when profitable, performance is improved. An additional viewpoint is needed only when the first viewpoint yields an uncertain classification. The upper bound results reveal the potential of the viewpoint selection method. However, the currently implemented next-best viewpoint selection method does not reach best performance (the upper bound classification accuracy). The similar performance of the viewpoint selection method and taking a random next viewpoint implies that any additional viewpoint can improve maturity classification and not only the viewpoint with the most color variation. An improved algorithm for viewpoint selection could be to use a machine learning approach, which learns to predict the next-best viewpoint from training data generated from the upper bound [45]. Apart from only color features, geometric features and occlusions should be taken into account.
The CA of the red and yellow peppers were slightly higher compared to the results presented for two viewpoints in Harel et al. [31]. This could be explained by different parameters for the RF classifier and the availability of more viewpoints. In addition to using the two additional viewpoints with a different azimuth angle (numbers 1 and 5 in Figure 7), three additional viewpoints (numbers 2, 3, and 4) with a different tilt angle could be selected as additional viewpoint. Maturity classification of red peppers was better than yellow peppers, similar to previous results [13,31]. An explanation can be that the yellow color is closer to the green color than red is to green in both HSV and RGB color spaces. As a result, the features discriminating between immature and mature peppers are closer for yellow than for red peppers, which makes selecting threshold values that separate the immature and mature classes in the RF model more difficult. This corresponds to previous results revealing the importance of fitting the color space to the fruit variety and applying adaptive algorithms [46].
Adding all six viewpoints to the point cloud does not yield higher classification accuracy of yellow peppers. This is probably due to the RF model which was trained on data from the combination of one, two, and six viewpoints. Classification was performed without considering the number of viewpoints used, which probably produced suboptimal results and might explain the lower performance. Different models should be developed for each number of viewpoints used; however, this requires a significant amount of additional data to avoid training imbalance between the separate models. Adding more viewpoints does not always improve the performance, as shown in the sensitivity analysis (Figure 8). There are some cases where the classification from a single viewpoint is correct and from two viewpoints is wrong. Especially when the maturity of the pepper is close to the decision boundary, adding an viewpoint that contains a few green pixels can result in a different classification. This could be solved by adding more than one additional viewpoint to obtain a better overview of the whole pepper color; however, this will result in higher robot costs. In most cases, adding only single additional viewpoint reveals enough information to improve the maturity classification.
The cost of misclassifying a mature pepper as an immature pepper was not distinguished from misclassifying an immature pepper as a mature pepper. It can be argued that classifying a mature pepper into immature is less costly than the other way around, since the pepper can still be harvested at a later pass of the robotic harvester. However, when a pepper is harvested too late and becomes overmature, it will lead to a reduced shelf life and a lower price. Furthermore, a batch of harvested peppers with less variation in maturity can increase the market value [3].
In this work, classification was performed only for maturity classes 2–4. Complete green peppers (class 1, more than 95% green) were not incorporated since they may be neglected in the detection (similar to Lehnert et al. [44]) and the fruit should stay on the plant. Classification results for class 1 peppers are likely to be comparable with class 4 results (i.e., perfect classification) as both are homogeneously colored. Adding class 1 peppers will therefore lead to an improved overall CA. It is mainly the distinction between class 2 and 3 which is challenging, and hence this was the focus of this work. All classified peppers were healthy. Incorporating detection of peppers with defect spots as an additional class is, in principle, possible; however, a reliable disease detection requires a 360-degree characterization of the pepper. At the time of maturity classification, the pepper is still attached to the plant, which makes full characterization of the pepper not possible.
It must be noted that in this work, maturity classification was performed in lab conditions. However, detection of peppers in real greenhouse conditions has been resolved using many different techniques, e.g., Kurtser and Edan [38], Arad et al. [47], Sa et al. [48], Vitzrabin and Edan [49]. Future work should consider occlusion of peppers by leaves and other plant parts in the next-best-viewpoint selection. These occlusions enhance the need for multiple viewpoints and an algorithm for next-best-viewpoint selection.
When incorporating the dynamic viewpoint selection method, the average harvesting time increases by 3–21%. Since additional viewpoints also improve the detection of the fruit [38], a future approach should combine the viewpoints needed for the pepper detection and the maturity classification. This will lower the cycle time, which is essential to make a robotic harvester economically feasible [32].

5. Conclusions

The proposed dynamic viewpoint selection method improved the classification of maturity by 6% and 5% compared to a single viewpoint, reaching a classification accuracy of 96% and 84% for red and yellow peppers, respectively, and reducing costs by 52% and 12%. When using all six viewpoints, an accuracy of 96% and 82% could be reached, however, with 69% and 38% higher costs compared to the proposed method. When using a perfect next-best-viewpoint selection method, classification results of 98% and 95% for red and yellow peppers could be reached to distinguish between mature and immature peppers.
At higher pepper prices, the method is more likely to add an additional viewpoint. This leads to an increased classification performance until it reaches a maximum. When increasing the robot costs, the method is less likely to add an additional viewpoint, leading to a decreased classification performance for extreme robot costs. However, for the range of expected robot costs, the classification performance is stable.
The results indicate the benefit of selecting an additional viewpoint when the system is uncertain about the maturity classification. However, although adding an additional viewpoint improves maturity classification, the current method for selecting next-best viewpoint does not yield the best possible results. Future research will be focused on developing an improved viewpoint selection method to select the viewpoint that optimizes the performance.
To conclude, we showed that it is possible to improve maturity classification of sweet peppers while reducing the economic costs, by only taking an additional viewpoint when profitable. This can be used in future robotic applications to improve efficiency of a classification task that needs multiple viewpoints.

Author Contributions

Conceptualization, R.v.E., B.H. and Y.E.; methodology, R.v.E., B.H., G.K. and Y.E.; software, R.v.E.; investigation, R.v.E., B.H. and Y.E.; data curation, R.v.E. and B.H.; original draft, R.v.E.; writing—review and editing, R.v.E., B.H., G.K. and Y.E.; supervision, G.K. and Y.E.; project administration, Y.E. All authors have read and agreed to the published version of the manuscript.

Funding

This research was partially supported by the European Commission (SWEEPER GA no. 644313), and by Ben-Gurion University of the Negev through the Helmsley Charitable Trust, the Agricultural, Biological and Cognitive Robotics Initiative, the Marcus Endowment Fund, and the Rabbi W. Gunther Plaut Chair in Manufacturing Engineering.

Data Availability Statement

The data presented in this study are available on request from the corresponding author.

Acknowledgments

We would like to acknowledge Hahn-Robotics for their donation of the Sawyer robot.

Conflicts of Interest

The authors declare no conflict of interest.

References

  1. Kootstra, G.; Bender, A.; Perez, T.; van Henten, E.J. Robotics in Agriculture. In Encyclopedia of Robotics; Ang, M.H., Khatib, O., Siciliano, B., Eds.; Springer: Berlin/Heidelberg, Germany, 2020; pp. 1–19. [Google Scholar] [CrossRef]
  2. Elkoby, Z.; van ’t Ooster, B.; Edan, Y. Simulation Analysis of Sweet Pepper Harvesting Operations. In Advances in Production Management Systems. Innovative and Knowledge-Based Production Management in a Global-Local World; Grabot, B., Vallespir, B., Gomes, S., Bouras, A., Kiritsis, D., Eds.; Springer: Berlin/Heidelberg, Germany, 2014; pp. 441–448. [Google Scholar]
  3. Bac, C.W.; van Henten, E.J.; Hemming, J.; Edan, Y. Harvesting Robots for High-value Crops: State-of-the-art Review and Challenges Ahead. J. Field Robot. 2014, 31, 888–911. [Google Scholar] [CrossRef]
  4. Arad, B.; Balendonck, J.; Barth, R.; Ben-Shahar, O.; Edan, Y.; Hellström, T.; Hemming, J.; Kurtser, P.; Ringdahl, O.; Tielen, T.; et al. Development of a sweet pepper harvesting robot. J. Field Robot. 2020, 37, 1027–1039. [Google Scholar] [CrossRef]
  5. Kapach, K.; Barnea, E.; Mairon, R.; Edan, Y.; Ben-Shahar, O. Computer vision for fruit harvesting robots—State of the art and challenges ahead. Int. J. Comput. Vis. Robot. 2012, 3, 4–34. [Google Scholar] [CrossRef] [Green Version]
  6. Kootstra, G.; Wang, X.; Blok, P.M.; Hemming, J.; van Henten, E. Selective Harvesting Robotics: Current Research, Trends, and Future Directions. Curr. Robot. Rep. 2021, 2, 95–104. [Google Scholar] [CrossRef]
  7. Tadesse, T.; Hewett, E.W.; Nichols, M.A.; Fisher, K.J. Changes in physicochemical attributes of sweet pepper cv. Domino during fruit growth and development. Sci. Hortic. 2002, 93, 91–103. [Google Scholar] [CrossRef]
  8. Baietto, M.; Wilson, A. Electronic-Nose Applications for Fruit Identification, Ripeness and Quality Grading. Sensors 2015, 15, 899–931. [Google Scholar] [CrossRef]
  9. Tan, S.; Zhang, L.; Yang, J. Sensing fruit ripeness using wireless signals. In Proceedings of the International Conference on Computer Communications and Networks (ICCCN), Hangzhou, China, 30 July–2 August 2018; pp. 1–9. [Google Scholar] [CrossRef]
  10. Arendse, E.; Fawole, O.A.; Magwaza, L.S.; Opara, U.L. Non-destructive prediction of internal and external quality attributes of fruit with thick rind: A review. J. Food Eng. 2018, 217, 11–23. [Google Scholar] [CrossRef]
  11. Lu, R.; Van Beers, R.; Saeys, W.; Li, C.; Cen, H. Measurement of optical properties of fruits and vegetables: A review. Postharvest Biol. Technol. 2020, 159, 111003. [Google Scholar] [CrossRef]
  12. Hussain, A.; Pu, H.; Sun, D.W. Innovative nondestructive imaging techniques for ripening and maturity of fruits—A review of recent applications. Trends Food Sci. Technol. 2018, 72, 144–152. [Google Scholar] [CrossRef]
  13. Harel, B.; Parmet, Y.; Edan, Y. Maturity classification of sweet peppers using image datasets acquired in different times. Comput. Ind. 2020, 121, 103274. [Google Scholar] [CrossRef]
  14. Semenov, V.; Mitelman, Y. Non-destructive Fruit Quality Control Using Radioelectronics: A Review. In Proceedings of the 2020 Ural Symposium on Biomedical Engineering, Radioelectronics and Information Technology (USBEREIT), Yekaterinburg, Russia, 14–15 May 2020; pp. 0281–0284. [Google Scholar] [CrossRef]
  15. Bac, C.W.; Hemming, J.; van Tuijl, B.A.; Barth, R.; Wais, E.; van Henten, E.J. Performance Evaluation of a Harvesting Robot for Sweet Pepper. J. Field Robot. 2017, 34, 1123–1139. [Google Scholar] [CrossRef]
  16. Lehnert, C.; English, A.; McCool, C.; Tow, A.W.; Perez, T. Autonomous Sweet Pepper Harvesting for Protected Cropping Systems. IEEE Robot. Autom. Lett. 2017, 2, 872–879. [Google Scholar] [CrossRef] [Green Version]
  17. Hemming, J.; Bac, C.W.; van Tuijl, B.A.; Barth, R.; Bontsema, J.; Pekkeriet, E.; van Henten, E.J. A robot for harvesting sweet-pepper in greenhouses. In Proceedings of the International Conference of Agricultural Engineering, Zurich, Switzerland, 6–10 July 2014; pp. 1–8. [Google Scholar]
  18. Hayashi, S.; Shigematsu, K.; Yamamoto, S.; Kobayashi, K.; Kohno, Y.; Kamata, J.; Kurita, M. Evaluation of a strawberry-harvesting robot in a field test. Biosyst. Eng. 2010, 105, 160–171. [Google Scholar] [CrossRef]
  19. Xiong, Y.; Ge, Y.; Grimstad, L.; From, P.J. An autonomous strawberry-harvesting robot: Design, development, integration, and field evaluation. J. Field Robot. 2020, 37, 202–224. [Google Scholar] [CrossRef] [Green Version]
  20. Zhaoxiang, L.; Gang, L. Apple maturity discrimination and positioning system in an apple harvesting robot. N. Z. J. Agric. Res. 2007, 50, 1103–1113. [Google Scholar] [CrossRef]
  21. Choi, K.; Lee, G.; Han, Y.J.; Bunn, J.M. Tomato maturity evaluation using color image analysis. Trans. Am. Soc. Agric. Eng. 1995, 38, 171–176. [Google Scholar] [CrossRef]
  22. Wang, X.; Mao, H.; Han, X.; Yin, J. Vision-based judgment of tomato maturity under growth conditions. Afr. J. Biotechnol. 2011, 10, 3616–3623. [Google Scholar] [CrossRef]
  23. Zhang, L.; Jia, J.; Gui, G.; Hao, X.; Gao, W.; Wang, M. Deep Learning Based Improved Classification System for Designing Tomato Harvesting Robot. IEEE Access 2018, 6, 67940–67950. [Google Scholar] [CrossRef]
  24. Altaheri, H.; Alsulaiman, M.; Muhammad, G. Date Fruit Classification for Robotic Harvesting in a Natural Environment Using Deep Learning. IEEE Access 2019, 7, 117115–117133. [Google Scholar] [CrossRef]
  25. Brown, J.; Sukkarieh, S. Design and Evaluation of a Modular Robotic Plum Harvesting System Utilising Soft Components. arXiv 2020, arXiv:abs/2007.06315. [Google Scholar]
  26. Mim, F.S.; Galib, S.M.; Hasan, M.F.; Jerin, S.A. Automatic detection of mango ripening stages—An application of information technology to botany. Sci. Hortic. 2018, 237, 156–163. [Google Scholar] [CrossRef]
  27. Kader, A.A. Fruit maturity, ripening, and quality relationships. Acta Hortic. 1999, 485, 203–208. [Google Scholar] [CrossRef]
  28. Fox, A.J.; Del Pozo-Insfran, D.; Joon, H.L.; Sargent, S.A.; Talcott, S.T. Ripening-induced chemical and antioxidant changes in bell peppers as affected by harvest maturity and postharvest ethylene exposure. Hortscience 2005, 40, 732–736. [Google Scholar] [CrossRef] [Green Version]
  29. Harel, B.; Kurtser, P.; Parmet, Y.; Edan, Y. Sweet pepper maturity evaluation. Adv. Anim. Biosci. 2017, 8, 167–171. [Google Scholar] [CrossRef]
  30. Harel, B.; Kurtser, P.; Herck, L.V.; Parmet, Y.; Edan, Y. Sweet pepper maturity evaluation via multiple viewpoints color analyses. In Proceedings of the International Conference on Agricultural Engineering CIGR-AgEng, Aarhus, Denmark, 26–29 June 2016; pp. 1–7. [Google Scholar]
  31. Harel, B.; van Essen, R.; Parmet, Y.; Edan, Y. Viewpoint Analysis for Maturity Classification of Sweet Peppers. Sensors 2020, 20, 3783. [Google Scholar] [CrossRef] [PubMed]
  32. Harel, B.; Edan, Y.; Perlman, Y. Optimization Model for Selective Harvest Planning Performed by Humans and Robots. Appl. Sci. 2022, 12, 2507. [Google Scholar] [CrossRef]
  33. Dutta, R.; Chaudhury, S.; Banerjee, S. Active recognition through next view planning: A survey. Pattern Recognit. 2004, 37, 429–446. [Google Scholar] [CrossRef] [Green Version]
  34. Vázquez, P.P.; Feixas, M.; Sbert, M.; Heidrich, W. Viewpoint Selection using Viewpoint Entropy. In Proceedings of the Vision Modeling and Visualization Conference (VMV-01), Stuttgart, Germany, 21–23 November 2001; pp. 273–280. [Google Scholar] [CrossRef]
  35. Bajcsy, R. Active Perception. Proc. IEEE 1988, 76, 966–1005. [Google Scholar] [CrossRef]
  36. MacKay, D.J.C. Information-Based Objective Functions for Active Data Selection. Neural Comput. 1992, 4, 590–604. [Google Scholar] [CrossRef]
  37. Foix, S.; Alenyà, G.; Torras, C. 3D Sensor planning framework for leaf probing. In Proceedings of the IEEE International Conference on Intelligent Robots and Systems, Hamburg, Germany, 28 September–2 October 2015; pp. 6501–6506. [Google Scholar] [CrossRef] [Green Version]
  38. Kurtser, P.; Edan, Y. The use of dynamic sensing strategies to improve detection for a pepper harvesting robot. In Proceedings of the IEEE International Conference on Intelligent Robots and Systems, Madrid, Spain, 1–5 October 2018; pp. 8286–8293. [Google Scholar] [CrossRef]
  39. Hemming, J.; Ruizendaal, J.; Hofstee, J.W.; van Henten, E.J. Fruit detectability analysis for different camera positions in sweet-pepper. Sensors 2014, 14, 6032–6044. [Google Scholar] [CrossRef] [Green Version]
  40. Kurtser, P.; Edan, Y. Statistical models for fruit detectability: Spatial and temporal analyses of sweet peppers. Biosyst. Eng. 2018, 171, 272–289. [Google Scholar] [CrossRef]
  41. boerenbond.be. Boerenbond. Paprika. 2020. Available online: https://www.boerenbond.be/markten/groenten/paprika (accessed on 12 June 2020).
  42. sweeper-robot.eu. Sweeper FAQ. 2019. Available online: http://www.sweeper-robot.eu/10-article/54-sweeper-faq (accessed on 17 December 2019).
  43. Shannon, C.E. A Mathematical Theory of Communication. Bell Syst. Tech. J. 1948, 27, 379–423. [Google Scholar] [CrossRef] [Green Version]
  44. Lehnert, C.; Mccool, C.; Sa, I.; Perez, T. Performance improvements of a sweet pepper harvesting robot in protected cropping environments. J. Field Robot. 2020, 37, 1197–1223. [Google Scholar] [CrossRef]
  45. Deinzer, F.; Derichs, C.; Niemann, H.; Denzler, J. A framework for actively selecting viewpoints in object recognition. Int. J. Pattern Recognit. Artif. Intell. 2009, 23, 765–799. [Google Scholar] [CrossRef] [Green Version]
  46. Zemmour, E.; Kurtser, P.; Edan, Y. Automatic parameter tuning for adaptive thresholding in fruit detection. Sensors 2019, 19, 2130. [Google Scholar] [CrossRef] [Green Version]
  47. Arad, B.; Kurtser, P.; Barnea, E.; Harel, B.; Edan, Y.; Ben-Shahar, O. Controlled lighting and illumination-independent target detection for real-time cost-efficient applications. The case study of sweet pepper robotic harvesting. Sensors 2019, 19, 1390. [Google Scholar] [CrossRef] [Green Version]
  48. Sa, I.; Ge, Z.; Dayoub, F.; Upcroft, B.; Perez, T.; Mccool, C. DeepFruits: A Fruit Detection System Using Deep Neural Networks. Sensors 2016, 16, 1222. [Google Scholar] [CrossRef] [Green Version]
  49. Vitzrabin, E.; Edan, Y. Adaptive thresholding with fusion using a RGBD sensor for red sweet-pepper detection. Biosyst. Eng. 2016, 147, 45–56. [Google Scholar] [CrossRef]
Figure 1. Six different sides of the same pepper; some parts can be green while other parts are fully colored.
Applsci 12 04414 g001
Figure 2. The red and yellow peppers used in the experiments (classes 2, 3, and 4, from left to right).
Applsci 12 04414 g002
Figure 3. Camera mounted on robotic arm acquiring images of red sweet pepper mounted on a pepper plant.
Applsci 12 04414 g003
Figure 4. The six viewpoints are combinations of 3 different azimuth (a) and 2 different tilt (b) angles. Adapted from Harel et al. [31].
Applsci 12 04414 g004
Figure 5. Example point clouds of one red pepper from one viewpoint (a) and all six viewpoints combined (b).
Applsci 12 04414 g005
Figure 6. Dynamic viewpoint selection process.
Applsci 12 04414 g006
Figure 7. Point cloud from an initial viewpoint of a sweet pepper indicating the five boxes that have a corresponding next-viewpoint. The number corresponds to the next-viewpoint number.
Applsci 12 04414 g007
Figure 8. Influence of the pepper price on the average number of viewpoints and the classification accuracy for the red (a) and yellow (b) peppers. The green area indicates the range of sweet pepper market prices of 2019 as mentioned in Section 2.2.3.2.
Applsci 12 04414 g008
Figure 9. Influence of robot costs on the average number of viewpoints and the classification accuracy for the red (a) and yellow (b) peppers. The robot costs in the green area are regarded to be realistic, as mentioned in Section 2.2.3.2.
Applsci 12 04414 g009
Table 1. Yellow and red sweet peppers used in the experiments.
ClassClassification% ColoredNumber of Red PeppersNumber of Yellow Peppers
2Immature5–50%2323
3Mature50–95%2426
4Mature95–100%2221
Total 6970
Table 2. Confusion table defining the true positive (TP), false positive (FP), false negative (FN), and true negative (TN).
Actual
MatureImmature
PredictedMatureTPFP
ImmatureFNTN
Table 3. Classification accuracy (CA), true positive rate (TPR), and true negative rate (TNR) for single viewpoint, dynamic viewpoint selection, random viewpoint selection, all viewpoints, and the upper bound. For dynamic viewpoint selection, the CA per class is also indicated.
MethodClassRed PeppersYellow Peppers
CATPRTNRCATPRTNR
Single viewpointAll0.9070.9440.8330.8000.8920.611
Dynamic viewpoint selection20.944 0.778
30.947 0.762
41.000 1.000
All0.9630.9720.9440.8360.8650.778
Random viewpointAll0.9440.9720.8890.8550.8920.778
All viewpointsAll0.9630.9441.0000.8180.8380.778
Upper boundAll0.9811.0000.9440.9451.0000.833
Table 4. Percentage of classifications using more than one viewpoint, the additional cycle time, the total associated costs and associated costs per pepper for the single viewpoint, the dynamic viewpoint selection method, all viewpoints, and upper bound.
Red PeppersYellow Peppers
Single ViewpointDynamic Viewpoint SelectionAll ViewpointsUpper BoundSingle ViewpointDynamic Viewpoint SelectionAll ViewpointsUpper Bound
Peppers using additional viewpoint(s) (%)0%39%100%39%0%62%100%62%
Average additional cycle time (s)03.1444.082.7505.0644.084.53
Costs (EUR)MisclassificationEUR 0.98EUR 0.39EUR 0.39EUR 0.20EUR 2.22EUR 1.82EUR 2.02EUR 0.61
Additional sensingEUR 0.00EUR 0.08EUR 1.13EUR 0.07EUR 0.00EUR 0.13EUR 1.15EUR 0.12
TotalEUR 0.98EUR 0.47EUR 1.53EUR 0.27EUR 2.22EUR 1.95EUR 3.17EUR 0.73
Costs per pepper (EUR piece−1)EUR 0.018EUR 0.009EUR 0.028EUR 0.005EUR 0.040EUR 0.035EUR 0.058EUR 0.013
Table 5. Differences in consistent classification factor (CCF) and majority classification accuracy (MCA) for single viewpoint, dynamic viewpoint selection, all viewpoints, and the upper bound.
Pepper ColorPepper ClassSingle ViewpointDynamic ViewpointAll ViewpointsUpper Bound
CCFMCACCFMCACCFMCACCFMCA
Red20.420.710.570.861.000.860.860.86
30.861.000.710.860.710.860.861.00
41.001.001.001.001.001.001.001.00
All0.710.880.710.880.880.880.940.94
Yellow20.570.570.430.710.710.861.001.00
30.711.000.431.000.570.861.001.00
41.001.001.001.001.001.001.001.00
All0.710.830.520.880.710.881.001.00
Publisher’s Note: MDPI stays neutral with regard to jurisdictional claims in published maps and institutional affiliations.

