1. Introduction
The COVID-19 pandemic is the first genuinely 21st-century global pandemic [
1]. Not only due to its growth speed and wide spread [
2], but mainly because this is the first human pandemic that has arisen in the context of full-deployed globalization and the pervasive use of technology, giving clues on how to prepare for future similar events [
3]. The pandemic has also demonstrated how crisis can spark innovation in the context of information asymmetry and uncertainty. Governments, academia, corporations, and entrepreneurs rapidly assembled available resources to develop solutions to both treatments and prevention of the disease. Such efforts in innovating under uncertainty resemble the process entrepreneurs face when creating new ventures and launching new products and services.
Entrepreneurs facing uncertainty such as the global crisis created by the COVID-19 pandemic typically rely on nonpredictive logic such as effectuation to organize resources available at the moment and launch initial prototypes to solve specific problems [
4]. In this context, there are two government-led acceleration programs that have sparked innovation and entrepreneurial action, Operation Warp Speed (USA) and the COVID-19 Smart Management System (South Korea).
The U.S. government launched Operation Warp Speed [
5] to promote private and public partnerships, enabling a fast-track for the approval and production of COVID-19 vaccines. It applied a venture capital approach to investing in the discovery of an effective vaccine by funding private efforts in R&D, manufacturing, and logistics. Eventually, the program was able to bring to market new effective vaccines months before standard timelines. On the other hand, the South Korean government launched the COVID-19 Smart Management System, a system that allowed for the automation of the epidemiological investigation process by relying on the application of Smart City technologies to collect, process, and analyze large volumes of urban data. It created the informational background that allowed for the effective “Track, Trace, and Test” strategy applied in country to contain the pandemic by analyzing people’s displacement flows at the city level [
6,
7].
These programs are examples of how entrepreneurial action combined with technological advances can effectively create warning systems that prevent future outbreaks. As societies assess the human and economic consequences of the COVID-19 pandemic, the increasing development of new and accessible technologies can provide novel warning applications. Smartphones, IoT-connected devices, and wireless sensor networks can supply an additional layer of information for innovative early warning systems (EWS) by monitoring human behavior (e.g., human overcrowding) and combining it with other data sources.
In this paper, a predictive location-based early warning system is proposed, implemented, and tested in real testbeds. The proposal is able to measure people density, people flow, and behavior in specific areas of indoor and outdoor environments. The hypothesis to be tested is two-fold:
First, to determine if an effectual approach could be applied in an engineering environment with previous solid experience in research but less experience in innovation and the creation of minimum viable products with a high technology readiness level (TRL). To the authors’ knowledge, there is a lack of contribution in the research literature approaching effectuation from the perspectives of information and communication engineering.
Second, to propose and implement the system and evaluate its performance during a long period of time in a non-controlled environment (a real scenario as it would be the case of a high TRL 7–8). Technological innovation projects would be TRL 8, since technological innovation requires the introduction of a new product or service in the market, and for this purpose, tests and certifications must have been passed as well as all the relevant approvals. Once this phase is completed, large-scale deployment or implementation will follow. Observe that this work starts from a TRL6, verified by simulations in other scenarios, to TRL 7, testing the system in the real scenario. Then, it moves to TRL8, certifying the system/product to be used as a commercial solution and is now available for companies as technology transfer from the university.
The proposed warning system measurements include several key performance indicators such as the number of people that enter a specific location in a given time, the average time spent in particular areas, or the amount and density of people that interact over a particular period. An EWS sensor data fusion approach was adopted in this work by combining multiple sensor data sources using Internet of Things (IoT) technology, artificial intelligence algorithms, and application programming interfaces, creating a robust real-time early warning system for pandemic control at specific areas, allowing for efficient, cost-effective event prevention policy implementation and community warning. This EWS approach to disease outbreaks in a population can serve as a critical application toward a more extensive adoption of intelligent management systems by health organizations and multiple stakeholders. Such systems, combined with appropriate infrastructure, data hubs, and service applications at the city/regional level, can eventually lead to the implementation of smart cities, significantly improving the overall quality of life for citizens and creating a trusted system for governments and organizations to manage event-led situations.
The rest of the paper is organized as follows.
Section 2 explains how complex contexts such as those where warning systems are used can become a booster for innovation and how effectuation can be applied. In
Section 3, previous works from the scientific literature are presented.
Section 4 describes the proposed warning system and presents the results. Finally, the paper ends by summarizing the most important findings in the conclusions.
2. Innovation, Effectuation, and COVID-19 Contact Tracing
The creation of new ventures is an uncertain initiative. Entrepreneurs and innovators create new products and services to reduce existing information asymmetries and create value while solving a problem faced by one or many individuals [
4,
8,
9,
10,
11]. In this context, creating an EWS for pandemic control is an impactful innovation that allows for novel solutions for an unknown problem with drastic consequences for humankind. Understanding how innovation emerges in such a context is critical so that EWS can evolve and iterate, improving its efficiency as an essential tool for planning and preventing events such as a pandemic.
In brief, the innovation process and expertise typically consist of non-predictive control heuristics, organized under the concept of effectuation [
12]. Expert entrepreneurs and innovators apply the effectual principles while addressing the uncertainties faced in creating a new product and service. Such principles can be summarized as follows:
Bird-in-hand principle: they build a new venture not necessarily with a goal in mind, but with the most basic resources and means they have at hand, who they are, what they know, and whom they know. From that starting point, they start imagining possibilities.
Affordable loss principle: they do not place large bets with the expectation of high returns. Instead, they limit risk by understanding what they can afford to lose at each step in creating a new venture. By adopting this approach, they select actions and goals with upsides even if downsides occur in the outcome.
Crazy quilt principle: they reduce uncertainty by partnering with self-selecting stakeholders. These partners and stakeholders join the venture creation process without any specific predetermined goal. Instead, they make initial commitments to shape the goals of the new venture and co-create a new market for it.
Lemonade principle: they embrace and leverage contingencies and surprises instead of rejecting them. By doing so, they interpret potential bad outcomes as clues and insights to iterate and create new products, services, and markets. They make lemonade when life throws them lemons.
Pilot in the plane: they focus on actions within their control instead of relying on trends or inevitable outcomes. They assume the future is not found or predicted, but it is made through human action.
These principles imply a high likelihood of innovation while keeping potential losses under control and undermine the socially accepted relationship between risk and reward. Initiatives such as Operation Warp Speed and COVID-19 Smart Management System are examples of these principles in action in the process of creating new products (vaccines, antivirals) and services (contact tracing) under uncertainty (during a pandemic). Conversely, it is worth noting the early efforts of governments and organizations worldwide during the initial phases of the COVID-19 crisis in creating effective mobile contact tracing apps, with limited if not inexistent results.
A case in point of early attempts to innovate by creating a global solution for COVID-19 contact tracing is the joint venture between Apple and Google that together created an Exposure Notification System [
13,
14,
15] based on BLE technology. Since both companies have combined more than 99% of the mobile operating system market share worldwide, a mobile-first solution to track, trace, and communicate positive COVID-19 cases would have immediate global coverage if adopted early [
16,
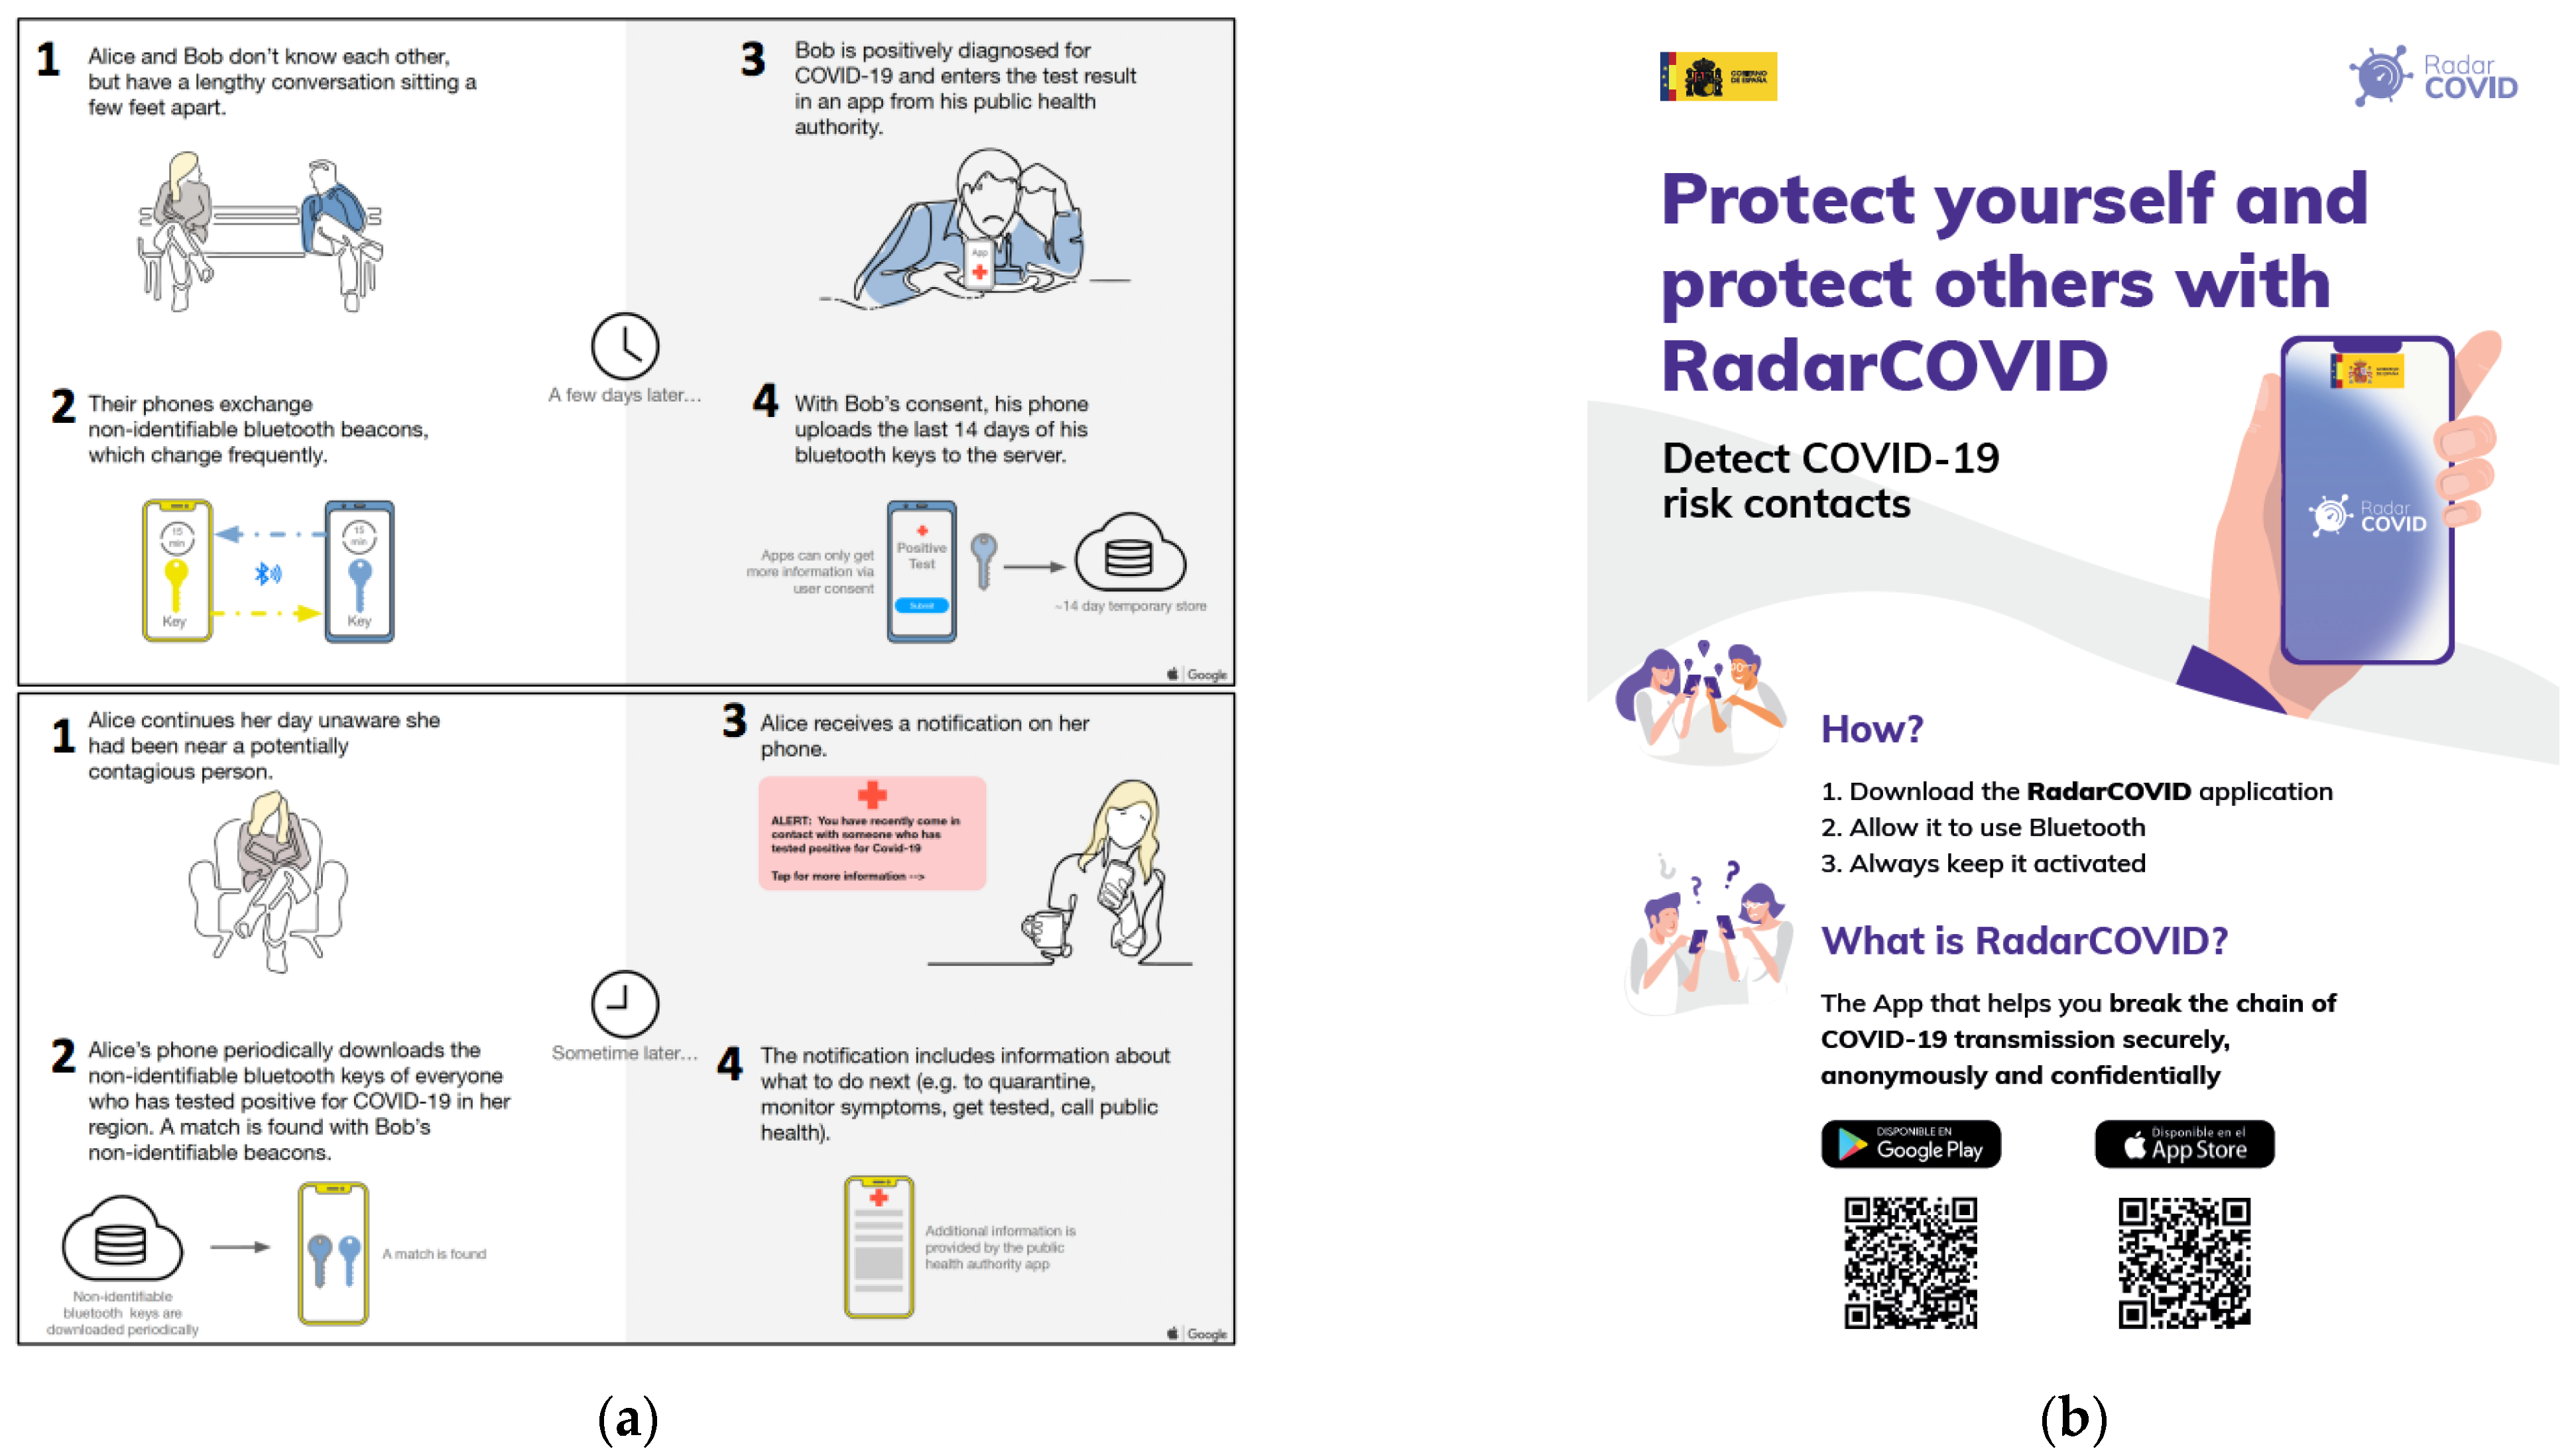
17]. The system uses the mobile phone’s BLE technology, allowing the exchange of non-identifiable Bluetooth beacons to collect and notify anonymous data of diagnosed COVID-19 individuals, helping governments and health agencies effectively monitor outbreaks while allowing individuals to self-monitor their personal exposure risks. The system operates as shown in
Figure 1a. Let us assume that Alice and Bob carry a smartphone. They do not know each other, but they remain close to each other when talking. During this time, while they remain close (a few feet apart), their phones will exchange non-identifiable beacons. Afterward, if Bob is COVID-19 positive, he will communicate his positive status to the corresponding public health authority and with his consent, his phone will upload the last 14 days of beacons to a server. Meanwhile, Alice’s phone periodically receives the beacons of positive cases from the server, looking for a match with the beacons stored in her phone (e.g., Bob’s beacons). Because Bob has advised of his positive status, Alice’s phone will find a match and she will receive a notification.
Several countries have adopted the Apple and Google proposed methodology and deployed their own national notification applications. An example of such an app is Radar Covid, launched in Spain in August 2020 (
Figure 1b) with European-wide interoperability amongst other apps using the same technological approach and sharing the same European accepted privacy standards. Nevertheless, a succession of failed communication efforts, an increasing mistrust of the population about data privacy, and a non-intuitive code certification process to make the app effective eventually undermined its use. By March 2021, Radar Covid hit bottom in its adoption after topping seven million downloads, as seen in
Table 1, covering less than 20% of the population, with an average ratio of COVID-19 cases effectively detected through the app averaging 1.14% by December 2021 (see
Table 1). By January 2022, the Spanish government stopped the active tracing of close contacts of COVID-19 infected individuals. While still keeping Radar Covid functional, the app stopped being effectively used after 14 months of its implementation [
18].
Radar Covid can be seen as a case in point of how IoT services (and the IoT market) came into existence in the context of uncertainty and a pre-existing market (an explicit demand to detect and report Covid infected individuals). Nevertheless, despite significant government efforts and clear benefits at the individual and collective levels, the failure in its adoption can open a broader discussion about the more extensive IoT adoption by industries and individuals. In our view, the illustrative case of a failure in the adoption of Radar Covid and other contact tracing apps worldwide [
23,
24,
25] should not prevent further innovation in creating effective early warning systems to prevent future pandemics.
In previous research projects, the authors of this work investigated intelligent transportation systems, particularly on how to reduce pollution and improve key traffic performance indicators (e.g., travel time, congestion, etc.) by using smart algorithms. Some of our results demonstrated the importance of considering the behavior of pedestrians when making traffic control decisions [
26,
27]. Applying effectuation and embracing the effectual approach, the authors decided to use their acquired know-how in pedestrians and vehicular management to create an EWS tool able to monitor people’s behavior in indoor or outdoor areas during the COVID-19 pandemic. The new early warning system, as described in
Section 4, was not only designed, but also implemented, deployed, and tested in a real testbed using the authors’ experience with early tested innovations using sensors and IoT systems in vehicular traffic monitoring and control. The team was composed of two graduate students, one senior member with extensive business experience in strategy consulting and product development, and one senior member with solid research experience in intelligent systems. A sensor data fusion first approach was followed, which combined multiple sensor data sources, artificial intelligence algorithms, and APIs to create a robust real-time early warning system for pandemic control in specific areas. From the authors’ view, this approach allows for efficient, cost-effective event prevention policy implementation and community warning while avoiding many of the pitfalls seen in cases such as Radar Covid.
Regarding previous works in effectuation and its role in innovation, to the authors’ knowledge, there is a lack of contributions from an engineering perspective in the context of information asymmetry and uncertainty. In [
28], the authors carried out a study to avail decision-making mechanisms when creating a new product using a game console as an example. In the light of their conclusions, there was a clear linkage between business models, causation processes, and effectuation, with the former being the focus of their research. In [
29], the authors explored the role of individual business founders presenting a qualitative analysis about when effectuation and causation were employed as decision-making logics. Finally, in [
30,
31], it was shown how effectual logic and principles were embraced during the development of new products.
3. State-of-the-Art in Warning Systems Based on Radio Frequency Technologies
The study of people’s behavior in indoor and outdoor areas was addressed from three different perspectives, namely, using sensors [
32,
33,
34,
35,
36], using image processing [
37], or using historical data and applying predictive models [
38]. In this section, a review of the works carried out to estimate people’s behavior using sensors and wireless technologies is presented.
One of the first works to derive the number of people from the imprint left on radio frequency (RF) signals was conducted in [
39]. The proposal was based on the use of received signal strength (RSS) and a link quality indicator (LQI) to obtain an estimation of crowd density. They assumed that there was a linear relationship between the number of people between two nodes (transmitter and receiver of RF signals) and both the RSS amplitude (decreasing) and the RSS variance (increasing). They also assumed that the LQI replicated this behavior. Experimentally, they demonstrated that their hypothesis was true. Indoor tests were conducted in two scenarios, namely a Zigbee wireless sensor network and a WiFi 802.11b network. In the latter, only RSS was measured. As the authors indicated in their work, the accuracy of the system should be improved. In [
40], an improvement to [
39] was introduced. The new method was based on using successive signal cancellation in an iterative manner to count people in indoor scenarios. The procedure was as follows: first, the testing scenario was empty, and they measured the ambient RSS in this condition. Then, a person walked randomly, and they measured the RSS, so by subtracting the obtained measurement from the ambient RSS, the authors quantified the impact of one person on the RSS values. However, they were aware that the relationship between the number of people and the RSS variation was not linear. They therefore proposed a consecutive iterative cancellation method, selecting at each iteration the strongest signal to be subtracted from the RSS until no further presence was detected (i.e., sequential counting). The authors obtained good results, although limited to a very low number of people. The reason is that their proposal cannot yet deal with a severe multipath effect.
Aiming to improve the accuracy of previous proposals and following the same device-free trend, two methods were proposed in [
41] to estimate the number of people in an indoor environment. The two proposals were based on linear regression and vector regression using the RSS of WiFi signals as the physical descriptor. For the evaluation, they used dedicated wireless devices (Raspberry Pi). The suggested method was as follows: the wireless devices calculated the RSS of the signal received from the WiFi Access Point (AP). These values were then collected by a computer, which estimated the number of people in the room. For the estimation, linear regression or vector regression—non-linear regression based on support vector machine (SVM)—was employed. The coefficients of the regression formula were previously calculated with historical real data obtained from the experiments. One of the main findings of this work is the corroboration that there was no linear relationship between RSS variations and the number of people in the room.
In [
42], the effect of moving people on the received RSS was studied from two different perspectives: the blocking of the line of sight (LoS) and the multipath effect. Once characterized, they combined both to obtain the probability distribution of the received signal amplitude as a function of the number of people in the scene. Then, the Kullback–Leibler divergence was applied to match the experimental measurements with the previously assessed analytical expression. The parameter that minimized the divergence between both was interpreted as the resulting people estimation. One possible limitation of this work is that they first modeled the pedestrian movement from the experiments. Given the limited conditions of this test (i.e., few people, perhaps of the same age and thus with a similar walking profile, walking alone, etc.), it would be necessary to verify the results with more random groups of people, in higher numbers, etc. This is because, for instance, the probability of blocking the LoS was obtained by applying the previously defined motion model. Results were very robust with an estimated error of less than two people (out of 9) with directional antennas. With omnidirectional antennas results were worse, although still good compared with other proposals.
Another interesting proposal was suggested in [
43]. The method was based on CSI measurements. The authors attempted to obtain a relationship between CSI and the number of moving people. A new metric was introduced, namely percentage of non-zero element (PEM), which represents the number of non-zero elements of the dilated CSI matrix. This metric is directly proportional to the crowd size, giving a saturation value for a specific number of people. Its performance is more accurate than [
40]. Similarly, a novel system was proposed in [
44], also based on CSI measurements, which did not need to be trained in the same environment where the tool was to be used. The proposal was based on analyzing the Doppler spectrum obtained via the CSI in a WiFi network, but without employing a reference signal (i.e., it cannot be classified as a radar-like approach). The idea lies in the fact that the Doppler spectrum varies according to the number of people in an indoor environment. More particularly, the authors observed the time variations of the channel frequency response (CFR) represented in the Doppler. The selected feature for people estimation was the spectral kurtosis of the Doppler spectrum. They used a device as processing equipment. This device sends a ping to the WiFi AP and the WiFi AP replies. The response is then used to obtain the CSI and CFR. Experiments in different rooms and with the same number of freely moving people (limited to seven) were carried out. Good accuracy of more than 92% was obtained in the performed tests.
In [
45], the performance of CSI-based and RSS-based crowd-counting systems in the same indoor scenarios was compared. In addition to the relatively good accuracy in counting people that both approaches offered, the authors discovered two interesting facts. First, the RSS-based proposal presented good results when blocking the LoS was the main signal impairment. Second, the CSI-based solution was less dependent on the indoor scenario (e.g., room size) compared to the RSS-based solution.
From a totally different perspective, Wi-Counter was introduced in [
46]. This method used RSS as the physical layer input data, but the proposal falls into a device-based category, that is, using data that are generated by people’s own wireless devices (e.g., smartphones). The proposal operated as follows. There was a preprocessing step to eliminate noise and disturbances; specifically, using the Wiener filter and Newton interpolation. Then, there was a learning/training phase employing neural networks to learn the relationship between WiFi signals and number of people. There were also two sub-phases. One offline sub-phase to assess the eigenvalues relating RSS and people from captured data. Then, eigenvalues were introduced into the model and trained using a sigmoid activation function. Afterward, another online sub-phase, where real WiFi signals were captured, the eigenvalues were calculated and used as input to the already trained model to obtain the estimated number of people. A notable accuracy of 93% was achieved, but tests were only carried out in indoor environments. More importantly, the method required user cooperation for data gathering, which was later used in offline training.
Another crowd-counting device-based system that also used the WiFi-enabled signals from the users’ mobile phones was presented in [
47]. Unlike [
46], that proposal was not anonymous. An OpenWrt device captured all WiFi frames from the defined area of interest (i.e., not only probe request frames sent by mobile devices, but all existing frames). To do so, they employed the promiscuous listening mode. Each MAC address was associated with a unique identifier (ID). Other information such as RSS was also stored. An RSS threshold was set to avoid observers that did not participate in the event but were temporarily within the region of interest. The number of people was obtained simply by eliminating those IDs with RSS values that were below the set threshold and by adding the remaining unique IDs. The robustness of this system was assessed in an indoor scenario. The accuracy achieved was 83% compared with visual accuracy. Nevertheless, the proposal presents some limitations. First, privacy concerns arise due to the use and storing of unique information from mobile devices. Second, the crowd estimation is obtained after the end of the event. In other words, it is not useful for real-time estimations. As stated by the authors, further improvement is needed, for instance, it is not clear whether it could be used with a moving crowd since a RSS threshold should be defined in advanced, among other concerns.
Following the same approach, a crowd estimation system based on capturing the probe request frames from the users’ mobile devices was proposed in [
48]. The most remarkable particularity of this proposal is that it was designed and tested on a bus, thus providing a novel scenario with interesting insights for intelligent transportation systems (ITS). The algorithm only used timestamps and RSS measurements for its operation, leaving the use of other available information from the probe request frames (e.g., MAC, SSID, WiFi card driver, channel frequency, etc.) for future work. Each bus was equipped with a scanner node, the goal of which was to gather the probe request frames. All captured frames were then sent to a central server that processed them. Two intervals were defined, namely, the active interval and present interval. The present interval was the time that elapsed since the first probe request frame from device A was received until device A was considered to be within the bus. Active interval was the maximum allowed time between consecutive probe request frames from the same device. By using these two intervals and a RSS threshold, the system was expected to estimate the number of passengers on the bus. The values for these parameters were heuristically obtained based on two bus trips with only one scanner node and without implementing communications with the central server. Although the proposal was simple, the accuracy was very low, given its very incipient state.
4. Smart IoT-Based Early Warning System
In this section, the proposal is described. It has been designed as an AI-powered solution that analyzes people flow and predicts their next move, generating strategic and tactical insights at the operational level. The key performance indicators that our system generated were the number of people in a specific location in a given time, the average time spent in particular areas, and the number and density of people that interacted over a particular period, among others.
As depicted in
Figure 2, our proposal (called Dolphin) followed a sensor fusion approach, specifically operating as a data level fusion algorithm, merging sensor data from different sources in a way that less uncertainty is present in the output information than would be obtained if raw data were processed separately [
49]. Thus, at the first level, the low-cost IoT devices were selected and deployed. Off-the-shelf IoT devices were selected to accelerate the implementation phase. These devices (e.g., Raspberry Pi 3 and Raspberry Pi Zero W) incorporate both Bluetooth low energy (BLE) and WiFi communication modules. People carrying any portable device compatible with BLE and/or WiFi would then be detected by our proposal. It is important to note that all processes included in our system are secure-by-design (i.e., no personal identifiable information (PII) is stored at any time, and temporal non-recoverable virtual identifiers are created from BLE and WiFi device information using hash functions and temporal keys). These anonymized data from detected devices are then transmitted to the edge nodes using the Message Queuing Telemetry Transport (MQTT) protocol. MQTT is a standard messaging protocol for the IoT with numerous advantages [
50,
51]. One of them is its design as a lightweight messaging transportation, which makes it a much more energy efficient option compared to other alternatives such as Hypertext Transfer Protocol (HTTP). MQTT follows a topic-based publish–subscribe operation mode. Its header size is small, so it optimizes network bandwidth. MQTT messages can be sent in both directions, from IoT nodes to the edge devices or the cloud and vice versa, hence allowing more versatility in the system design. Finally, it is possible to enable encryption for the exchanged MQTT messages and different levels of quality of service (QoS) can be configured. Consequently, it has been used in some interesting previous works related to IoT-based monitoring [
52].
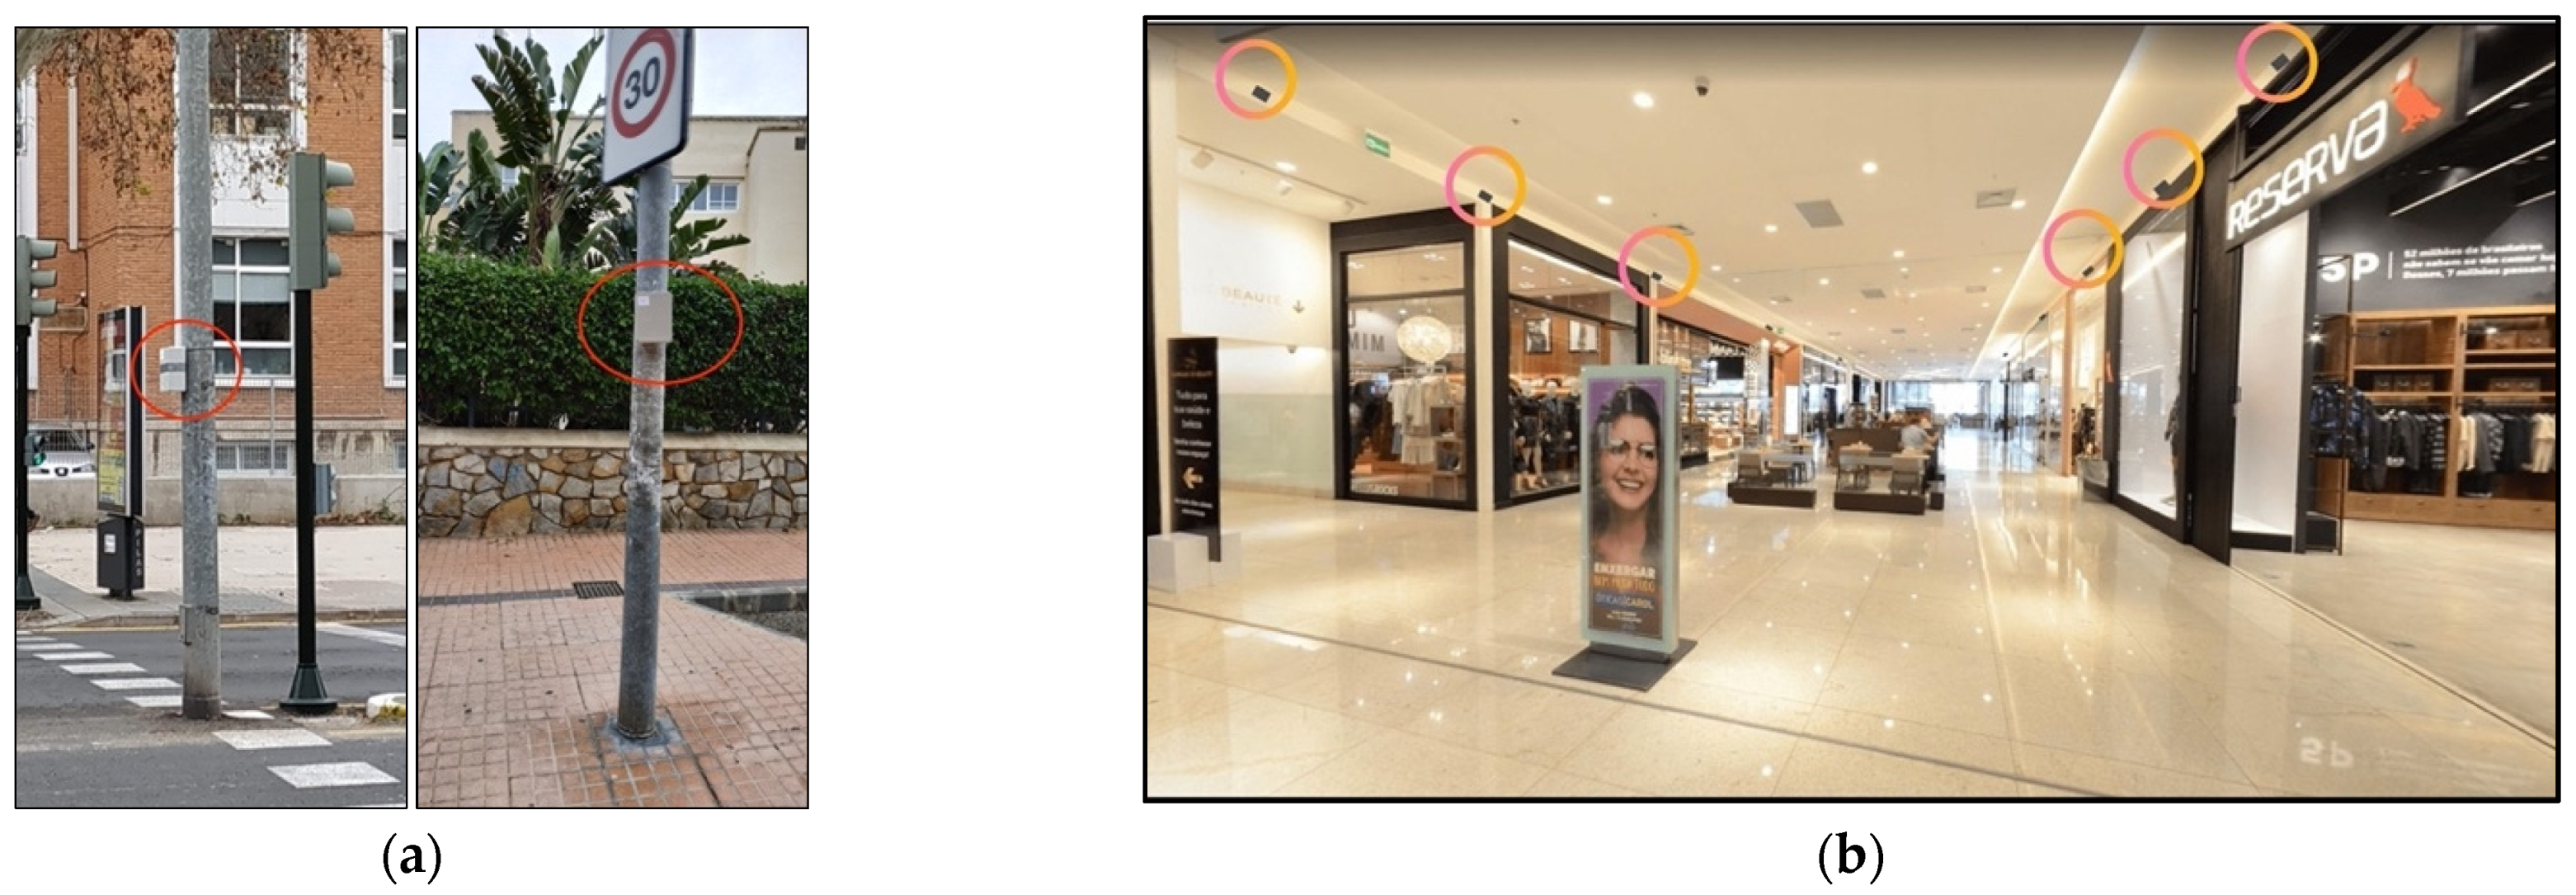
Edge nodes are also IoT devices whose function is not to capture data but to apply the first level of processing by applying a machine learning (ML) algorithm that locates the anonymized device’s carrier with an estimated error smaller than 1 m in indoor areas. The error estimation as well as the initial configurations were calculated by carrying out extensive experimental tests in two control testbeds, one indoor and one outdoor (see
Figure 3).
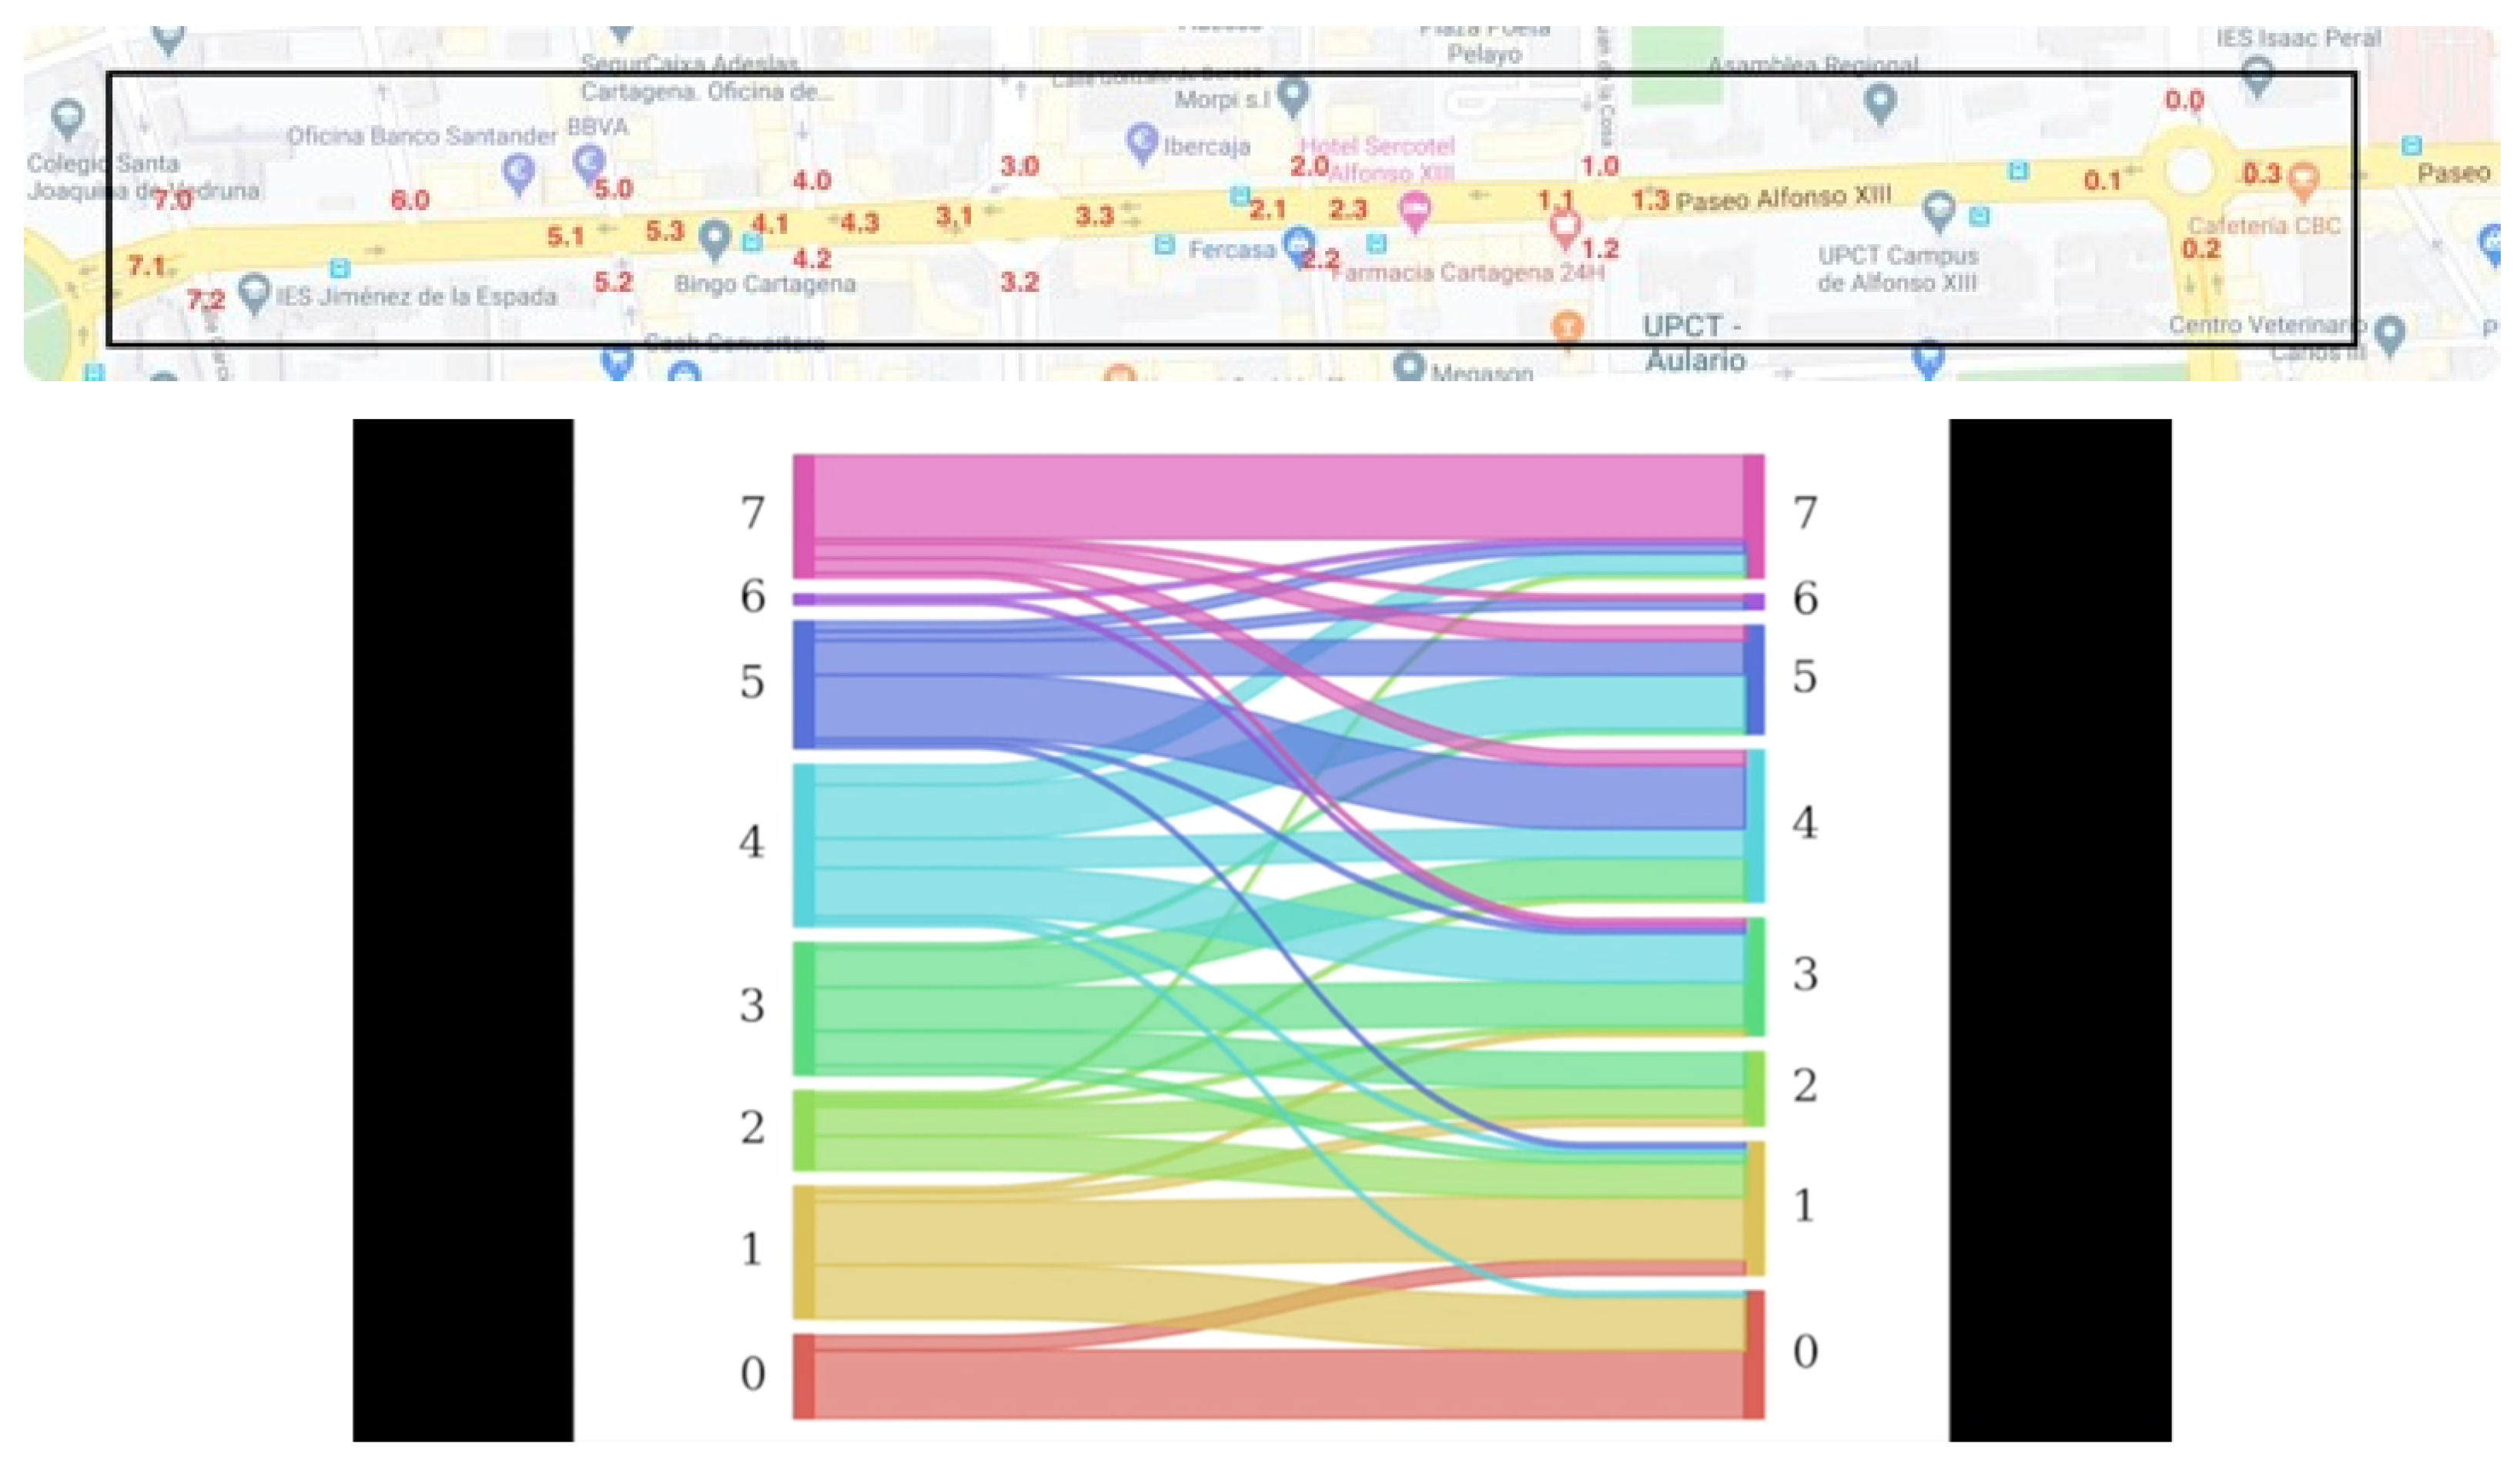
Figure 4 illustrates the initial results in terms of pedestrian flows in the outdoor real scenario. The supervised ML algorithm for indoor geolocation was based on a convolutional neural network and is currently under an intellectual property process. Then, the output of the algorithm, composed of the
x and
y coordinates of all located virtual identifiers within the geographical area under monitoring, is then sent by the edge nodes to the central servers at the cloud. In our experiments, only one server was needed to deal with the amount of data generated (≈1.8 GB of data per month).
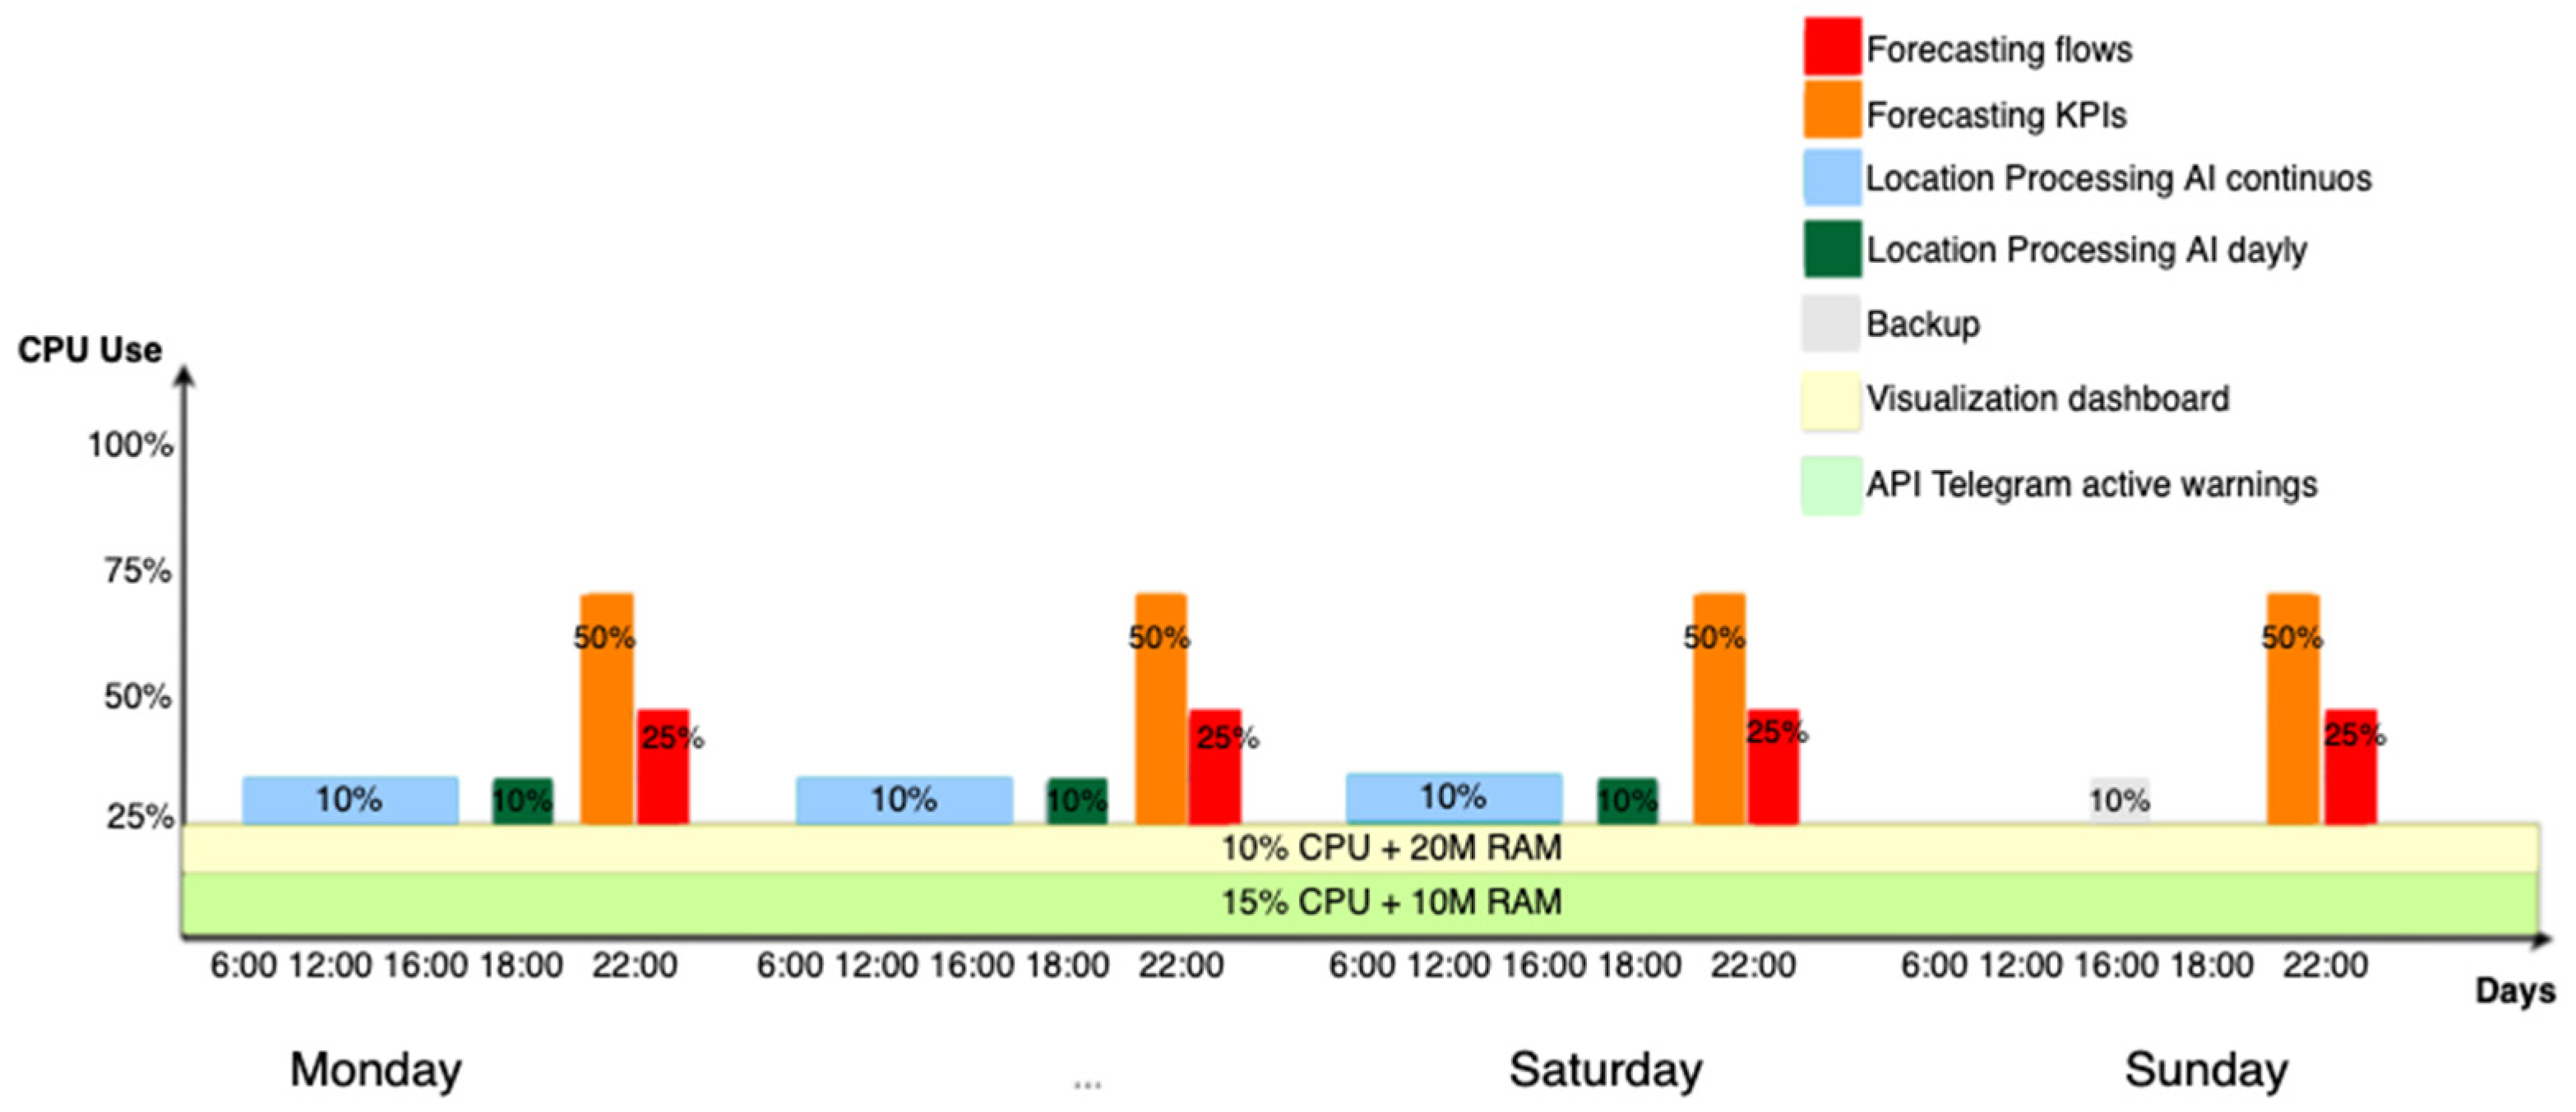
Table 2 includes the characteristics of the cloud server and an example of the CPU usage of the server is depicted in
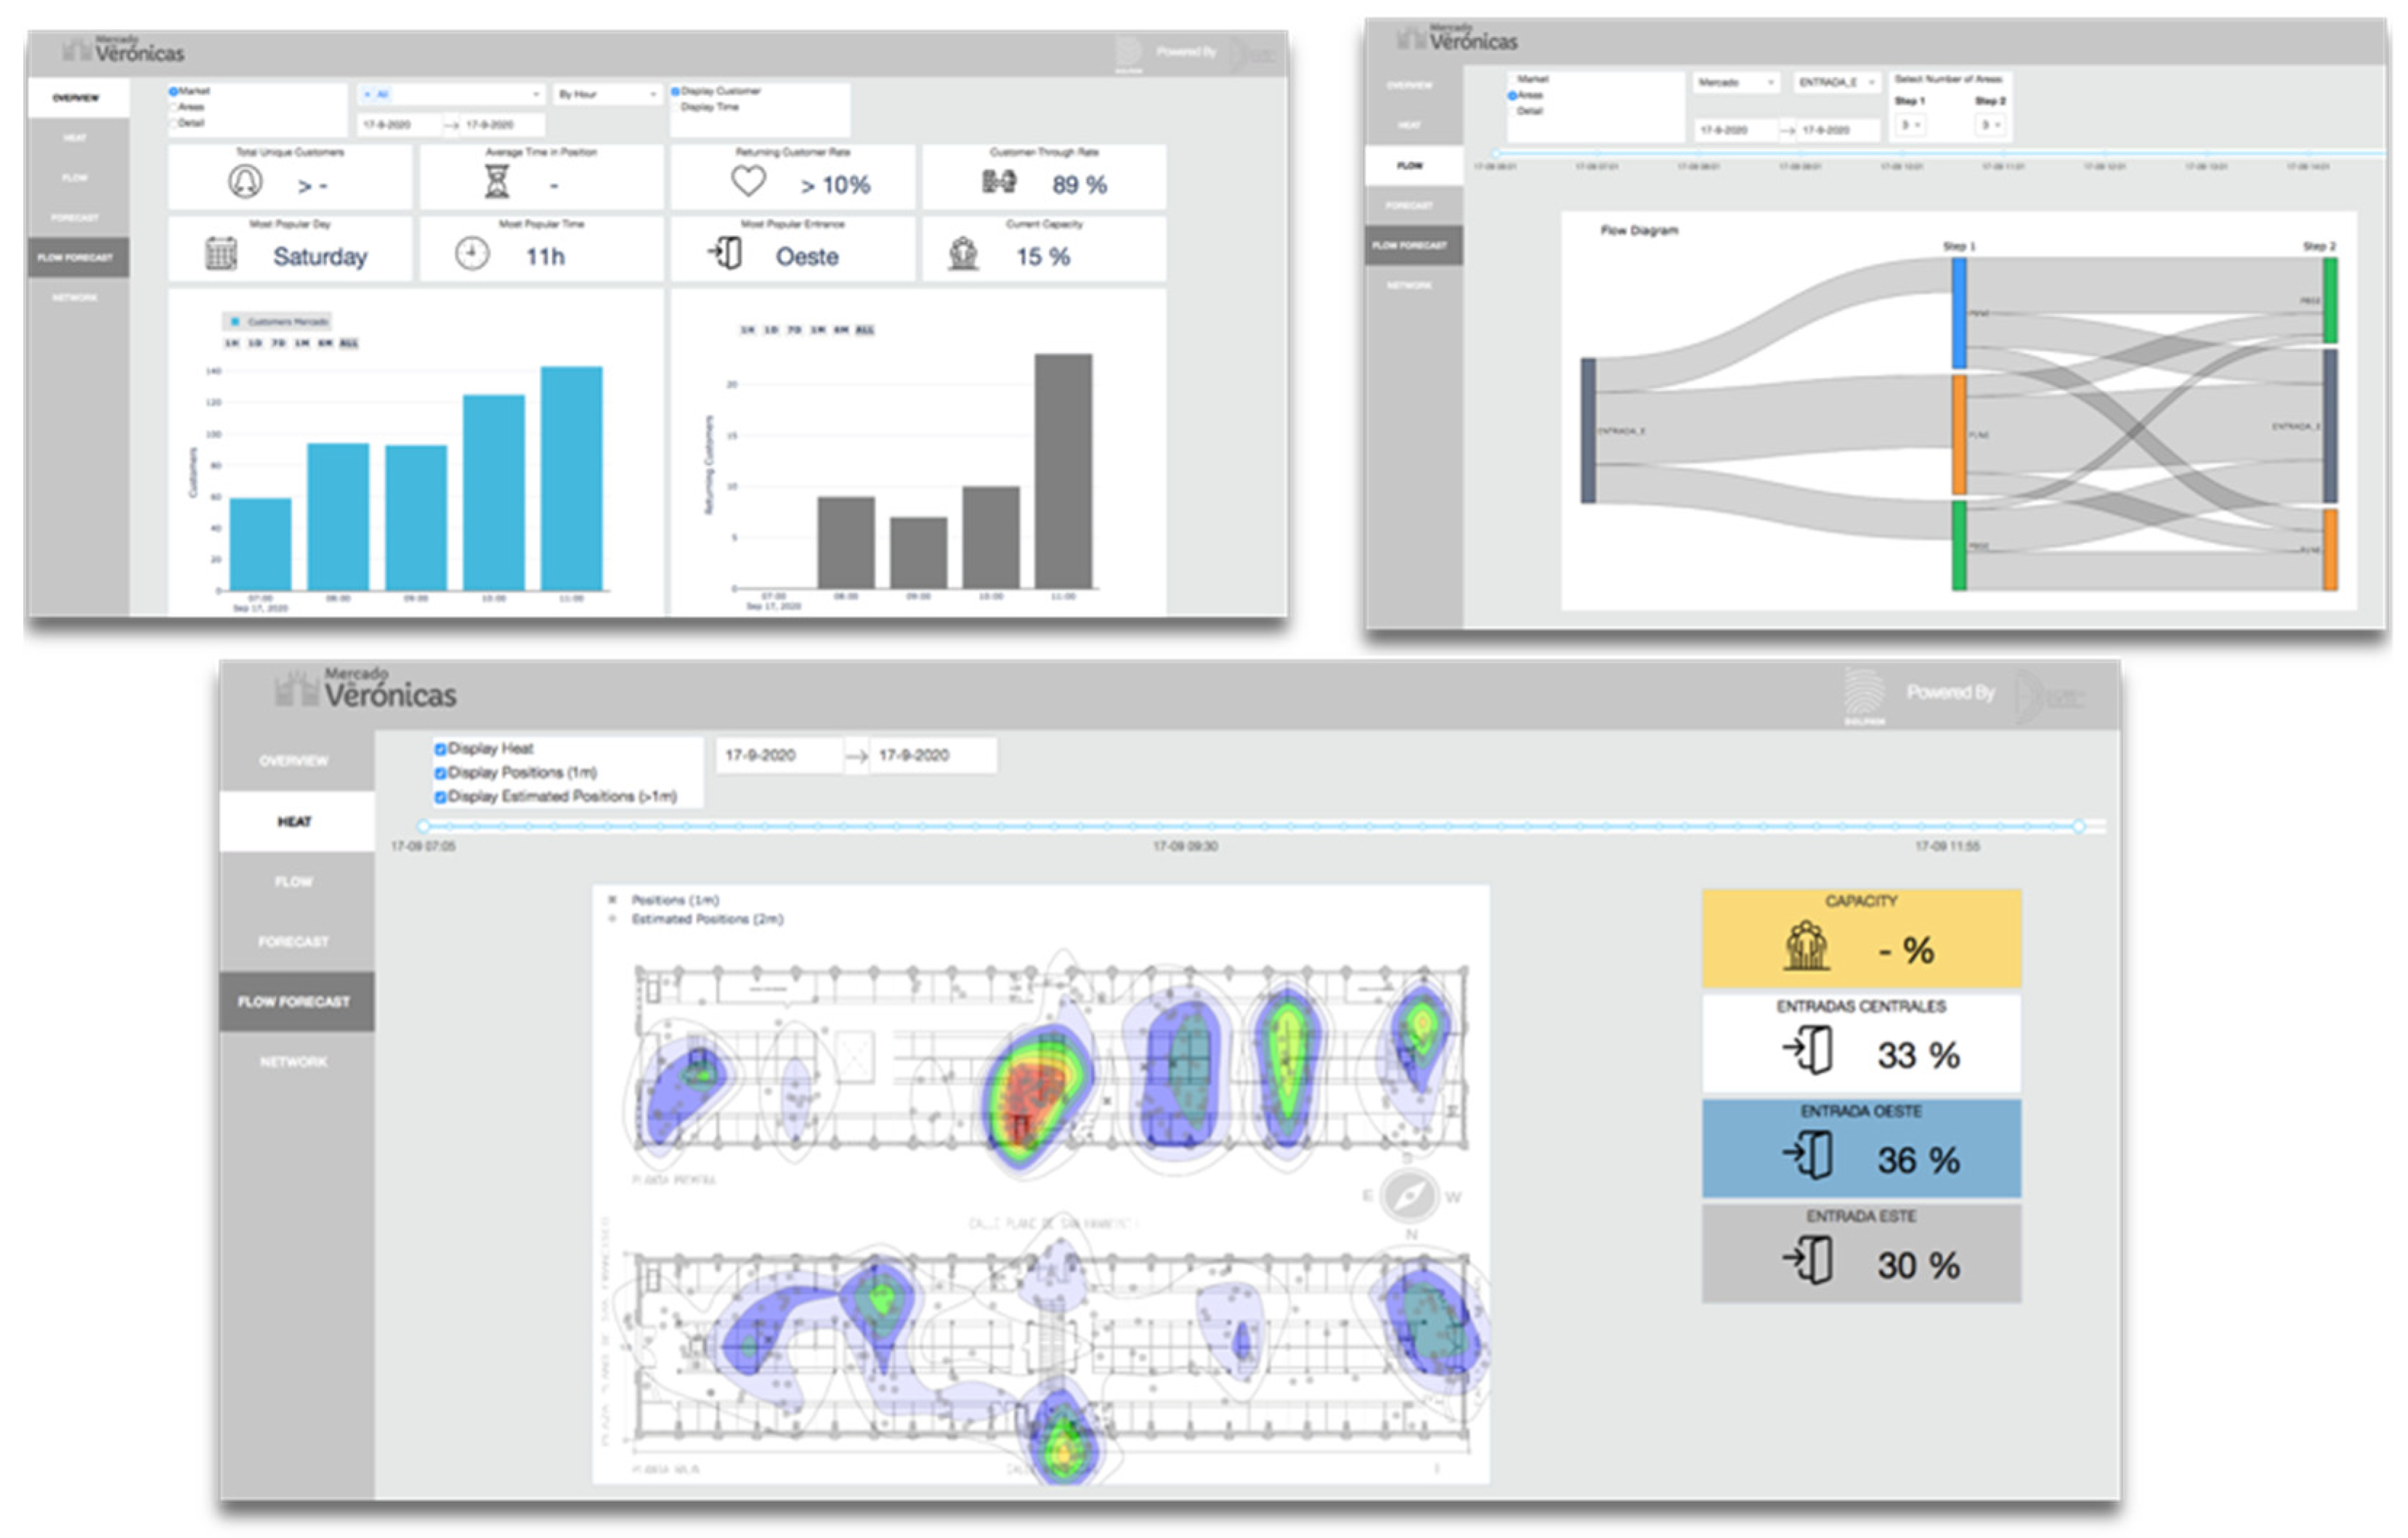
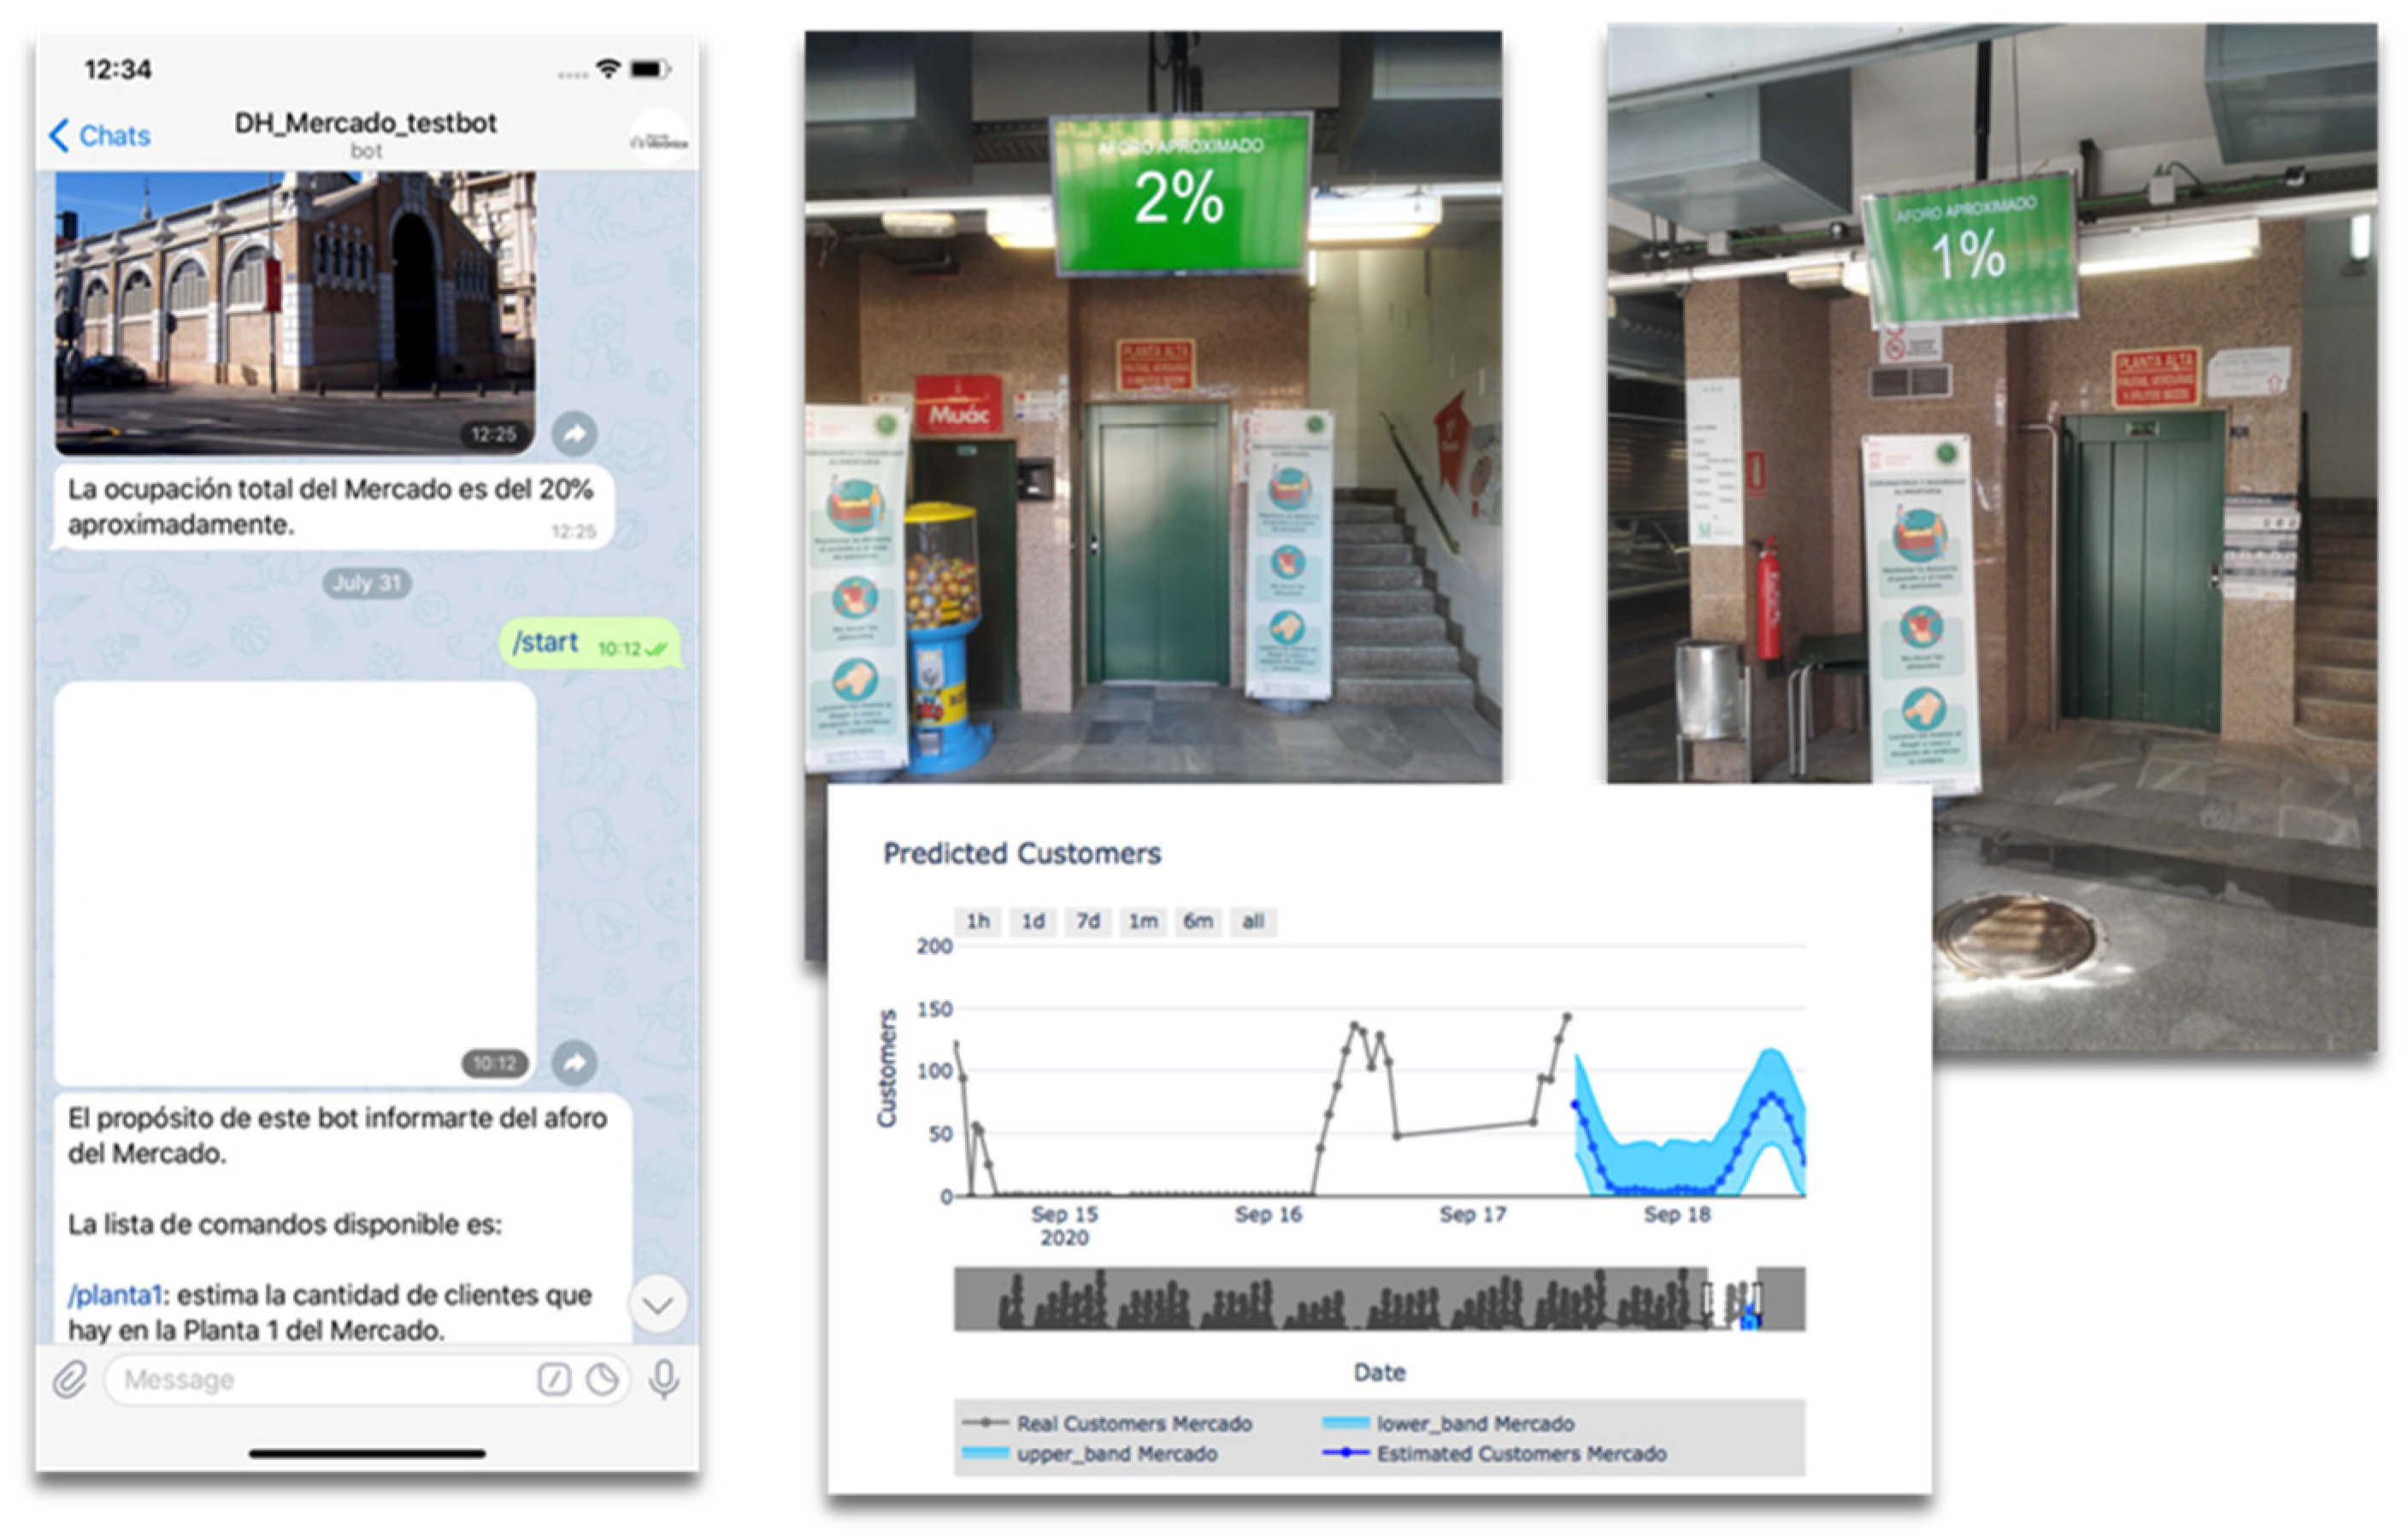
Figure 5. The central server is in charge of the second level of processing, with two main goals, namely forecasting and visualization. The forecasting procedure, also under PI, permits us to estimate the evolution of the KPIs for the next hour and/or days, depending on the amount of data already stored by the platform. For visualization, a graphical user interface was implemented as depicted in
Figure 6.
As shown in
Figure 7, the platform shows the number of people in real time (in
Figure 7, it can be observed that the current capacity was 2%). This information is configurable, so it is possible to show the capacity of the complete monitored building or a specific area within. Therefore, it can be used to control indoor capacity either for a complete area or for smaller specific zones (e.g., rooms, offices, store sections, etc.). Another important feature shown in
Figure 6 (lower center) is the heatmap, highlighting the people density in the monitored zone. To facilitate the warning process, a chat bot was also developed using the commercial application Telegram [
53] using APIs (see
Figure 7, Left). In this case, the warning system is bidirectional, being possible to automatically notify the subscribers of specific events (e.g., capacity above a given limit, people proximity exceeded for a given time, and so on) or to answer specific questions made by the users about the KPIs. The complete EWS was built in six months, deployed in the real indoor scenario in two weeks, and was run for six months without incurring any problem, successfully confirming the initial two hypotheses.
One question that arises after successfully deploying this EWS is, what determines the adoption (or rejection) of technology in demanding situations? One simple hypothesis could be that the more accustomed companies and society are, even if in a totally different context (e.g., in an industrial environment), the faster the technology adoption in daily life. A preliminary reasoning is that those countries with higher usage of QR codes have better assimilated the use of QR applications for COVID-19 track and trace as could be the case in South Korea or Japan. This hypothesis requires a deeper study that will be addressed in future works.
5. Conclusions
When faced with decisions under uncertainty, it is paramount for individuals and decision makers to have as much trusted information and knowledge as possible when deciding on the best strategies to avoid drastic consequences such as the ones produced by a pandemic such as COVID-19. In this paper, an innovative early warning system was proposed. The system encompasses the use of several technologies, particularly WiFi and BLE, as an example of a sensor data fusion approach. It has been shown that this solution is able to show real-time information about an indoor or outdoor area in terms of capacity (i.e., estimation of the number of people, people flow, time spent in specific areas, and indoor geolocation with an estimated error smaller than 1 m). All this information allows one to generate notifications and alarms as required. In addition, the system was based on an IoT-edge-cloud architecture, using APIs and providing a graphical interface and a chatbot for human interaction. In addition, it can be concluded that crisis-like situations can spark innovation, in particular, if decision makers act like entrepreneurs and innovators by applying effectual principles when assembling resources to build new products and services. Early warning systems in such a context can serve as perfect examples of an innovation, leveraging a crisis to make overall pandemic preparedness more robust and sustainable in the long-term. This logic has been successfully tested in this work through the construction of an innovative early warning system, creating a robust real-time EWS for pandemic control at specific areas, allowing for efficient, cost-effective event prevention policy implementation and community warning. As future work, we will be working in the incorporation of additional sensor data sources such as video capture and the containerization of the system to optimize its performance at scale.


