Article

Linking Short- to Medium-Term Beach Dune Dynamics to Local Features under Wave and Wind Actions: A Northern Portuguese Case Study

1
Interdisciplinary Centre of Marine and Environmental Research (CIIMAR/CIMAR), University of Porto, 4450-208 Matosinhos, Portugal
2
Department of Geosciences Environment and Spatial Planning, Faculty of Sciences, University of Porto, 4169-007 Porto, Portugal
3
Centre of Territory, Environment and Construction (CTAC), Department of Civil Engineering, University of Minho, 4800-058 Guimarães, Portugal
*
Author to whom correspondence should be addressed.
Appl. Sci. 2022, 12(9), 4365; https://doi.org/10.3390/app12094365
Submission received: 31 March 2022 / Revised: 22 April 2022 / Accepted: 22 April 2022 / Published: 26 April 2022
(This article belongs to the Special Issue Geohazards: Risk Assessment, Mitigation and Prevention)

Abstract

:
Many coasts suffer from prevailing erosion, with them being particularly vulnerable to predicted climate change impacts, threatening coastal ecosystems, their services, infrastructures and populations. Understanding coastal morpho-sedimentary dynamics is thus essential for coastal management. However, coastal vulnerability may differ locally, depending on exposure/protection and local geological and morpho-hydrodynamical features, suggesting that a local approach to erosion risk assessment is needed to identify and understand local patterns. Digital elevation models of a 14 km long coastal stretch in northern Portugal that were extracted from aerial surveys obtained between November 2008 and February 2019 were analysed to quantify changes in shoreline position and sediment budgets, both for the whole study area and for distinct beach segments. The observed dynamics were subsequently analysed by considering prevailing wave and wind intensities and directions. Overall and during the decade analysed, the beach–dune system of the studied stretch slightly increased in volume (0.6%), although the shoreline retreated (by 1.6 m on average). Temporal variability in coastal dynamics was observed at all of the temporal scales considered—from seasons to 5-year periods—with them being related to variability in ocean and wind patterns. There was a trend from accretional to erosional conditions, with the first 5-year period showing a mean increase in the beach–dune system’s volume of 0.6% and a mean shoreline progradation of 1.5 m, followed by 5-years with 0.0% volume change and 3.1 m shoreline retreat. Locally, the dynamics were very variable, with shoreline dynamics ranging from 24.0 m regression to 51.5 m progradation, and sediment budgets from 213.8 m3 loss to 417.0 m3 gain, per segment and for the decade. Stretches with relatively stable morphologies and others with erosional or accretional trends were found, depending on the beach type, shoreline orientation and the presence of defence structures. Rocky beaches were the least dynamic and sandy beaches the most dynamic, with mean shoreline position changes of 0.0 m and −3.4 m, respectively, and mean sediment budgets of −1.1 m3 and −2.9 m3 per linear meter of coastline, respectively, for the studied decade. The observed dynamics showed how local conditions interacted with meteo-ocean conditions in shaping local morpho-sedimentary dynamics, stressing the importance of a local approach to coastal erosion monitoring and risk assessment.

1. Introduction

Coasts are land–ocean interfaces of high environmental and economic value; they provide important ecosystem services, from coastal buffering and inland protection to nutrient cycling, biodiversity, and recreational and cultural environments. As a consequence, coasts are often densely populated and modified, suffering increasing anthropogenic pressure [1]. This raises concerns about their increasing vulnerability [2], particularly in the light of potential climate change impacts, such as sea-level rise and changes in ocean wave characteristics [3,4]. Furthermore, many coasts suffer from erosion due to a sediment deficit, mostly caused by human actions that disrupt sediment fluxes and retain sediments in reservoirs and constructions [5]. More than 20% of the European and 30% of the Portuguese coastline are estimated to suffer from coastal erosion [6]. Erosion causes land loss, threatens ecosystems and infrastructures through increased exposure to wave impacts, and increases flood risk [7], and it is expected to be aggravated by climate change [8]. For Portugal, for instance, the projected sea-level rise is 1.14 m (ranging between 0.39 m and 1.89 m, with a 95% probability) by 2100 [9]. Erosion and shoreline retreat are therefore likely to become an even more relevant problem in the coming decades. There is hence an urgent need for coastal zone management and maritime and coastal planning.
The retreat of coastlines can be prevented by hard structures, such as groynes, seawalls and breakwaters, or through soft methods, such as beach nourishment, dune stabilization and bioengineering [10,11,12]. Given the high implementation and maintenance costs of hard defence structures and their negative impacts on ecosystems, as well as on neighbouring hydro-morphodynamics, soft solutions have gained in popularity [12,13,14]. This trend is also visible in Portugal, where hard defence structures were implemented from the late 1950s onward, often producing unexpected or unwanted effects and exacerbating downdrift erosion problems [15,16]. Over the past two decades, management strategies have therefore favoured soft defence approaches through artificial beach nourishment, placement of fences, construction of footbridges and revegetation of dunes [17,18].
Furthermore, also after 1950, important dams were built in the main river basins of the Iberian Peninsula, and large harbours were constructed at the river mouths. These two anthropic interventions, next to other significant soil-use changes in the river basins, greatly contributed to diminishing the volumes of sediments that are transported to the coastal platform or feed the alongshore dominant drift. The consequent sediment starvation at the coast implies that the design principles of groynes and breakwaters are not satisfied, making these defence solutions inefficient in most coastal environments.
Sustainable coastal management requires an integrated evaluation of coastal protection through hard defence structures or soft interventions, such as beach nourishment. Long-term cost-benefits and feasibility depending on local conditions, vulnerabilities and values, as well as sediment availability, need to be assessed to decide on mitigation measures or the alternative of a managed retreat, sacrificing areas that are considered less valuable [11].
Coastal morphology reflects the local natural and man-made conditions. Beach morphological changes occur due to the influence of natural phenomena, such as ocean waves and coastal currents, wind and river-flow effects, as well as due to human activities, such as urbanisation, infrastructures and coastal defence intervention [19,20,21]. Coastal vulnerability may therefore differ locally, depending on exposure/protection and local geological features, as well as local hydrodynamic and meteorological conditions, suggesting that a local approach to monitoring and management is needed [22]. Spatial and temporal fine-scale coastal sedimentary morphodynamics studies showed that the trends observed in large-scale studies may be the opposite of those observed in certain beach segments [23]. The consideration of local specificities, such as coastline orientation, exposure and natural or man-made structures, is thus crucial for the assessment of coastal risk and decision-making regarding protective measures for coastal populations and infrastructures.
Analogously, the characteristics of forcing variables, such as the prevailing wave and wind directions and intensities, have to be considered, as these are likely to influence the local impacts [24,25]. The importance of wave direction for the variability of coastal morphodynamics has been widely studied and acknowledged, with wave direction affecting sediment transport, beach rotation and morphology [26]. While, on open-coast, non-embayed beaches, morphology is considered to be primarily controlled by wave direction and energy, sediment transport will vary locally along a non-straight coastline due to uneven wave attenuation [27]. Lemke and Miller [22], who studied the impact of storm erosion on beach morphology, furthermore concluded that due to the propensity for beach conditions to change over short spatial scales, it is important to assess impacts on a local scale.
Another important parameter that affects beach morphology is the wind. Winds affect wave formation, as well as sediment transport on land, with this being particularly important for dune formation, as well as erosion. The aeolian sediment transport, which can be considered as the primary driver of the sediment flux not influenced by oceanic transport, is dependent on the wind velocity [28]. Wind speed needs to exceed a certain threshold value to start the sediment particle movement [29]. However, the wind direction and the angle of wind approach are also important for the transport of sediments, particularly regarding dune formation or erosion.
Other parameters that control sediment transport are the moisture content because moisture increases the inter-particle cohesion and, consequently, reduces the overall rate of transport [30]; vegetation, which helps to fix the sediments; and the availability of sediments for dune formation, which is also dependent on the sediment supply from waves, coastal drifts and rivers [29].
For sound coastal erosion management and mitigation, an analysis of the relationship between local conditions and forcing variables, as well as local morphodynamics, is thus needed to quantify and, ultimately, model these effects, allowing for much-needed prediction of future erosion trends and likely changes, for instance, following anthropogenic interventions (e.g., implementation of coastal defence structures such as breakwaters and groynes, or structures, such as promenades and buildings) or as a result of the predicted climate change impacts.
This can only be achieved through monitoring at temporal and spatial scales that are adequate to capture relevant variabilities and trends. However, high-temporal- and high-spatial-resolution studies of coastal morphology are rare, particularly in countries with a lower budget available for regular monitoring, although technological developments in remote sensing systems and methodologies nowadays allow for regular surveys at adequate spatial resolutions and affordable costs [31]. The present work aimed to show how a combination of digital elevation models, extracted from aerial photography, and in situ data of beach characteristics could provide the necessary information to characterize beach–dune morphodynamics at a local scale. This constituted a novel, local and comprehensive approach to the study of coastal sedimentary morphodynamics.
A case study is presented, where the morpho-sedimentary dynamics of a coastal stretch were analysed both temporally and locally and related to local features, as well as to the regional meteo-ocean conditions. Digital elevation and terrain models of the Vila Nova de Gaia coast in Northern Portugal, extracted from aerial photographic surveys carried out between November 2008 and February 2019, were analysed to quantify changes in shoreline position and sediment budgets for the study area as a whole and distinct beach segments. Changes were analysed at seasonal, yearly, five-yearly and decadal time scales. The observed dynamics were subsequently related to relevant parameters, including beach type/geology, the presence of a groyne and a breakwater, and dominant wave and wind directions and intensities.

2. Materials and Methods
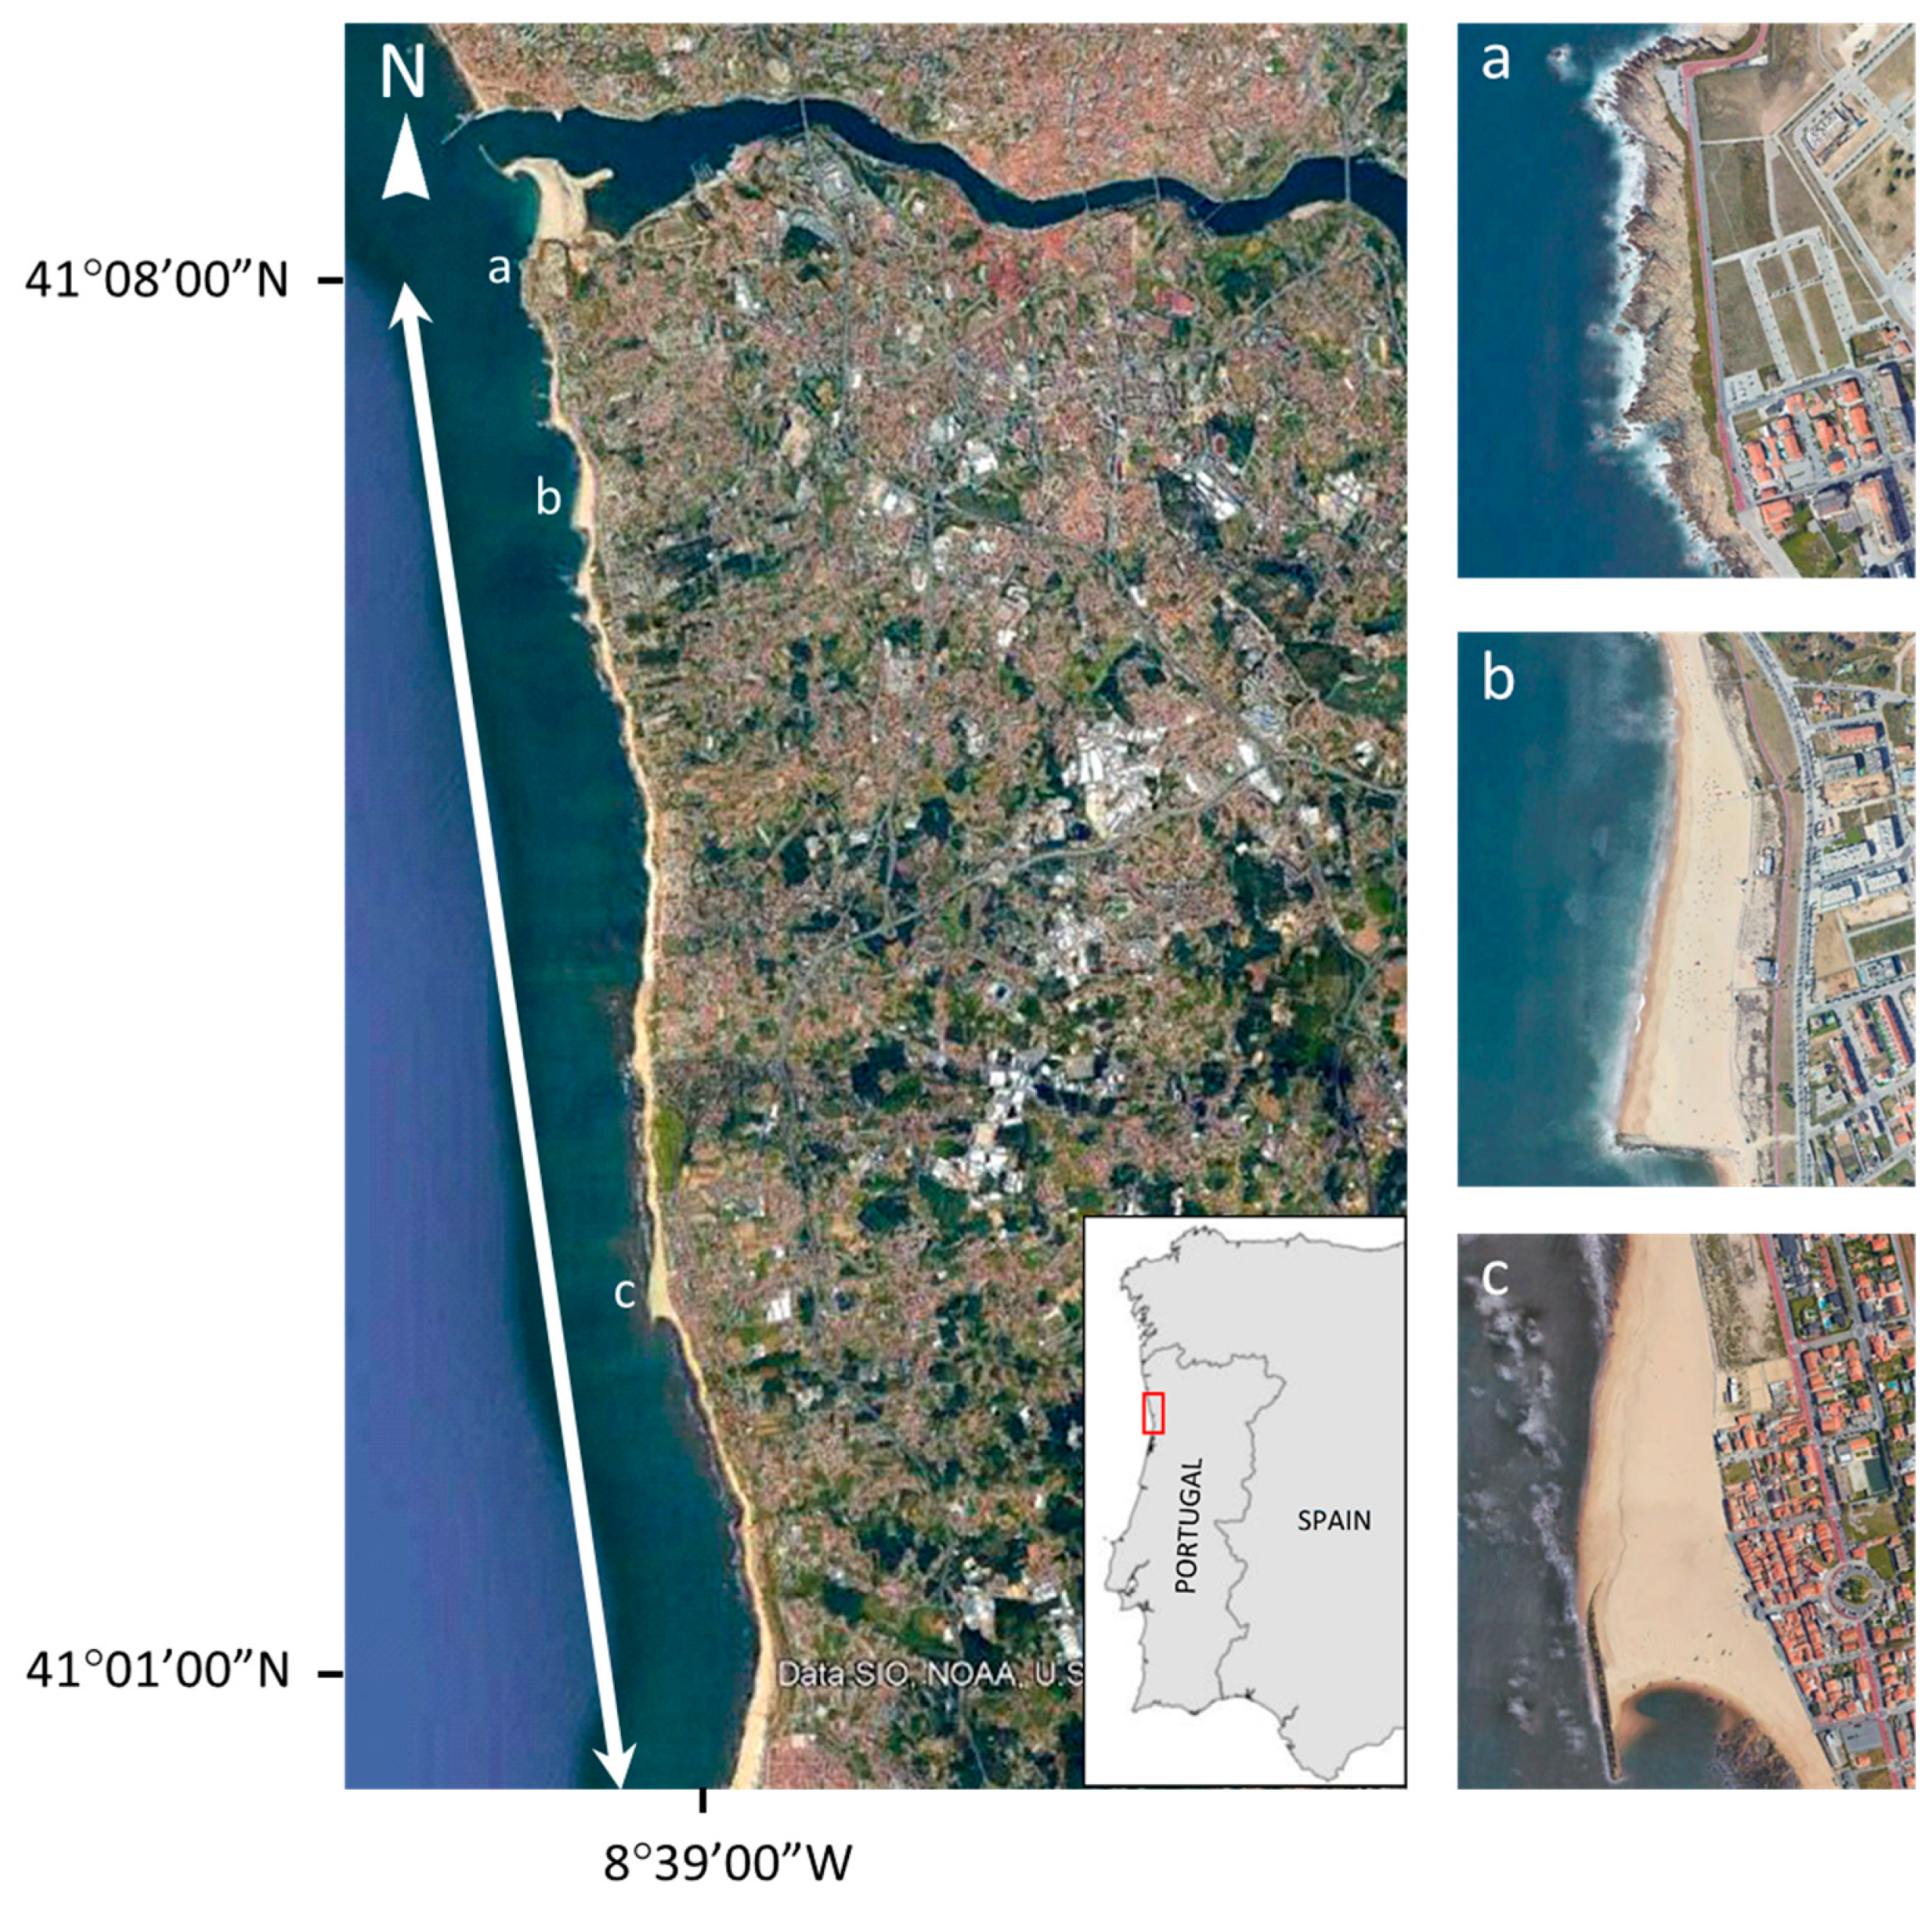
2.1. Study Area

The study area covers a coastal stretch of about 14 km length in northern Portugal, between the Douro river mouth in the north and the city of Espinho in the south, corresponding to the coastline of the Vila Nova de Gaia municipality (Figure 1). This municipality is the third most densely populated in Portugal, with a population density in the coastal zone (up to 5 km from the coastline) of about 2500 inhabitants per square kilometre (data from the National Institute of Statistics, referring to 2011; www.ine.pt, accessed on 15 March 2022). Consequently, its coastline is densely occupied and urbanised. The coast is characterised by rocky beaches in the north (Figure 1a) and mostly sandy beaches with rocky outcrops in the centre and south. Being exposed to the high-energy ocean climate of the North Atlantic and suffering from sediment depletion, the Portuguese coast has several sectors that are prone to erosion [18,32]. Therefore, about 14% of the Portuguese coast is currently defended by artificial structures [33], although these structures, which mitigate sediment loss locally, often increase downdrift erosion [18]. The studied coastal stretch comprises a groyne (Figure 1b), which was built to retain sediments and to fix a submarine outfall, as well as a breakwater (Figure 1c) that was meant to be detached but developed a tombolo during construction, connecting it to the coast [15]. The beaches near Espinho have been managed with repeated artificial beach nourishment [34].
The north-western Portuguese Atlantic coast is highly energetic, presenting mean significant wave heights of 2–3 m offshore, and mean wave periods of 8–12 s [35,36]. Waves usually come from the NW, which induces a longshore drift current from north to south. This current is in some areas inverted due to the presence of obstacles (such as breakwaters, jetties, groynes, ebb tidal deltas and bars) that promote wave diffraction. The continental shelf is 30–40 km wide [37] and the local tides are dominated by a semidiurnal regime [38], with amplitudes ranging between 2.5 m and 3.8 m.
The regional atmospheric climate varies seasonally. Mediated by the Azores Anticyclone [39], predominant winds from northerly and north-westerly directions occur during the whole year, but with the highest amplitude during the summer months [40]. During autumn and winter, southerly, south-westerly and westerly winds become dominant, though northerly winter winds continue to occur.

2.2. Data

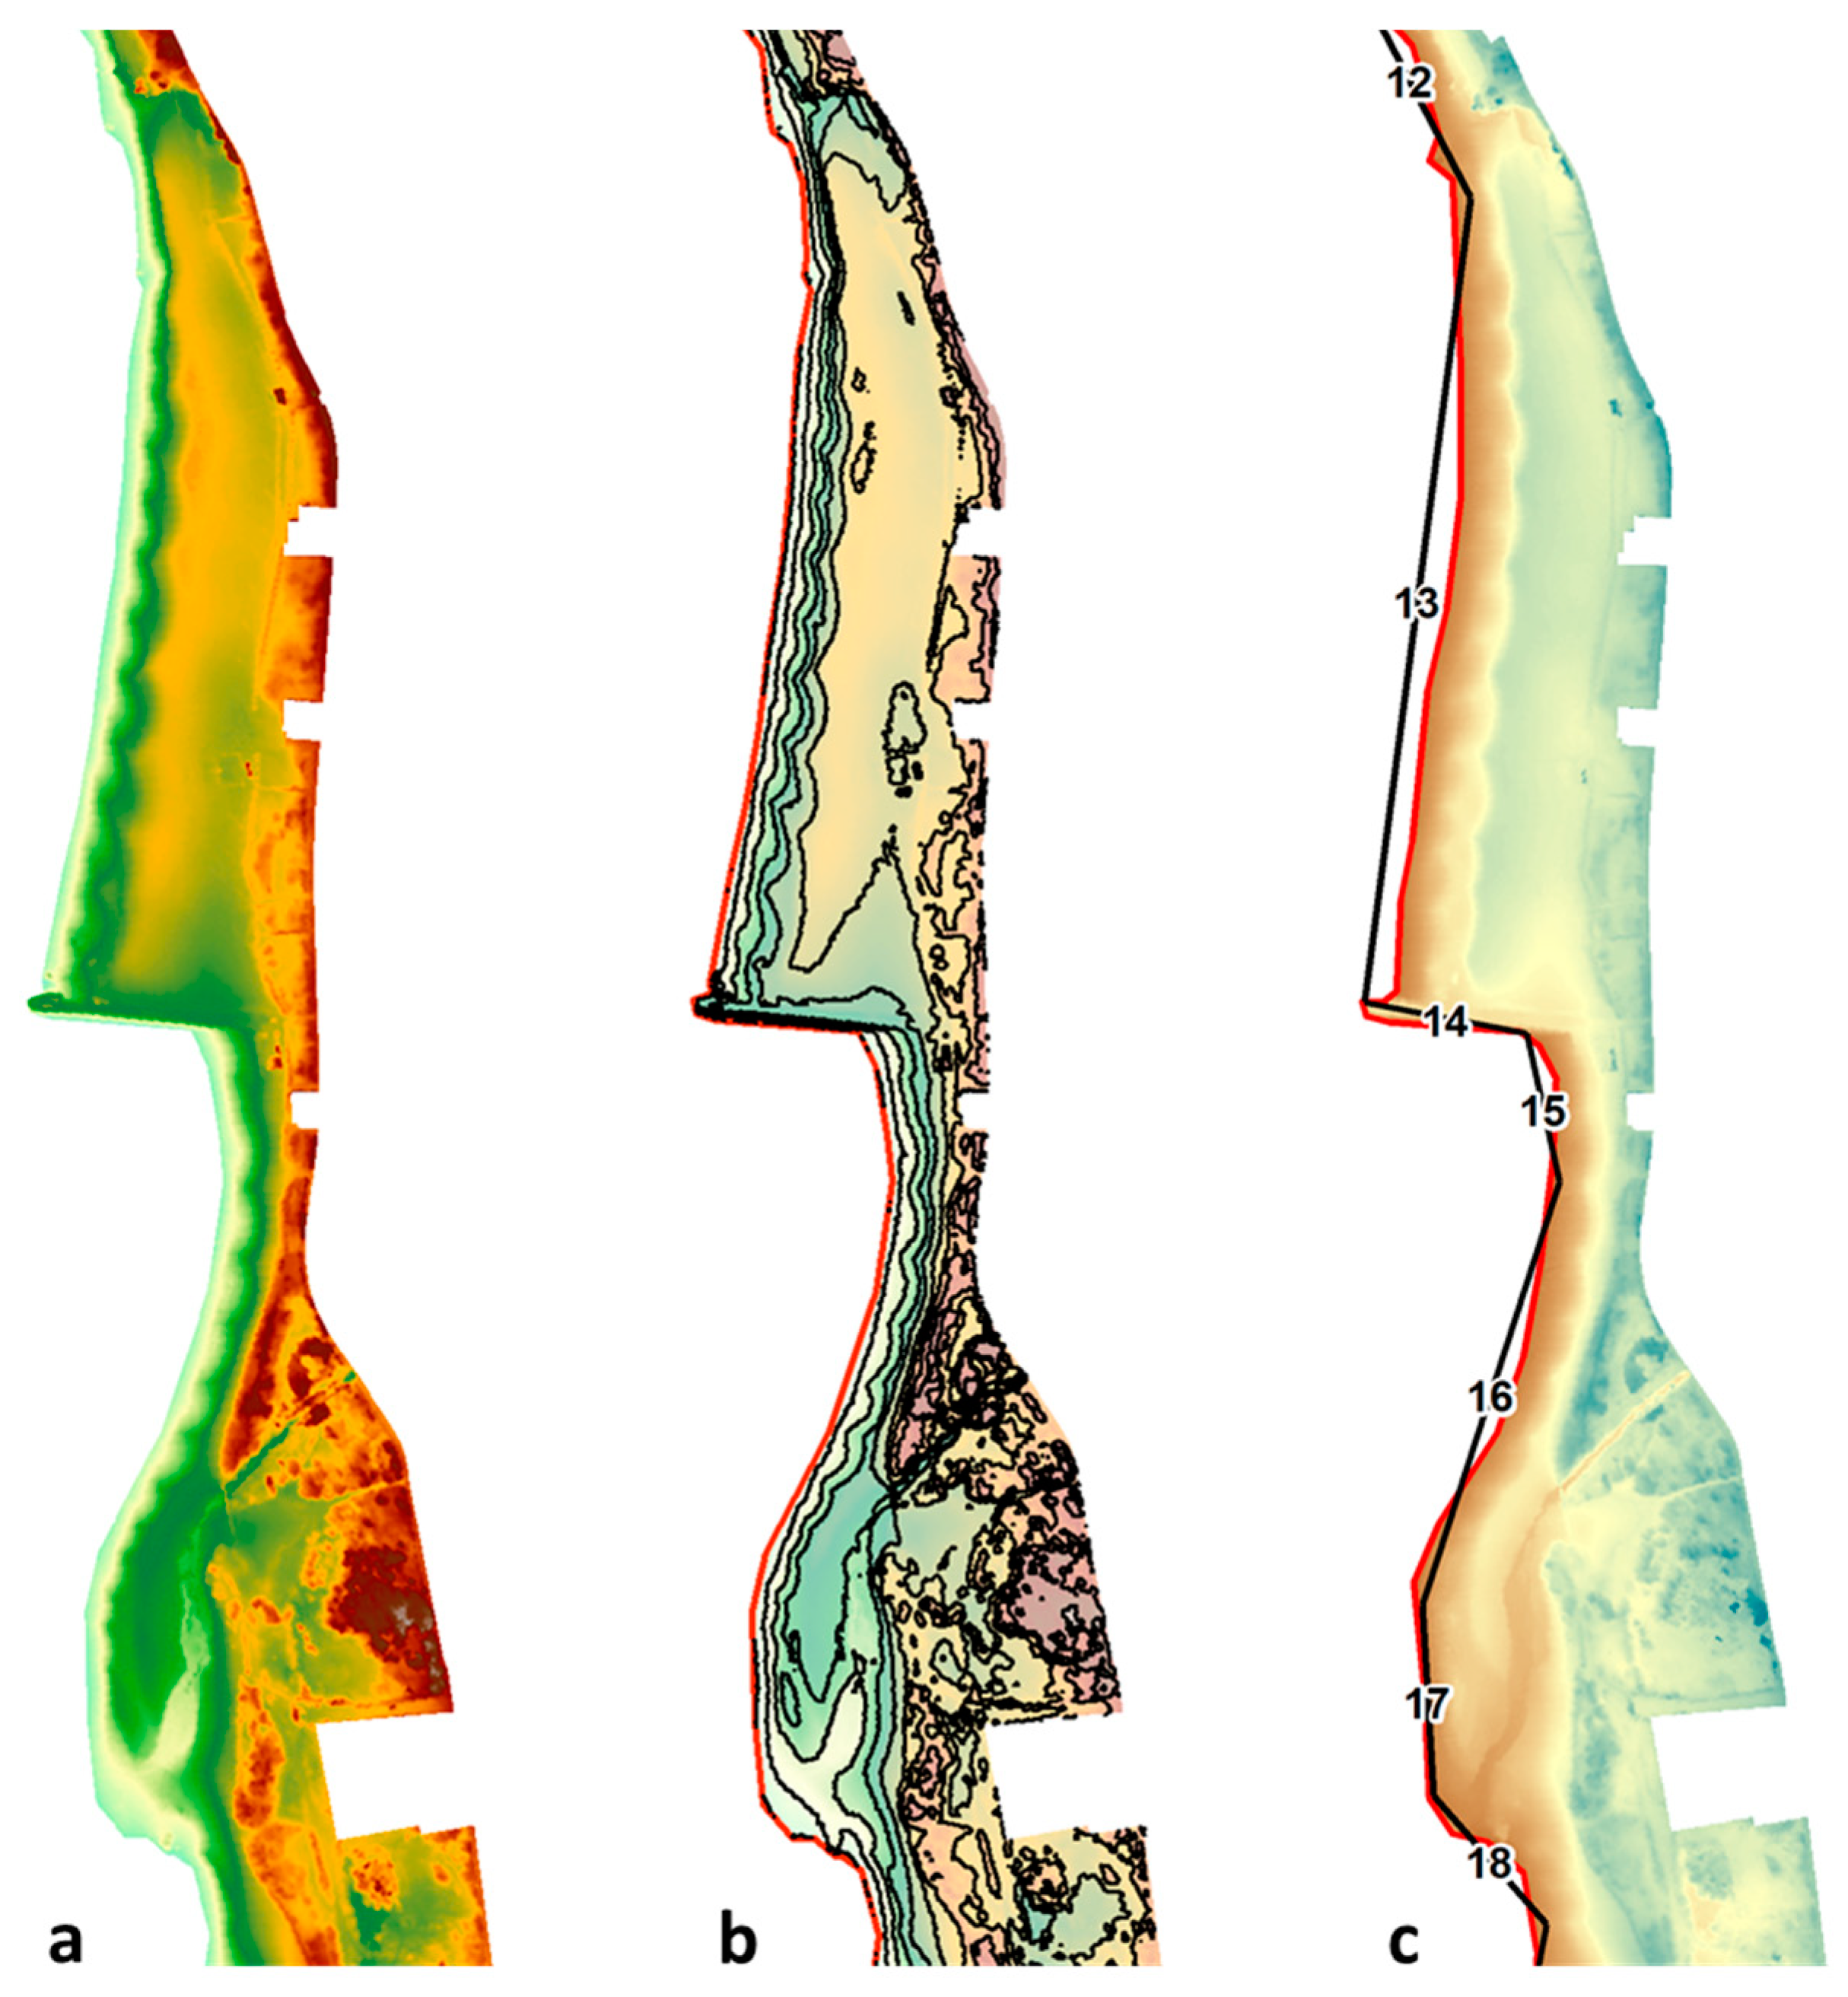
2.2.1. Surveys and Elevation Models

Aerial photos from surveys commissioned in the scope of several research projects were used to obtain orthomosaics and digital elevation models (DEMs) for the study area. Series of overlapping photos were taken from a small manned airplane carrying a digital photogrammetric camera (ZI-DMC, 7680 × 13,824 pixels, for the 2008–2010 surveys, and Vexcel UltraCam Falcon, 9420 × 14,430 pixels, for the 2018–2019 surveys) and flying at about 1000 m and 1600 m heights for the 2008–2010 and the 2018 and 2019 surveys, respectively, to provide high-resolution images with 10 cm and 12–13 cm ground-sampling distance, respectively. Images were directly georeferenced using an on-board GNSS/INS system. For postprocessing, the GNSS relative positioning mode was used. For each image, the position of the camera projection centre and the attitudinal angles were obtained, and a boresight alignment with ground control points was carried out to correct slight systematic effects in the attitude angles of about 0.02 degrees [31,41,42]. In situ measurements in built-up areas were used for calibration, as these contain features that can be used as accurate ground control points.
Surveys were taken on 14 November 2008, 23 April and 11 November 2009, 5 May 2010, 17 May 2018 and 20 February 2019 during spring low tides. DEMs with 1 m resolution were computed from the pairs of stereoscopic aerial images after extracting correlated points through stereo-matching using the Agisoft software [43]. Final DEM accuracies were in the order of 10 cm and, therefore, close to the image resolution [42].
Additionally, a Digital Terrain Model (DTM) from 2014 (kindly provided by the Direção Geral do Território, available at http://mapas.dgterritorio.pt/inspire/atom/downloadservice.xml (accessed on 15 March 2022)) with a 2 m resolution was used to complement the elevation data.

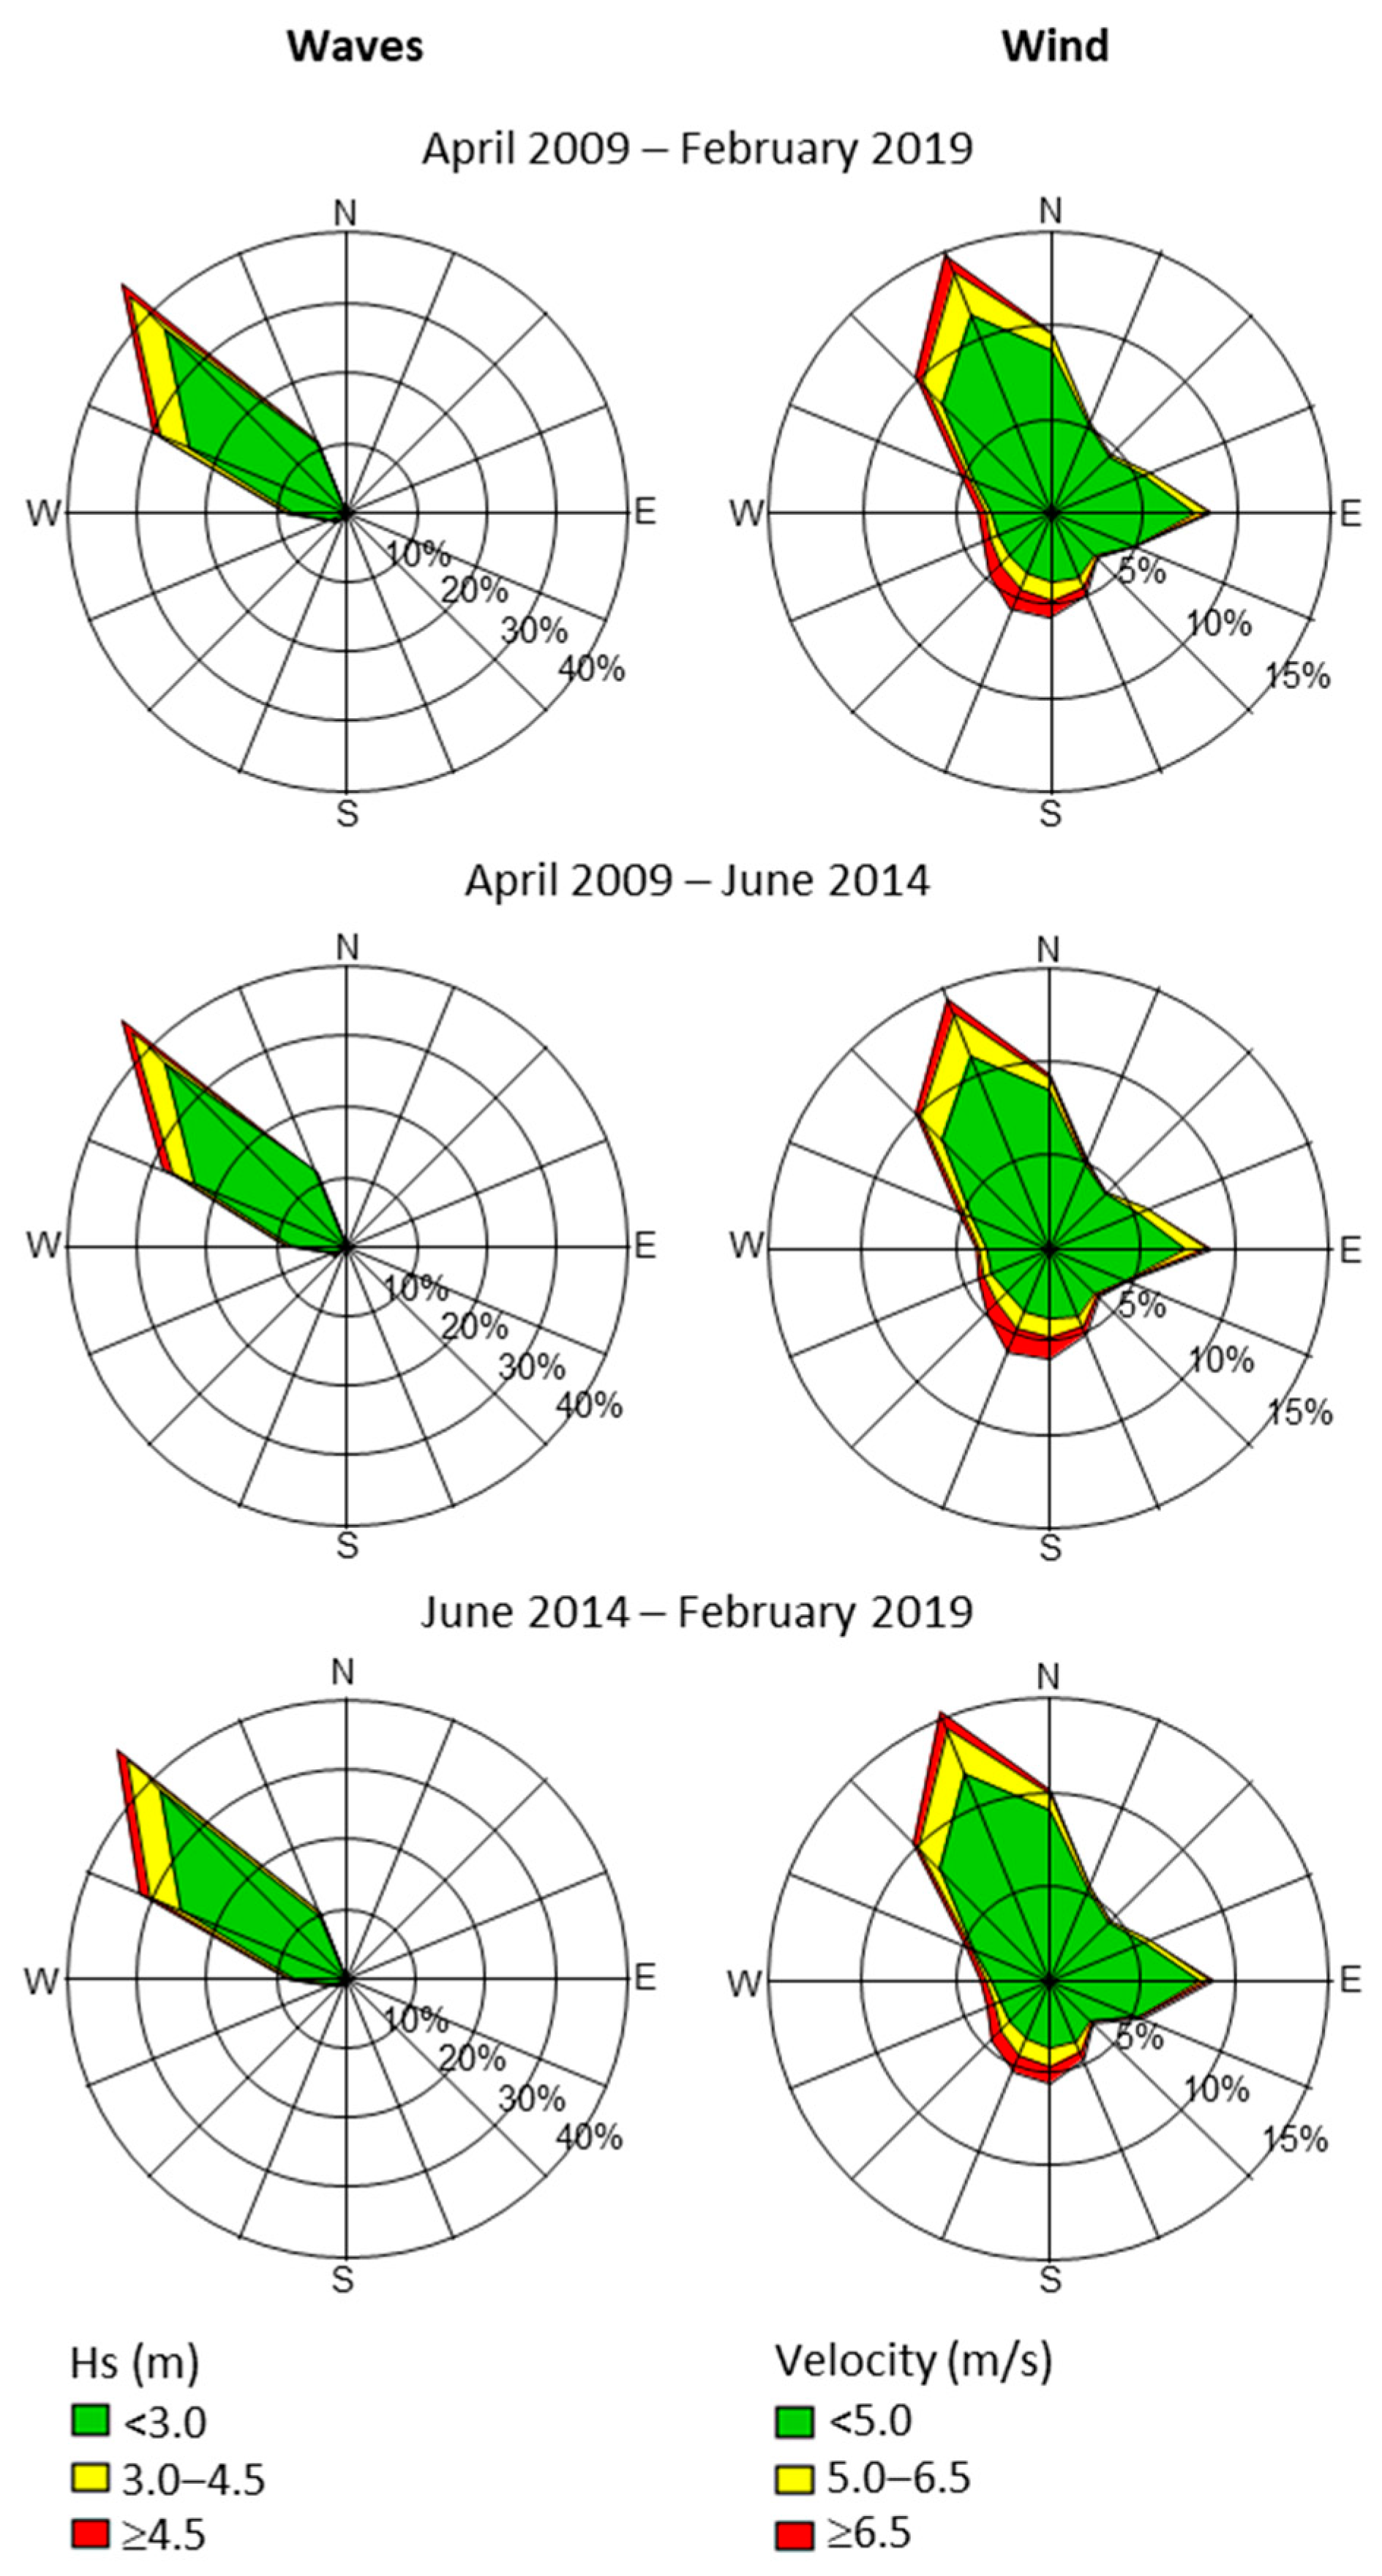
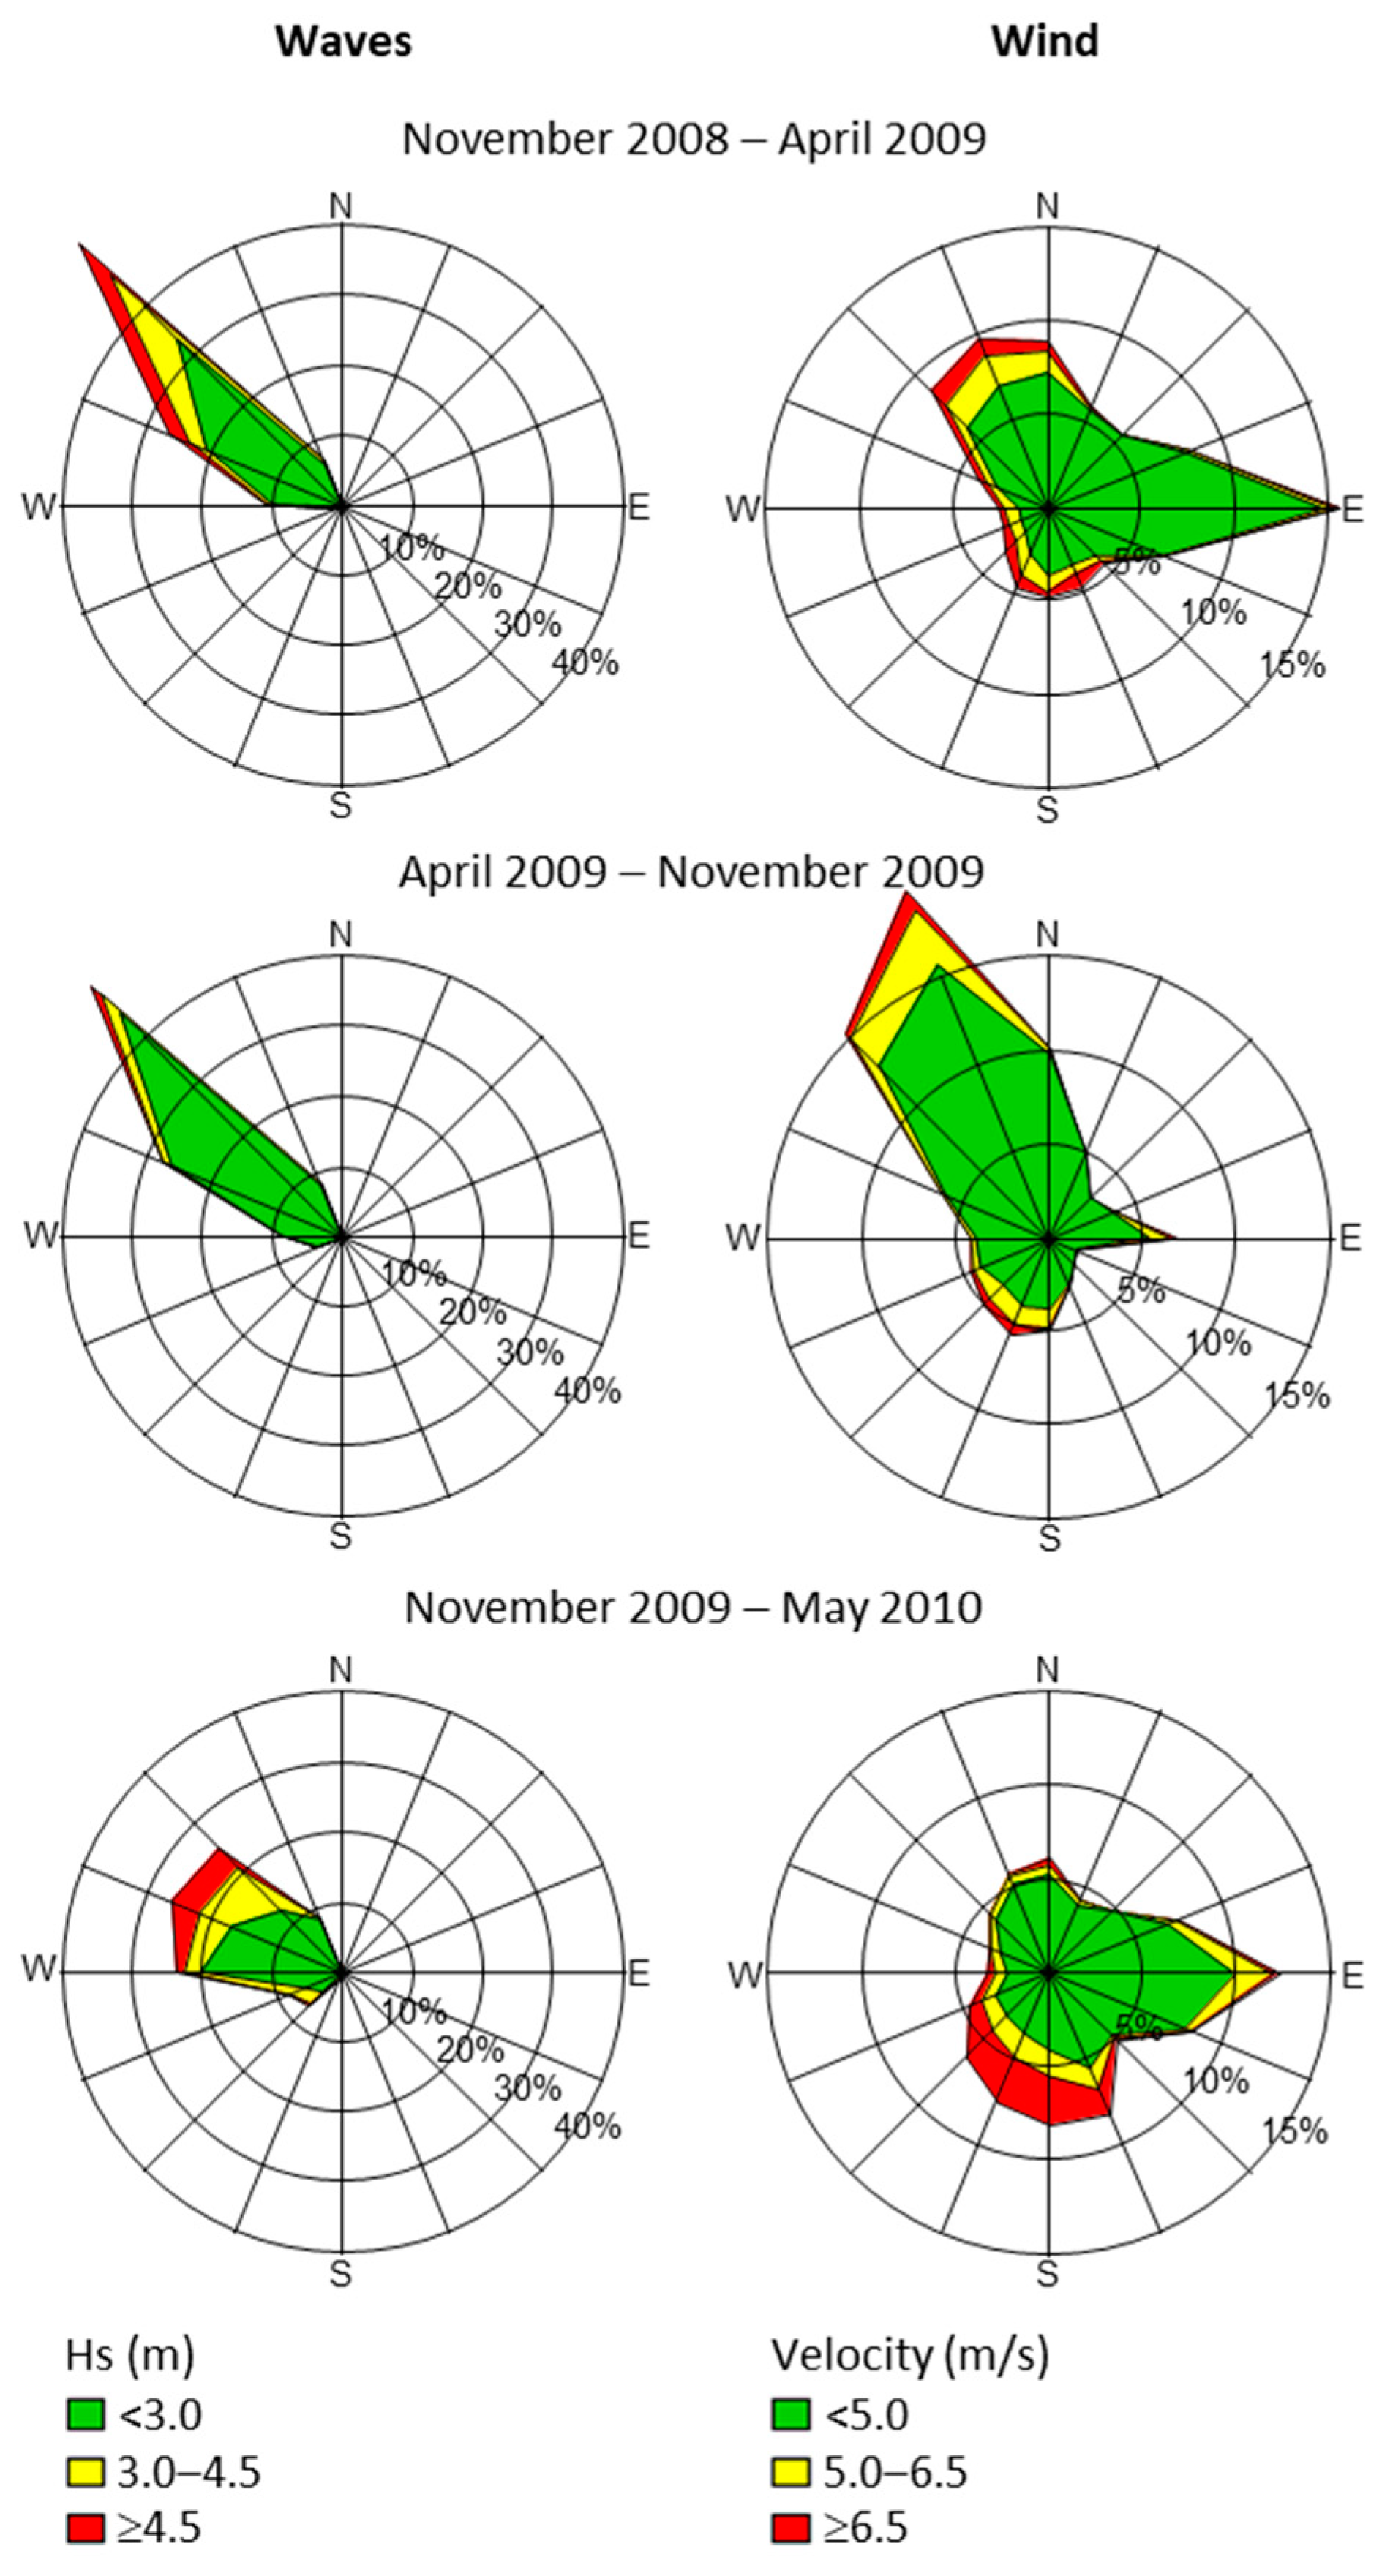
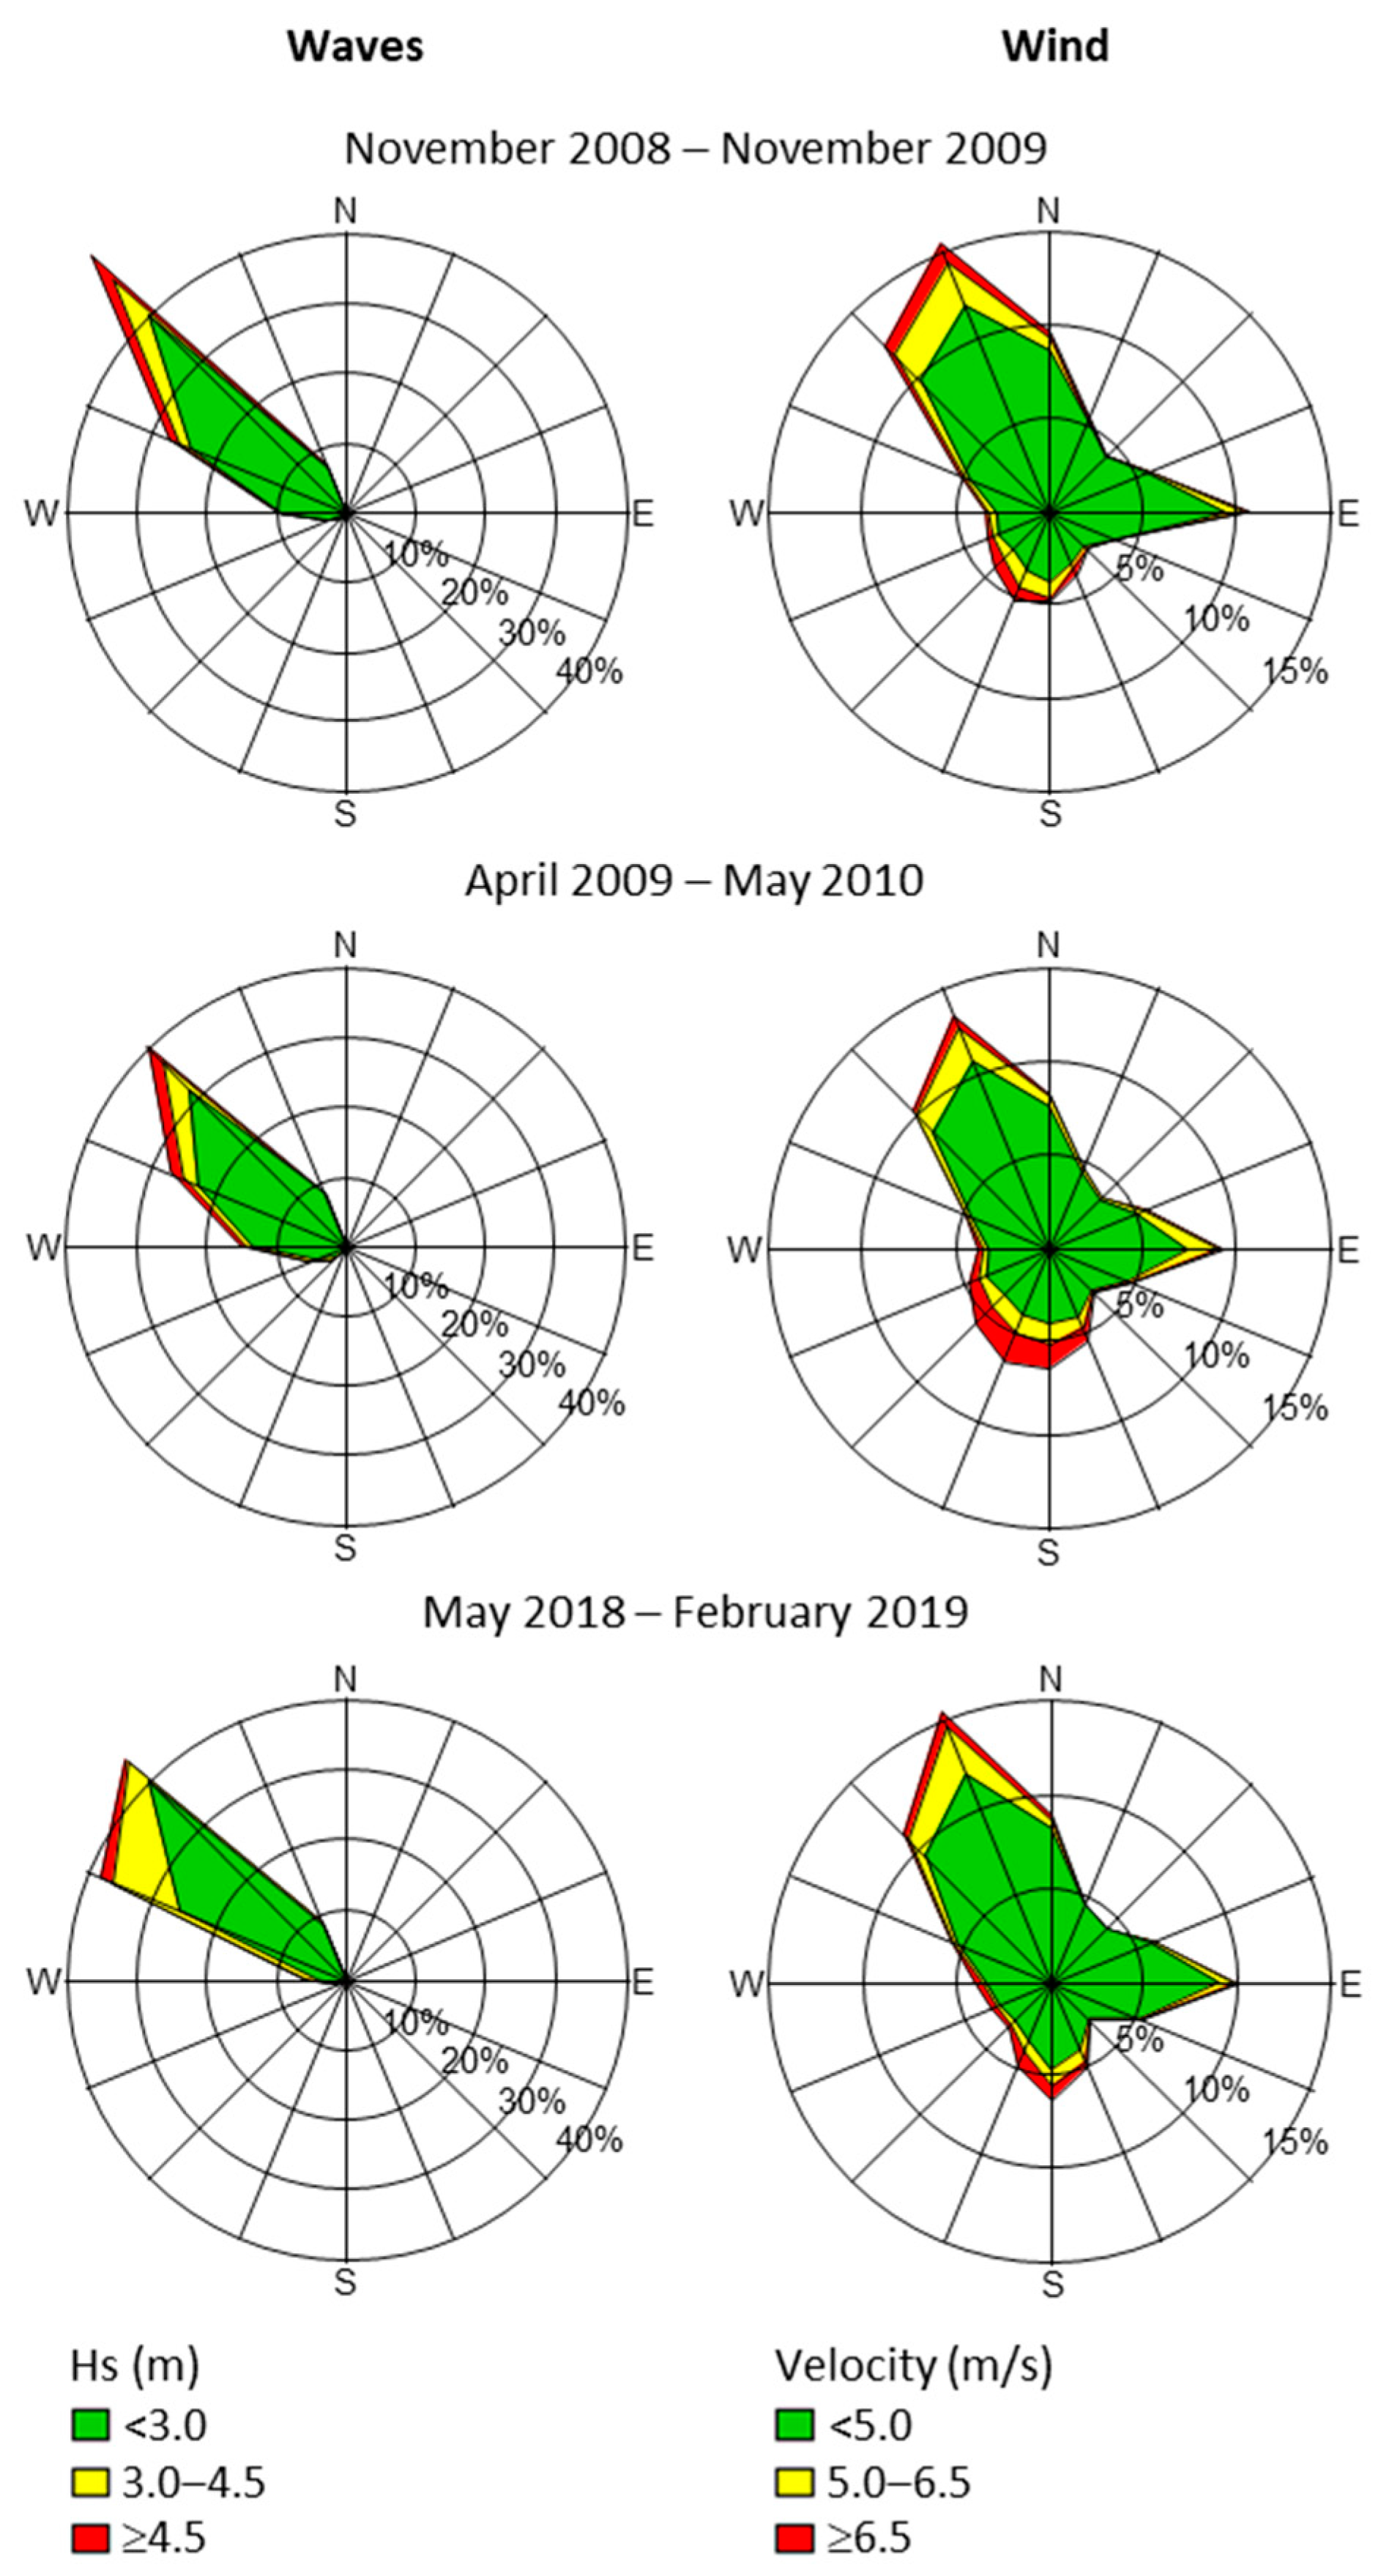
2.2.2. Wave Conditions

Wave data were obtained from a datawell directional wave buoy located about 32 km NW of the study area, off the coast of Leixões harbour (41°19.00′ N, 008°59.00′ W), at 83 m water depth (processed data supplied by the Portuguese Hydrographical Institute—IH; https://www.hidrografico.pt (accessed on 15 March 2022)). Average significant heights (Hs) and wave peak directions for 3 h intervals were used (Figure 2). Wave roses were produced to show the wave direction distribution depending on the wave height (Figure 3, Figure 4 and Figure 5), using 16 cardinal directions and frequencies for 3 significant-wave-height classes: above 4.5 m, between 3 m and 4.5 m, and above 4.5 m. These classes were based on the 85th and 95th percentiles of the mean significant wave heights (Hs) recorded during the study period, which were 3.1 m and 4.4 m, respectively. Three-hourly wave data were available for 89.5% of the total study period, with data missing for January 2010, January 2016, May and June 2018, and February 2019 due to equipment failure (mostly during winter) or maintenance (in spring/summer). Notice, that failures due to the damage or breakdown of the equipment during storm events meant that some data of extreme conditions, which are relevant for sediment transport, were missed.

2.2.3. Wind Conditions
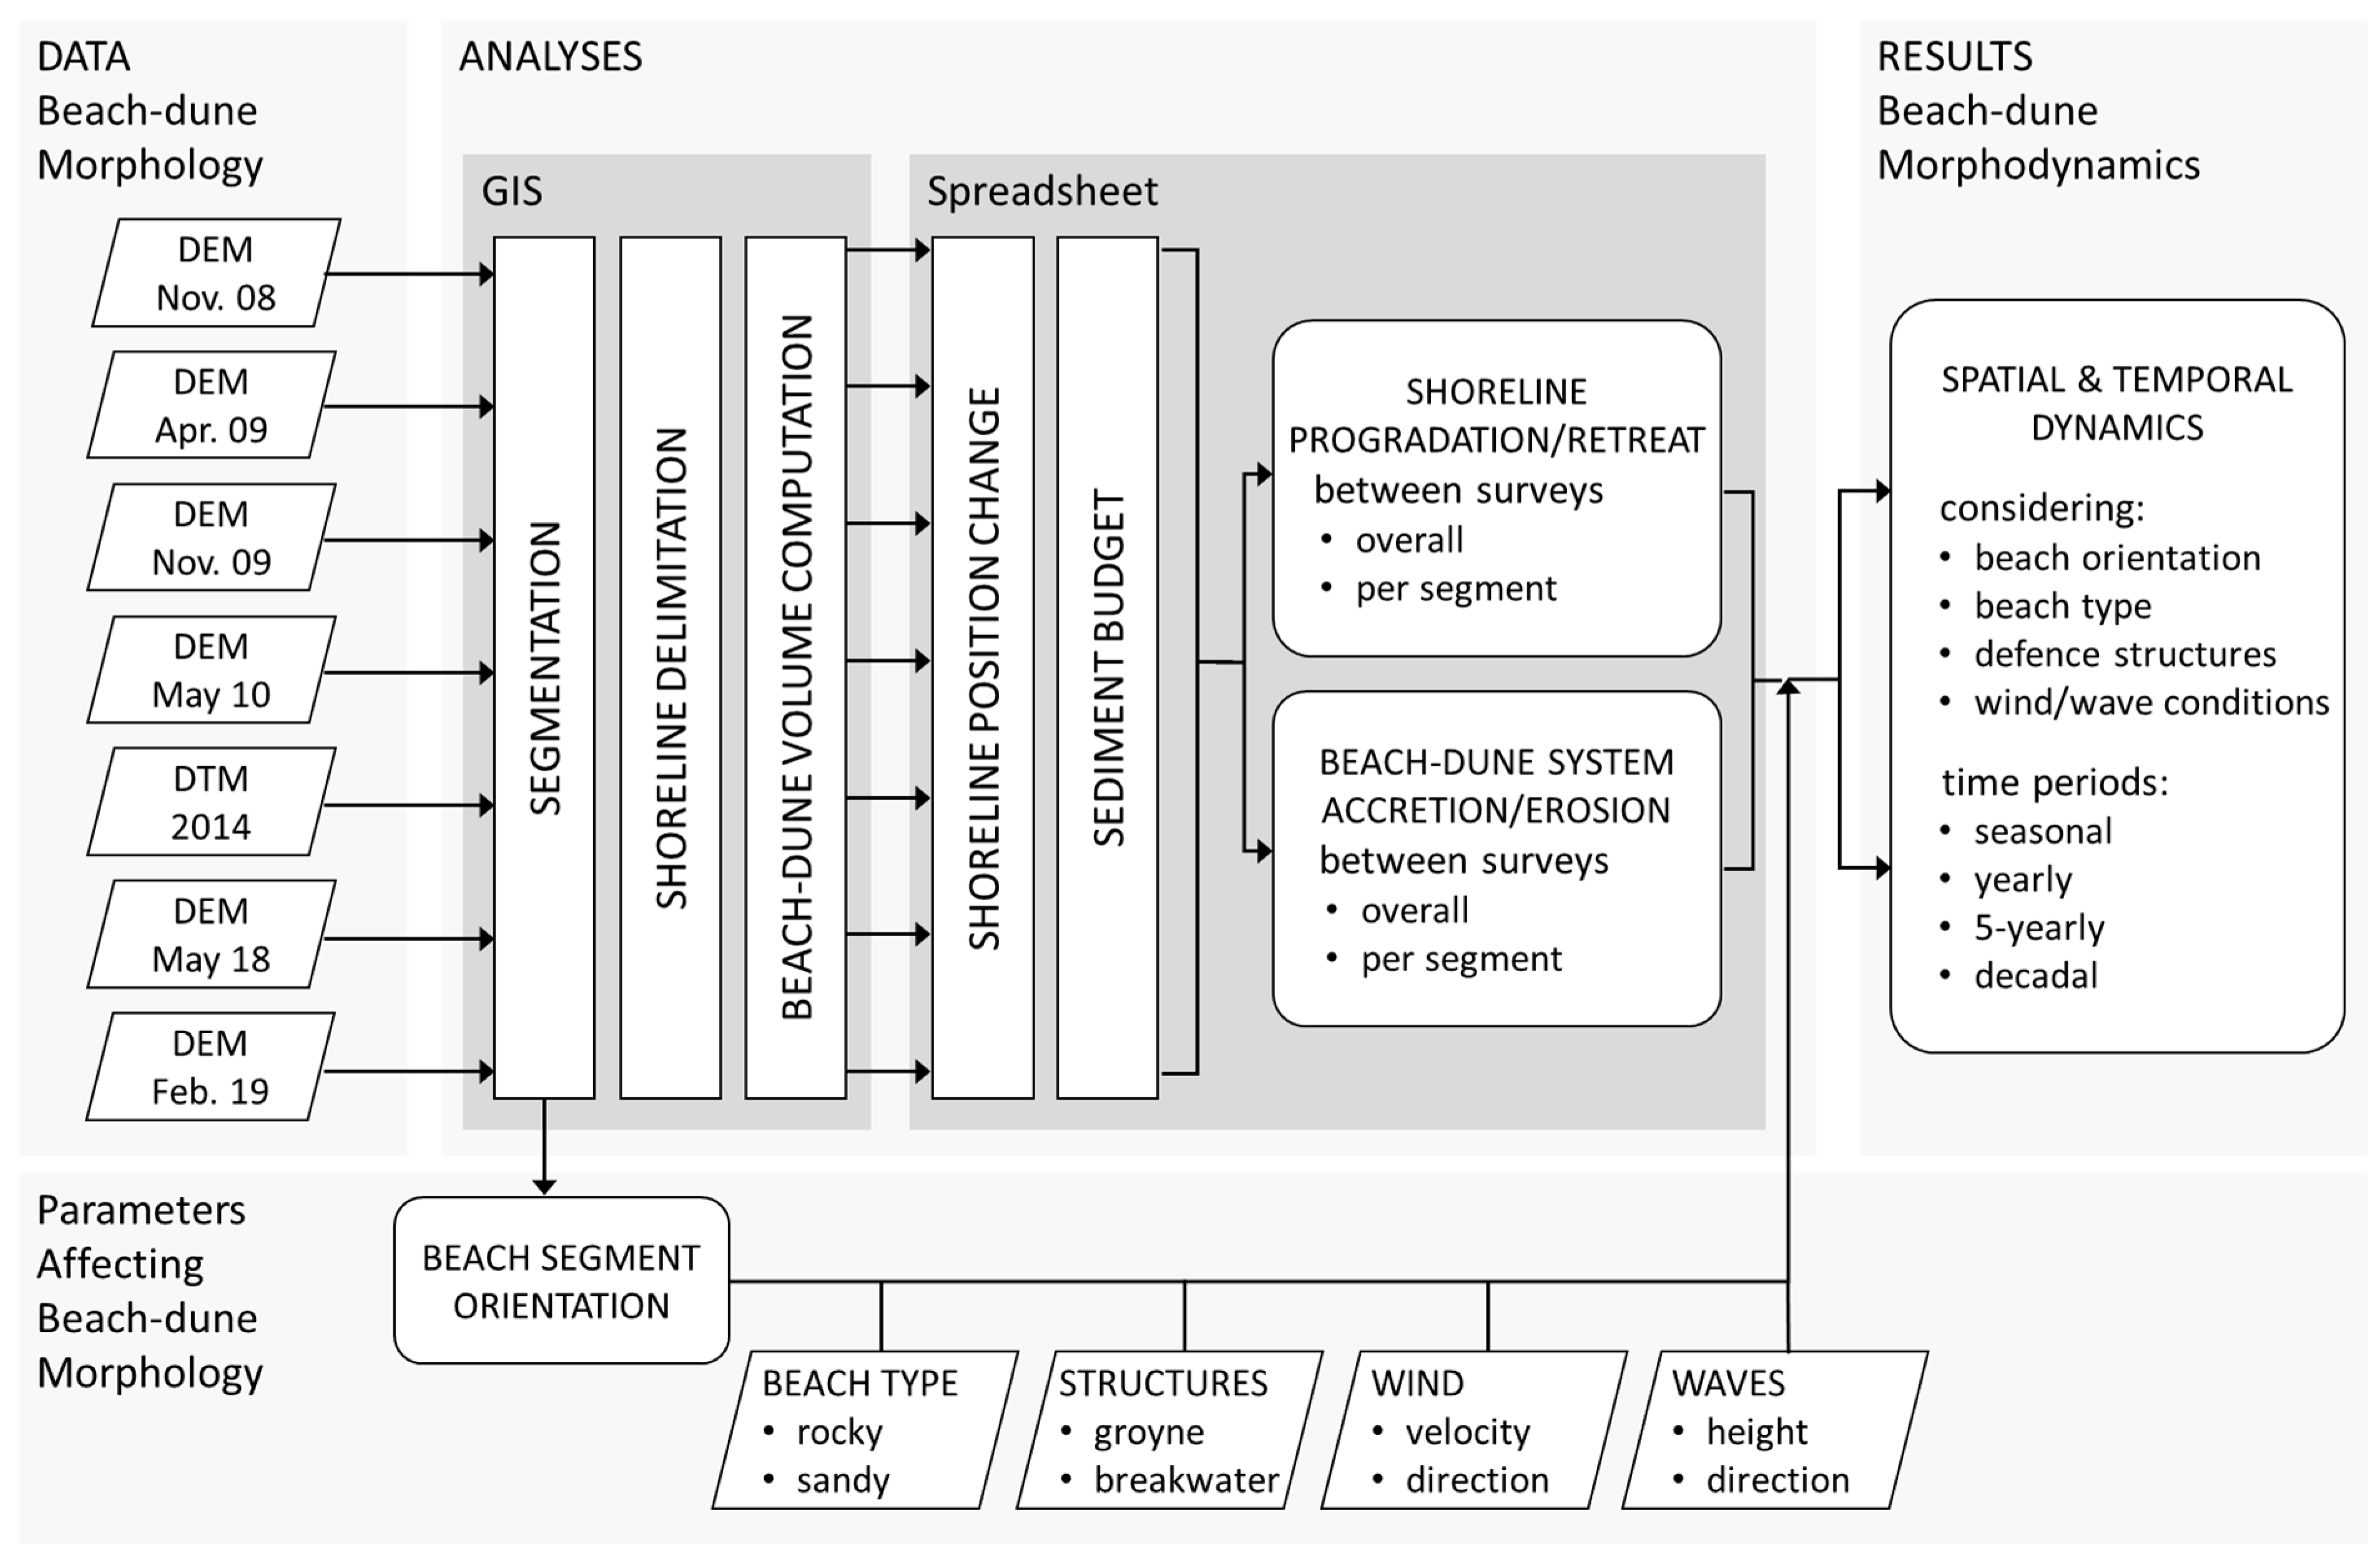
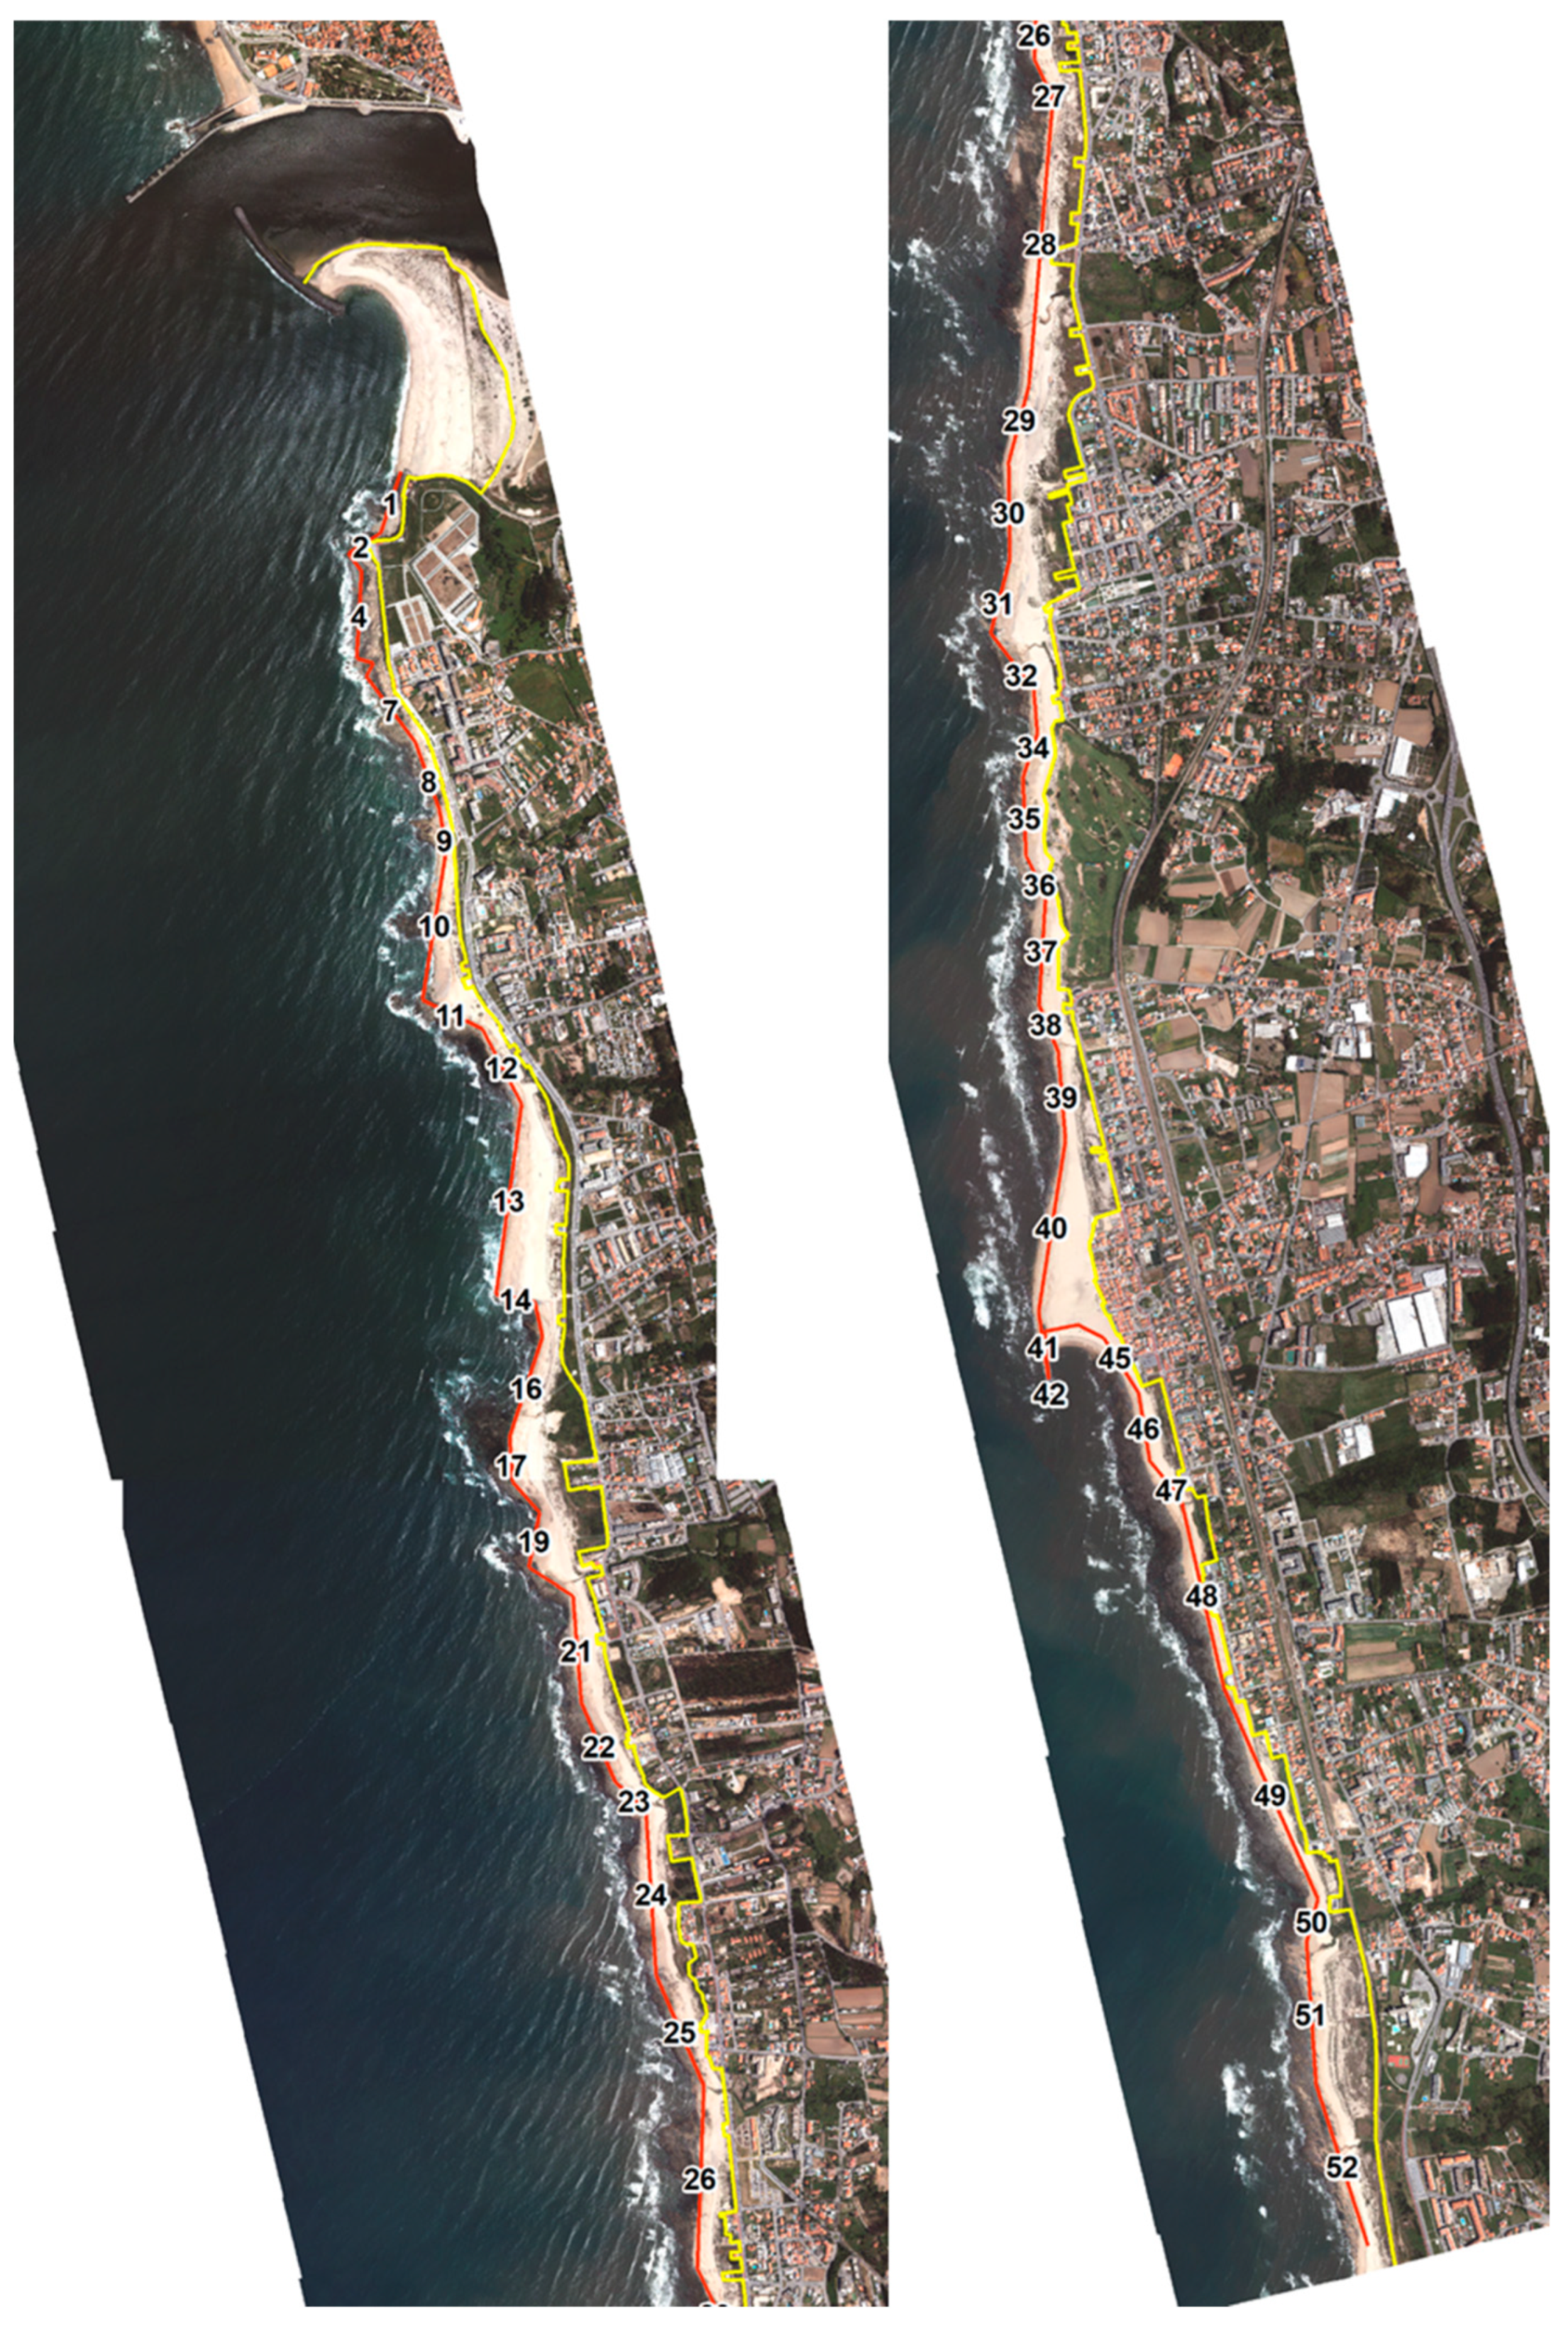
Wind velocity and direction were obtained from the ERA5-Land reanalysis dataset [44]. ERA5-Land provides hourly high-resolution gridded climate variable estimations from 1950 to present with a resolution of 0.1° × 0.1° (i.e., about 11.1 km in the N–S direction and 8.3 km in the E–W direction at 41.1° N latitude), with the closest available location for the study region being at 41.1° N, 8.6° W. Hourly wind velocities (in m/s) were extracted and wind directions were computed from the respective estimates of the horizontal speed of air moving towards the east (u-component) and toward the north (v-component) at a height of ten metres above the surface of the Earth (Figure 2). Analogously to the processing of the wave data, wind roses were produced to show the wind direction distribution depending on the wind velocity, using 16 cardinal directions and frequencies for 3 wind-speed classes: more than 6.5 m/s, between 5 m/s and 6.5 m/s, and less than 5 m/s (Figure 3, Figure 4 and Figure 5). The classes were based on the 85th and 95th percentiles of the hourly wind velocities recorded during the total study period, which were 5.2 m/s and 6.6 m/s, respectively. Notice that these data were model simulations and, although ERA5-Land wind data may be generally acceptable for coastal locations with moderate variability in topography, they should be used with caution for coastal zones because the ocean–land discontinuity affects model stability conditions [45].

2.3. Analyses

The adopted procedure is schematised in Figure 6. The DEMs and DTM, on a regular 1 × 1 m grid and 2 × 2 m grid, respectively, were mapped and analysed in a GIS tool (using ArcGIS 10.6 and its Spatial Analyst and 3D Analyst modules). Differences between elevation models were computed to quantify sediment budgets and changes in shoreline position for different periods. The data series allowed for assessing changes that occurred during the following periods: an approximate decade, between April 2009 and February 2019; two approximate 5-year periods, between April 2009 and 2014 and between 2014 and February 2019 (we assumed that the 2014 surveys took place on the 30th of June, but precise dates are unknown); three periods of a year, between November 2008 and November 2009, between April 2009 and May 2010 and between May 2018 and February 2019 (not a complete year); and three seasons, between November 2008 and April 2009 (winter), between April 2009 and November 2009 (summer) and between November 2009 and May 2010 (winter) (Table 1).
To assess the local patterns, as well as the effect of beach exposure to wind and wave impacts, the studied coastal stretch was divided into segments. Therefore, the contour line of 1 m above the mean sea level (MSL) of the first survey (November 2008) was drawn and generalised (simplified) using the Douglas–Peucker simplification algorithm [46] with a specified maximum offset tolerance of 30 m. Each segment of this generalized line represented a beach segment, and for each segment, its length and orientation (facing direction) were extracted.
Considering the isoline 1 m above MSL as representative of the shoreline, shoreline dynamics were obtained by calculating the difference between surveys in 2D area per linear meter, using the simplified isoline to determine the coastal stretch or segment length. Given that the inside limit of the study area (and of the segments) is fixed, the change in area per linear meter corresponded to the mean change in shoreline position.
Volumes, differences in volume and differences in shoreline position between surveys were computed for the beach–dune system of the entire study area and per segment. For the segments, volumes were obtained using a buffer for each segment, with straight limits perpendicular to the beach line (Figure 7). To obtain comparable results for the different beach segments, which vary in length, changes in volume were presented per linear meter of segment length. Furthermore, the slope of the more dynamic part of the beach was computed per segment by considering the beach zone with elevations between 1 and 4 m only, approximately corresponding to the upper beach face. Mean slopes per segment were obtained based on the segment area for this elevation range and the segment length. Finally, the results were analysed by considering beach types, beach orientation and local wind and wave climates.

3. Results

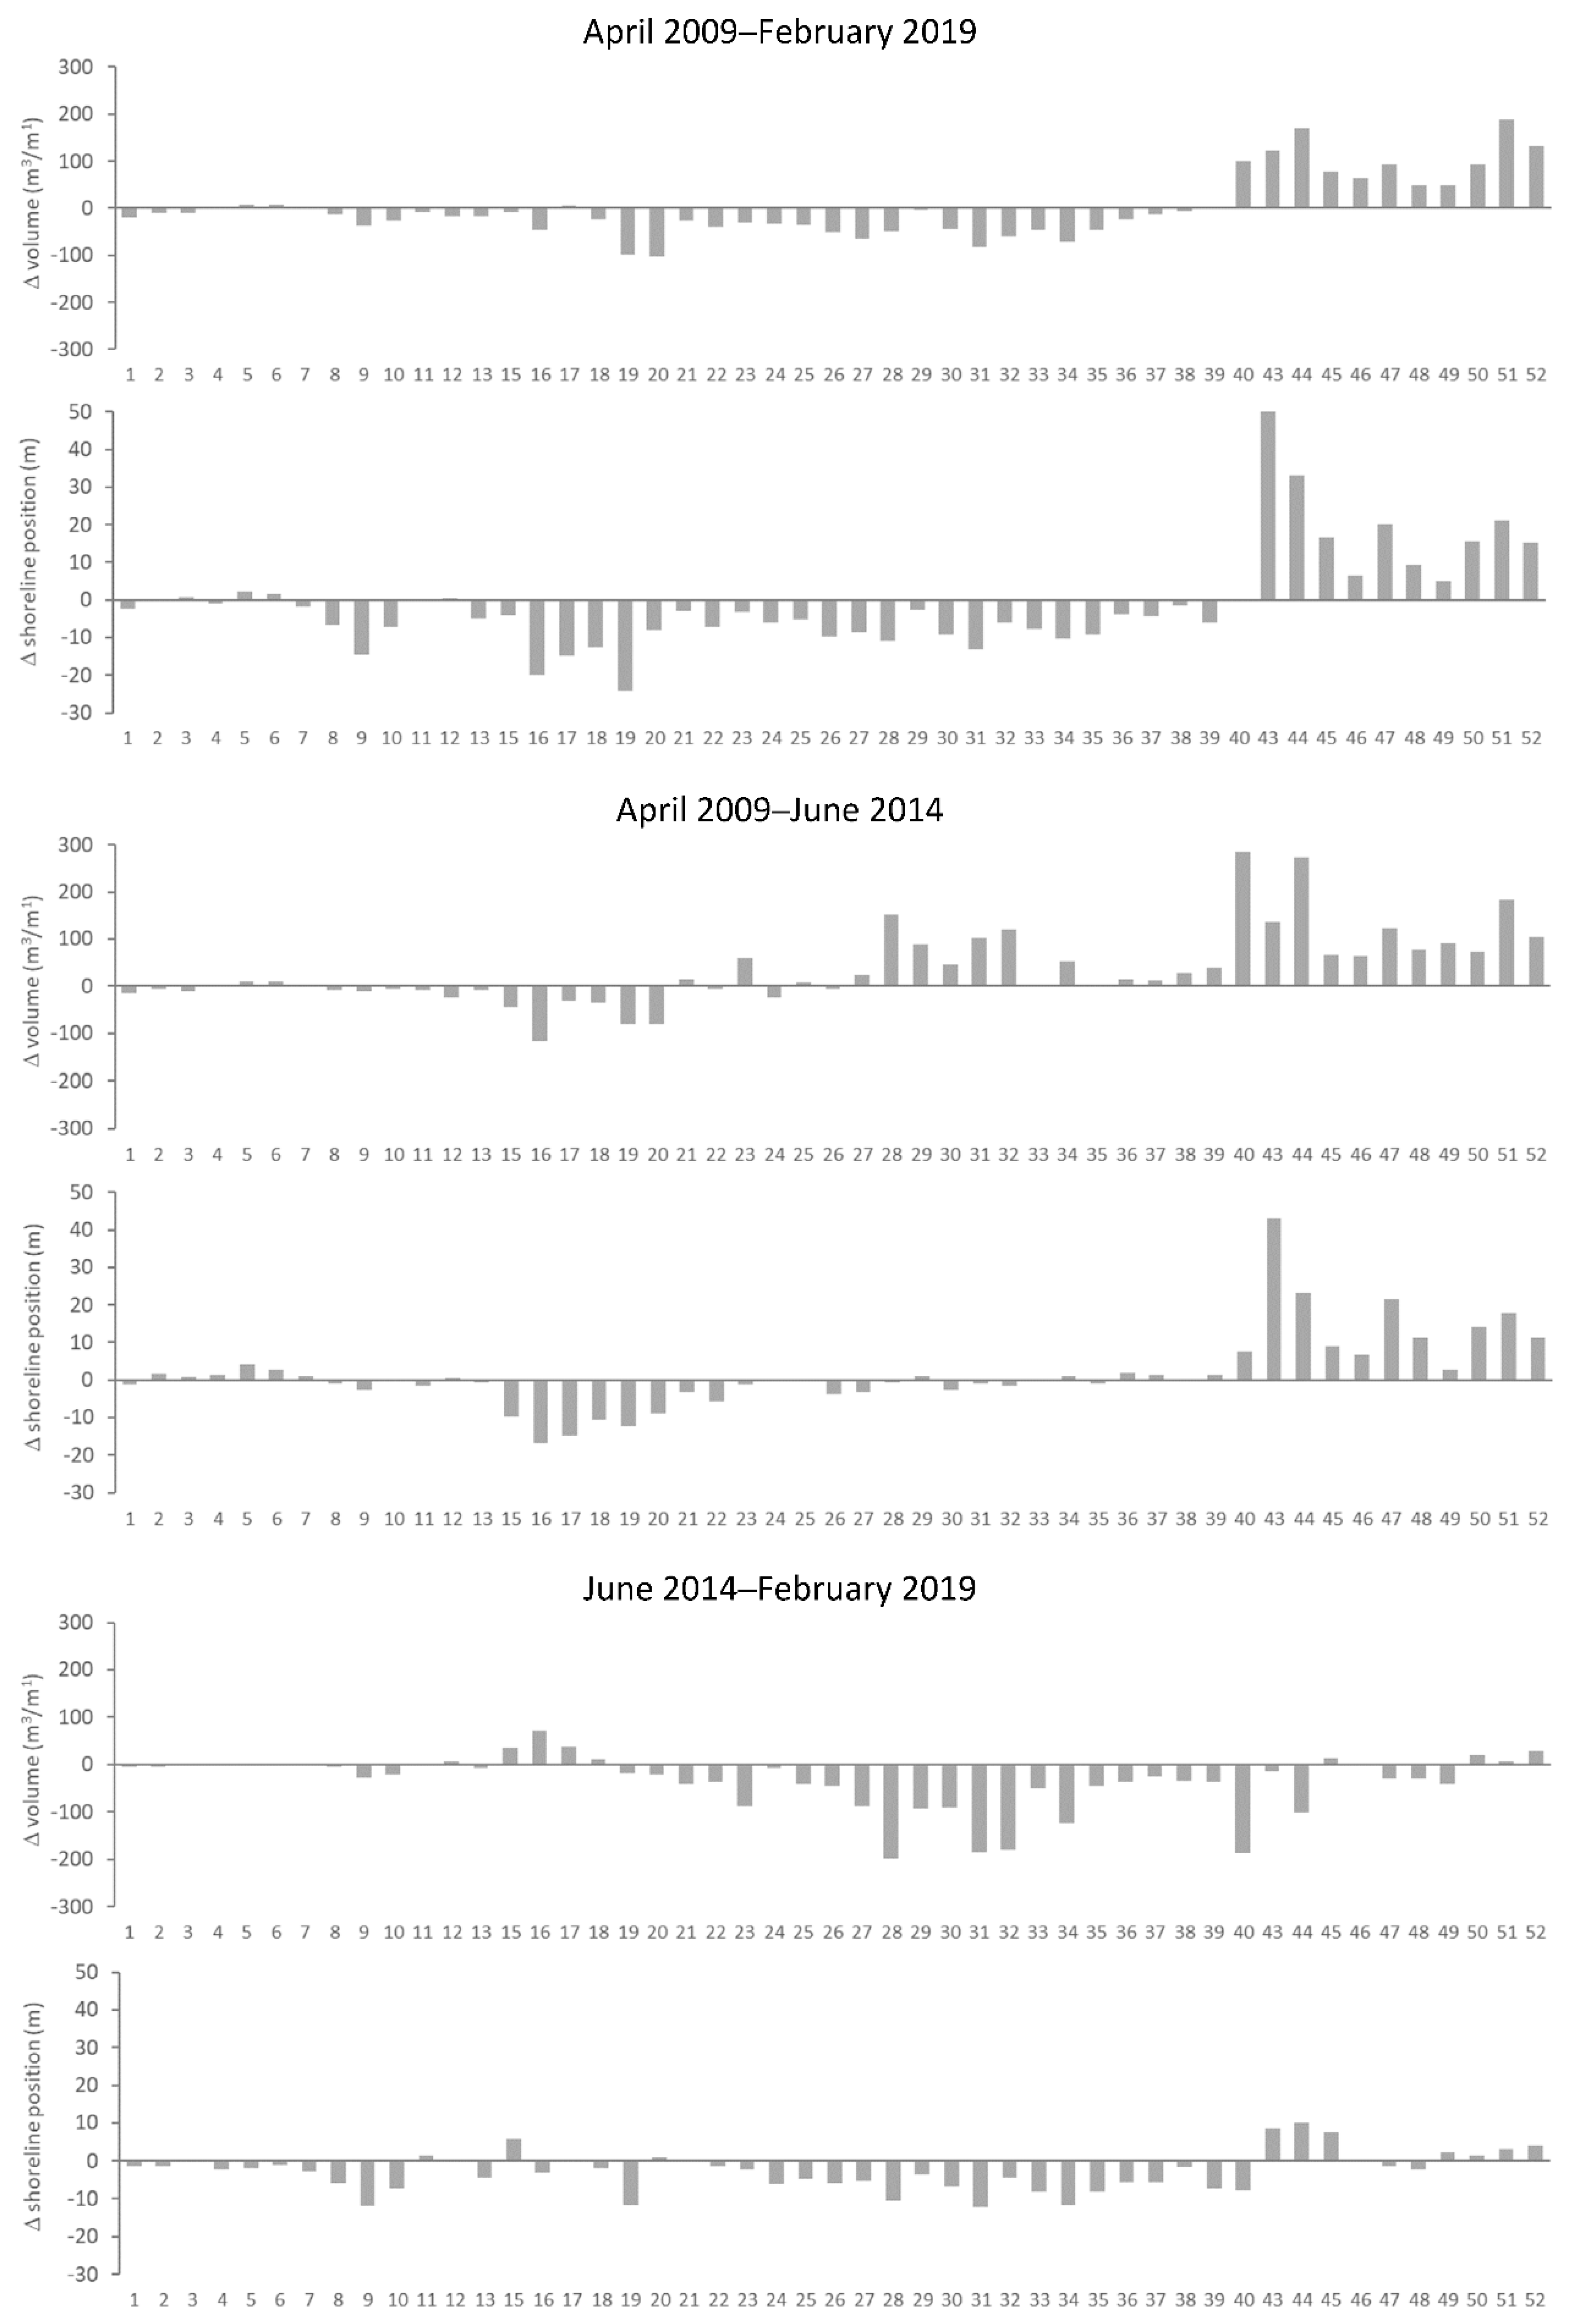
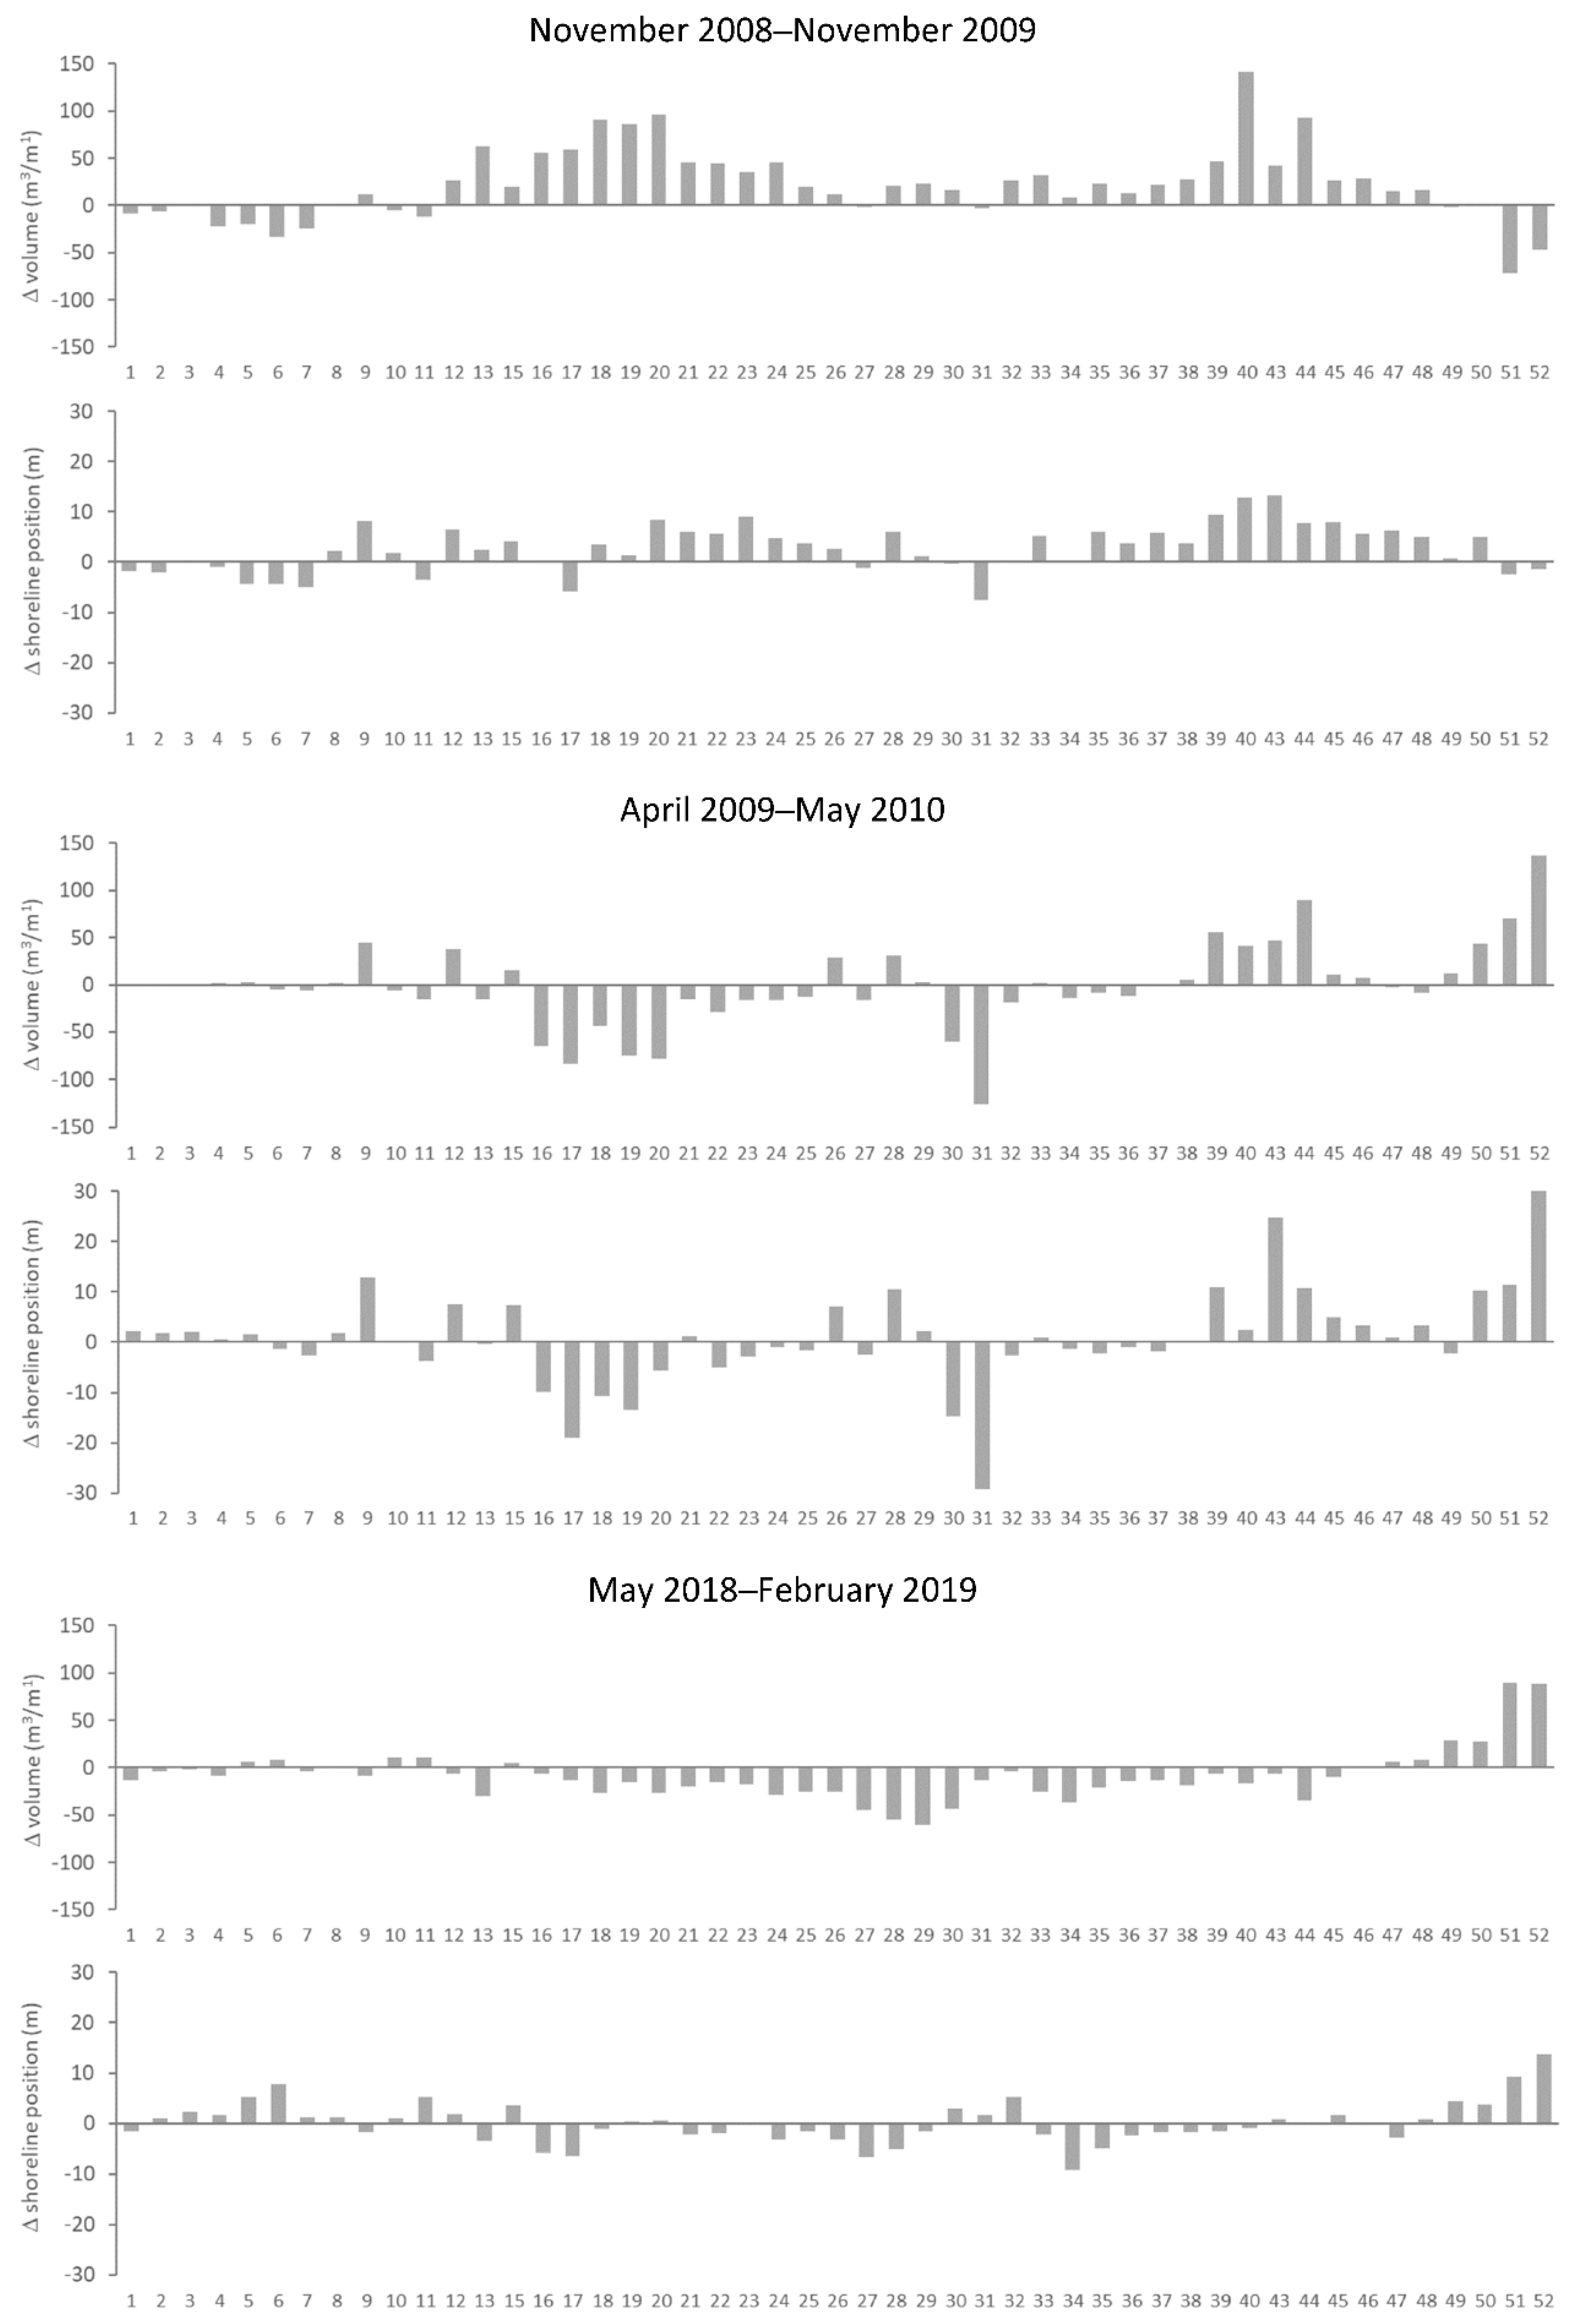
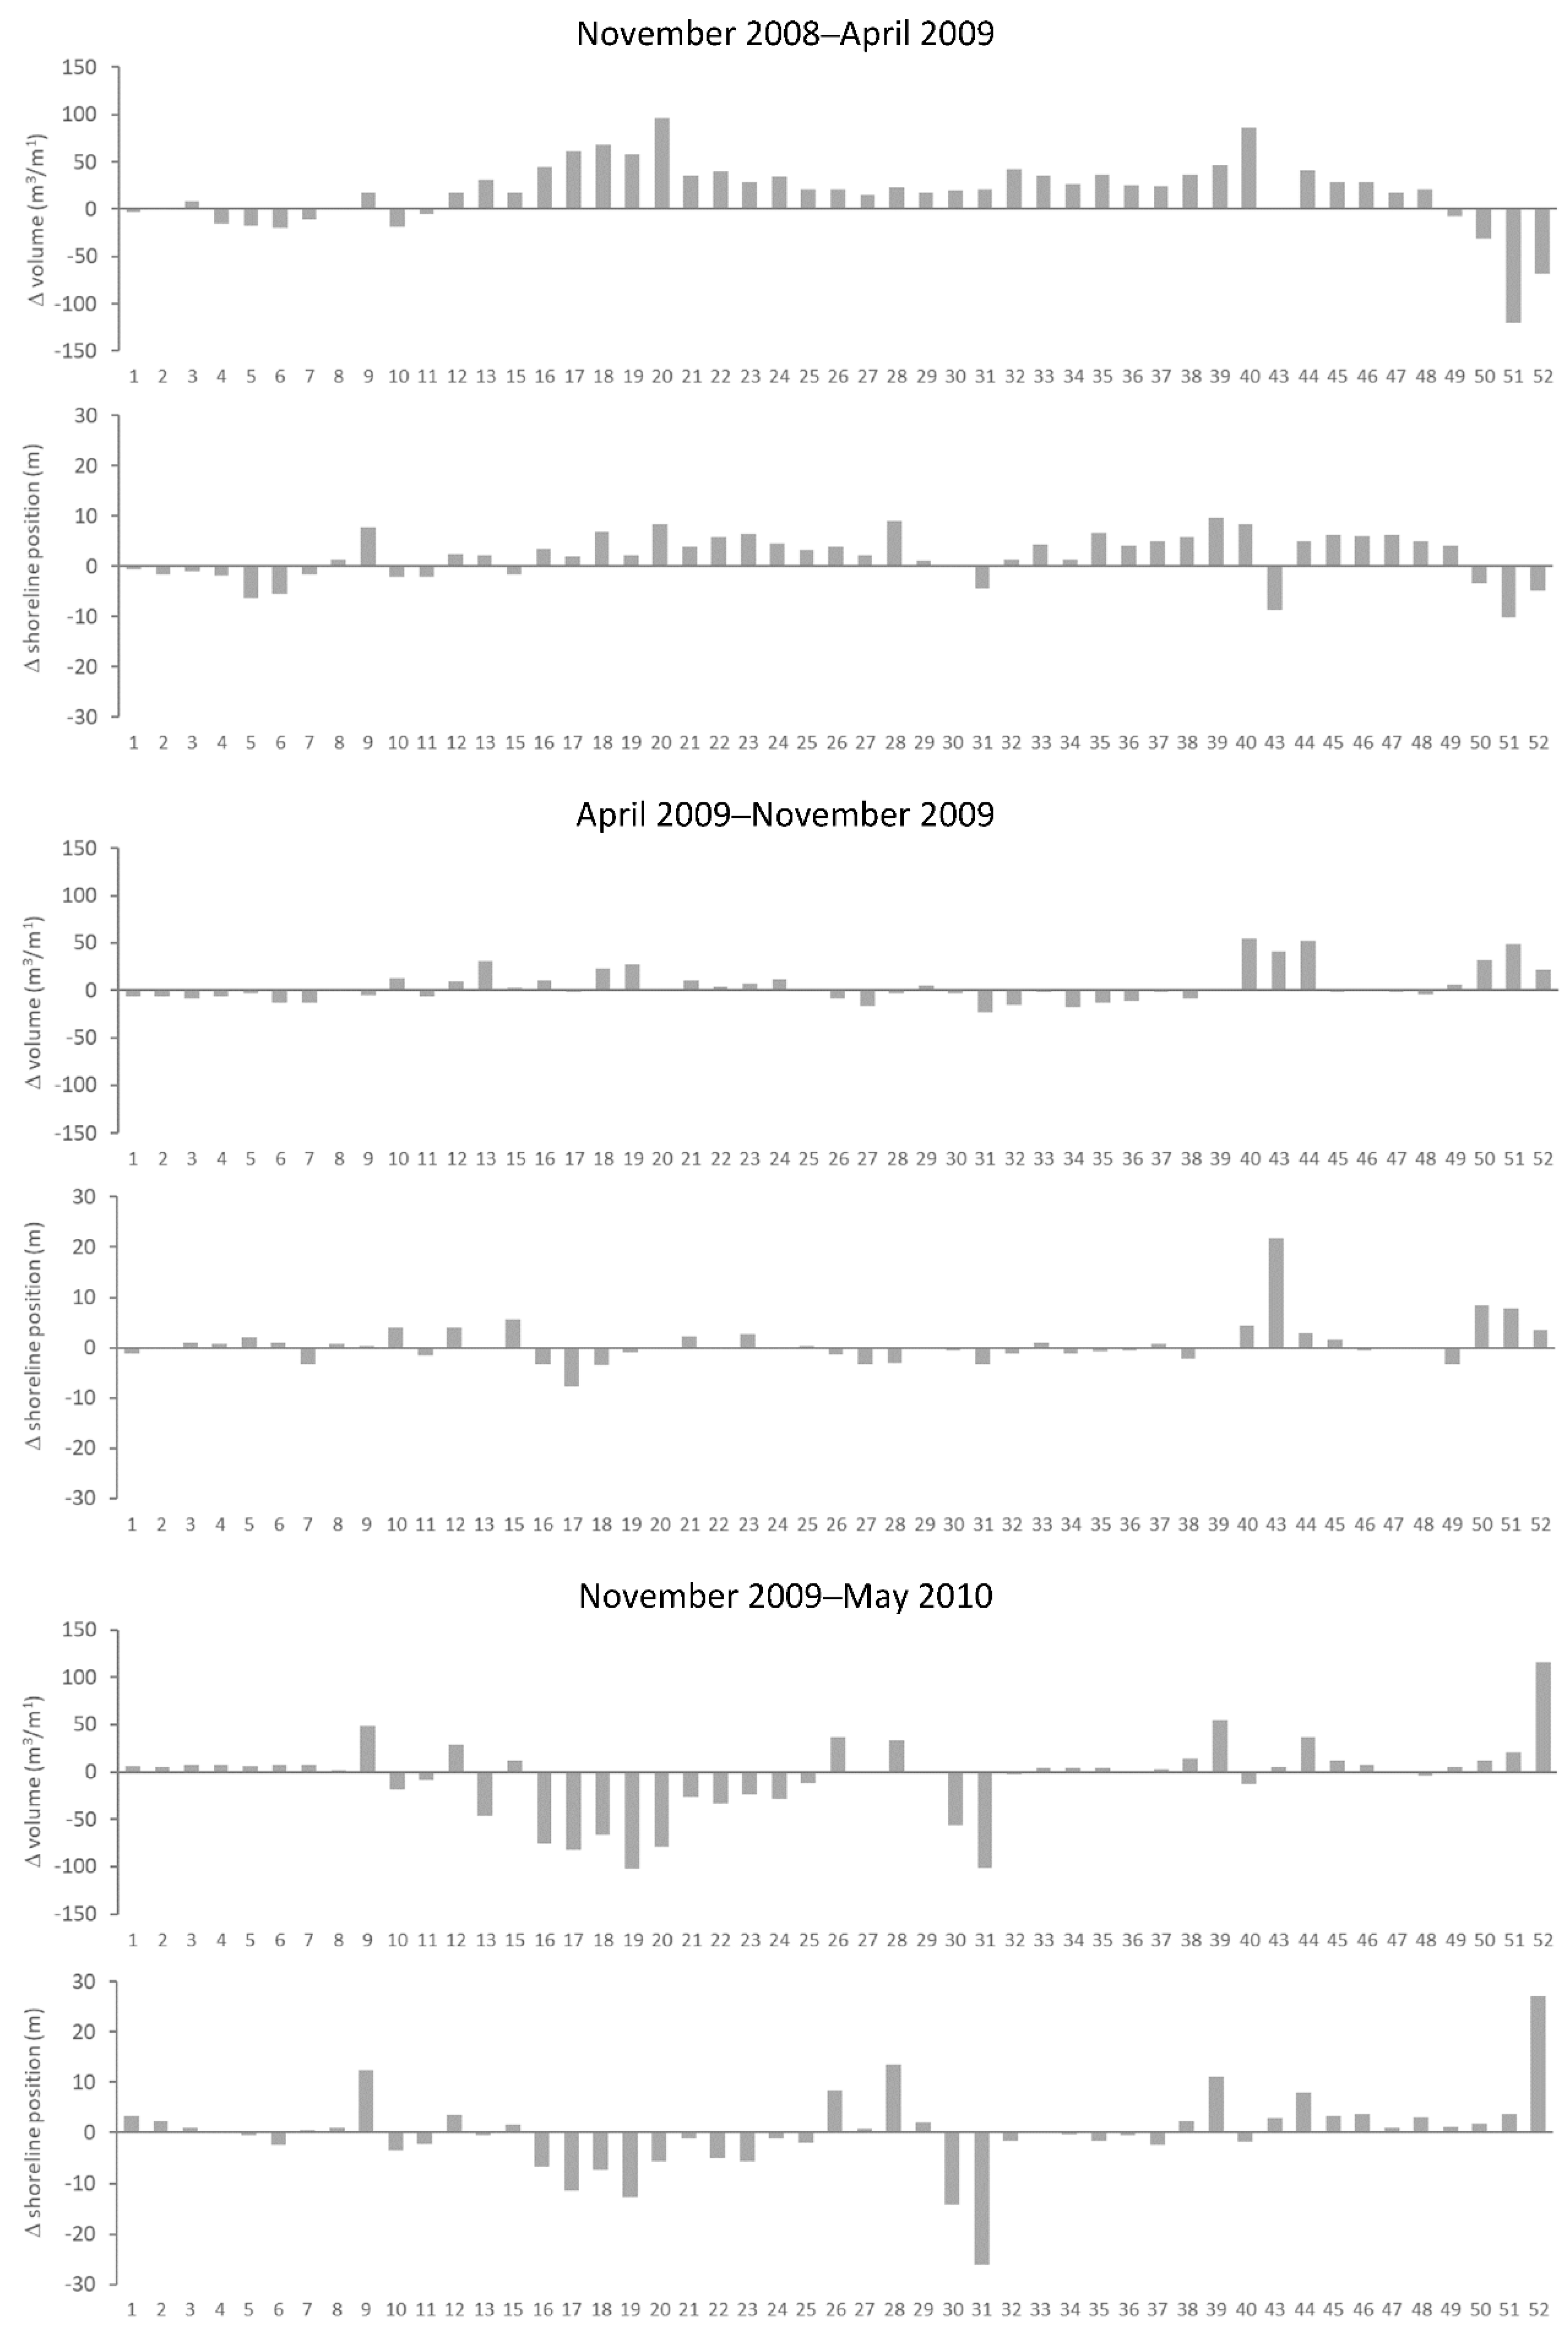
3.1. Overall Morphodynamics

The beach and dune system of the studied coastal stretch had an approximate area of 1,400,000 m2 and a volume of 790,000 m3 above the MSL. Overall, the analysed time series started with a year showing marked accretion and shoreline progradation (Table 1), followed by less accentuated erosional and accretional periods. Shoreline dynamics did not always reflect sedimentary budgets, with some periods showing landward migration when the volume increased and seaward movements when the volume decreased.
Looking at the morphodynamics for approximate seasons, years, 5-year periods and decade of the data series (Table 1), different behaviours were observed for comparable periods. Seasonal changes, which could only be studied for the first one and a half years, showed accretion during the first winter and the summer period, followed by a nearly stable second winter. There was also inter-annual variability, with the early years (2008/2009, 2009/2010) showing increases in volume and shoreline progradation, whereas, during the last (approximate) year (2018/2019), volume was lost, though the shoreline position remained on average stable. Considering the changes observed during 5-year periods, the first (2009/2014) showed a slight increase in volume and shoreline progradation, while the second (2014/2019) showed stable volume and shoreline regression. For the approximate decade (2009/2019), there was a slightly accretional trend in terms of volume but an erosional trend in terms of the shoreline position, which retreated 1.6 m on average.

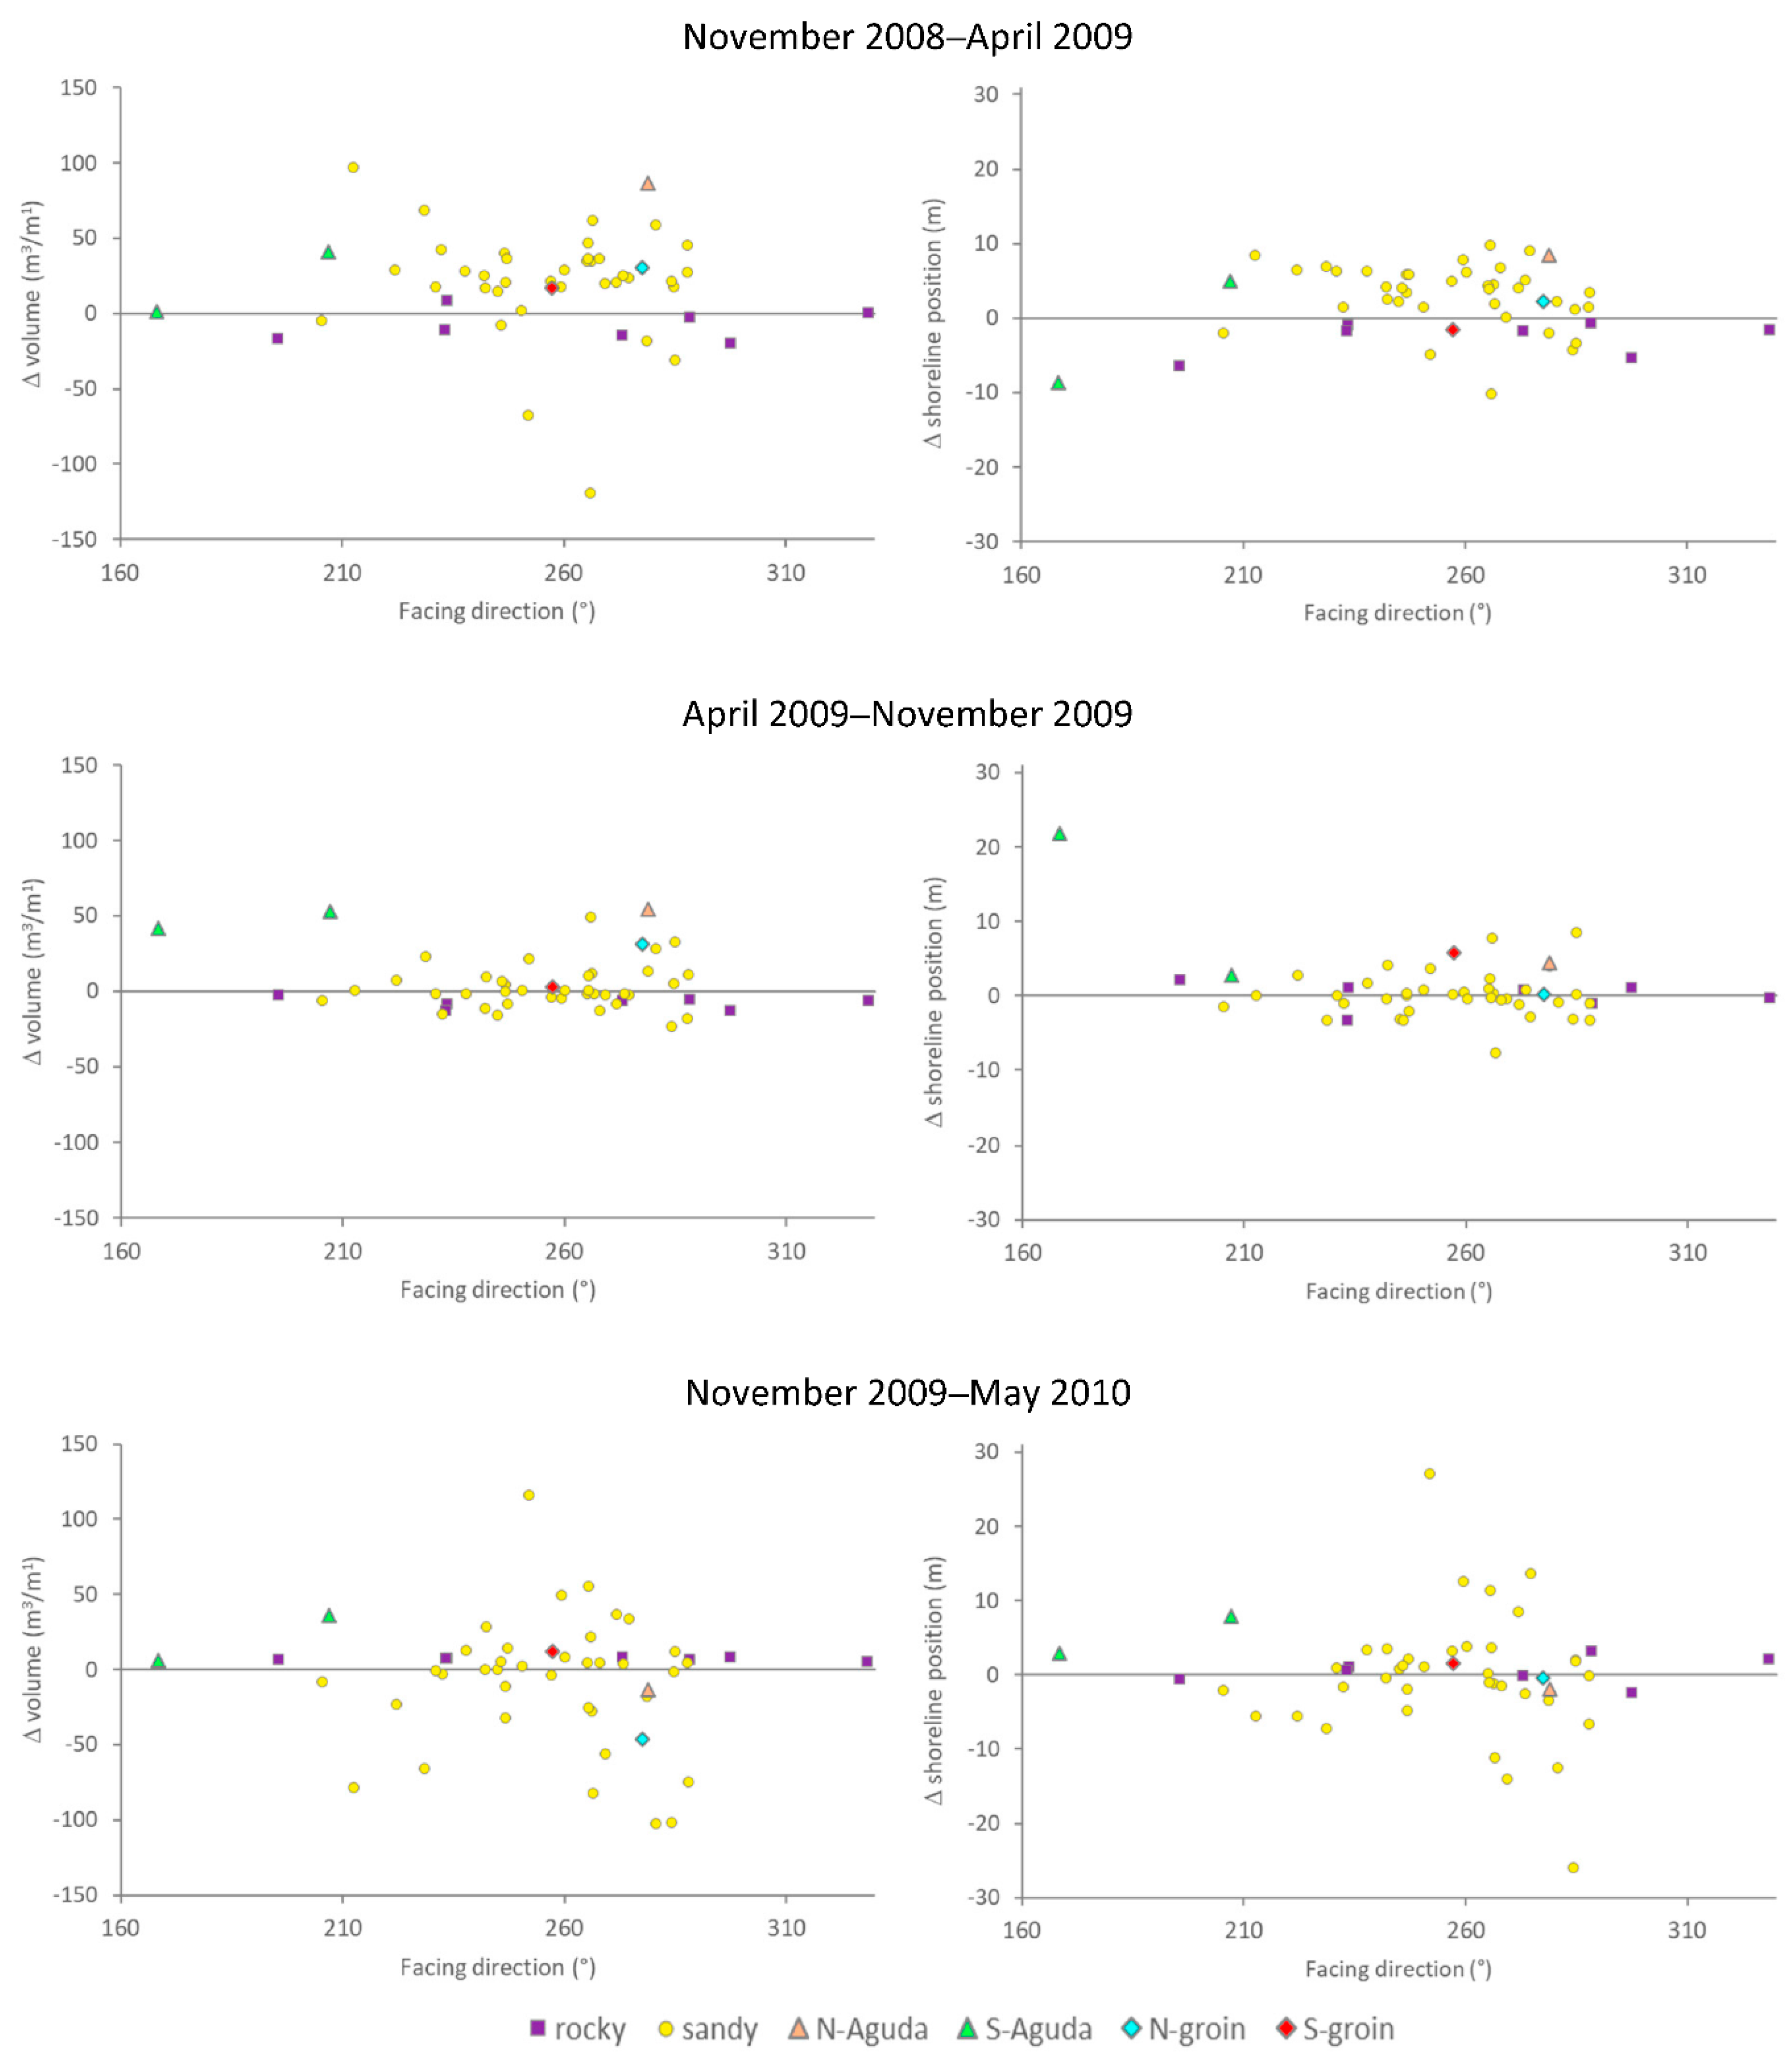
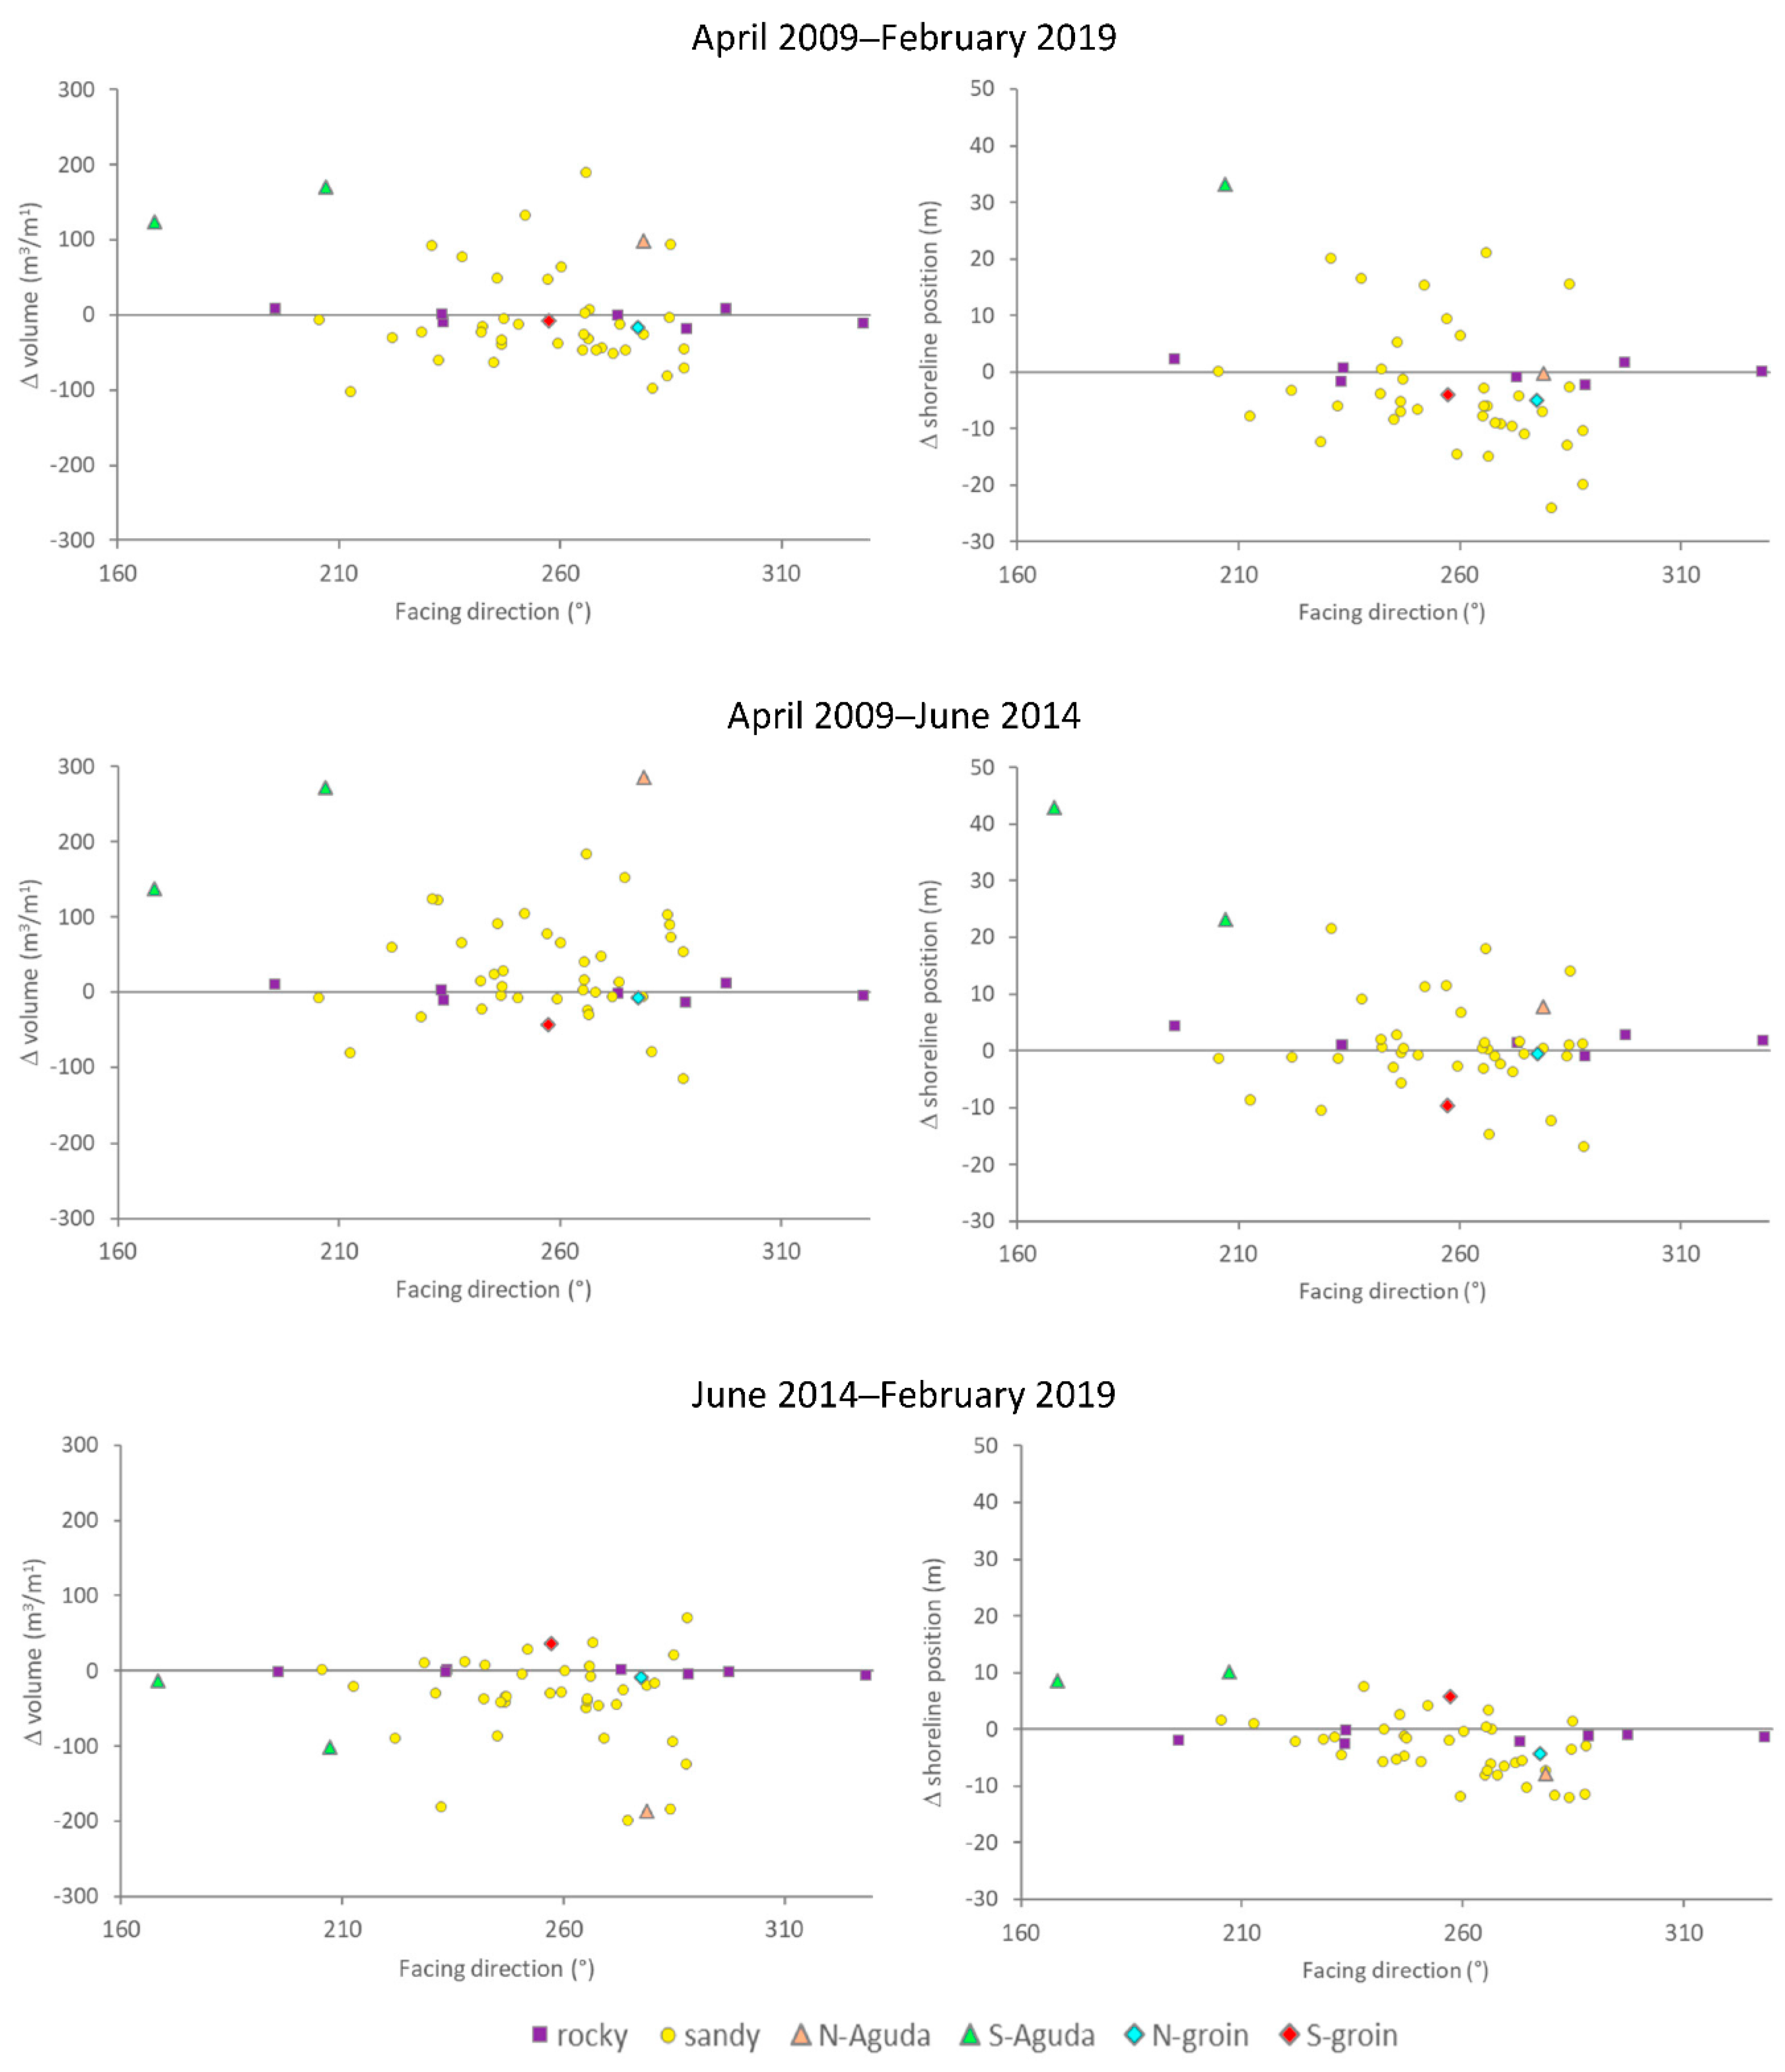
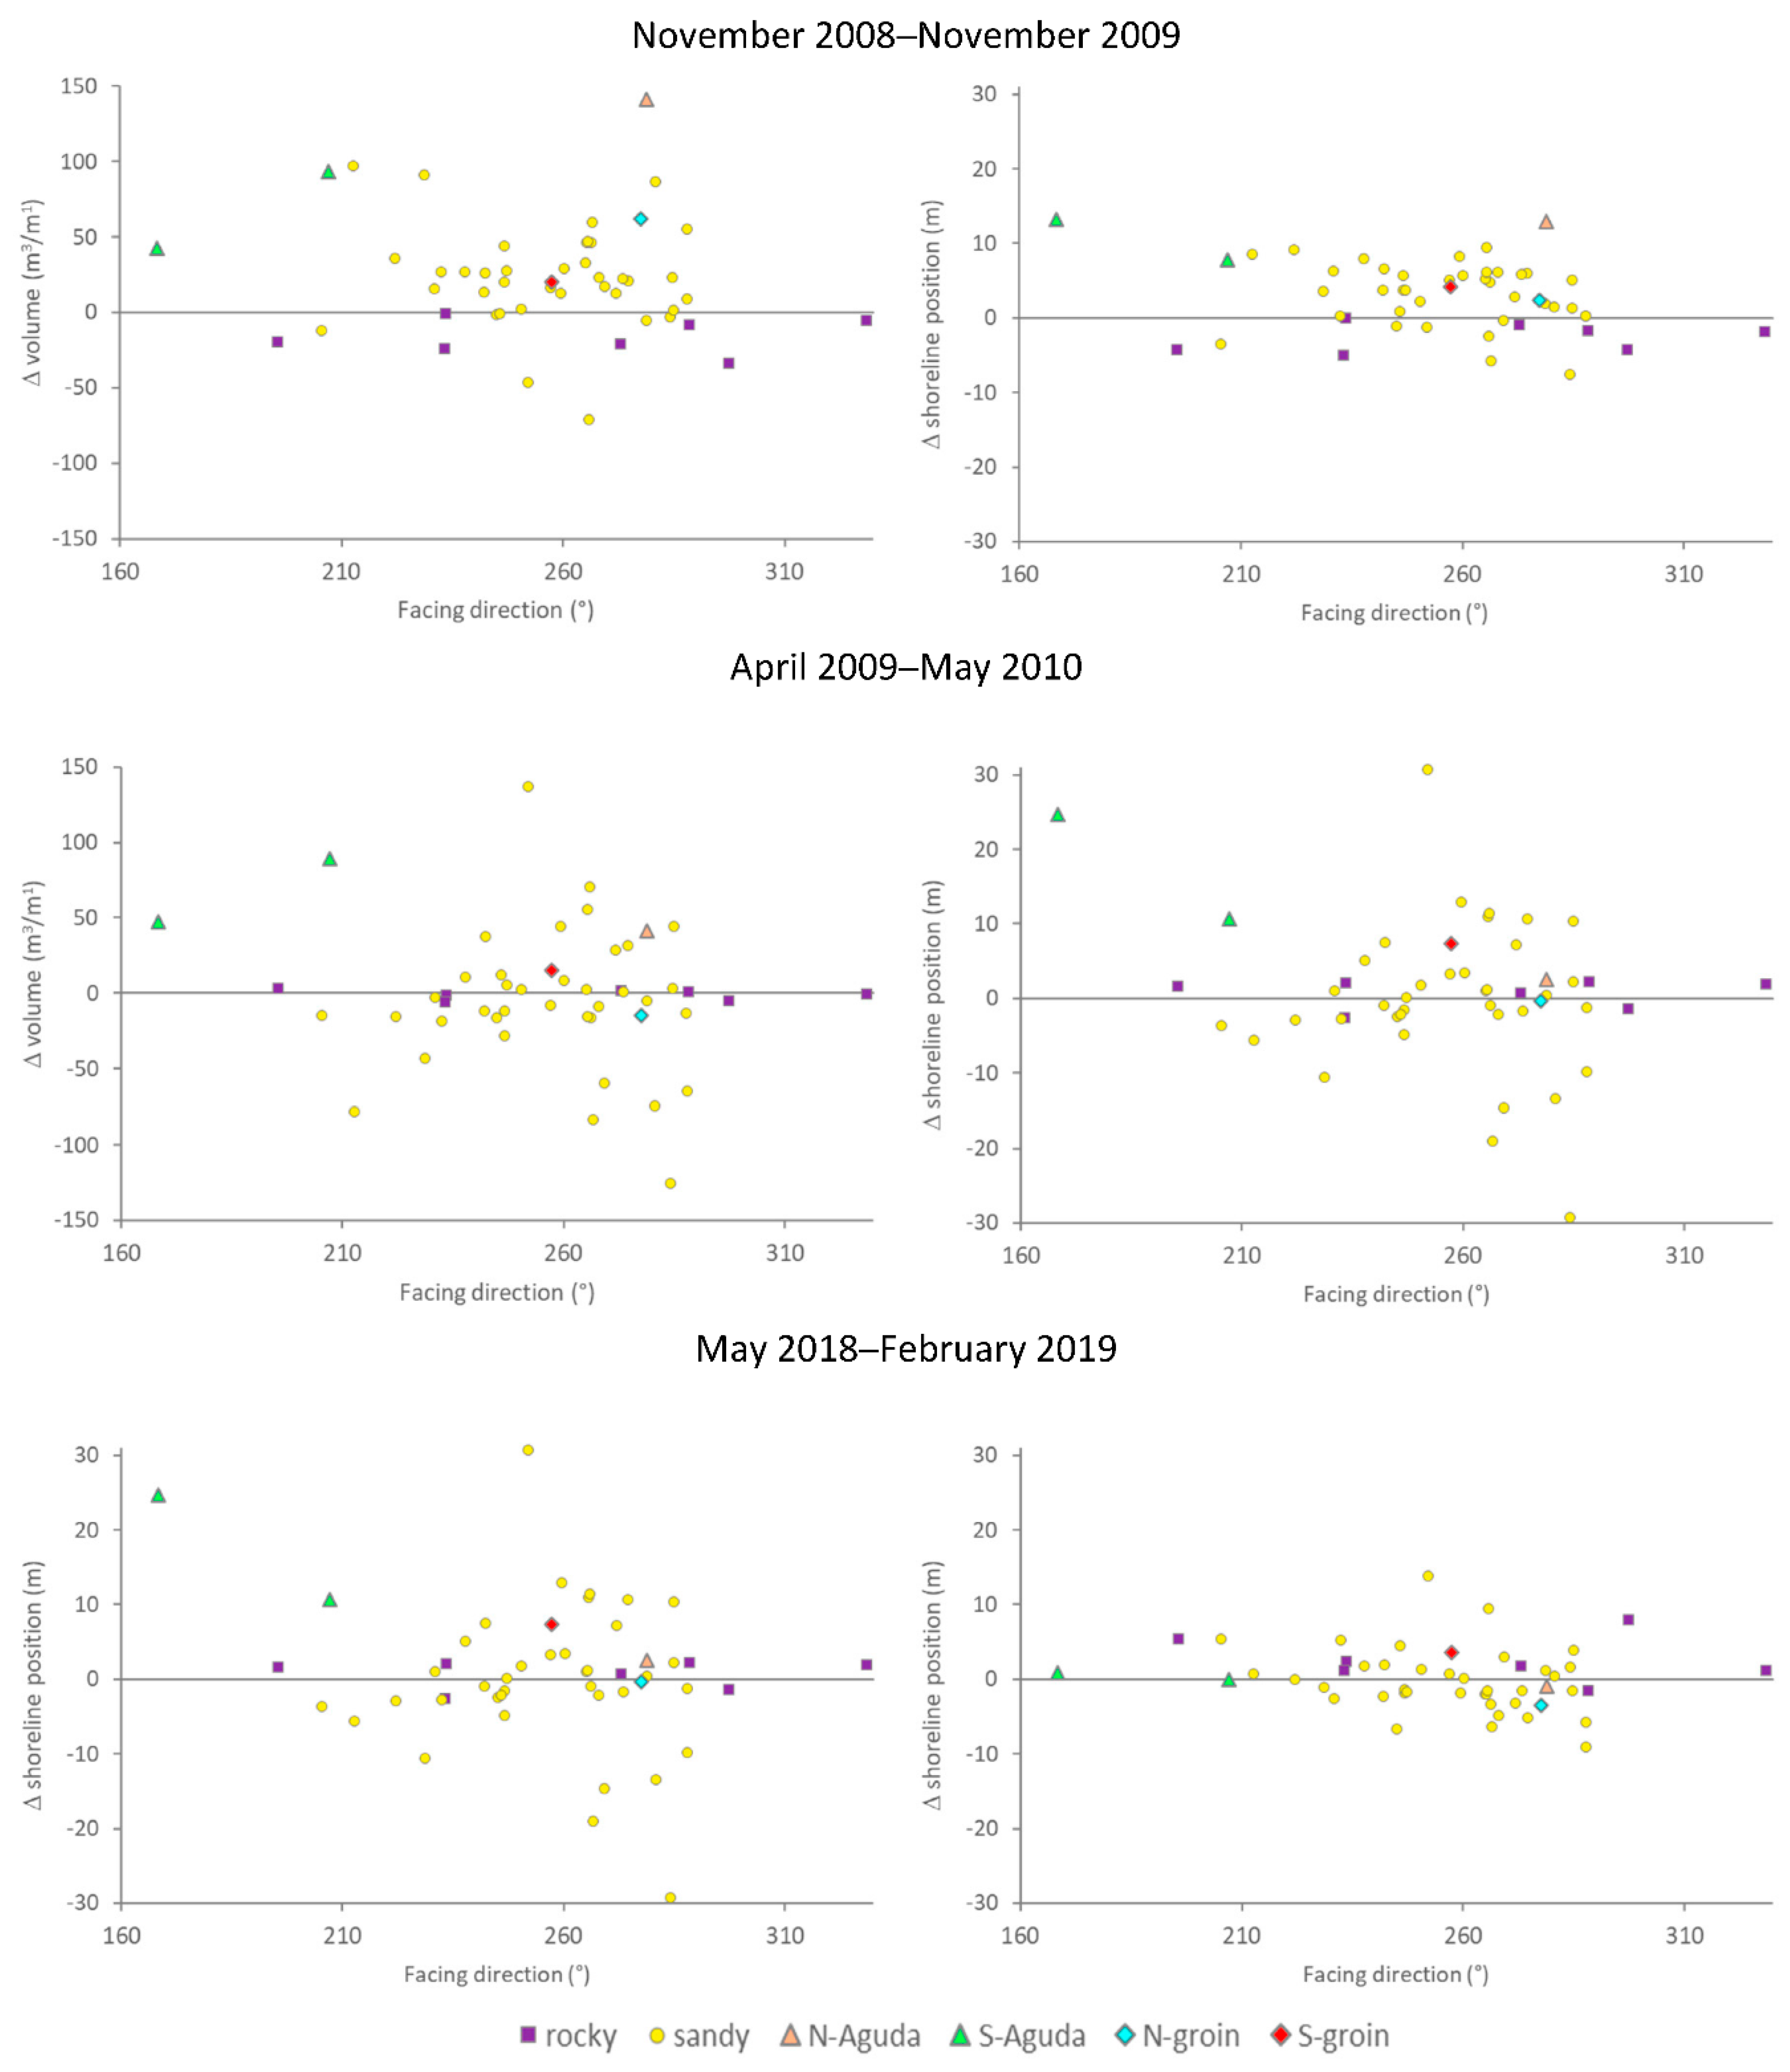
3.2. Local Morphodynamics

Of the 52 beach segments obtained through beach line simplification (Figure 8), 3 were not analysed because they represented hard defence structures without a beach (i.e., the southern face of the Praia de Canide groyne (Figure 1b), segment 14, and the two faces of the Aguda breakwater (Figure 1c, segments 41 and 42). In the northern part, segments 1 to 7 were predominantly rocky (Figure 1a), with slopes between 7.6° and 20.9°, with a mean slope of 10.6°. To the south, from segment 8 to segment 52, the beaches were sandy with rocky outcrops and slopes between 2.1° and 7.9°, with a mean slope of 5.1°.
Considering a decade (Table 1), sediment budgets and shoreline dynamics varied spatially (Figure 9). Segments showed sedimentary budgets ranging from losses of 213.8 m3 to gains of 417.0 m3 per linear meter of coast and shoreline dynamics ranging from 24.0 m regression to 51.5 m progradation. Stretches with relatively stable morphology and others with erosional or accretional trends were found, depending on beach type, shoreline orientation and the presence of defence structures. Rocky beaches (segments 1–7) were the least dynamic. Sandy beaches were the most dynamic, with mean shoreline position changes of 0.0 m and −3.4 m, respectively, and mean sediment budgets of −1.1 m3 and −2.9 m3, respectively, per linear meter of coastline and for the studied decade. However, two zones of sandy segments could be distinguished as segments with varying erosional trends in the north and centre of the study area (8–39) and segments with accretional trends in the south (40–52). Patterns differed, however, for the two 5-year periods comprising the decade, except for the northern rocky segments, which remained relatively stable throughout. The accretion in the most southern segments (40–52) and the erosion in the northern sandy segments (12–20) took place during the first 5 years. The erosion of the central-southern segments (24–40) occurred during the second 5 years.
The three yearly periods analysed showed a spatial variability similar to the decadal period, with sediment budgets between −243.7 m3 and 377.9 m3 per linear meter and shoreline changes between −29.3 m and 30.7 m. There was a marked interannual variability (Figure 10). The first year (2008/2009) showed accretion for most segments, except for the rocky northern segments and the two most southern segments, which lost volume and retreated. The behaviour in terms of volume was not always analogous to the shoreline change. The second (2009/2010) and third (2018/2019) years analysed showed patterns that were more similar to the decadal pattern. The northern rocky segments were followed by predominantly eroding segments and a few accretionary southern segments, although there was some variability in the central part during the second year.
The seasonal analysis (Figure 11) showed a first overall accretional winter with a pattern similar to that of the first year, followed by a rather stable summer season, marked by accretion in some southern segments (40–44, 50–52). The second winter, however, displayed much more variability, with some central-zone segments losing a lot of volume. Seasons showed segments with sediment budgets between −264.3 m3 and 301.6 m3 per linear meter and shoreline changes between −26.1 m and 27.1 m.
Analysis of the segments per beach type and segment orientation (Figure 12, Figure 13 and Figure 14), confirmed that rocky beaches presented less sedimentary dynamics in general than sandy beaches, as expected, independently of their orientation. Over the 10-year period and on average, rocky segments lost 1.1 m3 of volume per linear meter (SD = 1.7) and did not change their shoreline position (change = 0.0 m, SD = 1.7). Sandy segments lost 2.9 m3 of volume per linear meter (SD = 117.6) and retreated 3.4 m (SD = 10.7). Segments neighbouring defence structures, particularly the segment to the north of the Aguda breakwater, showed variable behaviour. For the decadal period (Figure 12), erosion and shoreline retreat tended to be higher for westward oriented segments compared to north-westward oriented segments, although some segments (particularly the most southern segments of the study area) displayed marked accretion despite facing approximately west. The behaviours of the two 5-year periods were distinct, with a second 5-year period characterized by more intense erosion and shoreline retreat, which seems to become more severe as the segments tended towards a western orientation. Yearly patterns (Figure 13) showed accretion in most segments in the first year, independent of their orientation, and higher erosion in the second year, particularly in segments oriented towards the W. For the third analysed yearly period (corresponding to the last year of the data series), the shoreline dynamics were apparently related to the segment’s orientation, similar to the behaviour observed for the last 5-year period. Seasonal patterns (Figure 14) were also distinct. Segment orientation seemed of little importance for the first winter period, which was marked by accretion, and for the following summer period, which showed less intense dynamics. The second winter, on the other hand, showed again a tendency towards higher erosion in the segments oriented towards the west. As seen earlier, volumetric changes did not always correspond to shoreline changes.

4. Discussion

4.1. Overall Morphodynamics

For the whole study period (November 2009–February 2019), the beach–dune system studied gained 3.6% in volume and 1.1% in area, with the shoreline moving, on average, 1.1 m seaward (Table 1). However, most of this accretion took place during the first year. After that, the beach volume and shoreline position stabilized. Considering the two analysed 5-year periods (2009/2014 and 2014/2019), the first showed a slight increase in volume and shoreline progradation, whereas the second showed a stable volume but a marked shoreline retreat of 3.1 m, despite protection measures (such as the groyne and breakwater) and artificial beach nourishments. The northwest coast of Portugal has been suffering from a scarce sediment input and a high-energy wave climate, which turns this coast into one of the most active in terms of sediment transport fluxes, with the segment just south of the study area between Espinho and Torreira considered one of the most exposed and vulnerable areas to erosion in the country [18]. Erosion hotspots with 2.5 m shoreline retreat have been found in that region at Vagueira beach [25], despite frequent artificial beach nourishments. A retreat of 1–5 m per year was estimated if no mitigation measures were taken [14]. Therefore, although the studied stretch seems to be rather stable in the medium term (decade), there seems to be a trend towards erosion in recent years (though longer time series are needed to confirm whether this trend is persistent). Furthermore, this trend, if confirmed, in combination with the projected sea-level rise [9], suggests that erosion and shoreline retreat is likely to become an even more serious problem in the future.
There are several possible reasons for these differences between early and later periods of the analysed time series, ranging from differences in forcing variables, such as wave and wind intensities and directions, to differences in sediment availability (dependent on river flows, ocean currents, sediment extraction and beach nourishments). Wave and wind conditions during the period between surveys were therefore analysed to look for patterns that may explain the observed morphodynamics. Offshore wave and onshore wind conditions were quite similar for these two 5-year periods (Figure 3), but the strongest and most damaging winter of the time series occurred in 2013/2014. This winter caused widespread and intense erosion on Atlantic coasts, which took months to some years to recover [47,48]. This may have contributed to the sediment loss between May 2010 and June 2014 and to the recovery between June 2014 and May 2018. Nonetheless, the second 5-year period showed a remarkable and concerning average shoreline retreat.
The difference between early and later periods of the data series, representing more accretional and more erosional behaviours, respectively, was also reflected in the marked inter-annual variation found. During the first year (November 2008 to November 2009), the beach–dune system volume increased by more than 4% and the shoreline moved, on average, more than 3 m seaward. Accretion was less intense for the second yearly period analysed (April 2009 to May 2010), and the (approximate) last year (May 2018 to February 2019) showed erosion instead. Looking at the wave and wind conditions during the yearly periods, patterns diverged, reflecting the general medium-term pattern during the first year, with dominant wave directions from the NW and wind directions from NNW, showing more distributed wave directions and a strong southern wind component during the second year and revealing a more frequent wave direction component from the WNW in the third year. Given that the coastal stretch faced roughly WSW, wave incidence in the last year was less oblique for most segments, possibly reducing sediment transport and deposition via the induced N–S littoral drift.
Seasonal analyses showed two very different winter periods (November 2008 to April 2009 and November 2009 to May 2010, respectively), the first presenting overall accretion and shoreline progradation, while the second presented erosion (though with a progressing shoreline). Looking at the corresponding wave and wind climates, the first winter was characterized by NW–WNW waves and winds distributed from N to W and S, whereas the second winter showed dominant W–NW waves and southern winds, suggesting, again, that more oblique wave incidence promoted accretion and less oblique wave incidence promoted erosion.
However, notice that the temporal changes were analysed based on non-regular surveys. Hence, seasonal and annual analyses do not cover the whole time series, as would be desirable. Moreover, the wave data present gaps caused by equipment failure due to extreme weather and wave conditions, meaning that extreme events may be underrepresented in the data. In terms of wind effects, no clear relationship between wind directions and the morpho-sedimentary dynamics could be identified, possibly because the ERA5-Land wind parameters used are model simulations that may not represent local coastal patterns well [45]. Furthermore, morphodynamics results for the higher beach–dune areas, where wind effects are expected to be most noticeable, are likely to be less precise, particularly in the presence of vegetation. Analyses were based on six DEMs, where dune volume reflects sediments, as well as vegetation, and on one DTM, where vegetation was probably filtered out. In vegetated dunes, a DEM will therefore tend to produce higher volumes than a DTM. Furthermore, dune grass and shrub vegetation will increase in volume during the growing season, affecting seasonal budgets, and in some of the dunes, trees were also found (which may cause interannual, 5-yearly or decadal differences due to growth or felling). Detailed analysis of rocky outcrops showed very similar altitudes in the DEM and the DTM, suggesting that they were comparable. However, the fact that the models may have been processed differently and the lower resolution of the DTM have to be considered as potential error sources.

4.2. Local Morphodynamics

Local morphodynamics often diverged from the general pattern of the coastal stretch as a whole, highlighting the importance of local approaches to erosion monitoring. Morpho-sedimentary dynamics were found to vary temporally, as well as spatially, with patterns depending on beach type and exposure. This was consistent with findings that sediment transport and budget will vary locally along a non-straight coastline due to uneven wave attenuation [27]. Variability between segments was high and the magnitude of change was of a similar order for the different periods analysed, from seasonal to decadal, showing how rapidly coastal morphology can change and recover.
Over the last decade and from north to south, three zones could be distinguished: the rocky segments in the north, which were morphologically stable, as expected; a central zone of sandy beaches with rocky outcrops, displaying variable patterns but a tendency for erosion; and a southern part covering the beaches close to the city of Espinho that tended towards accretion (Figure 7, Figure 8, Figure 9, Figure 10, Figure 11 and Figure 12). This pattern also occurred during the second winter (2009/2010), the second year (2010), the second 5-year period (2014–2019) and the last year (2018/2019). The first season and first year showed overall accretion in most segments (12–48), and erosion in some rocky segments (4–7) and the most southern segments (51–52), contradicting the pattern of the later periods.
The observed sedimentary dynamics of the rocky shores were unexpected. Detailed analysis showed that differences were found on some sandy patches in the first segments, as well as between rocks, suggesting that there may be artefacts in the DEM due to shadow effects, which are particularly strong in the crevices between rocks (notice that surveys were always done during spring low tide, which may occur at different times of the day, causing more or less shadow) but also near the shoreline, where wave breaking and runup between the rocks and in crevices may have affected DEM precision.
During the first 5-year period, the central part of the study area already showed erosion, but mostly in the upper central segments (16–23). The segments to the south of the Aguda breakwater (43–52) showed accretion, which could be (at least partly) attributed to a protective effect of the breakwater. In the second 5-year period, nearly all of the central segments showed erosion and shoreline retreat. In fact, comparing the two 5-year periods, many segments showed the opposite behaviour, particularly in terms of shoreline position (e.g., 28–31, 34, 40, 44). This suggested a change in the spatial pattern between 2008 and 2019, with a trend towards erosion in the central zone and a trend towards accretion for the southern zone of the studied coastal stretch. Notice, that there is a large groyne just south of the study area at Espinho, which may have contributed to the observed updrift accretion. However, this groyne has been there for decades with more or less success in retaining updrift sediments, suggesting that a change in hydrodynamics and/or sediment supply through increased artificial beach nourishments [34] supported the accretion in recent years.
The temporal variability observed was likely a result of the different wave and wind patterns, which affected segments differently depending on the local conditions—i.e., geology, exposure, and updrift and downdrift structures. The wave incidence direction and wave impact will depend on the direction of the waves and the segment’s orientation. Murray and Asthon [49] evaluated the alongshore sediment flux for different wave angles and concluded that coastline segments with different orientations experience different alongshore sediment fluxes. Their results show that the wave angle that leads to the highest value of sediment transport is not necessarily the most oblique wave in shallow water. However, wave incidence will also depend on local hydrodynamics. The wave data used provide offshore wave heights and directions, but onshore, breaking wave characteristics are determined by wave propagation phenomena, such as shoaling and refraction, which depend on the coastal morphology and setting.
Nonetheless, analyses of the erosion/accretion indicators (sediment budget and shoreline dynamics) in relation to beach orientation (Figure 12, Figure 13 and Figure 14), showed: (i) the general temporal trends, with periods of more accretion or erosion, that were also seen in the overall and the spatial analyses; (ii) differences between beach types, with rocky beaches being relatively stable, independent of orientation, and sandy beaches showing marked variability; and, (iii) an apparent tendency towards more erosion/shoreline retreat for segments facing more western directions (despite the scatter). The latter was particularly the case for the periods of the last 5 years and the last year, suggesting that shorelines with less obliquely incident waves presented a higher erosion risk. This could be explained by the dominance of cross-shore transport towards the subaerial beach during wave storms, with the sand deposits occurring at or behind the rocky outcrops. The most westward-facing segments tended to have the highest volume losses and shoreline retreats, and erosion/shoreline retreat increased with more western-dominant wave directions, as was the case in the last year. For the 5-year periods, the wave roses seemed rather similar (as could be expected for such a long period), but the WNW component was higher for the second 5-year period than for the first.
In general, more exposed segments (e.g., segments 17, 19, 31; Figure 5) showed frequent sediment loss and shoreline retreat, yet many apparently protected (embayed) segments retreated too (e.g., 18, 20, 23). This may have been due to wave diffraction. The main wave crest orientation was from the NW, inducing a drift current from north to south, which was in some areas inverted due to the presence of obstacles that promoted wave diffraction, causing downdrift erosion. Shoreline retreat was also found downdrift the Canide groyne, which is a typical effect of these structures that are intended to trap sediments in updrift areas. However, even the segments above the groyne did retreat, though less than those downdrift. Segments north (39, 40), as well as south, of the Aguda breakwater (43, 44) moved from accretional during the first years of the survey series to erosional during the last 5 years. This may have been due to changes in wave action, as explained above, but also due to sand beach management operations that removed sediments from north of the breakwater to nourish the beaches of the city Espinho in the south.
There were two flood events in the Douro river during the study period, one in February 2010 and another in March 2018, with peak river flows of more than 6000 m3/s and 4000 m3/s, respectively. These may have affected longshore sediment transport to the sectors south of the river outlet, as the periods comprising these flood events showed consistent erosion in the intermediate segments (16–25) of the study area. However, a detailed hydrodynamic analysis would be needed to confirm this hypothesis.
An interesting issue was that volumetric changes did not always correspond to shoreline dynamics, suggesting sediment transport from the beach to the dunes. There are different modes of beach dynamics—shoreline advance/retreat (translation modes) and beach steepening/flattening (rotation modes)—that can occur simultaneously and are often linked to sediment redistribution within the beach–dune system [50]. For instance, segments 39 and 40 (located to the north of the Aguda breakwater) presented shoreline regression and stability (−6.1 m and −0.2 m, respectively) but volume stability and accretion (2.1 m3/m and 265.4 m3/m, respectively) for the decade. Simultaneously, a steepening in the profiles was observed, with the beach slope increasing from 6.5 to 7.7° and from 3.7 to 6.6°, respectively. Notice that the enormous difference in volume in segment 40 was also due to the beach width. Larger segments will have more surface and hence the capacity to present larger sediment budgets.

5. Conclusions

Concluding, despite the limitations of the data time series, the present study demonstrated how local conditions interact with meteo-ocean conditions in shaping local morpho-sedimentary dynamics, stressing the need for local approaches to monitoring and erosion risk analyses. Dynamics varied markedly in space, with patterns depending on beach type and exposure, as well as on the presence of coastal defence structures that alter local hydrodynamics and, therefore, sediment transport and deposition.
The analysed coastal stretch suffered an average 1.6 m retreat of its shoreline in a decade with a slight increase in its volume (0.6%). However, analyses of shorter periods (annual and five years) revealed greater shoreline retreat and sediment budget values, demonstrating the high temporal dynamics of this coastal stretch and stressing the need for longer monitoring periods (more than 10 years) to assess the main trends of coastal morphodynamics.
Although the studied stretch seemed to be rather stable in the medium term (decade), the northwest coast of Portugal has been suffering from a scarce sediment input and a high-energy wave climate, which turns this coast into one of the most active in terms of sediment transport fluxes. If a projected mean sea-level rise of the order of 1 m by 2100 is confirmed, shoreline retreat will become a major problem in the next few decades.
Coastal management should therefore be based on structural monitoring programs, with surveys at adequate temporal and spatial scales to understand local dynamics and to be able to apply adequate erosion mitigation measures in the right places. Furthermore, given that many coastal systems show sediment deficits, mainly due to anthropogenic interventions in rivers, such as dams, and sediment extraction, sediment budgets should play a central role in the development of coastal defence strategies.

Author Contributions

Conceptualization, H.G., J.P. and A.B.; methodology, A.B., J.A.G. and J.P.; software, J.A.G. and A.B.; validation, J.A.G.; formal analysis, J.A.G., A.B. and I.I.; investigation, H.G., J.P., J.A.G., A.B. and I.I.; resources, H.G., J.P. and J.A.G.; data curation, J.A.G.; writing—original draft preparation, A.B.; writing—review and editing, A.B., J.A.G., I.I., H.G., J.P. and L.B.; visualization, A.B.; supervision, L.B.; project administration, H.G., J.P., L.B. and A.B.; funding acquisition, H.G., J.P., L.B. and A.B. All authors have read and agreed to the published version of the manuscript.

Funding

This research was partially supported by the Strategic Funding UIDB/04423/2020 and UIDP/04423/2020 through national funds provided by the FCT—Foundation for Science and Technology and European Regional Development Fund (ERDF). This work was further funded by the projects ATLANTIDA (ref. NORTE-01-0145-FEDER-000040) and Ocean3R (ref. NORTE-01-0145-FEDER-000064), both of which were supported by the North Portugal Regional Operational Programme (NORTE2020) under the PORTUGAL 2020 Partnership Agreement and through the European Regional Development Fund (ERDF).

Institutional Review Board Statement

Not applicable.

Informed Consent Statement

Not applicable.

Acknowledgments

Data were supplied by the European Union MarRISK project: Adaptación costera ante el Cambio Climático: conocer los riesgos y aumentar la resiliencia (0262_MarRISK_1_E) through EP INTERREG V A España-Portugal (POCTEP) program and the project INNOVMAR-Innovation and Sustainability in the Management and Exploitation of Marine Resources (NORTE-01-0145-FEDER-000035, within Research Line ECOSERVICES), supported by NORTE 2020, under the PORTUGAL 2020 Partnership Agreement, through the ERDF.

Conflicts of Interest

The authors declare no conflict of interest.

References

  1. Nel, R.; Campbell, E.E.; Harris, L.; Hauser, L.; Schoeman, D.S.; McLachlan, A.; du Preez, D.R.; Bezuidenhout, K.; Schlacher, T.A. The status of sandy beach science: Past trends, progress, and possible futures. Estuar. Coast. Shelf Sci. 2014, 150, 1–10. [Google Scholar] [CrossRef]
  2. Newton, A.; Weichselgartner, J. Hotspots of coastal vulnerability: A DPSIR analysis to find societal pathways and responses. Estuar. Coast. Shelf Sci. 2014, 140, 123–133. [Google Scholar] [CrossRef]
  3. Jones, A.; Phillips, M. Disappearing Destinations: Climate Change and Future Challenges for Coastal Tourism; CABI: Oxfordshire, UK, 2010; p. 273. [Google Scholar]
  4. Lobeto, H.; Menendez, M.; Losada, I.J. Future behavior of wind wave extremes due to climate change. Sci. Rep. 2021, 11, 7869. [Google Scholar] [CrossRef] [PubMed]
  5. Syvitski, J.P.M.; Vörösmarty, C.J.; Kettner, A.J.; Green, P. Impact of humans on the flux of terrestrial sediment to the global coastal ocean. Science 2005, 308, 376–380. [Google Scholar] [CrossRef] [PubMed]
  6. European Communities. Living with Coastal Erosion in Europe–Sediment and Space for Sustainability; Office for Official Publications of the European Communities: Luxembourg, 2004. [Google Scholar]
  7. Pollard, J.A.; Spencer, T.; Brooks, S.M. The interactive relationship between coastal erosion and flood risk. Prog. Phys. Geogr. 2019, 43, 574–585. [Google Scholar] [CrossRef] [Green Version]
  8. Vousdoukas, M.I.; Ranasinghe, R.; Mentaschi, L.; Plomaritis, T.A.; Athanasiou, P.; Luijendijk, A.; Feyen, L. Sandy coastlines under threat of erosion. Nat. Clim. Chang. 2020, 10, 260–263. [Google Scholar] [CrossRef]
  9. Antunes, C. Assessment of sea level rise at West Coast of Portugal Mainland and its projection for the 21st century. J. Mar. Sci. Eng. 2019, 7, 61. [Google Scholar] [CrossRef] [Green Version]
  10. Turner, R.K.; Burgess, D.; Hadley, D.; Coombes, E.; Jackson, N. A cost-benefit appraisal of coastal managed realignment policy. Glob. Environ. Chang. 2007, 17, 397–407. [Google Scholar] [CrossRef]
  11. Williams, A.T.; Rangel-Buitrago, N.; Pranzini, E.; Anfuso, G. The management of coastal erosion. Ocean Coast. Manag. 2018, 156, 4–20. [Google Scholar] [CrossRef]
  12. Lima, M.; Coelho, C.; Veloso-Gomes, F.; Roebeling, P. An integrated physical and cost-benefit approach to assess groins as a coastal erosion mitigation strategy. Coast. Eng. 2020, 156, 103614. [Google Scholar] [CrossRef]
  13. Rangel-Buitrago, N.; Williams, A.T.; Anfuso, G. Hard protection structures as a principal coastal erosion management strategy along the Caribbean coast of Colombia. A chronicle of pitfalls. Ocean Coast. Manag. 2018, 156, 58–75. [Google Scholar] [CrossRef]
  14. Stronkhorst, J.; Huisman, B.; Giardino, A.; Santinelli, G.; Santos, F.D. Sand nourishment strategies to mitigate coastal erosion and sea level rise at the coasts of Holland (The Netherlands) and Aveiro (Portugal) in the 21st century. Ocean Coast. Manag. 2018, 156, 266–276. [Google Scholar] [CrossRef]
  15. Granja, H.; Bastos, L.; Pinho, J.; Gonçalves, J.; Henriques, R.; Bio, A.; Magalhães, A. Small Harbours Risks: Lowering for Fishery and Increasing Erosion. The Case of Portinho da Aguda (NW Portugal); Littoral 2010; EDP Sciences: Les Ulis, France, 2011; p. 09003. [Google Scholar] [CrossRef] [Green Version]
  16. Vieira, B.F.V.; Pinho, J.L.S.; Barros, J.A.O.; Antunes do Carmo, J.S. Hydrodynamics and morphodynamics performance assessment of three coastal protection structures. J. Mar. Sci. Eng. 2020, 8, 175. [Google Scholar] [CrossRef] [Green Version]
  17. Semeoshenkova, V.; Newton, A. Overview of erosion and beach quality issues in three Southern European countries: Portugal; Spain and Italy. Ocean Coast. Manag. 2015, 118, 12–21. [Google Scholar] [CrossRef]
  18. Marinho, B.; Coelho, C.; Hanson, H.; Tussupova, K. Coastal management in Portugal: Practices for reflection and learning. Ocean Coast. Manag. 2019, 181, 104874. [Google Scholar] [CrossRef]
  19. Guillén, J.; Stive, M.J.F.; Capobianco, M. Shoreline evolution of the Holland coast on a decadal scale. Earth Surf. Process. Landf. 1999, 24, 517–536. [Google Scholar] [CrossRef]
  20. Van Rijn, L.C. Coastal erosion and control. Ocean Coast. Manag. 2011, 54, 867–887. [Google Scholar] [CrossRef]
  21. Casella, E.; Rovere, A.; Pedroncini, A.; Stark, C.P.; Casella, M.; Ferrari, M.; Firpo, M. Drones as tools for monitoring beach topography changes in the Ligurian Sea (NW Mediterranean). Geo-Mar. Lett. 2016, 36, 151–163. [Google Scholar] [CrossRef]
  22. Lemke, L.; Miller, J.K. Role of storm erosion potential and beach morphology in controlling dune erosion. J. Mar. Sci. Eng. 2021, 9, 1428. [Google Scholar] [CrossRef]
  23. Hinestroza-Mena, K.M.; Toro, V.G.; Londoño-Colorado, G.S.; Chávez, V.; García-Blanco, J.K.; Silva, R. Fine spatial scale, frequent morphological monitoring of urbanised beaches to improve coastal management. J. Mar. Sci. Eng. 2021, 9, 550. [Google Scholar] [CrossRef]
  24. Flor-Blanco, G.; Alcántara-Carrió, J.; Jackson, D.W.T.; Flor, G.; Flores-Soriano, C. Coastal erosion in NW Spain: Recent patterns under extreme storm wave events. Geomorphology 2021, 387, 107767. [Google Scholar] [CrossRef]
  25. Ferreira, A.M.; Coelho, C. Artificial nourishments effects on longshore sediments transport. J. Mar. Sci. Eng. 2021, 9, 240. [Google Scholar] [CrossRef]
  26. Murray, T.; Strauss, D.; Da Silva, G.V.; Wharton, C. Spatial variability in beach morphology with respect to wave exposure along a zeta-shaped coastline. In Proceedings of the 9th International Conference on Coastal Sediments 2019, Tampa/St. Petersburg, FL, USA, 27–31 May 2019; pp. 632–645. [Google Scholar] [CrossRef]
  27. Vieira Da Silva, G.; Murray, T.; Strauss, D. Longshore wave variability along non-straight coastlines. Estuar. Coast. Shelf Sci. 2018, 212, 318–328. [Google Scholar] [CrossRef]
  28. Bauer, B.O.; Davidson-Arnott, R.G.D.; Walker, I.J.; Hesp, P.A.; Ollerhead, J. Wind direction and complex sediment transport response across a beach-dune system. Earth Surf. Process. Landf. 2012, 37, 1661–1677. [Google Scholar] [CrossRef]
  29. Sloss, C.R.; Hesp, P.; Shepherd, M. Coastal Dunes: Aeolian Transport. Nat. Educ. Knowl. 2012, 3, 21. Available online: https://www.nature.com/scitable/knowledge/library/coastal-dunes-aeolian-transport-88264671/ (accessed on 15 April 2022).
  30. Bauer, B.O.; Davidson-Arnott, R.G.D.; Hesp, P.A.; Namikas, S.L.; Ollerhead, J.; Walker, I.J. Aeolian sediment transport on a beach: Surface moisture, wind fetch, and mean transport. Geomorphology 2009, 105, 106–116. [Google Scholar] [CrossRef]
  31. Bio, A.; Bastos, L.; Granja, H.; Pinho, J.L.S.; Goncalves, J.A.; Henriques, R.; Madeira, S.; Magalhaes, A.; Rodrigues, D. Methods for coastal monitoring and erosion risk assessment: Two Portuguese case studies. J. Integr. Coast. Zone Manag. 2015, 15, 47–63. [Google Scholar] [CrossRef] [Green Version]
  32. Taveira Pinto, F. The practice of coastal zone management in Portugal. J. Coast. Conserv. 2004, 10, 147–158. [Google Scholar] [CrossRef]
  33. APA; ARH Norte; ARH Centro; ARH Tejo e Oeste; ARH Alentejo; ARH Algarve. Plano de Ação Litoral XXI; Agência Portuguesa do Ambiente: Amadora, Portugal, 2017; pp. 1–128.
  34. Pinto, C.A.; Silveira, T.M.; Teixeira, S.B. Beach nourishment practice in mainland Portugal (1950–2017): Overview and retrospective. Ocean Coast. Manag. 2020, 192, 105211. [Google Scholar] [CrossRef]
  35. Cruz, J. Ocean Wave Energy: Current Status and Future Perspectives; Green Energy and Technology; Springer: Berlin/Heidelberg, Germany, 2008. [Google Scholar] [CrossRef]
  36. Viitak, M.; Avilez-Valente, P.; Bio, A.; Bastos, L.; Iglesias, I. Evaluating wind datasets for wave hindcasting in the NW Iberian Peninsula coast. J. Oper. Oceanogr. 2021, 14, 152–165. [Google Scholar] [CrossRef]
  37. Relvas, P.; Barton, E.D.; Dubert, J.; Oliveira, P.B.; Peliz, Á.; da Silva, J.C.B.; Santos, A.M.P. Physical oceanography of the western Iberia ecosystem: Latest views and challenges. Prog. Oceanogr. 2007, 74, 149–173. [Google Scholar] [CrossRef] [Green Version]
  38. Benavent, M.; Arnoso, J.; Montesinos, F.G. Regional ocean tide loading modelling around the Iberian Peninsula. J. Geodyn. 2009, 48, 132–137. [Google Scholar] [CrossRef]
  39. Lorenzo, M.N.; Taboada, J.J.; Gimeno, L. Links between circulation weather types and teleconnection patterns and their influence on precipitation patterns in Galicia (NW Spain). Int. J. Climatol. 2008, 28, 1493–1505. [Google Scholar] [CrossRef]
  40. Ramos, A.M.; Ramos, R.; Sousa, P.; Trigo, R.M.; Janeira, M.; Prior, V. Cloud to ground lightning activity over Portugal and its association with circulation weather types. Atmos. Res. 2011, 101, 84–101. [Google Scholar] [CrossRef]
  41. Gonçalves, J.; Bastos, L.; Pinho, J.; Granja, H. Digital aerial photography to monitor changes in coastal areas based on direct georeferencing. In Proceedings of the 5th EARSeL Workshop on Remote Sensing of the Coastal Zone, Prague, Czech Republic, 1–3 June 2011; Available online: http://www.conferences.earsel.org/abstract/show/2689 (accessed on 12 June 2014).
  42. Gonçalves, J.A.; Bastos, L.; Madeira, S.; Magalhães, A.; Bio, A. Three-dimensional data collection for coastal management–efficiency and applicability of terrestrial and airborne methods. Int. J. Remote Sens. 2018, 39, 9380–9399. [Google Scholar] [CrossRef]
  43. Agisoft LLC. Agisoft Metashape User Manual Professional Edition, Version 1.8; Agisoft Metashape: 2022. Available online: https://www.agisoft.com/pdf/metashape-pro_1_8_en.pdf (accessed on 15 April 2022).
  44. Muñoz Sabater, J. ERA5-Land Hourly Data from 1981 to Present; Copernicus Climate Change Service (C3S) Climate Data Store (CDS): Sherfield, UK, 2019. [Google Scholar] [CrossRef]
  45. Gualtieri, G. Reliability of era5 reanalysis data for wind resource assessment: A comparison against tall towers. Energies 2021, 14, 4169. [Google Scholar] [CrossRef]
  46. Douglas, D.H.; Peucker, T.K. Algorithms for the reduction of the number of points required to represent a digitized line or its caricature. Cartogr. Int. J. Geogr. Inf. Geovis. 1973, 10, 112–122. [Google Scholar] [CrossRef] [Green Version]
  47. Dodet, G.; Castelle, B.; Masselink, G.; Scott, T.; Davidson, M.; Floc’h, F.; Jackson, D.; Suanez, S. Beach recovery from extreme storm activity during the 2013–14 winter along the Atlantic coast of Europe. Earth Surf. Process. Landf. 2019, 44, 393–401. [Google Scholar] [CrossRef] [Green Version]
  48. Nicolae-Lerma, A.; Ayache, B.; Ulvoas, B.; Paris, F.; Bernon, N.; Bulteau, T.; Mallet, C. Pluriannual beach-dune evolutions at regional scale: Erosion and recovery sequences analysis along the Aquitaine coast based on airborne LiDAR data. Cont. Shelf Res. 2019, 189, 103974. [Google Scholar] [CrossRef]
  49. Murray, A.; Asthon, A. Instability and finite-amplitude self-organization of large-scale coastline shapes. Philos. Trans. R. Soc. A 2013, 371, 20120363. [Google Scholar] [CrossRef]
  50. Montaño, J.; Coco, G.; Chataigner, T.; Yates, M.; Le Dantec, N.; Suanez, S.; Cagigal, L.; Floc’h, F.; Townend, I. Time-Scales of a Dune-Beach System and Implications for Shoreline Modeling. J. Geophys. Res. Earth Surf. 2021, 126, e2021JF006169. [Google Scholar] [CrossRef]
Figure 1. The Vila Nova de Gaia coast (left panel) and its location in Northern Portugal (red rectangle), and closeups of the rocky sector in the North (a), the groyne at Praia de Canide (b) and the breakwater at Aguda beach (c) (image: GoogleEarth, Data SIO, NOAA, U.S. Navy, NGA, GEBCO).
Applsci 12 04365 g001
Figure 2. Significant wave heights (Hs) measured at the Leixões wave buoy and estimated wind velocities for the study area during the study period; survey dates are marked with red vertical lines.
Applsci 12 04365 g002
Figure 3. Distribution of 3-hourly wave directions for three significant-wave-height classes (left plots) and of hourly wind directions for three velocity classes (right plots) for the last decade and the two 5-year periods.
Applsci 12 04365 g003
Figure 4. Distribution of 3-hourly wave directions for three significant-wave-height classes (left plots) and of hourly wind directions for three velocity classes (right plots) for the three yearly periods.
Applsci 12 04365 g004
Figure 5. Distribution of 3-hourly wave directions for three significant-wave-height classes (left plots) and hourly wind directions for three velocity classes (right plots) for the 3 seasons monitored (from top to bottom: winter, summer, winter).
Applsci 12 04365 g005
Figure 6. Scheme of the adopted procedure, where digital elevation models (DEMs) and the digital terrain model (DTM) were analysed in terms of the spatial and temporal morphodynamics, which were subsequently related to local features and wave and wind patterns.
Applsci 12 04365 g006
Figure 7. Segmentation of the coastal stretch for local analysis (only part of the stretch is shown): November 2008 DEM (a); contours (1 m above MSL contour in red) (b); and the simplified contour line (in black) providing the segments used for analysis, with their length and facing direction (c).
Applsci 12 04365 g007
Figure 8. Orthomosaic of the aerial photographs, with the analysed coastal segments (simplified 1 m isoline in red, segments labelled with their ID numbers) and the delimitation of the beach–dune system (yellow line); segment 14 marks the Canide groyne, segments 41 and 42 mark the Aguda breakwater.
Applsci 12 04365 g008
Figure 9. Decadal and 5-yearly changes in volume and shoreline position per segment, presented from north (segment 1) to south (segment 52); segment IDs are presented below the graphs; positive shoreline change values represent seaward migration and negative values represent landward migration.
Applsci 12 04365 g009
Figure 10. Yearly changes in volume and shoreline position per segment, presented from north (segment 1) to south (segment 52); segment IDs are presented below the graphs; positive shoreline change values represent seaward migration and negative values represent landward migration.
Applsci 12 04365 g010
Figure 11. Seasonal changes in volume and shoreline position per segment, presented from north (segment 1) to south (segment 52); segment IDs are presented below the graphs; positive shoreline change values represent seaward migration and negative values represent landward migration.
Applsci 12 04365 g011
Figure 12. Decadal and 5-yearly changes in volume and shoreline position per segment presented according to segment orientation and marked according to the segment type or its location (N-Aguda: segment 40 north of the Aguda breakwater, S-Aguda: segments 43 and 44 south of the Aguda breakwater, N-groyne: segment 13 north of the groyne, S-groyne: segment 15 south of the groyne).
Applsci 12 04365 g012
Figure 13. Yearly changes in volume and shoreline position per segment presented according to the segment orientation and marked according to the segment type or its location (N-Aguda: segment 40 north of the Aguda breakwater, S-Aguda: segments 43 and 44 south of the Aguda breakwater, N-groyne: segment 13 north of the groyne, S-groyne: segment 15 south of the groyne).
Applsci 12 04365 g013
Figure 14. Seasonal changes in volume and shoreline position per segment presented according to segment orientation and marked according to the segment type or its location (N-Aguda: segment 40 north of the Aguda breakwater, S-Aguda: segments 43 and 44 south of the Aguda breakwater, N-groyne: segment 13 north of the groyne, S-groyne: segment 15 south of the groyne).
Applsci 12 04365 g014
Table 1. Changes in volume of the beach–dune system and in the shoreline position (positive and negative values indicate seaward and landward movements, respectively) that were observed between subsequent surveys (upper rows), and for the yearly, 5-yearly and the decadal periods of the time series analysed.
DatesPeriod∆ Volume (m3)∆ Shoreline (m)
November 2008–April 2009Season: winter223,094+2.9%2.7
April 2009–November 2009Season: summer108,848+1.4%0.7
November 2009–May 2010Season: winter−6889−0.1%1.2
May 2010–June 2014 −54,483−0.7%−0.4
June 2014–May 2018 90,9811.2%−3.3
May 2018–February 20191 year (approx.)−89,372−1.1%0.2
November 2008–November 20091 year331,942+4.4%3.3
April 2009–May 20101 year101,959+1.3%1.9
April 2009–June 20145 years47,476+0.6%1.5
June 2014–February 20195 years16080.0%−3.1
April 2009–February 2019Decade49,084+0.6%−1.6
Publisher’s Note: MDPI stays neutral with regard to jurisdictional claims in published maps and institutional affiliations.

