Abstract
Earthquake damage to electrical systems degrades their performances and disrupts their normal functioning. Furthermore, it disrupts nuclear power plant (NPP) operations. NPPs in South Korea have been designed based on the Regulatory Guide 1.60 (RG 1.60) design spectra; however, the Gyeongju earthquakes in South Korea were of high frequency, with magnitudes of 5.1 and 5.8. Therefore, the seismic performances of electrical systems (high-frequency sensitive) must be evaluated to consider low- and high-frequency motions. In this study, to ensure the operation of NPPs in South Korea, the seismic performance and dynamic characteristics of the battery charger (BC) in the electrical subsystem were evaluated experimentally. Seismic tests of the BC were performed to consider low frequencies, high frequencies and a combination of both. The dynamic characteristics of the inside and outside of the cabinet, depending on the input motions, were evaluated and compared based on the tests. Moreover, the acceptance criteria for relay contact chatter were evaluated using the measured output signal during the seismic tests. From seismic test results, the peak acceleration of CRS at the top location (A6) was 1.31 times larger than that of UHS and 1.51 times than that of RG 1.60 and it increased rapidly with increasing PGA levels. Contact chatter was not observed under a peak acceleration of 3.4 g on the installed relay of the panel; however, the relay chatter for more than 2 ms dropped below the reference voltage 46 times. The major components of the electric cabinet were significantly affected by high-frequency motion.
1. Introduction
Nuclear power plants (NPPs) in South Korea have been designed according to the U.S. NRC Regulatory Guide 1.60 (RG 1.60) design spectrum or low-frequency motion with a similar spectrum based on a modified spectrum where the peak frequency range is 2–10 Hz [1]. RG 1.60 could be modified depending on the adapted peak ground acceleration (PGA) at the seismic zone of the NPP. However, the characteristics at the Korea NPP sites are different from those in the western United States on which the RG 1.60 is based. The recent Gyeongju earthquakes in South Korea had a lower amplification at a low-frequency range and a higher amplification at a high-frequency range [2].
The structural members of NPPs were designed to withstand earthquake motions; however, the equipment attached to the structural members is generally sensitive to earthquakes, including low- and high-frequency motions. The importance of equipment safety when operating NPPs and the type of failure modes have been reported for sensitive equipment or components, such as contact chatter, change in the output signal, and electrical connection discontinuity [3]. The qualification of sensitive equipment or components was conducted for in-structure or in-cabinet motions consistent with the safe shutdown earthquake (SSE) defined for each plant. In addition, the qualification of the electrical system must be evaluated to consider low- and high-frequency motions because of the design spectrum and high-frequency effects.
The electrical equipment in NPPs is generally installed in a cabinet, and the seismic performance of the cabinet is evaluated by numerical analysis and a shaking-table test [4,5,6,7,8]. Rustogi et al. [4] suggested to evaluate not only the validity of finite element analysis results but also the premise for developing the Ritz vector approach based on the shake table test results of two different cabinets. Ries et al. [5], Jeon et al. [6] and Cho et al. [7] compared seismic behavior prediction for a safety-related electrical cabinet and finite element analysis. Son et al. [8] evaluated seismic demands of the electrical cabinet under high-frequency earthquakes and also seismic qualification of the electrical cabinet using the identification of experimental tests and numerical models. Tran et al. [9] proposed an approach for collapse risk assessment depending on the evaluated vulnerability of electric cabinets in nuclear power plants. However, it is difficult to evaluate the dynamic characteristics of an electrical cabinet because of the various sizes and shapes of the NPPs. Jeon et al. [6], Kim et al. [10] and Chang et al. [11] performed seismic qualifications of electrical equipment under low- and high-frequency motions by seismic tests according to the cabinet type. However, it has not been evaluated for contact chatter under a seismic qualification that can be used to evaluate the contact chatter of sensitive components in NPPs.
Richards et al. [12] summarizes the types of components evaluated in the test program, the test methods investigated within the program, and the results of seismic testing performed on a diverse group of 153 components using high-frequency input motions. Tseng et al. [13] monitored the functionality of test items with normally open contacts during seismic tests depending on virous input levels. The critical characteristics of a relay, such as configuration, pick-up/drop-out voltage, voltage rating, current rating, chatter and response time, were monitored. In the equipment fragility test, a nonconformance report was generated when the function failure of the equipment did not occur because of the contact chatter of the relay component. However, the contact chatter of the relay under the fragility test of a component was a significant indicator of the performance requirements for electric components.
A battery charger (BC) was installed to supply a charging current to the inverter and the battery that supplies safety and non-safety loads at the NPP. Failure of the BC should not directly affect the operation and safety of the NPPs; however, five BC malfunction events were reported, and the failure mode was defined as a loss of function [14].
Therefore, in this study, the seismic performance and dynamic characteristics of a BC in the electrical subsystem were examined to identify and investigate quantifiably the operation of NPPs in South Korea, where low frequency (design spectrum, RG 1.60), high frequency (uniform hazard spectrum, UHS), and a combination of both (CRS) were chosen and examined because of their different dynamic characteristics and their effects on the electrical equipment. Thus, seismic tests were conducted for the RG 1.60, UHS, and CRS motions. The in-cabinet (electrical component) and in-structure amplification and peak acceleration were compared depending on the input motions. Functional tests were conducted to measure the rated voltage of the relay during seismic testing. The acceptance criteria for relay contact chatter were evaluated in accordance with the IEEE standard.
2. Test Specimen and Test Conditions
2.1. Test Specimen
The onsite DC power system includes the DC power sources and their distribution systems and auxiliary supporting systems that are provided to supply motive or control power to safety-related and non-safety-related equipment. The BC serves as the power source for the DC power system, and inverters are used to convert DC power to AC power for instrumentation and control power, as required. When combined, these three components provide an uninterruptible power system that provides a continuous and reliable source of 120-V power.
The BC was manufactured to evaluate the structural response and electrical function. Table 1 and Figure 1 show the dimensions and shape of the tested BC. It exhibits the same capacity as those used in South Korean NPPs. To consider the response of the in-structure cabinet based on various input motions, three-dimensional accelerometers were installed to divide the height, as shown in Figure 2a. Figure 2b shows the evaluation of the in-cabinet response of the BC for major components, such as the electrical coil, circuit breaker, relay and fuse.

Table 1.
Description of BC cabinet.
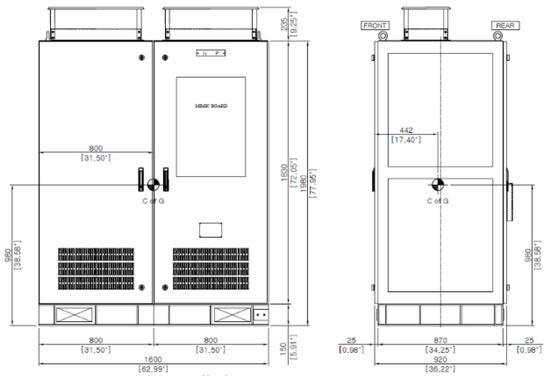
Figure 1.
Dimensions and shape of tested battery charger (units: mm).
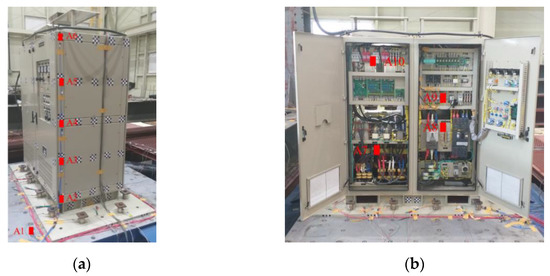
Figure 2.
Location of installed accelerometers: (a) in-structure cabinet and (b) in-cabinet response.
2.2. Seismic Test Condition
The BC was fixed by a jig through welding that was performed as at an NPP, and the jig was connected to a shaking table by bolts, as shown in Figure 3.
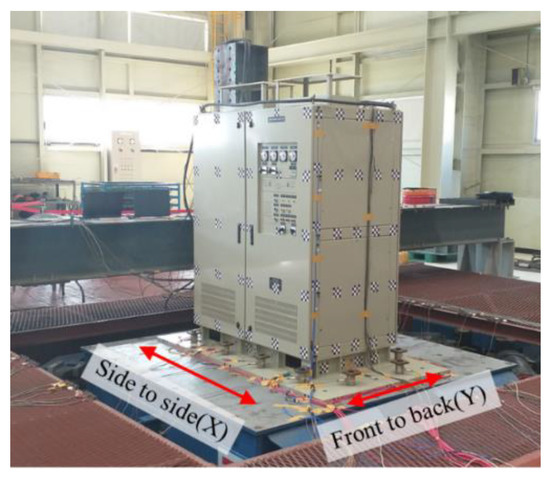
Figure 3.
Test setup.
2.2.1. Resonant-Frequency Test
To investigate the in-structure cabinet and in-cabinet resonant frequencies with major components before and after the seismic tests, resonant-frequency tests were conducted. They were performed for 60 s with a random wave up to a root mean square of 0.1 g and with a frequency range of 0.5–50.0 Hz.
2.2.2. Seismic Test
To evaluate the seismic performance of the BC, three seismic input motions were used. The first was high-frequency motion based on the South Korean NPP site-specific uniform hazard spectrum (UHS) in Uljin [15]. The second was a low-frequency motion based on the RG 1.60 design spectrum. The UHS and RG 1.60 spectrum were generated to obtain the floor response spectra for an auxiliary building at NPP PAB 100′. This was based on a series of time-domain dynamic analyses of the finite-element models of the building and foundation soil.
To consider the effects of the design response spectrum and uniform hazard spectrum, the CRS spectrum shape was defined based on the average of the response spectra of each floor for an auxiliary building. Its spectrum was obtained from the floor response spectra and used at a normalized ZPA of 1.0 g.
The acceleration response spectrum was computed from the measured acceleration time histories, and a 5% damping level was adopted. The acceleration response spectra for different input seismic motions are compared in Figure 4. The seismic tests were conducted on a three-dimensional shaking table from the 0.2 to 0.75 g PGA level following the sequence shown in Table 2. The test conditions were defined as 30 s of shaking time, 20 s of strong motion, and a frequency range of 1.0–60.0 Hz. The acceleration time histories of the three motions are shown in Figure 5.
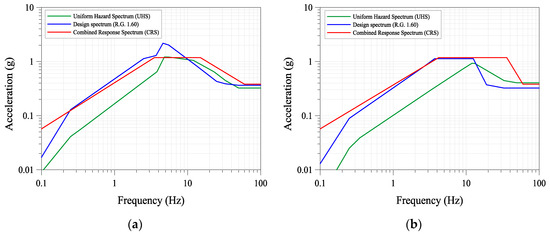
Figure 4.
Acceleration comparison for different seismic response spectra: (a) side to side and front to back and (b) vertical.
Table 2.
Seismic test sequence.
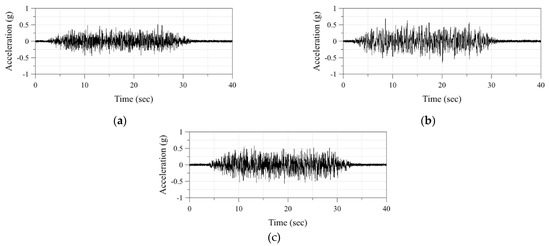
Figure 5.
Acceleration time history for front to back depending on input motions: (a) uniform hazard spectrum (UHS), (b) Regulatory Guide 1.60 design spectrum (RG 1.60), and (c) combined response spectrum (CRS).
3. Test Results of Shaking Table Test
3.1. Resonant-Frequency Test
To evaluate the dynamic characteristics of the BC, a resonant-frequency test was performed before and after the seismic tests. The resonant-frequency tests were conducted side to side, front to back, and in the vertical direction with accelerometers installed on the in-structure and in-cabinet. The resonant frequency is shown in the values of the transfer function for both, as summarized in Table 3, Table 4 and Table 5.
Table 3.
Summary of side-to-side resonant-frequency test.
Table 4.
Summary of front-to-back resonant-frequency test.
Table 5.
Summary of vertical-direction resonant-frequency test.
As a result of the resonance search tests, the selected points at the height of the cabinets and the major components were used to generate diagrams of the transfer functions. The transfer function is the ratio of the response accelerations to the input accelerations, as shown in Equation (1):
where Pyx is the cross-power spectral density of the signal input and output, and Pxx is the auto power spectral density of the input motion.
The in-structure and in-cabinet resonant frequencies were compared based on the installation location, as shown in Figure 6 and Figure 7. Figure 6 shows that the in-structure resonant frequencies are similar, regardless of the cabinet height from side to side and front to back.
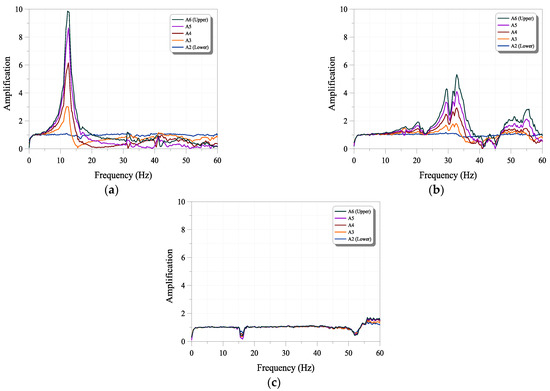
Figure 6.
Out-cabinet resonant-frequency test results: (a) side to side, (b) front to back, and (c) vertical.
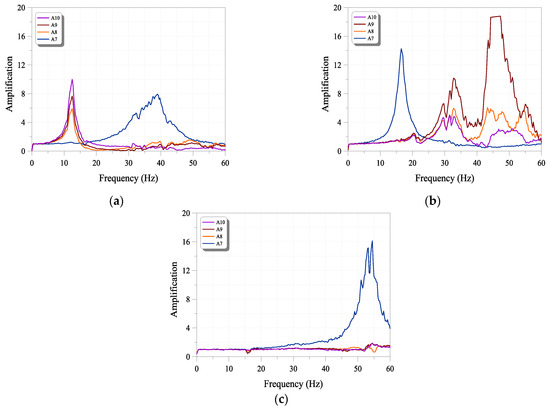
Figure 7.
In-cabinet resonant-frequency test results: (a) side to side, (b) front to back, and (c) vertical.
The resonant frequency of the in-cabinet component differed according to the installation location, weight, and fixing method, as shown in Figure 7. In the side-to-side and front-to-back directions, the resonant frequencies of the panel of the in-cabinet cases were similar to those of the in-structure cases, but the resonant frequency of A7 (electronic coil) was different because it was directly fixed on the bottom of the BC and had a large mass. In particular, the resonant frequency of A7 changed after the PGA 0.47 g seismic test. The release of the bolt connection was shown by the bracket of the electronic coil or as a cracked welded joint.
3.2. Seismic Test
The acceleration response spectrum was computed from the measured acceleration time histories, and a 5% damping level was adopted. The input motions were simultaneously applied in three orthogonal directions: side to side (X), front to back (Y), and in the vertical direction (Z). The acceleration response spectra for the different input seismic motions are compared in Figure 8. The test response spectrum has higher acceleration values than those of the required response spectrum.
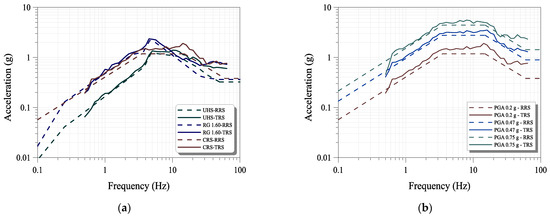
Figure 8.
Acceleration response spectrum of side-to-side seismic test: (a) SSE level and (b) acceleration response spectrum depending on PGA level.
4. Comparison of Response Depending on Input Motion
4.1. Structural-Response Evaluation
To evaluate the effect of the structural response of the BC under low- and high-frequency earthquake motions, the peak acceleration and amplification factor at each measured location were compared. The amplification factors were evaluated using a transfer function.
4.1.1. Peak Acceleration
Figure 9 shows the peak acceleration at each measured location depending on the input motion. In the case of the lowest position from the bottom to 1/4 the cabinet height under the PGA 0.2 g level in a side-to-side motion, the peak acceleration of RG 1.60 was larger than those of the UHS and CRS. However, their peak accelerations increased in the order of RG 1.60, UHS, and CRS from the center to the top of the cabinet. Those of the CRS at the top location (A6) were 1.31 times larger than those of the UHS and 1.51 times that of RG 1.60. The peak acceleration increased rapidly with the increasing PGA level. In particular, the peak acceleration of the CRS of PGA 0.75 g was 2.36 times larger than the CRS of PGA 0.47 g and 9.75 times larger than the CRS of PGA 0.2 g at the center of height on the cabinet.
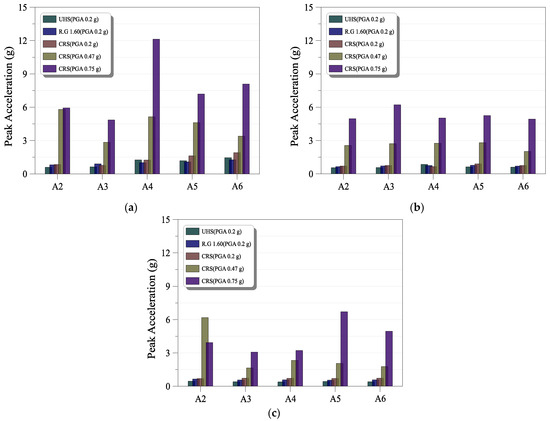
Figure 9.
Comparison of in-structure peak accelerations depending on input motion: (a) side to side, (b) front to back, and (c) vertical.
The peak acceleration from front to back exhibited a similar tendency to that of the side-to-side direction. Their peak accelerations increased in the order of UHS, RG 1.60, and CRS, regardless of A4. The vertical direction showed a similar tendency in the front-to-back direction.
4.1.2. Amplification Factor
To compare the amplification factors using the transfer function based on the input motion, the frequencies of the maximum amplification were evaluated at the nearby in-structure resonant frequency. Figure 10 shows the amplification of each frequency based on the seismic motion and input level. However, those of the top (A6) were changed after the 0.2 g PGA level—the in-structure of the cabinet exhibited nonlinear behavior.
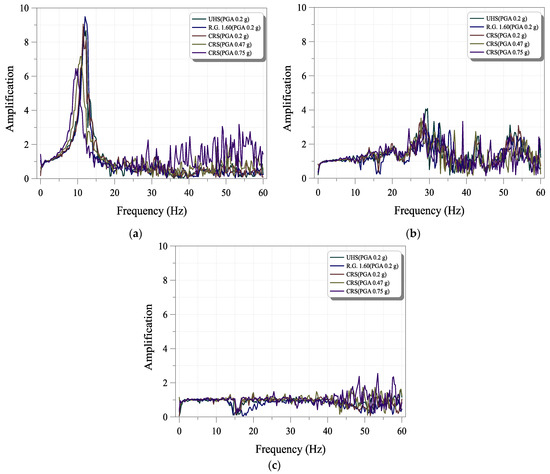
Figure 10.
Comparison of in-structure amplifications depending on input motion: (a) side to side, (b) front to back, and (c) vertical.
Figure 11 shows the relationship between the amplification factor and the peak acceleration for each input motion. The amplification factors of the front-to-back and vertical directions increased with an increase in the peak acceleration; however, those in the side-to-side direction decreased with an increase in the peak acceleration at motion.
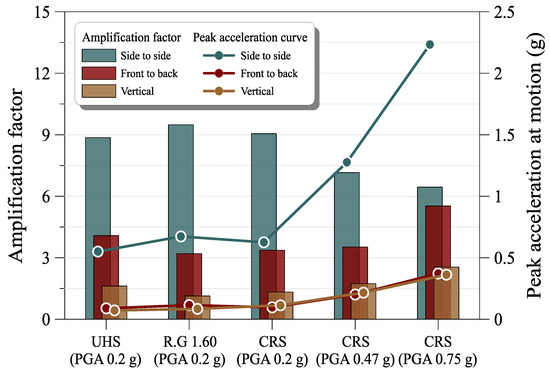
Figure 11.
Relationships of amplification factor and peak acceleration depending on input motion at A6 (top of cabinet).
4.2. In-Cabinet Response Evaluation
Dynamic amplifications of electric equipment have been reported in motor control centers and switchgear cabinets [16]; however, those of BC are ambiguous. In this study, to investigate the seismic demands of in-cabinet equipment, the peak acceleration and amplification factors were evaluated for major components, such as the air breaker, relay, fuse and coil. Generally, electro equipment is assembled as a steel panel type according to the weight, fixing method, and installation location.
4.2.1. Peak Acceleration
The peak accelerations of each in-cabinet component were compared based on the input motion, as shown in Figure 12.
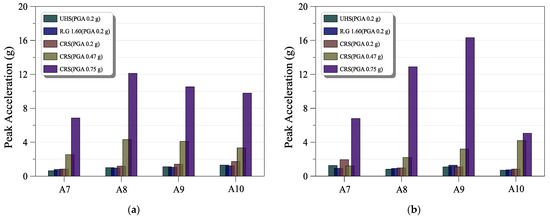
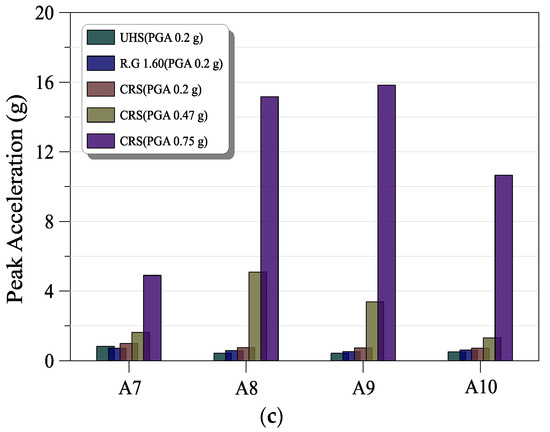
Figure 12.
Comparison of in-cabinet peak acceleration depending on input motion: (a) side to side, (b) front to back, and (c) vertical.
In the case of the PGA 0.2 g level in a side-to-side motion, the effects of low and high frequencies on the peak acceleration at each measured location indicated a tendency similar to that of the in-structure side-to-side because the strong axis of the steel panel with the assembled component was in the same direction as the in-structure one.
Meanwhile, the peak accelerations of the CRS at the air breaker (A8) and fuse (A10) were larger than those of the UHS and RG 1.60 in the front-to-back case, and they increased in the order of CRS, RG 1.60, and UHS. However, that of RG 1.60 at the relay (A8) was larger than those of the UHS and CRS. It is important to consider high and low frequencies for the safe operation of NPPs.
Comparing the peak acceleration of each component with the same input motion based on the 0.2 g PGA level, that of the relay (A9) was larger than those of the air breaker (A8) and fuse (A10). The peak acceleration increased rapidly with the PGA level; in particular, the peak acceleration of CRS (PGA 0.75 g) was 3.83 times larger than that of CRS (PGA 0.47 g) and 14.9 times larger than that of CRS (PGA 0.2 g) at the relay (A9). However, the peak acceleration of the coil (A7) increased in the order of 0.75, 0.2, and 0.47 g because of the plastic deformation of the mount with the coil. This demonstrates that the resonant frequency decreased rapidly after CRS (PGA 0.47 g) motion, as shown in Table 3, Table 4 and Table 5. The vertical direction showed a similar tendency from front to back.
4.2.2. Amplification Factor
From the test results, the amplification values were calculated at frequencies of 0.1–60 Hz to obtain the amplification spectrum and peak amplification factor. The frequency range was divided into 4–16, 16–40, and 40–60 Hz in accordance with the cutoff frequency. The peak amplification factor is defined as the maximum amplification at a specified in-cabinet location for a particular motion. The in-structure and in-cabinet amplification results based on the input motions are summarized in Table 6.
Table 6.
Amplification results of in-cabinet response based on input motion.
Figure 13 shows the in-cabinet acceleration amplification effects at the relay (A9). In the side-to-side case, the amplification tendency was similar, and the amplification effect was different compared to the in-structure one. The peak amplification was less than 16 Hz and was dominated by global cabinet behaviors; however, the peak amplification from front to back was larger than 40 Hz.
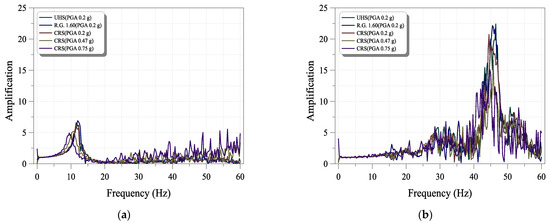
Figure 13.
Comparison of amplification based on input motion at A9 (relay): (a) side to side, (b) front to back, and (c) vertical.
Figure 14 shows the relationships between the amplification factor and peak acceleration of the input motion based on the PGA level. For an electric coil with a relatively heavy component, the correlation between the amplification factor of each direction and the peak acceleration of the input motion was extremely low. However, the amplification factor of the installed relay at the in-cabinet panel decreased with the increasing PGA level. This indicates that the major in-cabinet components were significantly affected by the high-frequency motion.
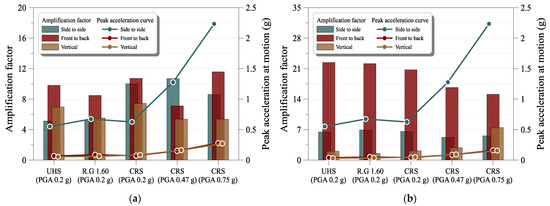
Figure 14.
Relationships of amplification and peak acceleration based on input motion: (a) A7 and (b) A9.
4.3. Output Signal of Relay
Each BC should possess sufficient capacity to perform the following tasks. First, the battery is maintained in a fully charged state during normal operation. Next, the battery is restored from a fully discharged condition to the minimum charged state within an acceptable time period while simultaneously supplying the highest combined demands of various steady-state loads and accident loads following the loss of normal power.
The representative components in operating NPPs, such as relays, contacts, switches and similar devices, were tested using high-frequency seismic motions [12]. The safety-related relays for NPPs were formally qualified by shaking-table tests in accordance with IEEE Std. C37.98 [17]. However, it was difficult to apply the available seismic qualification test data and actual earthquake experience (high-frequency earthquake) data to a wide variety of relay types because the protective and auxiliary relays were mounted in a specific cabinet or panel arrangement. Therefore, even a small change in chatter with a relay might cause significant damage to the plant.
In this study, to evaluate relay chatter during an earthquake, the voltage of the relay at the mounted panel of the cabinet was measured using a 19,200 sampling rate, and it was found to change during each seismic test. The measured times of the contact chatter signal and acceleration time history were not synchronized owing to the limitations of the measuring system. However, time synchronization was conducted by calibration after seismic testing.
The relay voltage changed only the CRS (PGA 0.75 g) motion. Figure 15 shows a comparison of the relay chatter and acceleration response based on the input motion at the mounted panel of the cabinet. Changes were observed during the period of strong motion. IEEE C37.98 defines relay contact chatter as unauthorized intermittent closure or the opening of contacts. An unauthorized change of state equal to or greater than 2 ms constitutes a failure. The 2 ms contact chatter duration is readily established by measuring the time between when the voltage decreases below the reference voltage and when the voltage returns to the reference voltage.
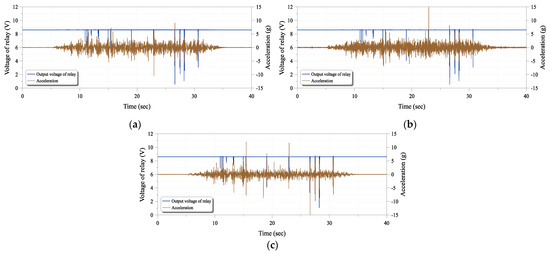
Figure 15.
Comparison of relay chatter and acceleration response during CRS (PGA 0.75 g): (a) side to side, (b) front to back, and (c) vertical.
Figure 16 shows the decrease below the reference voltage for 0.1 s in the CRS (PGA 0.75 g) case, where seven pulses occur. Chatter durations of less than 2 ms were evaluated when the voltage was changed within 50%. Figure 17 shows the frequency distribution of the contact chatter when the voltage decreased to a value below the reference voltage. The relay chatter for more than 2 ms dropped below the reference voltage 46 times and was evaluated in 10 cases.
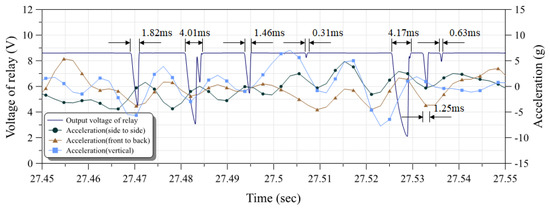
Figure 16.
Single chatter recorded on relay contact during CRS (PGA 0.75 g).
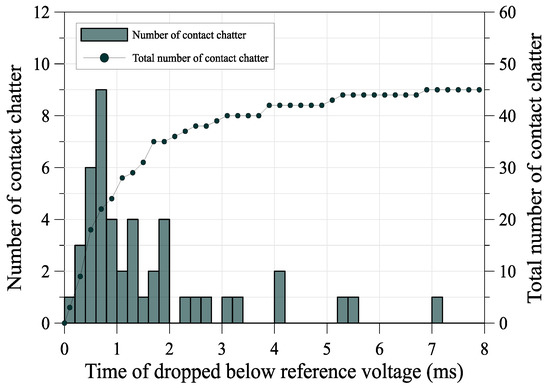
Figure 17.
Contact chatter numbers when voltage decreased to below the reference voltage.
5. Conclusions
The seismic performance and dynamic characteristics of the BC were evaluated using a shaking-table test to ensure the operation of NPPs in South Korea. Seismic tests of the BC were performed to consider low frequency (RG 1.60), high frequency (UHS), and a combination of both (CRS). From the tests, the in-structure and in-cabinet dynamic characteristics were evaluated and compared depending on the input motions.
The peak in-structure accelerations increased in the order of RG 1.60, UHS, and CRS from the center to the top of the cabinet. That of CRS at the top location (A6) was 1.31 times larger than that of UHS and 1.51 times than that of RG 1.60. The peak acceleration increased rapidly with increasing PGA levels. The amplification of the top in-structure location (A6) changed after the 0.2 g PGA level. Nonlinear behavior was exhibited for the in-structure of the cabinet. Comparing the peak accelerations of the components for the same input motion at the 0.2 g PGA level, that of the relay (A9) was larger than those of the air breaker (A8) and fuse (A10). The peak amplification was less than 16 Hz and was dominated by global cabinet behaviors; however, the peak amplification from front to back was larger than 40 Hz. That of the installed relay at the panel of the in-cabinet decreased with an increasing PGA level. It was demonstrated that the major in-cabinet components were significantly affected by high-frequency motion. The acceptance criteria for relay contact chatter were evaluated using the measured output signal during the seismic test. Contact chatter was not observed under a peak acceleration of 3.4 g on the installed relay of the panel; however, the relay chatter for more than 2 ms dropped below the reference voltage 46 times and was evaluated in 10 cases under a peak acceleration of 15.8 g on the installed relay of the panel. However, the decrease in the output voltage or the signal change of the BC did not occur because of the contact chatter. An increased possibility of functional failure with the BC was shown.
Author Contributions
Conceptualization, Y.-S.J. and D.-U.P.; methodology, B.-G.J.; validation, S.-H.E. and D.-U.P.; investigation, Y.-S.J. and S.-H.E.; data curation, Y.-S.J.; writing—original draft preparation, Y.-S.J.; writing—review and editing, B.-G.J. and D.-U.P.; visualization, Y.-S.J.; project administration, D.-U.P.; funding acquisition, D.-U.P. All authors have read and agreed to the published version of the manuscript.
Funding
This work was supported by the Korea Institute of Energy Technology Evaluation and Planning (KETEP) and the Ministry of Trade, Industry, and Energy (MOTIE) of the Republic of Korea (No. 20201510100010).
Institutional Review Board Statement
Not applicable.
Informed Consent Statement
Not applicable.
Data Availability Statement
Not applicable.
Conflicts of Interest
The authors declare no conflict of interest.
References
- US NRC Regulatory Guide 1.60, Design Response Spectra for Seismic Design of Nuclear Power Plants; US NRC: Washington, DC, USA, 1973.
- Lee, C.G. Earthquake Engineering Analysis of Ground Accelerations Measured in the 912 Gyeong-ju Earthquake. Mag. KSCE Spec. Feature 2017, 65, 8–13. (In Korean) [Google Scholar]
- EPRI. Program on Technology Innovation: Seismic Screening of Components Sensitive to High-Frequency Vibratory Motions; Report 1015109; Electric Power Research Institute (EPRI): Palo Alto, CA, USA, 2007. [Google Scholar]
- Rustogi, S.; Gupta, A. Modeling the dynamic behavior of electrical cabinets and control panels: Experimental and analytical results. J. Struct. Eng. 2004, 130, 511–519. [Google Scholar] [CrossRef]
- Ries, M.; Hah, T.; Henkel, F.O. Seismic qualification of an electrical cabinet: Comparison of analysis and test results. In Proceedings of the 24th Conference on Structural Mechanics in Reactor Technology (SMiRT-24), Busan, Korea, 20–25 August 2017. [Google Scholar]
- Jeon, B.-G.; Son, H.-Y.; Eem, S.-H.; Choi, I.-K.; Ju, B.-S. Dynamic characteristics of single door electrical cabinet under rocking: Source reconciliation of experimental and numerical findings. Nucl. Eng. Technol. 2021, 53, 2387–2395. [Google Scholar] [CrossRef]
- Cho, S.G.; Kim, D.; Chaudhary, S. A simplified model for nonlinear seismic response analysis of equipment cabinets in nuclear power plants. Nucl. Eng. Des. 2011, 241, 2750–2757. [Google Scholar] [CrossRef]
- Son, H.; Park, S.; Jeong, B.-G.; Jung, W.-Y.; Choi, J.; Ju, B.-S. Seismic Qualification of Electrical Cabinet Using High-Fidelity Simulation under High Frequency Earthquakes. Sustainability 2022, 12, 8048. [Google Scholar] [CrossRef]
- Tran, T.T.; Cao, A.T.; Nguyen, T.H.X.; Kim, D.K. Fragility assessment for electric cabinet in nuclear power plant using response surface methodology. Nucl. Eng. Technol. 2019, 51, 894–903. [Google Scholar] [CrossRef]
- Kim, M.K.; Choi, I.K.; Seo, J.M. A shaking table test for an evaluation of seismic behavior of 480V MCC. Nucl. Eng. Des. 2012, 243, 341–355. [Google Scholar] [CrossRef]
- Chang, S.-J.; Jeong, Y.-S.; Eem, S.-H.; Choi, I.-K.; Park, D.-U. Evaluation of MCC seismic response according to the frequency contents through the shake table test. Nucl. Eng. Technol. 2021, 53, 1345–1356. [Google Scholar] [CrossRef]
- Richards, J.; Merz, K.; Hardy, G. High frequency seismic testing of potentially sensitivity components. In Proceedings of the 23rd Conference on Structural Mechanics in Reactor Technology (SMiRT-23), Manchester, UK, 10–14 August 2015. [Google Scholar]
- Tseng, Y.D.; Chang, W.G.; Gau, T.C. A relay fragility test experience of nuclear power plant in Taiwan. In Proceedings of the 23rd Conference on Structural Mechanics in Reactor Technology (SMiRT-23), Manchester, UK, 10–14 August 2015. [Google Scholar]
- Korea Atomic Energy Research Institute. Analysis of Component Reliability of Korean Standard Nuclear Power Plants; KAERI/TR-2749; Korea Atomic Energy Research Institute: Daejeon, Korea, 2004. (In Korean) [Google Scholar]
- Rhee, H.M.; Kim, M.K.; Sheen, D.H.; Chol, I.K. Analysis of Uniform Hazard Spectra for Metropolises in the Korean Peninsula. J. Earthq. Eng. Soc. Korea 2013, 17, 71–77. (In Korean) [Google Scholar] [CrossRef][Green Version]
- Bandyopadhyay, K.K.; Hofmayer, C.H.; Kassir, M.K.; Pepper, S.E. Dynamic Amplification of Electrical Cabinets, NUREG/CR-5203; Brookhaven National Laboratory (BNL): Upton, NY, USA, 1998.
- IEEE C37.98; IEEE Standard for Seismic Qualification Testing of Protective Relays and Auxiliaries for Nuclear Facilities. IEEE: New York, NY, USA, 2013.
Publisher’s Note: MDPI stays neutral with regard to jurisdictional claims in published maps and institutional affiliations. |
© 2022 by the authors. Licensee MDPI, Basel, Switzerland. This article is an open access article distributed under the terms and conditions of the Creative Commons Attribution (CC BY) license (https://creativecommons.org/licenses/by/4.0/).