Article

Predictive Model of Lyme Disease Epidemic Process Using Machine Learning Approach

by
Dmytro Chumachenko
1,*,
Pavlo Piletskiy
1,
Marya Sukhorukova
2 and
Tetyana Chumachenko
2
1
Department of Mathematical Modelling and Artificial Intelligence, National Aerospace University “Kharkiv Aviation Institute”, 61072 Kharkiv, Ukraine
2
Department of Epidemiology, Kharkiv National Medical University, 61000 Kharkiv, Ukraine
*
Author to whom correspondence should be addressed.
Appl. Sci. 2022, 12(9), 4282; https://doi.org/10.3390/app12094282
Submission received: 17 February 2022 / Revised: 19 April 2022 / Accepted: 21 April 2022 / Published: 23 April 2022
(This article belongs to the Special Issue Wildlife Diseases Worldwide: Understanding and Crisis Response)

Abstract

:
Lyme disease is the most prevalent tick-borne disease in Eastern Europe. This study focuses on the development of a machine learning model based on a neural network for predicting the dynamics of the Lyme disease epidemic process. A retrospective analysis of the Lyme disease cases reported in the Kharkiv region, East Ukraine, between 2010 and 2017 was performed. To develop the neural network model of the Lyme disease epidemic process, a multilayered neural network was used, and the backpropagation algorithm or the generalized delta rule was used for its learning. The adequacy of the constructed forecast was tested on real statistical data on the incidence of Lyme disease. The learning of the model took 22.14 s, and the mean absolute percentage error is 3.79%. A software package for prediction of the Lyme disease incidence on the basis of machine learning has been developed. Results of the simulation have shown an unstable epidemiological situation of Lyme disease, which requires preventive measures at both the population level and individual protection. Forecasting is of particular importance in the conditions of hostilities that are currently taking place in Ukraine, including endemic territories.

1. Introduction

Lyme disease is a group of naturally transmitted focal infectious diseases caused by Borrelia of the B. burgdorferi group and transmitted by ixodid ticks. Clinically, the disease occurs with a primary skin lesion and often involves the nervous system, musculoskeletal system, and the heart muscle, and is characterized by a tendency to a chronic course [1].
In the United States, the Centers for Disease Control and Prevention (CDC) in Atlanta registers more than 30,000 cases of borreliosis annually [2]. In European countries, Lyme disease cases are up to 8000–10,000 annually. The incidence rate of Lyme disease in France is 39.4 per 100 thousand population, while in Bulgaria it is 36.6 [1].
The name of the disease, Lyme disease or Ixodes tick-borne borreliosis, began to be used in recent years after discovering new species of Borrelia of the B. burgdorferi group, which are also transmitted by ixodid ticks [3]. Prior to this, cases of this group of diseases were recorded as Lyme disease. This provision is regulated based on the short version of the International Statistical Classification of Diseases and Related Health Problems, the 10th revision adopted by the Forty-third World Health Assembly [4].
In Ukraine, according to the Lviv Scientific Research Institute of Epidemiology and Hygiene, a variety of nosological forms of Lyme disease are associated with the circulation of three species of Borrelia pathogenic to humans: B. burgdorferi, B. garinii, and B. afzelii. In the most active natural foci of Lyme disease in Ukraine, approximately 10–70% of ticks are infected with Borrelia [5]. Epidemiological and serological studies conducted by this institute showed that from 10% to 42.2% of Ukraine’s population has contact with the pathogen of borreliosis from 2009 to 2014 [5]. In 2020, due to the coronavirus pandemic, the incidence of Lyme disease in Ukraine decreased by 2.1 times. In 2021, compared with the previous year, there was an increase in the incidence of 8.1%. At the same time, the number of people affected by tick bites increased by 28.7% in the Kharkiv region. The most significant number of victims was found in Kharkiv—54.1% of cases, the Izyum district—16.8%, and the Lozova district—12.4%.
Due to the incomplete and untimely detection of diseases of this group, it is impossible to assess the true prevalence, transmission, and geographic distribution of the disease, which makes them epidemiologically uncontrollable and poses a significant epidemic potential [6].
In addition, the prerequisites for the occurrence of the disease cases may be an increase in the number of ticks and an increase in the infection rate of Borrelia in ticks, especially in recreational areas [7]. Due to the growth of tick populations [8], an increase in tick bites has been observed.
To plan and conduct rational, preventive measures, it is necessary to understand the epidemiology of borreliosis in Ukraine and the factors associated with morbidity. The best tool for that is a mathematical simulation that builds predicted dynamics of the epidemic process and determines the factors influencing the morbidity.
This work aimed to develop an effective model to predict the dynamics of the Lyme disease epidemic process in the given territory. This will allow for the determining of the dynamics of the development of the epidemic process of Lyme disease in the Kharkiv region (Ukraine) and will allow for the planning of effective evidence-based measures to reduce the epidemic development of the incidence. Thus, the preventive and medical institutions of Ukraine will receive an automated tool for assessing the situation with the incidence of Lyme disease.
To achieve the aim of the research, the following tasks have been formulated:
  • Models and methods of epidemic processes simulation should be analyzed.
  • Models and methods of the Lyme disease epidemic process simulation should be analyzed.
  • Data on Lyme disease morbidity in the Kharkiv region (Ukraine) should be analyzed.
  • The Lyme disease epidemic process machine learning model based on neural networks should be developed.
  • The experimental study of the developed model with actual statistical data on Lyme disease morbidity should be provided.
  • The results of the developed model should be compared with other Lyme disease epidemic process models.
The respective contribution of this research is three-fold:
  • The development of a simulation machine learning model of the Lyme disease epidemic process and the comparison of the results with other approaches will allow for the estimating of the accuracy of the neural network approach applied to the simulation of the epidemic process simulation, specifically vector-borne diseases.
  • The development of a machine learning model based on neural networks of the Lyme disease epidemic process will allow for the predicting of the epidemic situation without an additional measurement of climate parameters, using indicators of the number of ticks and their infection with borrelia in any selected territory to build the model.
  • The application of the machine learning model based on neural networks to the Lyme disease epidemic process in the Kharkiv region (Ukraine) will allow for the estimating of its dynamics, contributing to closing a severe gap in understanding the spread of Lyme borreliosis in specific spatial and temporal settings, assessing the risks of Lyme disease in humans, and mitigating the impact of tick-borne infections in the future.
The further structure of the paper is as follows: Section 2, Background, provides an epidemiological analysis of Lyme disease and an overview of models and methods of the epidemic process simulation and existing model of Lyme disease epidemic process simulation analysis. Section 3, Materials and Methods, describes the development of the neural network model of the Lyme disease epidemic process, its training and verification, and an analysis of Lyme disease morbidity data in the Kharkiv region (Ukraine). Section 4, Results, describes the program realization of the developed model and experimental study within the data investigated. The discussion section discusses the prospective use of the models and their limitations. The conclusion describes the outcomes of the proposed methodology.

2. Background

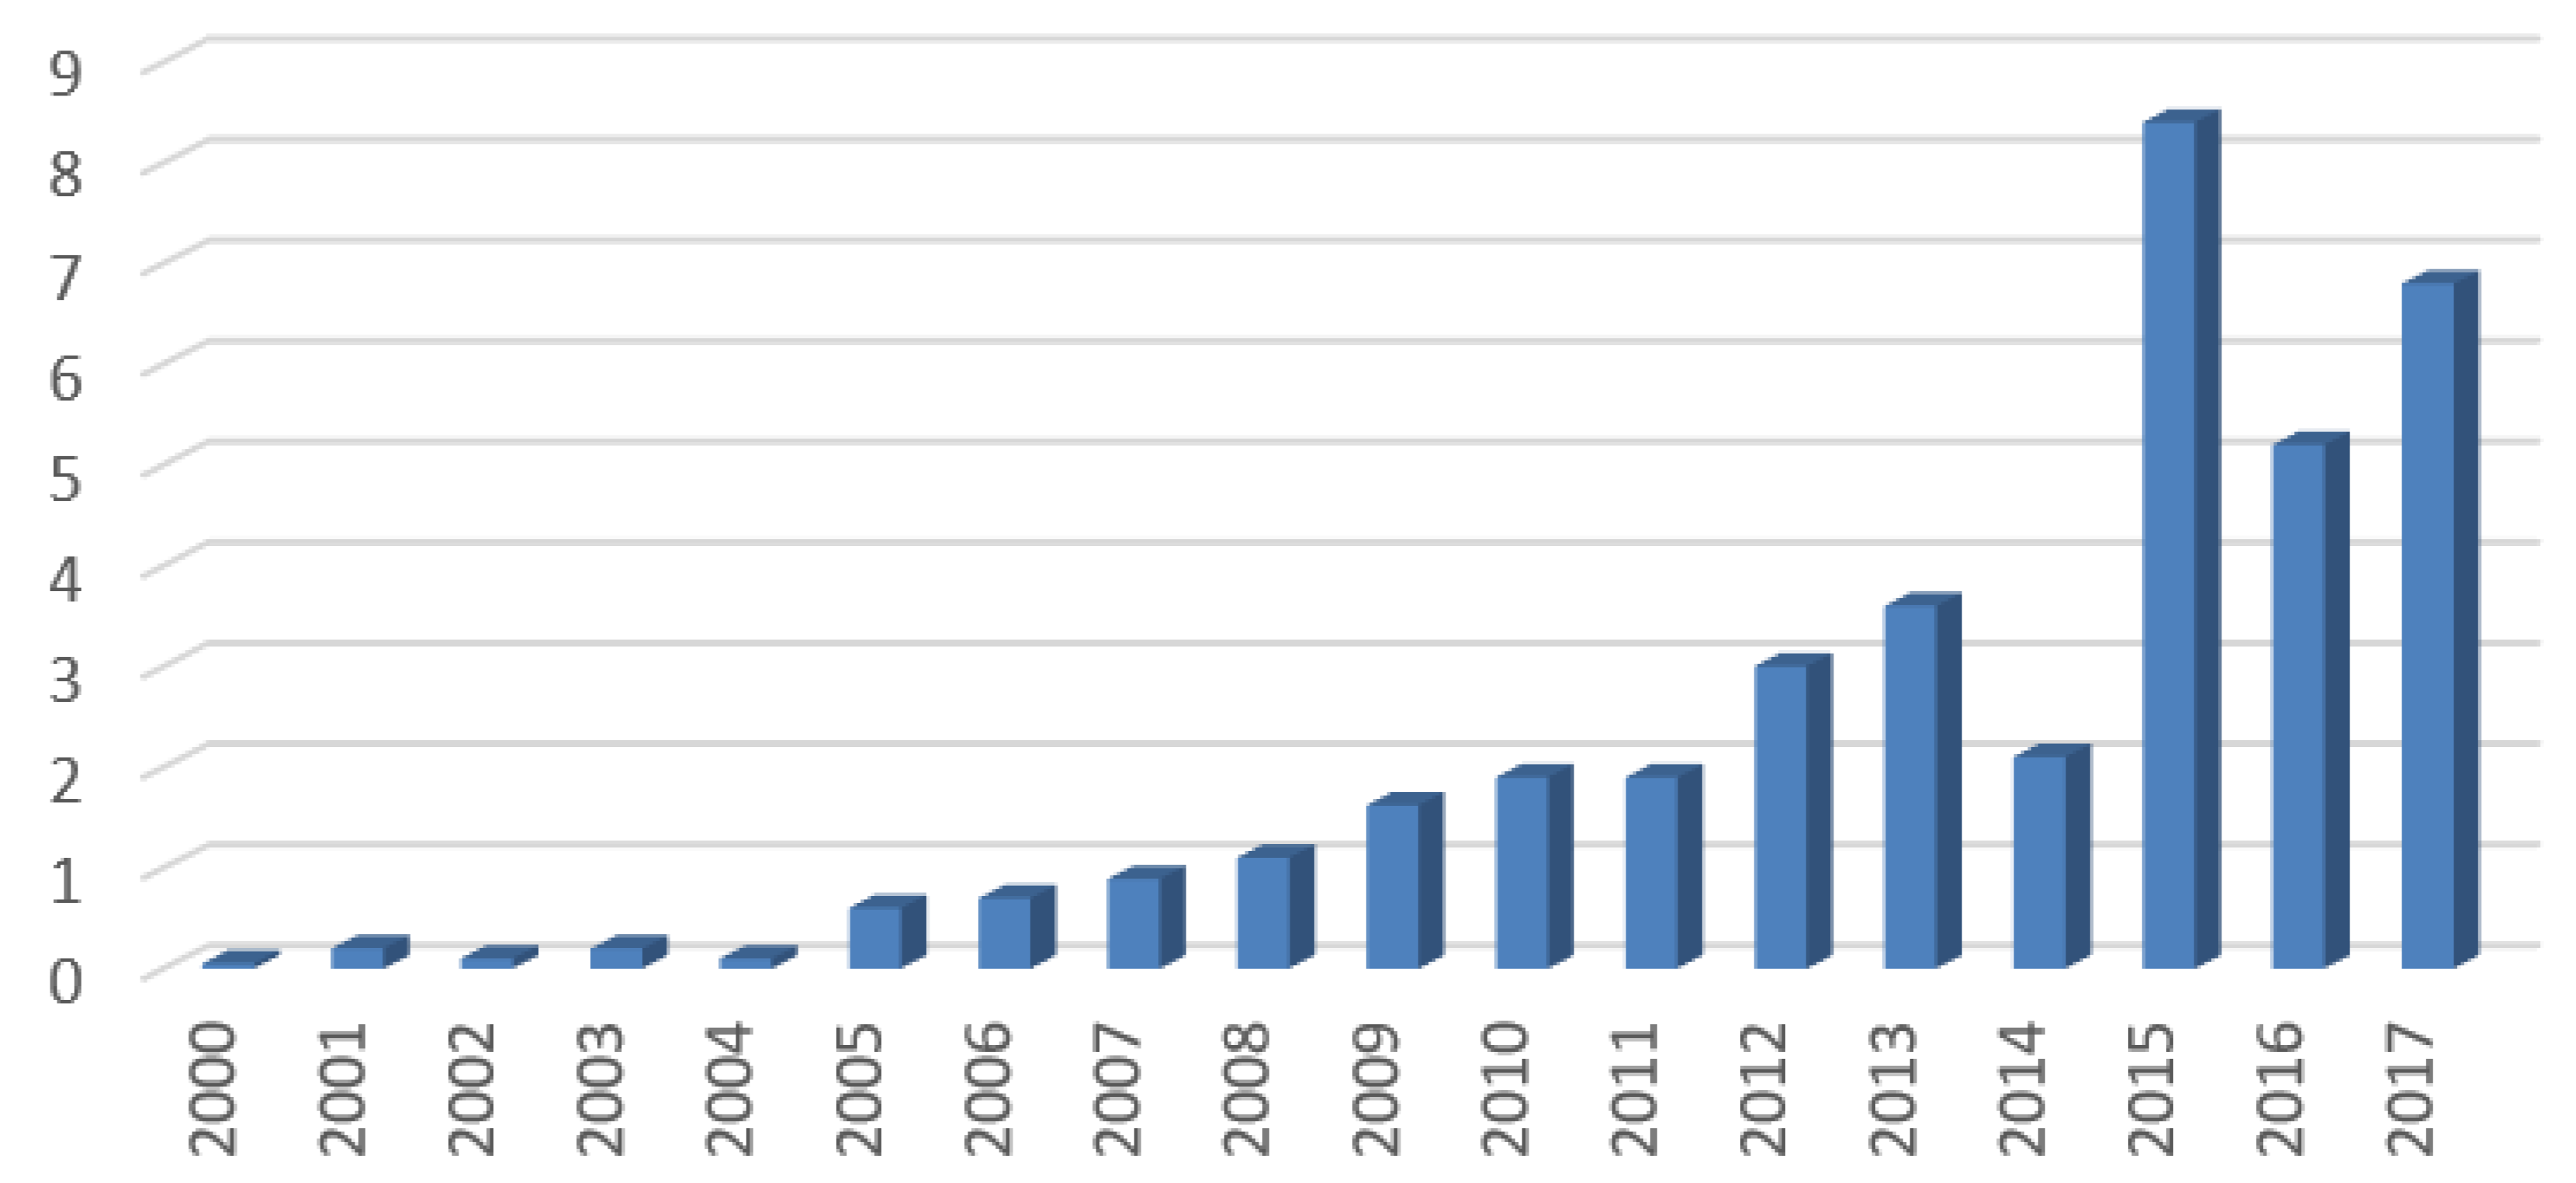
2.1. Lyme Disease Epidemiology

Lyme disease is caused by bacteria that belong to the Spirochaetaceae family of the Borrelia genus. These are gram-negative spirochetes, able to move quickly with the help of flagella. More than 20 Borrelia genospecies belonging to Borrelia burgdorferi sensu lato are currently distinguished by differences in DNA nucleotide sequences with a complex genomic structure. The pathogenic genospecies are B. burgdorferi ss, B. garinii, B. afzelii, B. bavariensis, and a new genospecies, B. mayonii, has recently been identified, the significance of which is being studied [9,10].
The division of the pathogen into genomic groups is of clinical importance [11]. Thus, B. burgdorferi ss is associated with a predominant lesion of the joints, B. garinii—with the development of meningoradiculitis, B. afzelii—with skin lesions. The pathogenicity of other Borrelia to humans requires further study.
All genotypes are unevenly distributed within the world nosoareal of this infection. B. burgdorferi sl and B. mayonii mainly circulate in the USA, while B. afzelii, B garinii, B. burgdorferi ss, and B bavariensis circulate in Europe [9].
The natural reservoir of Borrelia in nature is wild animals—rodents, marsupials, deer, birds, etc. Dogs and farm animals—sheep, goats, and cattle—can also be reservoirs. Ixodid ticks support the circulation of the pathogen in nature. The principal epidemiological significance as a vector of borrelia in Europe is the ticks Ixodes ricinus, I. persulcatus, in the USA—I. scapularis, I. pacificus are vectors of B. burgdorferi sl in the western coastal areas. In addition, pathogens can transmit some types of ticks from the genera Ambliomma, Dermacentor, Haemaphysalis, and Ripicephalus [12].
Transphase transmission of Borrelia has been established in vectors—independently living stages: larva—nymph—imago. Transphase transmission is carried out by 5% of female ixodid ticks, in which Borrelia penetrate the salivary glands and the reproductive apparatus. However, the infectivity of larvae from such females is very high and reaches 60–100%. From 7–9 to 24–50% of ticks in the epidemic focus can be infected simultaneously by two or three different Borrelia. On average, in Europe, 12% of nymphal and 15% of imago I. ricinus ticks are infected with B. burgdorferi sl, and 2–3% of people develop Lyme borreliosis after a tick bite [12].
An infected person is not a source of the pathogen for humans. Infection of a person occurs mainly due to the suction of a tick, in the saliva of which the causative agent of Lyme disease is located. Ticks are often attached to a person’s clothing in a forest or meadow when in contact with tall grass. Ticks can be brought into dwellings (tents, buildings), remaining on clothes and things, with a bouquet, fresh hay, firewood, and animals (for example, dogs), and only after a few days go to humans. It takes 1–2 h from the moment a tick crawls onto a person’s clothes until the start of bloodsucking. The suction of the tick is usually painless. Saliva contains analgesic, vasodilating, and anticoagulant substances. Ticks most often stick in places with thin skin and abundant blood supply (neck, chest, armpits, inguinal folds, in children—the scalp). A person feels itching at the site of tick suction only after 6–12 h and later. The blood saturation of female ixodid ticks can last up to six to eight days.
Transmission of Borrelia is also possible by rubbing tick feces, scratching the skin, and/or the mechanical transfer of Borrelia into microtraumas of the skin and/or conjunctiva of the eyes when ticks are accidentally crushed during their removal from animals (dogs). The incubation period for Lyme disease is two to 30 days, usually 10 to 14 days. With the saliva of an infected tick, Borrelia gets into the skin and multiplies within a few days, then spreads to other areas of the skin and internal organs (heart, brain, joints, etc.).
A polymorphism characterizes the disease in the clinical course [13]. The most common and early symptom of Lyme disease is erythema migrans. It occurs around the tick bite site, is characterized by a red or bluish-red macular skin lesion, and increases over several days or weeks. B. afzelii causes erythema migrans with central clearing in 60% of cases. B. burgdorferi sl and B. garinii usually result in homogeneous erythema migrans. Without treatment, erythema migrans may persist for weeks or sometimes months [14].
Skin manifestations also include borreliosis lymphocytoma, which is characterized by a painless bluish-red nodule, is rare and occurs predominantly in children, and acrodermatitis, chronic atrophic, which presents as a chronic, slowly progressive red or bluish skin lesion that may become atrophic over time [11].
Lesions of the nervous system are manifested by radiculoneuritis and lymphocytic pleocytosis of the cerebrospinal fluid in adults and facial paralysis in children. Sensory disturbances and paresis can manifest Lyme radiculitis.
In Lyme disease, joint lesions in oligo- or mono-arthritis can also be observed three to six months after infection, often involving the knee joint. Left untreated, symptoms include intermittent or persistent joint swelling and pain over several months to several years [11].
A severe complication is Lyme carditis. Acute cardiac injury, characterized by varying degrees of atrioventricular conduction defects, may occur during early disseminated infection. Rarely does acute myopericarditis or cardiomyopathy occur. Lyme carditis usually resolves independently, but if left untreated, it can be fatal.
Antibacterial drugs form the basis of treatment. With late-started or inadequate therapy, the disease progresses, acquires a chronic course, manifested by damage to the joints, skin, heart, and nervous system, and often leads to disability.
Lyme disease is the most common vector-borne disease in the Northern Hemisphere. Globally, Lyme disease has been reported in more than 80 countries, and there has been an increase in the number of cases of Lyme disease and an expansion of the territories in which it is registered [15,16].
Comparison of the incidence of Lyme disease in different countries is not always correct due to different systems of epidemiological surveillance. In some countries, Lyme disease is subject to mandatory reporting. The incidence is estimated based on epidemiological studies or incidence estimates in neighboring comparator countries. In addition, not only do reporting procedures vary across countries, but also differences in case definitions and diagnostic procedures [14,17,18].
Lyme borreliosis is found throughout Europe and Asia. The highest reported incidence is in Central Europe and Scandinavia, especially in Germany, Austria, Slovenia, the Baltic Sea coast of Sweden, and some Estonian and Finnish islands, where reported incidence rates exceed 100 cases per 100,000 persons [15,19]. The paper [17] states that the reported incidence of Lyme disease in Europe is about 22.6 cases per 100,000 inhabitants per year, with a wide range depending on the analyzed geographical area.
In the United States, the high incidence is noted in the Northeastern and Mid-Atlantic states and the states of the upper Midwest, where 14 states account for more than 90% of Lyme disease cases. The incidence ranges from 25 to 100 per 100,000 population [20].
The registered incidence is lower than the actual one. The paper [21] provides examples of the estimated incidence for 2018, based on the results of modeling: incidence-USA 473,000/year, Germany 471,000/year, France 434,000/year and UK 132,000/year; prevalence—2.4 million in the US, 2.4 million in Germany, 2.2 million in France and 667,000 in the UK; the total number of infections is 10.1 million in the US, 10.0 million in Germany, 9.3 million in France and 2.8 million in the UK. Estimates for the world for 2018: incidence of 12.3 million people per year; a prevalence of 62.1 million; and a total infectious burden of 262.0 million. These data are far higher than officially published data and reflect an underestimation of diagnosed cases, as acknowledged by health authorities, and undetected and misdiagnosed cases.
The incidence of Lyme disease is on the rise worldwide due to climate change and the expansion of the Ixodid tick habitat, changes in significant tick host populations, and improved reporting and awareness [22].
Under the current conditions in Ukraine, a clear connection between the increase in morbidity and the development of horticulture, tourism, economic transformations, the expansion of recreational areas, and the urbanization of focal landscapes has been revealed. With insufficient attention to the issues of the sanitary condition of settlements, the implementation of deratization measures, with anti-tick treatments, the range of natural foci is expanding, and the number and infestation of vectors are being actively restored.
In Lyme disease, there are seasonal increases in the incidence associated with the period of vector activity, the duration of which depends on climatic, weather, regional natural and geographical conditions, and the type of tick.

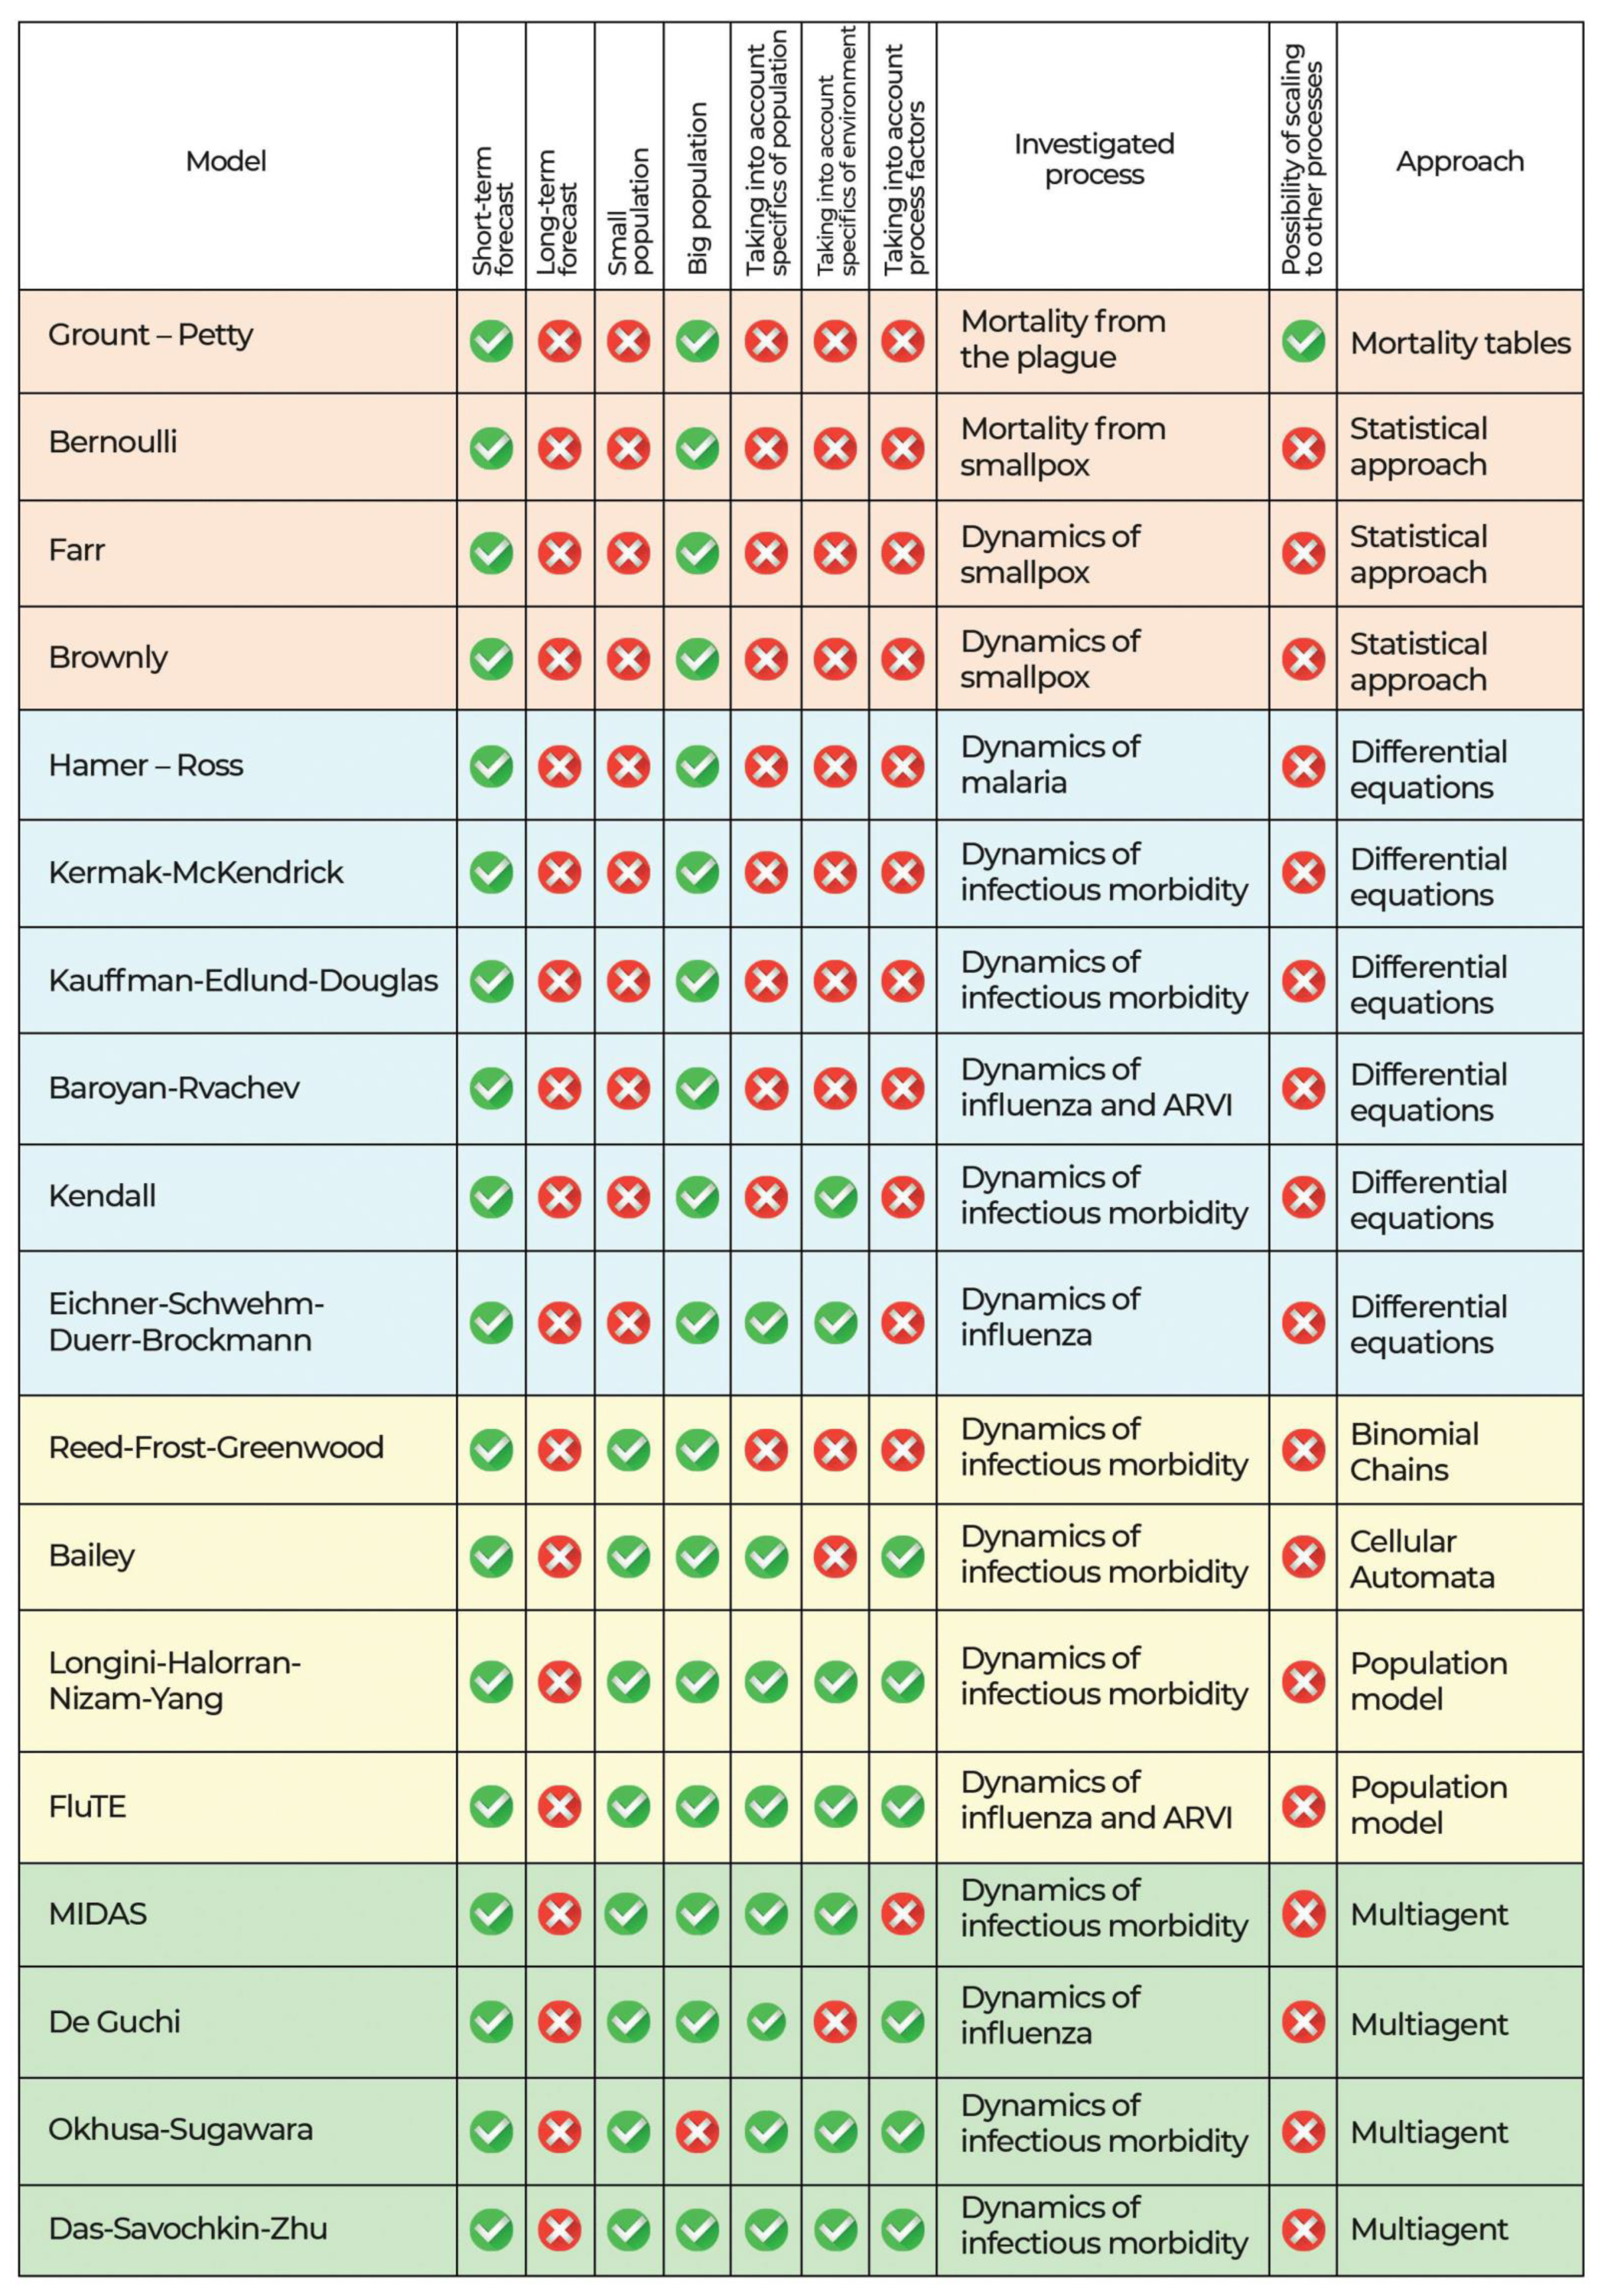
2.2. Current Research Analysis

A significant number of theoretically grounded models of epidemic processes in population dynamics systems have been created [23].
The beginnings of modeling epidemic processes have been known since the 19th century. Significant improvement and use of models for predicting and investigating infectious diseases occurred in the early 20th century with the works of Ronald Ross [24], William Hamer [25], Anderson McKendrick and William Kermack [26]. These works laid the mathematical foundations for modeling in epidemiology, offering a description of epidemic processes using compartmental models. Later, cellular automata, binomial chains, statistical approaches, and population multi-agent models were used to model infectious diseases. An analysis of existing approaches carried out in this research showed that existing models could be conditionally divided into four groups. Each group of approaches to epidemic processes simulation has its limitations. The results of the analysis are shown in Figure 1.
The first group includes models using a statistical approach [27,28,29,30]. These models allow us to calculate only a short-term forecast for a sufficiently large population.
The second group of approaches to the modeling of epidemic processes is based on the theory of differential equations [31,32,33,34,35,36]. These models provide an opportunity to consider the characteristics of the population and the environment but still cannot be transferred to small populations.
The third group of models uses the discrete-event approach of population dynamics, which allows for the consideration of the characteristics of the population, the environment, and the factors of the epidemic process [37,38,39,40]. However, this approach has the main disadvantage of the high complexity of making changes to the model, which significantly complicates the possibility to transfer models to new areas of knowledge.
The fourth group of models uses the multiagent approach, which allows taking into account the features of the population, environment, and factors of the epidemic process [41,42,43,44]. The effective use of the multiagent approach involves the consideration of intelligent social communications of the objects of the population and expansion to other areas, which makes such kinds of models complex and decreases the accuracy of the simulation.
Novel machine learning models that use neural networks can remove the shortcomings of existing approaches and improve the accuracy of the calculated forecast.
A neural network is a connected and simple interacting processor (neurons) system. As a fundamental element of a neural network, a neuron can perceive, transform, and propagate signals, in our case, time series. Furthermore, combining neurons into one network allows for solving quite complex problems. Training a neural network consists of changing the weight of connections between neurons. The neural network approach is free from model constraints. When introducing additional algorithms into models, for example, to reduce dimensions and complexity [45] or optimize models [46], you can improve the result. Therefore, using an approach that uses neural network models, it is possible to eliminate all the limitations outlined in analyzing existing solutions for epidemic processes simulation.
To date, some mathematical and simulation models have been developed to investigate the epidemic process of Lyme disease. Such models are aimed at solving the following problems, taking into account the specific aspects of the transmission of Lyme disease:
  • Determination of the basic ecology of the tick’s population [47,48];
  • Determination of the threshold morbidity for the epidemic development of infection [49,50];
  • The influence of different hosts on the preservation of tick-borne diseases [51,52];
  • The influence of host density on the spread of Lyme disease [53,54];
  • Modeling the seasonal dynamics of the tick population [55,56];
  • The influence of climatic conditions on the development of Lyme disease in certain areas [57,58];
  • Modeling the spread of various pathogens [59,60];
  • Predicting morbidity in certain areas [61,62].
Such models can be divided into two classes:
  • Models aimed at the theoretical study of the epidemic process of Lyme disease;
  • Simulation models aimed at modeling certain aspects of the epidemic process of Lyme disease.
An analysis of the models of the epidemic process of Lyme disease is presented in Table A1. The analysis showed that when solving the problem of predicting the incidence dynamics of Lyme disease, which was set within the framework of this study, machine learning methods show the highest accuracy.

3. Materials and Methods

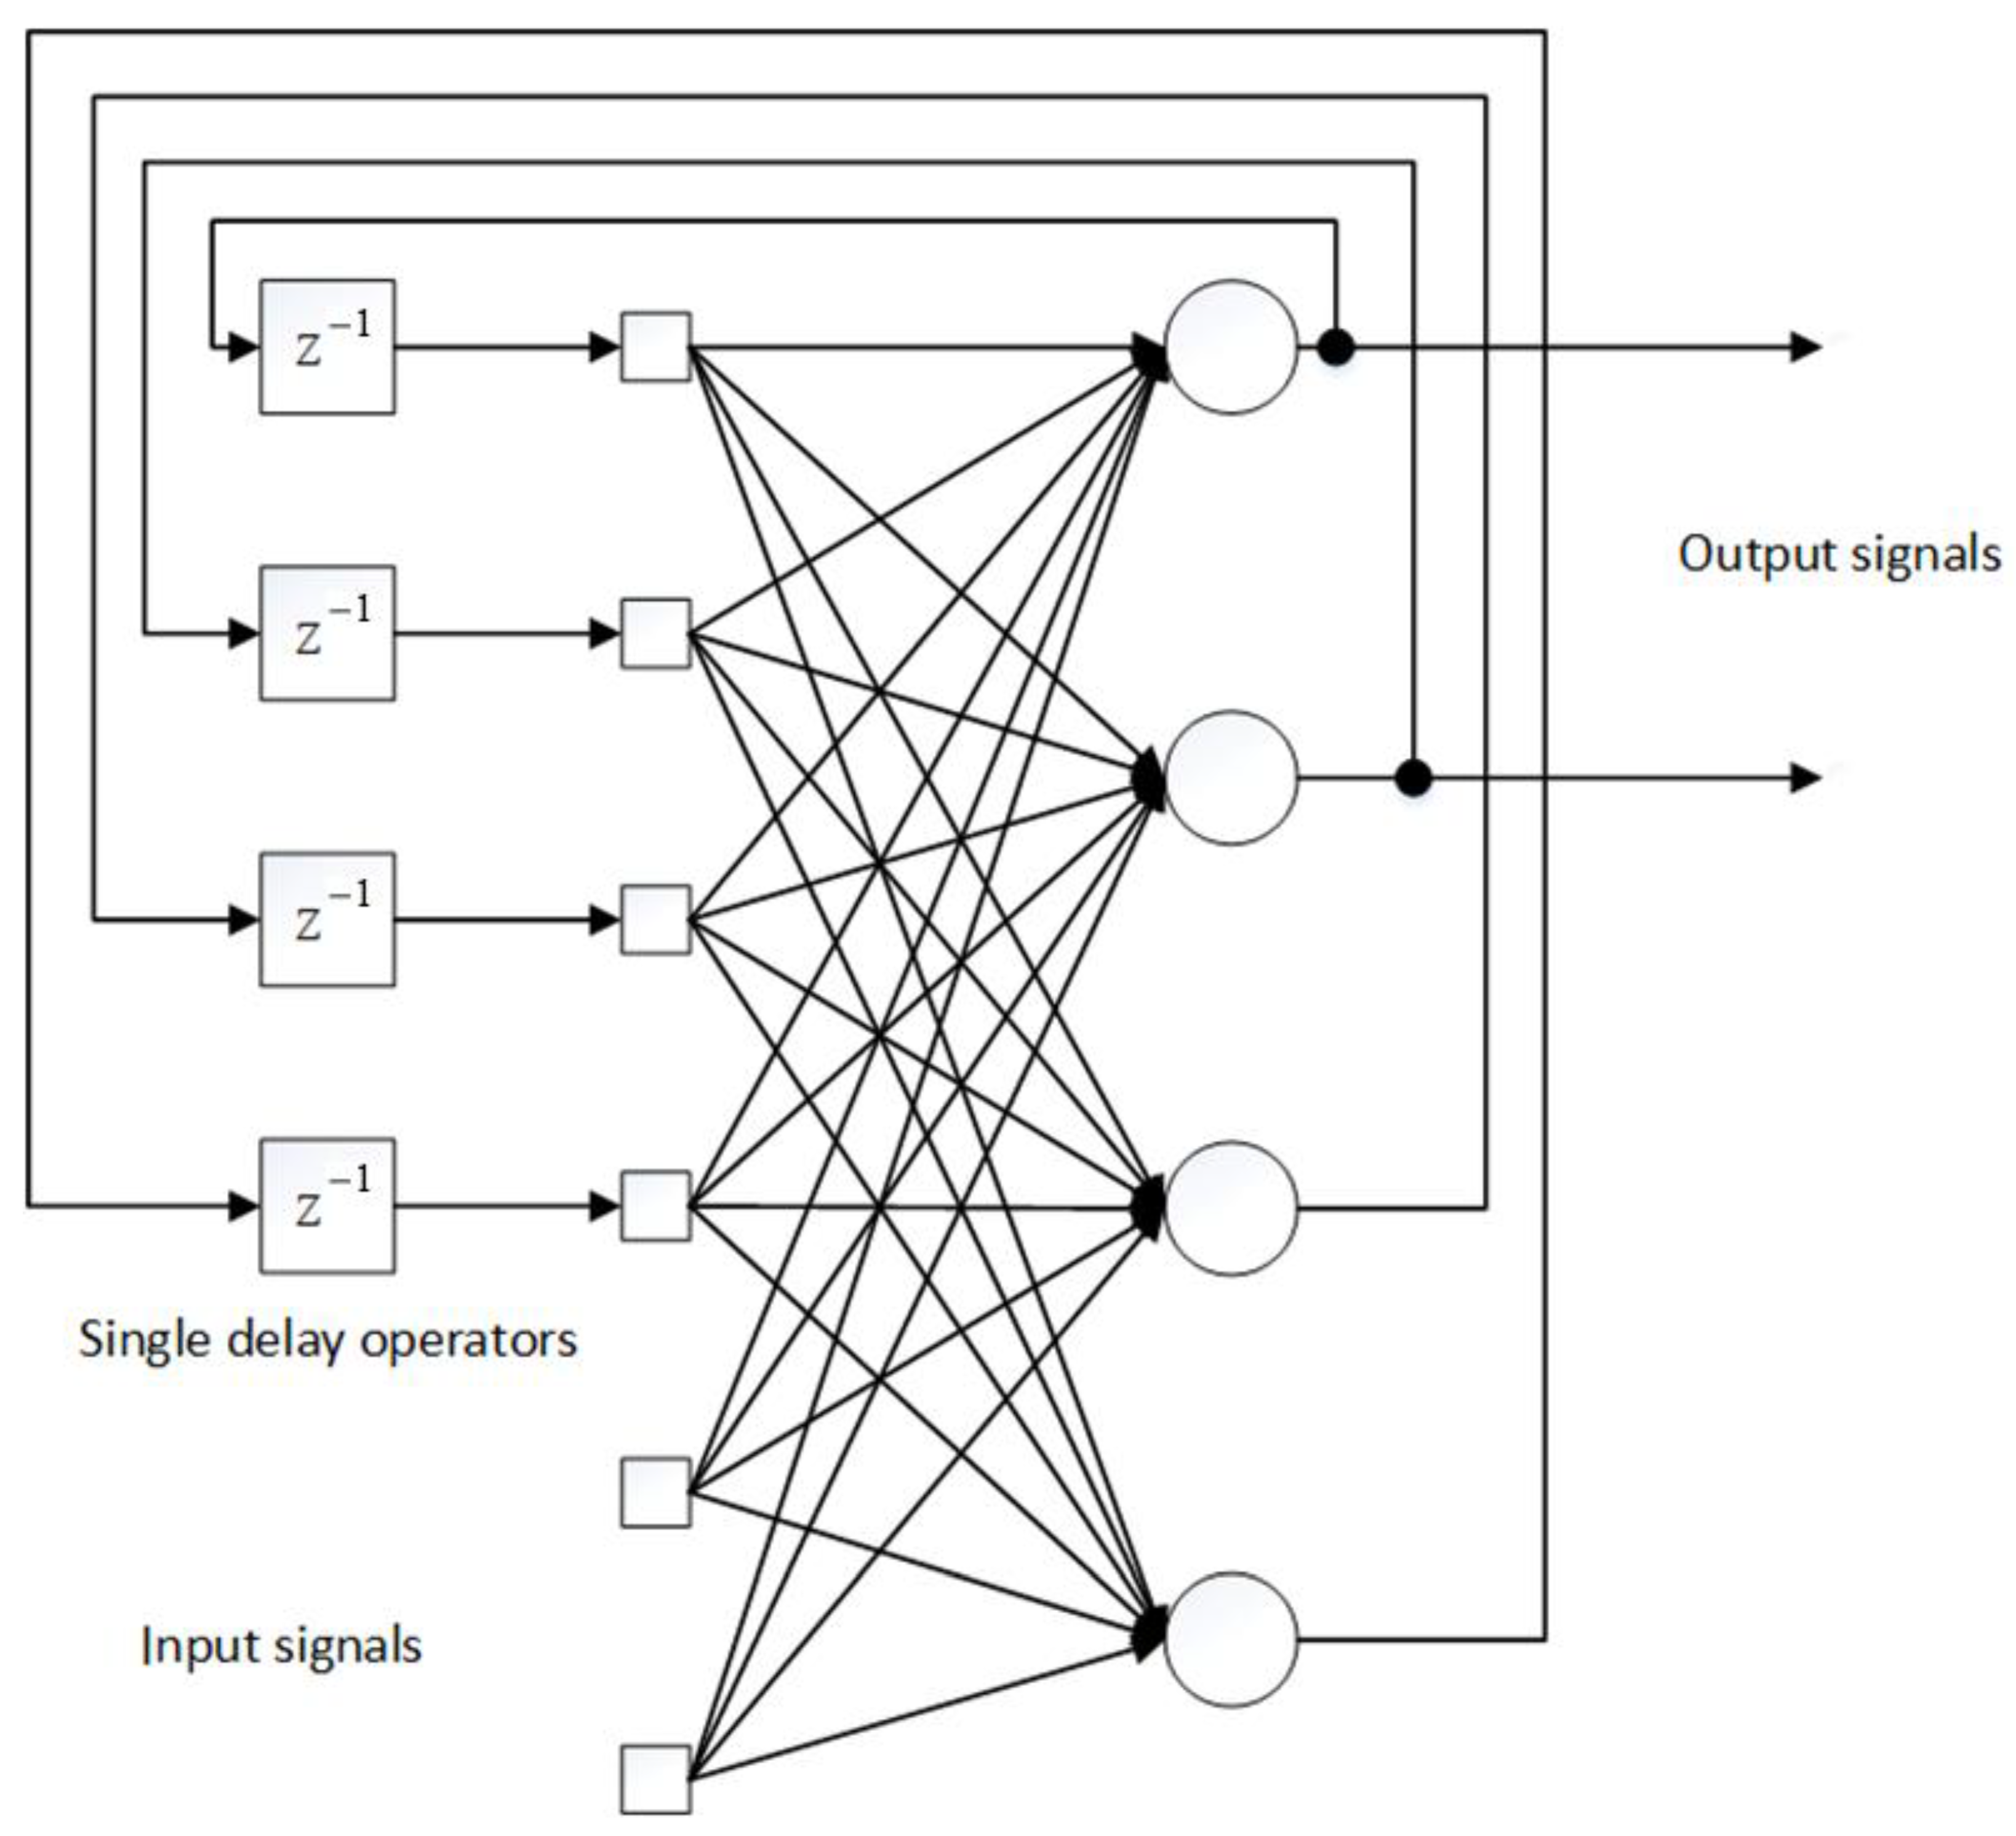
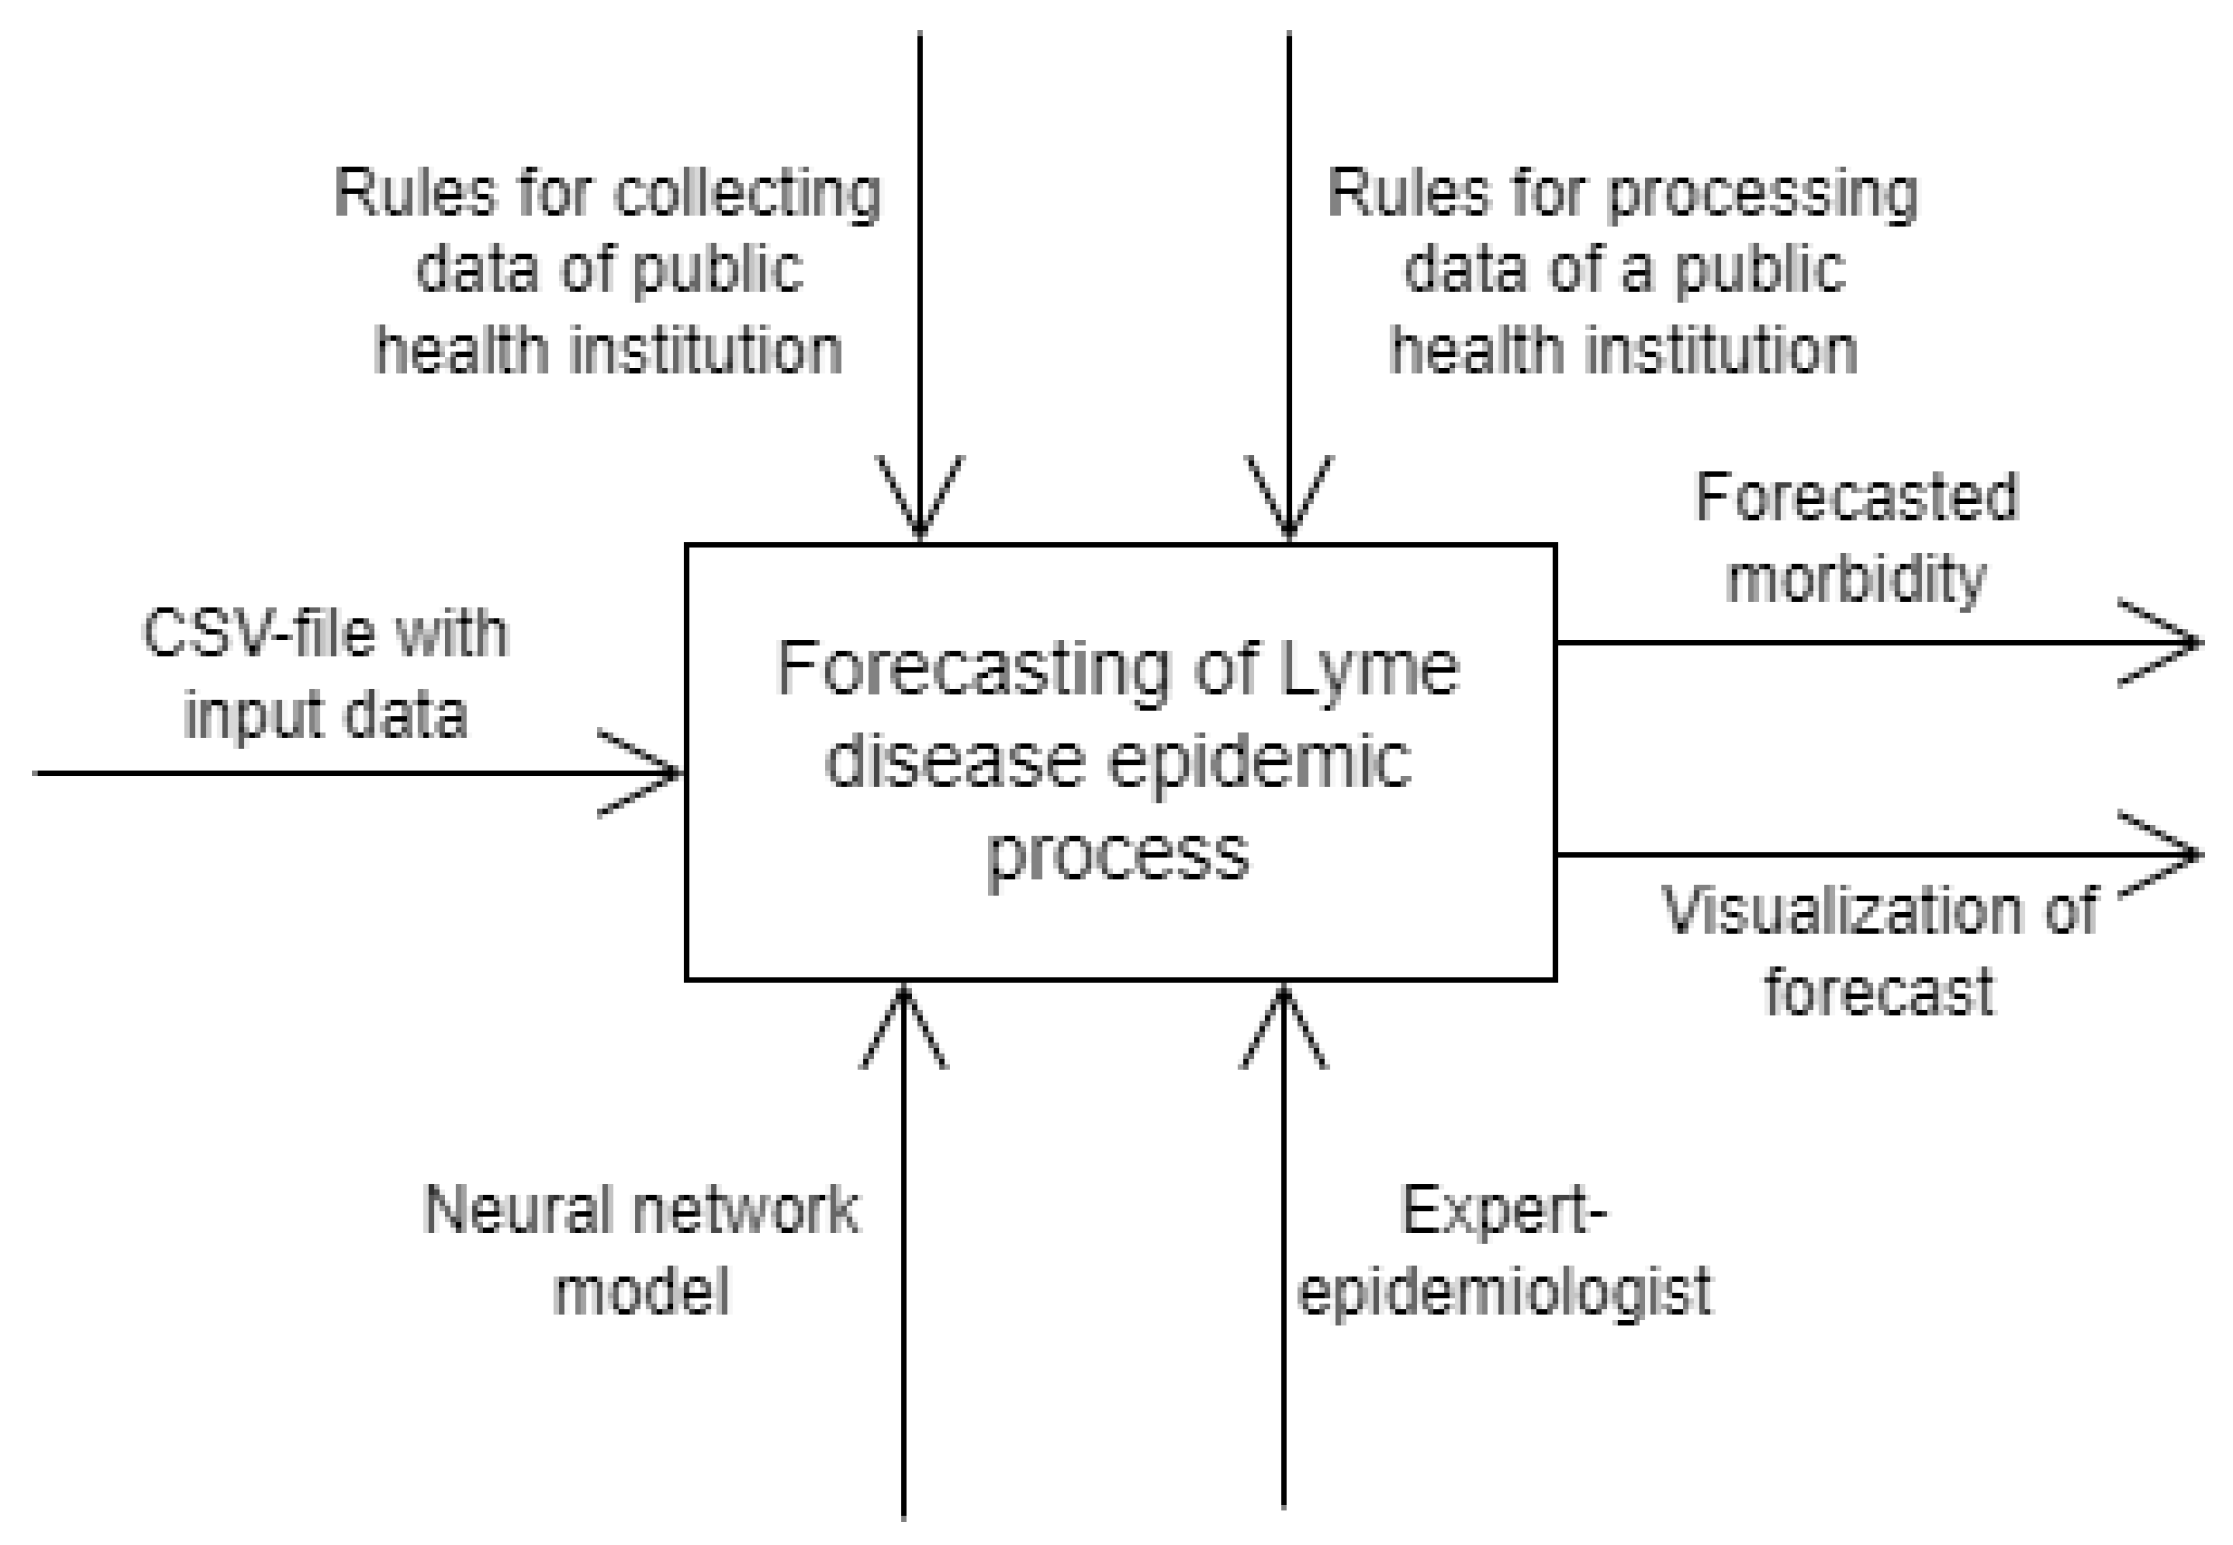
3.1. Model of Lyme Disease Epidemic Process

To develop the neural network model of the Lyme disease epidemic process, a multilayered neural network was used and the backpropagation algorithm or generalized delta rule was used for its learning. Training consists of adapting the parameters of all layers, so that the difference between the output signal of the network and the external training signal is on average minimal. From this, it follows that the learning algorithm is essentially an extremum search procedure for a specially designed target error function.
A neural network is a distributed parallel processor consisting of elementary information processing units that accumulate experimental knowledge and provide it for further processing. The neural network is similar to the brain. Knowledge enters the neural network from the environment and is used in the learning process. Connections between neurons, called synaptic weights, are used to accumulate knowledge. Changing synaptic weights is a traditional method for tuning neural networks. This approach is very close to the theory of linear adaptive filters. However, neural networks can change their topology.
A neural network’s learning process is considered an adaptation of parameters for solving a given problem by optimizing the accepted quality criterion. The learning process is permanent, and over time the network improves its characteristics, gradually approaching the optimal solution of the task. The type and nature of training are determined by the amount of a priori and current information about the environment and the objective function, which characterizes the degree of compliance of the neural network with the task it is solving. Information about the external environment is given in the form of a training sample of images, and by processing them the network extracts the information necessary to obtain the desired solution.
The neural network architecture developed for the simulation is shown in Figure 2.
Each input shape represents ( n 0 × 1 ) vector x = ( x 1 , , x i , , x n 0 ) T , output shape ( n 3 × 1 ) vector y = ( y 1 , , y i , , y n 3 ) T and learning shape ( n 3 × 1 ) vector d = ( d 1 , , d j , , d n 3 ) T . In the process of learning, it is necessary to ensure minimal inconsistency between the current output values y j ( k ) and the desired signals d j ( k ) for all j = 1, 2, …, n 3 and k. As an error option, a local quality criterion is used.
E ( k ) = 1 2 j = 1 n 3 ( d j ( k ) y j ( ( k ) ) 2 = 1 2 j = 1 n 3 e j 2 ( k ) = j = 1 n 3 E j ( k ) ,
or global target function
E k = k E ( k ) = 1 2 k j ( d j ( k ) y j ( ( k ) ) 2 = 1 2 k j ( e j 2 ( k ) ) .
Also, the approach used in the model for finding the minimum of the adopted objective function is mainly associated with the objective function (1). It consists in sequentially adjusting the weights as the input images arrive (often in random order) one after another in real-time. Moreover, for each pair of shapes x, d, the weights w j i [ s ] (s = 1, 2, 3) change by an amount Δ w j i [ s ] proportional to the antigradient of the objective function E(k), i.e.,
w j i [ s ] ( k + 1 ) w j i [ s ] ( k ) = Δ w j i [ s ] ( k ) = η ( k ) E ( k ) w j i [ s ] .
If the step coefficient η ( k ) is sufficiently small, then this procedure minimizes the global objective function (2). Note also that the recurrent tuning procedure (3) corresponds in continuous time to a differential equation of the type:
d w j i [ s ] d t = η ( k ) E ( t ) w j i [ s ] , η > 0 .
Let us consider the real-time learning algorithm associated with the minimization of the local function E(k) at each step. For synaptic weights of the output layer w j i [ s ] , the following relationship is valid:
Δ w j i [ 3 ] ( k ) = η ( k ) E ( k ) w j i [ 3 ] ( k ) = η ( k ) E ( k ) u j [ 3 ] ( k ) u j [ 3 ] ( k ) w j i [ 3 ] .
Introducing a local error
δ j [ 3 ] ( k ) = E ( k ) u j [ 3 ] = E ( k ) e j ( k ) e j ( k ) u j [ 3 ] = e j ( k ) ψ j [ 3 ] u j [ 3 ] ,
given that
u j [ 3 ] ( k ) = i = 1 n 2 w j i [ 3 ] ( k ) x i [ 3 ] ( k ) = i = 1 n 2 w j i [ 3 ] ( k ) o i [ 2 ] ( k ) ,
where x i [ 3 ] ( k ) = o i [ 2 ] ( k ) means that the input of the third layer is the output of the second, it is easy to write the general formula for adjusting the weights of the output layer in the form
Δ w j i [ 3 ] ( k ) = η ( k ) δ j [ 3 ] ( k ) x i [ 3 ] ( k ) = η ( k ) δ j [ 3 ] ( k ) o i [ 2 ] ( k ) ,
where
δ j [ 3 ] ( k ) = e j ( k ) ( ψ j [ 3 ] ( u j [ 3 ] ( k ) ) ) = ( d j ( k ) y j ( k ) ) ψ j [ 3 ] u j [ 3 ] .
Adjusting the synaptic weights of hidden layers is much more difficult. For the second hidden layer, write
Δ w j i [ 2 ] ( k ) = η ( k ) E ( k ) w j i [ 2 ] = η ( k ) E ( k ) u j [ 2 ] ( k ) u j [ 2 ] ( k ) w j i [ 2 ] = η ( k ) δ j [ 2 ] ( k ) x i [ 2 ] ( k ) = η ( k ) δ j [ 2 ] ( k ) o i [ 1 ] ( k ) ,
where the local error of the second hidden layer is determined by the expression
δ j [ 2 ] ( k ) = E ( k ) u j [ 2 ] , j = 1 , 2 , , n 2 .
The problem is that this error cannot be determined directly by type (9), and therefore it is necessary to try to express it either through observed signals or through variables that can be estimated.
Equation (11) can be represented in form
δ j [ 2 ] ( k ) = E ( k ) u j [ 2 ] = E ( k ) o j [ 2 ] ( k ) o j [ 2 ] ( k ) u j [ 2 ] ,
given that
o j [ 2 ] ( k ) = ψ j [ 2 ] ( u j [ 2 ] ( k ) ) ,
have as a result
δ j [ 2 ] ( k ) = E ( k ) o j [ 2 ] ( k ) ψ j [ 2 ] u j [ 2 ] .
Representing E ( k ) / o j [ 2 ] ( k ) in the form
E ( k ) o j [ 2 ] ( k ) = i = 1 n 3 E ( k ) u i [ 3 ] ( k ) u i [ 3 ] ( k ) o j [ 2 ] = = i = 1 n 3 ( E ( k ) u i [ 3 ] ( k ) ) o j [ 2 ] ( p = 1 n 2 w i p [ 3 ] ( k ) x p [ 3 ] ( k ) ) = = i = 1 n 3 i [ 3 ] ( k ) o j [ 2 ] ( p = 1 n 2 w i p [ 3 ] ( k ) o p [ 2 ] ( k ) ) = i = 1 n 3 δ i [ 3 ] ( k ) w i j [ 3 ] ( k ) ,
local error of the second hidden layer can be calculated using the expression
δ j [ 2 ] ( k ) = ψ j [ 2 ] u j [ 2 ] i = 1 n 3 δ j [ 3 ] ( k ) w i j [ 3 ] ( k ) ,
from where comes
Δ w i j [ 2 ] ( k ) = η ( k ) o i [ 1 ] ( k ) ψ j [ 2 ] u j [ 2 ] i = 1 n 3 δ i [ 3 ] ( k ) w i j [ 3 ] ( k ) .
Similarly, we can write a formula for regulating the weights of the first layer
Δ w i j [ 2 ] ( k ) = η ( k ) δ i [ 1 ] ( k ) x i [ 1 ] ( k ) = η ( k ) δ i [ 1 ] ( k ) o i [ 0 ] ( k ) = η ( k ) δ i [ 1 ] ( k ) x i ( k ) ,
where the local error of the first layer is
δ j [ 1 ] ( k ) = ψ j [ 1 ] u j [ 1 ] i = 1 n 2 δ i [ 2 ] ( k ) w i j [ 2 ] ( k ) .
The local error of the inner (hidden) layer is determined based on the errors of the next layer. Starting from the output layer, a local error is calculated using an expression δ j [ 3 ] ( k ) , and then by propagating it from the output to the network input, errors δ j [ 2 ] ( k ) and δ j [ 1 ] ( k ) are calculated.
The main difference between the developed learning algorithm and the procedures is the calculation of local errors δ j [ s ] ( k ) (s = 1, 2) of hidden layers. If for the initial layer the local error is a function of the desired and actual outputs of the network and the derivative of the activation function, then for the hidden layers the local errors are determined based on the local errors of the subsequent layers.
It is convenient to describe the operation of the reverse error propagation algorithm as a sequence of the following steps:
  • setting the initial conditions for all synaptic weights of the network in the form of sufficiently small random numbers so that the activation functions of neurons do not enter saturation mode at the initial stages of learning (protection from network “paralysis”);
  • feed to the input of the network of method x and calculate the outputs of all neurons for given values w j i [ s ] ;
  • for a given training vector d and the calculated intermediate outputs o j [ s ] , the calculation of local errors δ j [ s ] for all layers;
  • clarification of all synaptic scales by the formula
    Δ w j i [ s ] = η δ j [ s ] x i [ s ] , s = 1 , 2 , 3 ;
  • input to the network input of the following method x, etc.
The learning process continues until the error at the neural network’s output is not sufficiently small and the weights are stabilized at a certain level. After training, the neural network acquires the ability to generalize, that is, it begins to correctly classify images that are not represented in the training set. This is the feature of multi-layered perceptrons, performing after training an arbitrary non-linear mapping of the space of inputs into the space of exits based on the approximation of complex multidimensional non-linear functions.
Thus, the backpropagation method consists of the following steps:
  • Initialization of synaptic weights with small random values.
  • Selecting the next training pair from the training set.
  • Feeding the input vector to the input of the network.
  • Network output calculation.
  • Calculate the difference between the network output and the required output.
  • Neural network weight adjustment to minimize error.
  • Iteration of the algorithm until the error is minimized.
The advantages of the chosen backpropagation architecture include ease of implementation and resistance to outliers and anomalies in the data. The disadvantages of the method include a possible long learning process and vulnerability to getting into the local minima of the error function.
During the experimental study of the model, the following architecture was chosen:
  • The number of input neurons is 48.
  • The number of hidden neurons is 72.
  • The number of output neurons is 24.

3.2. Data Analysis

In Ukraine, Lyme disease is subject to mandatory registration. A doctor who has identified a case of Lyme disease sends an emergency notification of an infectious patient to the Regional Center for Disease Control and Prevention of the Ministry of Health of Ukraine (RCDC). This document contains information about the patient, his full name, age, address, contact details, place of work and profession, date of seeking medical help, and the main symptoms of the disease when detected. The epidemiologist investigates the case and enters data into the case investigation forms focusing on infectious diseases and the cases of humans. In addition to information about the patient, information is provided on the alleged place, infection circumstances, and measures taken. Information about cases is stored in the RCDC in the form of these documents and aggregated form in annual reports on infectious diseases in each region.
In the RCDC, to conduct surveillance, field studies are carried out to collect ticks, after which laboratory studies (microscopic or PCR) of ticks are carried out to assess their infection. The data used in this study are stored at the Kharkiv RCDC and are available upon request.
The incidence of tick-borne infections, including Lyme disease, depends mainly on climatic-geographical and landscape zones of the area where the pathogen is circulating [58]. The territory of Ukraine is characterized by various natural zones (a zone of mixed forests, forest-steppe, steppe, mountains, etc.). The accuracy of the incidence prediction depends on the quality of the epidemiological data collected in a particular area [63]. Therefore, the study was conducted on the territory of only one region of Ukraine—Kharkiv, located in zones of forest-steppe and steppe.
We have analyzed the epidemic situation using official data from the Kharkiv RCDC. The information was analyzed and included data on cases of Lyme disease, their demographic characteristics (gender, age of the sick person), place of infection, number of people seeking medical help for a tick bite, infection of ticks taken from people and collected on blanket dragging and flagging, and the number of ticks on the studied territory.
In the Kharkiv region, the first case of Lyme disease was registered in 2000, and since then, epidemiological surveillance has been carried out. An epidemiological and entomological analysis from 2000 to 2015 showed that the incidence rate in the Kharkiv region exceeded those in the rest of Ukraine before 2005. Since 2006 there has been a steady increase in the incidence rate (Figure 3). In recent years, the epidemic situation with regard to Lyme disease has worsened in the Kharkiv region, and the number of cases continues to grow (from 2 cases in 2000 to 228 in 2015). During the period of epidemiological surveillance, there were 4 abrupt increases in the incidence rate in 2005, 2009, 2012, and 2015, with a gradual increase in rates over the next two to three years, except for 2014, when there was a 1.8-fold decrease in incidence compared with the previous year. In 2015, the incidence quadrupled.
On the territory of Ukraine, including the Kharkiv region, the primary vector of Lyme disease pathogens is the European tick I. ricinus, which dominates the territory of Ukraine. In the most active natural foci of Lyme disease in Ukraine, ticks infected with Borrelia reach 10–70%.
In the territory of the Kharkiv region, seven species of ixodid ticks are found, of which the most epidemiologically significant are three: I. ricinus (forest tick), Dermacentor reticulatus (meadow tick), and D. marginatus (pasture tick).
The most numerous and widespread throughout the region is I. ricus (86% of all tick collected in natural conditions), the D. reticulatis is 10%, and the D. marginatus is 4%. The number of ixodid ticks in natural conditions, which depends on the development cycle and several environmental factors, ranged from 12.1 per 1 km of the route in 2001 to 1.71 in 2012. Laboratory studies of ticks from nature and selected from domestic animals revealed 5.1% and 11.4% of ticks infected with Lyme disease pathogen B. burgdorferi, respectively.
A higher infection rate was established among the tick species in the D. marginatus (14.2%). However, given the small number and lower aggressiveness of the attack on humans, this species does not play a significant role in the Lyme disease epidemic process in the Kharkiv region.
During the analyzed period (from 2000 to 2015), the infection rate of all types of ticks with Borrelia increased from 4.4% to 23.9%. In 2014, the infection rate decreased to 21.4%, and the number of ticks (1.3 per 1 km of the route compared to 1.9 in 2013 and 1.93 in 2015).
For all the years of the epidemiological analysis of the incidence, the seasonality was observed with a maximum in May–July (46.9–58.5%). Tick sucking most often occurred in May–July (65.8%) and September-October (20.1%), which corresponds to the period of the most significant activity of ticks.
In 2014–2015, the number of persons infected in anthropurgic foci increased to 85.1% and 73.1%, respectively, while in previous years, their number was slightly less than 50%. The share of people infected in summer cottages and individual plots increased by 36.0% and 14.9%, respectively. Thus, it should be noted that Lyme disease is a relevant infection for the Kharkiv region with significant medical, social, and economic burdens.

4. Results

For the design of the software product, the methodology of functional modeling and the IDEF0 graphic notation, designed to formalize and describe business processes, was used. In Figure 4, the system is represented as interacting activities or functions. Such a purely functional orientation is fundamental—the functions of the system are analyzed independently of the objects they operate on. This allows you to model the logic and interaction of processes more clearly.
Also, to model the sequence of actions performed by the system in response to events initiated by some external objects, a use case diagram was built that describes the interaction between the user and the system (Figure 5).
To automate the prediction of Lyme disease incidence, a software complex using MatLab programming language has been developed, making it possible to calculate the predictive incidence of the neural network model in real-time.
The program complex includes three windows (one for data entry, the other for outputting the result), a file with initial data, and a file where all the results are recorded.
Baseline data are medical statistics on the Lyme disease cases registered in the Kharkiv region and the data of entomological monitoring. The data is available in the Kharkiv Regional Center for Disease Control and Prevention under the Ministry of Health of Ukraine.
To start the calculation of the forecast, the data necessary for the calculation must be entered. Next, the user must click on the Start button. The output will be read from the file FileData.mat, and the neural network training will begin. The results are shown in Figure 6, Figure 7 and Figure 8.
Figure 6 and Figure 7 show the retrospective projection of the incidence of Lyme disease at different scales. The graphs in red show the statistical data of intensive rates of incidence of Lyme disease, in green—the calculated forecast. Figure 8 shows the dynamics of the forecast error depending on the number of epochs of neural network training. As can be seen from the figure, the minimum error value is reached after the 170th epoch. After that, the decrease in the forecast error changes slightly.
The learning of the model took 22.14 s.
Mean absolute percentage error was calculated to estimate the forecasting accuracy.
M A P E = 100 % n t = 1 n | A t F t A t | ;
where At is the actual value and Ft is the forecast value.
The mean absolute percentage error is 3.79017%.
The model’s accuracy was checked by comparing the calculated predicted data on Lyme disease incidence and actual data on Lyme disease incidence in the Kharkiv region. The incidence data from 2000 to 2016 were taken as a training sample, and the forecast was built for 2017. For comparative analysis, models of epidemic processes implemented within the framework of the research project 2020.02/0404 on the topic “Development of intelligent technologies for assessing the epidemic situation to support decision-making within the population biosafety management” financed by the National Research Foundation of Ukraine were used. A compartmental approach was used to implement the model based on differential equations. The following population structure was used as compartments: Susceptible—Infected—Recovered for humans. To implement the multi-agent model, the same set of compartments and the geographical distribution of humans and ticks were used. For the software implementation of models of differential equations, binomial chains, and cellular automata, the C# language was used. The Python language was used for the software implementation of the moving average models, exponential smoothing, Brown’s polynomial model, and Holt’s adaptive model. To implement the multi-agent model, the AnyLogic environment was used.
Table 1 compares the methods and models of the Lyme disease epidemic process. As can be seen from the results, the machine learning approach has shown the most accurate results.
A software package has been developed that makes it possible to calculate the predicted incidence rate of Lyme disease based on machine learning, namely neural networks. The adequacy of the constructed forecast was tested on actual statistical data on Lyme disease incidence.
The calculated forecast shows the persistence of an unstable epidemiological situation for Lyme disease, which requires preventive measures at both the population level and individual protection, with the purpose to minimize the risk of people contacting ticks and reducing the incidence of Lyme disease.
The software product developed based on the model can be used for any territory and population group. The software product will increase the efficiency of decision-making regarding the implementation of preventive measures on the incidence of Lyme disease, which will reduce the incidence in the study area. Calculating the number of cases and the disease’s trajectory helps determine what interventions should be implemented and their volume. This will allow for the assessing of the financial and human resources to combat the epidemic dynamics effectively. A virtual test of the effectiveness of such measures will be the next stage of our study.
Taking into account the fact that epidemiological surveillance does not allow assessing the actual state of morbidity (slow introduction of laboratory diagnosis of Lyme disease, errors in clinical diagnosis, etc.), predicting the dynamics of morbidity, the epidemic process forecast model makes it possible to assess the epidemic situation, with the revealed dynamics of the increase in morbidity in resource-limited settings, the most effective non-specific prevention methods can be strengthened, which include, at the population level, the control of tick vectors in endemic foci; at the individual level—individual protection of a person from tick attacks, as well as sanitary and educational work among the population.
Tick control in an endemic area includes:
  • Creation of unfavorable conditions for the habitat of carriers of Lyme disease—clearing and landscaping of forest areas (clearing debris, removing deadwood, brushwood, undersized shrubs, mowing grass).
  • Carrying out extermination measures (disinfestation, the use of a chemical method of combating ticks, deratization, the destruction of hosts of tick larvae and nymphs).
Extermination measures are carried out only according to epidemiological indications in limited volumes in the locations of health facilities for children and adults, in places of permanent residence of professionally threatened contingents, recreation and tourism centers, campsites, motels, gardening cooperatives, as well as in forest areas, the most frequently visited by the population for domestic and other purposes, where the infection of Lyme disease most often occurs.
Individual protection of a person from the attack of ticks should include:
  • systematic self- and mutual examination of clothing and body, which is extremely important for preventing ticks from being sucked. They are held every two hours of being in a natural focus without taking off their clothes;
  • timely and correct removal of sucked ticks, if possible, in a medical facility;
  • wearing protective clothing while staying in dangerous areas of the natural focus;
  • impregnation of clothing with repellents or insect repellents. After contact with the treated fabric, after 3–5 min, all attached ticks become incapable of suction and fall off the clothes. You can scare away many ticks by applying repellent aerosols to clothing with encircling stripes.
In the case of establishing the fact of suction of a tick in which Borrelia are detected, emergency prophylaxis with antibiotics is carried out.
Sanitary and educational work among the population. The main tasks of sanitary and educational work include:
  • formation among the population of an understanding of the severity of the course of the disease and its consequences;
  • instilling basic knowledge about the ways of infection, methods of collective and individual protection against ticks, the importance of emergency prevention of Lyme disease;
  • developing the population’s skills to conduct self- and mutual examinations in endemic foci and use protective clothing, special dressing of ordinary clothing, individual protection against ticks, including the use of repellents.
To prevent infection with Lyme disease, the focus of public health education is on the following points:
  • features of the attack of ixodid ticks on humans;
  • the importance of measures of individual protection against ticks and the order of their application;
  • the need to quickly remove a tick attached to the body by a medical professional or on their own, and in this case, immediately contact a doctor.
Under climate change conditions, the epidemic situation of tick-borne infections is steadily changing. Our approach makes it possible to predict the epidemic situation without an additional measurement of climate parameters, using indicators of the number of ticks and their infection with borrelia to build a model. The use of the model contributes to closing a serious gap in understanding the spread of Lyme borreliosis in specific spatial and temporal conditions, assessing the risks of Lyme disease in humans, and mitigating the impact of tick-borne infections in the future. The model’s value is increasing in the context of the COVID-19 pandemic. On the one hand, the introduction of restrictions on indoor gatherings of large groups forces people to spend more time in various recreational areas where there is a high risk of being bitten by an infected tick. On the other hand, the initial symptoms of Lyme disease are similar to coronavirus infection—fatigue, low temperature, muscle and joint pain, which can lead to a misdiagnosis. However, untreated Lyme borreliosis can lead to serious heart, nervous system, and muscles complications.
Forecasting is of particular importance in the conditions of hostilities that are currently taking place in Ukraine, including in endemic territories. In war conditions, medical and public health institutions that conduct surveillance cannot operate at total capacity due to destruction due to the evacuation of personnel, the danger of conducting field research on ticks on the battlefield, etc. Fighters and the public are out in nature and are at risk of being attacked by ticks and becoming infected with Lyme disease, placing additional strain on health care facilities.
The use of the developed mathematical model makes it possible to eliminate gaps in surveillance and make a rational management decision on the prevention of Lyme disease.

5. Discussion

The burden of Lyme disease is increasing all the time. Approximately 476,000 Americans are diagnosed and treated for Lyme disease each year [64]. The calculated population-weighted average incidence rate for the regional burden of Lime Borreliosis in Western Europe was 22.05 cases per 100,000 person-years [65]. After the illness, some patients have symptoms that worsen their quality of life for a long time [66,67,68].
Also, Lyme disease caused significant economic damage. Review [69] indicates a significant annual national economic impact of 735,550 USD for Scotland (0.14 USD per capita, population = 5.40 M), 142,562 USD in Sweden (0.014 USD per capita, 9.96 M), 40.88 M USD in Germany (0.51 USD per capita, 80.59 M), 23.12 M USD in the Netherlands (1.36 USD per capita, 17.08 M), and up to 786 M USD in the US (2.41 USD per capita, 326.63 M). one patient in 2018 was estimated at ∼582.39 euros, which was 53.10% of the average monthly salary in that year [70].
To reduce the damage caused by the disease, it is necessary to take timely, rational preventive measures to prevent the disease because there is no specific treatment and specific prevention of this disease. To select the most effective measures that can effectively affect the incidence, it is advisable to resort to mathematical modeling. In this article, we presented a model based on neural networks. We took into account that Lyme disease is a natural focal disease. Port’s dictionary indicates that the concept of natural foci of infection is “a focus existing outside a human population (e.g., in domestic or wild animals) often transmitted by a vector; humans can be infected if they enter such a biotope” [71]. Therefore, ecological links between the vector (mites) and the host play an important role. When building the model, we considered the number of ticks, a load of Borrelia in ticks, the number of ticks collected on the flag, the geographical distribution of ticks, and the number of infected ticks collected from people.
Despite the high accuracy of the model in comparison with other models and methods for predicting the epidemic process of Lyme disease, shown in Table 1, models based on the machine learning approach are a “black box”. Machine learning models based on complex algorithms do not store everything in memory blocks like conventional computers. This means that it is impossible to identify patterns and principles of work within the model because the model is constantly learning. Thus, the solution in the form of an output signal is formed in the model based on the input signal. That’s why they do not identify the factors that affect the spread of the disease and their information content. Therefore, a promising direction of research is the combination of the proposed model with other approaches that allow for the conducting of experimental studies with the influence of the factors of the epidemic process. Such models can be multi-agent and deterministic. In the general case, the concept of the approach to combining multi-agent and machine learning models is described by us in [72]. Combining different approaches will improve the accuracy of classical and multi-agent models through a model using a neural network and identify which factors should be influenced by public health authorities to reduce epidemic morbidity.
The use of automated means for the surveillance of Lyme disease gained particular importance with the outbreak of the war in Ukraine.
History knows numerous examples of the impact of wars on the spread of vector-borne diseases [73,74]. War stimulates the epidemic process and directly impacts the main drivers of the epidemic process and indirectly through the disorganization of the economy and the weakening of medical and sanitary measures associated with the disruption of the work of medical and preventive institutions.
The war started in Ukraine at the end of February, 2022, leads to complications of the epidemic situation concerning various infections, including the creation of conditions for the activation of the natural and endemic foci of Lyme disease. There are a number of reasons for this, an increase in the number of the main hosts of ticks and an increase in the density of vectors (after the battle, corpses, unused dry rations with food remain on the battlefield, which creates additional conditions for the reproduction of rodents—hosts of ticks), the presence of troops and the population in natural conditions, often without sufficient protection, the colors of military uniforms do not contribute to the rapid detection of ticks on clothing, there is no time and opportunity to conduct self- and mutual examinations for the presence of ticks, etc. It is necessary to predict epidemic situations that may arise due to hostilities when deploying troops in different climatic and geographical regions endemic to Lyme disease. This approach makes it possible to exclude unexpected epidemic situations and take the necessary preventive measures promptly.
Under the conditions of hostilities, an automated forecasting system makes it possible to accurately assess the epidemic situation without additional field and laboratory studies, in order to make an optimal management decision based on the results obtained, and to carry out reasonable preventive and anti-epidemic measures, thereby reducing sanitary losses in the troops and preventing the incidence of the population.

6. Conclusions

A software package has been developed that makes it possible to calculate the predicted incidence rate of Lyme disease based on machine learning. The adequacy of the constructed forecast was tested on actual statistical data on Lyme disease incidence. The prediction error was calculated at 3.8% (mean absolute percentage error). Learning of the model took 22 s.
The results of forecasting show the persistence of an unstable epidemiological situation for Lyme disease in the Kharkiv region (Ukraine), which requires preventive measures at both the population level and individual protection. Measures to reduce the epidemic incidence in the study area were determined.
On 24 February 2022, the war began in Ukraine. Under war conditions, medical and public health institutions that conduct surveillance cannot operate at total capacity due to destruction, the evacuation of personnel, the danger of conducting field research on ticks on the battlefield, etc. Therefore, an automated solution for predicting the epidemic process of Lyme disease, which is proposed in the framework of this study, has become even more relevant.
Future research. A promising direction for future research is to combine the proposed model of the epidemic process of Lyme disease with a model based on a multi-agent approach. This will not only allow the building of high-precision forecasts of the dynamics of the epidemic process in the selected area, but also to conduct experimental studies to identify factors influencing the dynamics of the epidemic process, evaluate their information content, and evaluate the effectiveness of certain control measures to reduce the epidemic incidence of Lyme disease.

Author Contributions

Conceptualization, D.C.; methodology, D.C. and T.C.; software, P.P.; validation, D.C. and P.P.; formal analysis, T.C.; investigation, D.C.; resources, T.C.; data curation, M.S.; writing—original draft preparation, D.C.; writing—review and editing, T.C.; visualization, P.P.; supervision, T.C.; project administration, D.C.; funding acquisition, D.C. All authors have read and agreed to the published version of the manuscript.

Funding

The study was funded by the National Research Foundation of Ukraine in the framework of the research project 2020.02/0404 on the topic “Development of intelligent technologies for assessing the epidemic situation to support decision-making within the population biosafety management”.

Institutional Review Board Statement

Not applicable.

Informed Consent Statement

Not applicable.

Data Availability Statement

The data used in this study are stored at the Kharkiv Center for Disease Control and Prevention of the Ministry of Health of Ukraine and are available upon request.

Acknowledgments

The authors would like to acknowledge the United States Department of Defense, Defense Threat Reduction Agency (DTRA), and Ukraine Biological Threat Reduction Program (BTRP) for their assistance and financial support in publication of this paper. While DTRA/BTRP did not support the research described in this publication, the Program supported the manuscript development and publication. The contents of this publication are the responsibility of the authors and do not necessarily reflect the views of DTRA or the United States Government.

Conflicts of Interest

The authors declare that they have no conflict of interest.

Appendix A

Table A1. Current state of Lyme disease simulation.
ModelTaskOutcomeApproach
Porto T. (1999) [47]To define the threshold condition for a disease to enter a non-enzootic area depending on the various possible chains of transmission operating during the year.Mathematical model of the life history of the tick to quantify the relative contributions of various transmission chains throughout the year.Differential equations
Kurtenback K., et al., (2006) [48]To study how external factors and internal dynamics shape populations of B. burgdorferi sl.Possible epidemiological parallels between B. burgdorferi sl and other transmissible zoonotic pathogens are described.Compartmental model
Wang W., Zhao X.Q. (2015) [49]To formulate a mathematical model of Lyme disease, including a spatially heterogeneous structure.It has been shown that the basic reproduction number R0 serves as a threshold value between extinction and persistence in the evolution of Lyme disease.Differential equations
Bisanzio D., et al., (2010) [50]To describe the distribution of Ixodes ricinus ticks on mice and lizards from two independent studies.The extreme aggregation of vectors on hosts, described by the power-law decay of the degree distribution, makes the epidemic threshold decrease with the size of the network and vanish asymptotically.Bipartite networks
Gaff H., et al., (2020) [51]To upgrade the LYMESIM model to mimic the I. scapularis life cycle and transmission dynamics of B. burgdorferi.ss, which includes several modifications to increase the biological realism of the model and produce results that are easier to measure in the field.The model showed the importance of temperature in host detection for nymph density, the importance of transmission from small mammals to ticks for the density of infected nymphs, and the survival of ticks as a function of temperature.Compartmental model
Hart T.M., et al., (2021) [52]To reveal the mechanisms of tropism of the host of Lyme disease.Different types of Lyme disease bacteria differ in their ability to survive in mice and quails, as well as in ticks that feed on human or quail blood after transmission.Molecular study
Lou Y, Wu J., Wu X. (2014) [53]To understand the combined effect of seasonal temperature fluctuations and host community composition on transmission of the Lyme disease pathogen.The relationship between host community biodiversity and disease risk varies, requiring more accurate measurements of the local environment, both biotic and abiotic.Compartmental model
Belli A., et al., (2017) [54]To test whether ticks that acquire Lyme disease pathogens through co-feeding are infective to vertebrate hosts.B. afzelii may use a co-feeding transfer to complete its life cycle.Vector study
Lis S., et al., (2016) [55]To study the temperature-driven seasonality of Ixodes ricinus ticks and the transmission of B. burgdorferi sl in mainland Scotland.The risk of Lyme disease currently peaks in the fall, about six weeks after the temperature peaks.Multiagent model
Zhang Y., Zhao X.Q. (2013) [56]To study the reaction-diffusion model of Lyme disease taking into account seasonality.In the case of a bounded habitat, we obtain a threshold result on the global stability of either disease-free or endemic periodic solution. In the case of an unbounded habitat, we establish the existence of the disease spreading speed and its coincidence with the minimal wave speed for time-periodic traveling wave solutions.Compartmental model
Imai C., et al., (2015) [57]To study changes in immune population, strong autocorrelations, a wide range of plausible lag structures and association patterns, seasonality adjustments, large overdispersion.For overdispersed models, alternative distribution models such as quasi-Poisson and negative binomial should be considered.Time series regression
Dumic I., Severnini E. (2018) [58]To investigate how the activity of ticks and their survival depend on temperature and humidity.A significant effect of temperature on the incidence of Lyme disease has been found. These impacts can be roughly described by an inverted U-shaped relationship consistent with tick survival patterns and host-seeking behavior.Panel regression model
Ogden N.H., et al., (2018) [59]To study the factors that determine seasonality in a multi-year study in seven areas of the geographic range of I. scapularisTemperature-independent diapause mechanisms explain some key observed variations in I. scapularis seasonality, and are responsible in part for geographic variations in I. scapularis seasonality in the United States.Binomial regression model
Zhao G.P., et al., (2021) [60]To understand the ecological niches of major tick species and common tick-borne pathogens.Suitable habitats for the 19 tick species are 14–476% larger in size than the geographic areas where these species were detected, indicating severe under-detectionMachine learning
Nguyen A., Mahaffy J., Vaidya N.K. (2019) [61]To study interactions between the main Lyme disease vectors involved: black-footed ticks (I. scapularis), white-footed mice (Peromyscus leucopus) and white-tailed deer (Odocoileus virginianus).The presence of multiple vectors can have a significant impact on the dynamics and spread of Lyme disease.Compartmental model
Bobe J.R., et al., (2021) [62]To investigate the prevention, diagnosis and treatment of Lyme disease during COVID-19 pandemic.COVID-19 may further complicate diagnosis of Lyme disease since non-specific symptoms in these two conditions overlap and people may be spending more time outdoors.Various approaches

References

  1. Sprong, H.; Azagi, T.; Hoornstra, D.; Nijhof, A.; Knorr, S.; Baarsma, M.; Hovius, J. Control of Lyme borreliosis and other Ixodes ricinus-borne diseases. Parasites Vectors 2018, 11, 1–16. [Google Scholar] [CrossRef] [PubMed] [Green Version]
  2. Eisen, R.; Eisen, L. The Blacklegged Tick, Ixodes scapularis: An Increasing Public Health Concern. Trends Parasitol. 2018, 34, 295–309. [Google Scholar] [CrossRef] [PubMed]
  3. Jutras, B.; Lochhead, R.; Kloos, Z.; Biboy, J.; Strle, K.; Booth, C.J.; Govers, S.K.; Gray, J.; Schumann, P.; Vollmer, W.; et al. Borrelia burgdorferipeptidoglycan is a persistent antigen in patients with Lyme arthritis. Proc. Natl. Acad. Sci. USA 2019, 116, 13498–13507. [Google Scholar] [CrossRef] [PubMed] [Green Version]
  4. World Health Organization. International Statistical Classification of Diseases and Related Health Problems. 2016. Available online: https://apps.who.int/iris/handle/10665/246208 (accessed on 18 November 2021).
  5. Ben, I.; Lozynskyi, I. Prevalence of Anaplasma phagocytophilumin Ixodes ricinusand Dermacentor reticulatusand Coinfection with Borrelia burgdorferiand Tick-Borne Encephalitis Virus in Western Ukraine. Vector-Borne Zoonotic Dis. 2019, 19, 793–801. [Google Scholar] [CrossRef] [Green Version]
  6. Best, S.; Tschaepe, M.; Wilson, K. Investigation of the performance of serological assays used for Lyme disease testing in Australia. PLoS ONE 2019, 14, e0214402. [Google Scholar] [CrossRef]
  7. Shapiro, E.; Wormser, G. Lyme Disease in 2018. JAMA 2018, 320, 635–636. [Google Scholar] [CrossRef]
  8. Rogovskyy, A.; Biatov, A.; Davis, M.; Liu, S.; Nebogatkin, I. Upsurge of Lyme borreliosis in Ukraine: A 20-year survey. J. Travel Med. 2020, 27, taaa100. [Google Scholar] [CrossRef]
  9. Wilhelmsson, P.; Lindgren, P.E. Detection of a novel Lyme borreliosis pathogen. Lancet. Infect. Dis. 2016, 16, 511–512. [Google Scholar] [CrossRef]
  10. Bobbi, S.P.; Mead, P.S.; Johnson, D.K.H.; Neitzel, D.F.; Respicio-Kingry, L.B.; Davis, J.P.; Schiffman, E.; Sloan, L.M.; Schriefer, M.E.; Replogle, A.J.; et al. Identification of a novel pathogenic Borrelia species causing Lyme borreliosis with unusually high spirochaetaemia: A descriptive study. Lancet. Infect. Dis. 2016, 16, 556–564. [Google Scholar] [CrossRef] [Green Version]
  11. Kullberg, B.J.; Vrijmooeth, H.D.; Schoor, F.V.D.; Hovius, J.W. Lyme borreliosis: Diagnosis and management. BMJ 2020, 369, m1041. [Google Scholar] [CrossRef]
  12. Schotthoefer, A.M.; Frost, H.M. Ecology and Epidemiology of Lyme Borreliosis. Clin. Lab. Med. 2015, 35, 723–743. [Google Scholar] [CrossRef] [PubMed]
  13. Sanchez, J.L. Clinical manifestations and treatment of Lyme disease. Clin. Lab. Med. 2015, 35, 765–778. [Google Scholar] [CrossRef] [PubMed]
  14. Wijngaard, C.C.V.D.; Hofhuis, A.; Simoes, M.; Rood, E.; Pelt, W.V.; Zeller, H.; Bortel, W.V. Surveillance perspective on Lyme borreliosis across the European Union and European economic area. Euro Surveill. Eur. Commun. Dis. Bull. 2017, 22, 30569. [Google Scholar] [CrossRef] [PubMed]
  15. Lindergen, E.; Jaenson, T.G.T. Lyme Borreliosis in Europe. Influences of Climate and Climate Change, Epidemiology, Ecology and Adaptation Measures; World Health Organization: Copenhagen, Denmark, 2006; p. 34. [Google Scholar]
  16. Kugeler, K.J.; Farley, G.M.; Forrester, J.D.; Mead, P.S. Geographic distribution and expansion of human Lyme disease, United States. Emerg. Infect. Dis. 2015, 21, 1455–1457. [Google Scholar] [CrossRef]
  17. Steinbrink, A.; Brugger, K.; Margos, G.; Kraiczy, P.; Klimpel, S. The evolving story of Borrelia burgdorferi sensu lato transmission in Europe. Parasitol. Res. 2022, 121, 781–803. [Google Scholar] [CrossRef]
  18. Petrulioniene, A.; Radzisauskiene, D.; Ambrozaitis, A.; Caplinskas, S.; Paulauskas, A.; Venalis, A. Epidemiology of Lyme disease in highly endemic European zone. Medicina 2020, 56, 115. [Google Scholar] [CrossRef] [Green Version]
  19. Rizolli, A.; Hauffe, H.; Carpi, G.; Vourc, G.H.; Neteler, M.; Rosa, R. Lyme borreliosis in Europe. Euro Surveill. Eur. Commun. Dis. Bull. 2011, 16, 19906. [Google Scholar] [CrossRef]
  20. Bacon, R.M.; Kugeler, K.J.; Mead, P.S. Surveillance for Lyme disease—United States, 1992–2006. Morbidity and mortality weekly report. Surveill. Summ. 2008, 57, 1–9. [Google Scholar]
  21. Cook, M.J.; Puri, B.K. Estimates for Lyme borreliosis infections based on models using sentinel canine and human seroprevalence data. Infect. Dis. Model. 2020, 5, 871–888. [Google Scholar] [CrossRef]
  22. Estrada-Pena, A.; Cutler, S.; Potkonjak, A.; Vassier-Tussaut, M.; Bortel, W.V.; Zeller, H.; Fernandez-Ruiz, N.; Mihalca, A.D. An updated meta-analysis of the distribution of Borrelia burgorferi s.l. in ticks in Europe. Int. J. Health Geogr. 2018, 17, 41. [Google Scholar] [CrossRef] [Green Version]
  23. Bedson, J.; Skrip, L.A.; Pedi, D.; Abramowitz, S.; Carter, S.; Jalloh, M.F.; Funk, S.; Gobat, N.; Giles-Vernick, T.; Chowell, G.; et al. A review and agenda for integrated disease models including social and behavioral factors. Nat. Hum. Behav. 2021, 5, 834–846. [Google Scholar] [CrossRef] [PubMed]
  24. Ross, R. An application of the theory of probabilities to the study of a priori pathometry. Proc. R. Soc. Lond. 1916, 92, 204–230. [Google Scholar] [CrossRef] [Green Version]
  25. Hamer, W. The Milroy lectures on epidemic disease in England—The evidence of variability and of persistency of type. Lancet 1906, 167, 569–574. [Google Scholar] [CrossRef]
  26. Kermack, W.O.; McKendrick, A.G. Contribution to the mathematical theory to epidemics. Proc. R. Soc. Lond. 1927, 115, 700–721. [Google Scholar] [CrossRef] [Green Version]
  27. Dietz, K.; Heesterbeek, J. Daniel Bernoulli’s epidemiological model revisited. Math. Biosci. 2002, 180, 1–21. [Google Scholar] [CrossRef] [Green Version]
  28. Fine, P. John Brownlee and the Measurement of Infectiousness: An Historical Study in Epidemic Theory. J. R. Stat. Soc. 1979, 142, 347. [Google Scholar] [CrossRef]
  29. Santillana, M.; Tuite, A.; Nasserie, T.; Fine, P.; Champredon, D.; Chindelevitch, L.; Dushoff, J.; Fisman, D. Relatedness of the incidence decay with exponential adjustment (IDEA) model, “Farr’s law” and SIR compartmental difference equation models. Infect. Dis. Model. 2018, 3, 1–12. [Google Scholar] [CrossRef]
  30. Urabe, C.; Tanaka, G.; Aihara, K.; Mimura, M. Parameter Scaling for Epidemic Size in a Spatial Epidemic Model with Mobile Individuals. PLoS ONE 2016, 11, e0168127. [Google Scholar] [CrossRef] [Green Version]
  31. Baroyan, O.; Rvachev, L.; Basilevsky, U.; Ermakov, V.; Frank, K.; Rvachev, M.; Shashkov, V. Computer modelling of influenza epidemics for the whole country (USSR). Adv. Appl. Probab. 1971, 3, 224–226. [Google Scholar] [CrossRef]
  32. Brauer, F. The Kermack–McKendrick epidemic model revisited. Math. Biosci. 2005, 198, 119–131. [Google Scholar] [CrossRef]
  33. Douglas, J.; Bianco, S.; Edlund, S.; Engelhardt, T.; Filter, M.; Gunther, T.; Hu, K.M.; Nixon, E.J.; Sevilla, N.L.; Swaid, A.; et al. STEM: An Open Source Tool for Disease Modeling. Health Secur. 2019, 17, 291–306. [Google Scholar] [CrossRef] [PubMed]
  34. Eichner, M.; Schwehm, M.; Duerr, H.; Brockmann, S. The influenza pandemic preparedness planning tool InfluSim. BMC Infect. Dis. 2017, 7, 1–14. [Google Scholar] [CrossRef] [PubMed] [Green Version]
  35. Kendall, D. Deterministic and Stochastic Epidemics in Closed Populations. In Proceedings of the Third Berkeley Symposium on Mathematical Statistics and Probability, Berkeley, CA, USA, July–August 1955; pp. 149–165. [Google Scholar]
  36. Smith, D.; Battle, K.; Hay, S.; Barker, C.; Scott, T.; McKenzie, F. Ross, Macdonald, and a Theory for the Dynamics and Control of Mosquito-Transmitted Pathogens. PLoS Pathog. 2012, 8, e1002588. [Google Scholar] [CrossRef] [PubMed] [Green Version]
  37. Bailey, N. The simulation of stochastic epidemics in two dimensions. In Proceedings of the Fifth Berkeley Symposium on Mathematical Statistics and Probability, Berkeley, CA, USA, June–July 1967; pp. 237–257. [Google Scholar]
  38. Becker, N. A General Chain Binomial Model for Infectious Diseases. Biometrics 1981, 37, 251. [Google Scholar] [CrossRef]
  39. Chao, D.; Halloran, M.; Obenchain, V.; Longini, I. FluTE, a Publicly Available Stochastic Influenza Epidemic Simulation Model. PLoS Comput. Biol. 2010, 6, e1000656. [Google Scholar] [CrossRef] [Green Version]
  40. Longini, I.; Halloran, M.E.; Nizam, A.; Yang, Y.; Xu, S.; Burke, D.S.; Cummings, D.A.T.; Epstein, J.M. Containing a large bioterrorist smallpox attack: A computer simulation approach. Int. J. Infect. Dis. 2007, 11, 98–108. [Google Scholar] [CrossRef] [Green Version]
  41. Cooley, P.; Roberts, D.; Bakalov, V.; Bikmal, S.; Cantor, S.; Costandine, T.; Ganapathi, L.; Golla, B.J.; Grubbs, G.; Hollingsworth, C.; et al. The Model Repository of the Models of Infectious Disease Agent Study. IEEE Trans. Inf. Technol. Biomed. 2008, 12, 513–522. [Google Scholar] [CrossRef] [Green Version]
  42. Nguyen, D.; Deguchi, H.; Ichikawa, M. Agent-based simulation on avian influenza in Vietnam: Basic characteristics of the epidemic and efficiency evaluation of control measures. In Proceedings of the 7Th International Conference on Service Systems and Service Management, Tokyo, Japan, 28–30 June 2010. [Google Scholar] [CrossRef]
  43. Ohkusa, Y.; Sugawara, T.; Taniguchi, K.; Okabe, N. Real-time estimation and prediction for pandemic A/H1N1(2009) in Japan. J. Infect. Chemother. 2011, 17, 468–472. [Google Scholar] [CrossRef]
  44. Zhu, G.; Fu, X.; Chen, G. Global attractivity of a network-based epidemic SIS model with nonlinear infectivity. Commun. Nonlinear Sci. Numer. Simul. 2012, 17, 2588–2594. [Google Scholar] [CrossRef]
  45. Ni, P.H.; Ye, X.W. Nonlinear finite element model updating with a decentralized approach. Smart Struct. Syst. 2019, 24, 683–692. [Google Scholar] [CrossRef]
  46. Ni, P.; Han, Q.; Du, X.; Cheng, X. Bayesian Model Updating of Civil Structures with Likelihood-Free Inference Approach and Response Reconstruction Technique. Mech. Syst. Signal Processing 2022, 164, 108204. [Google Scholar] [CrossRef]
  47. Porto, T.C. A mathematical model of the ecology of Lyme disease. IMA J. Math. Appl. Med. Biol. 1999, 16, 261–296. [Google Scholar]
  48. Kurtenback, K.; Hanincova, K.; Tsao, J.I.; Margos, G.; Fish, D.; Ogden, N.H. Fundamental processes in the evolutionary ecology of Lyme borreliosis. Nat. Rev. Microbiol. 2006, 4, 660–669. [Google Scholar] [CrossRef] [PubMed]
  49. Wang, W.; Zhao, X.Q. Spatial invasion threshold of Lyme disease. SIAM J. Appl. Math. 2015, 75, 1142–1170. [Google Scholar] [CrossRef]
  50. Bisanzio, D.; Bertolotti, L.; Tomassone, L.; Amore, G.; Ragagli, C.; Mannelli, A.; Giacobini, M.; Provero, P. Modeling the Spread of Vector-Borne Diseases on Bipartite Networks. PLoS ONE 2010, 5, e13796. [Google Scholar] [CrossRef] [PubMed]
  51. Gaff, H.; Eisen, R.J.; Eisen, L.; Nadolny, R.; Bjork, J.; Monaghan, A.J. LYMESIM 2.0: An Updated Simulation of Blacklegged Tick (Acari: Ixodidae) Population Dynamics and Enzootic Transmission of Borrelia burgdorferi (Spirochaetales: Spirochaetaceae). J. Med. Entomol. 2020, 57, 715–727. [Google Scholar] [CrossRef]
  52. Hart, T.M.; Dupuis, A.P., II; Tufts, D.M.; Blom, A.M.; Starkey, S.R.; Rego, R.O.M.; Ram, S.; Kraiczy, P.; Kramer, L.D.; Diuk-Wasser, M.A.; et al. Host tropism determination by convergent evolution of immunological evasion in the Lyme disease system. PLoS Pathog. 2021, 17, e1009801. [Google Scholar] [CrossRef]
  53. Lou, Y.; Wu, J.; Wu, X. Impact of biodiversity and seasonality on Lyme-pathogen transmission. Theor. Biol. Med. Model. 2014, 11, 50. [Google Scholar] [CrossRef] [Green Version]
  54. Belli, A.; Sarr, A.; Rais, O.; Rego, R.O.M.; Voordouw, M.J. Ticks infected via co-feeding transmission can transmit Lyme borreliosis to vertebrate hosts. Sci. Rep. 2017, 7, 5006. [Google Scholar] [CrossRef]
  55. Li, S.; Gilbert, L.; Harrison, P.A.; Rounsevell, M.D.A. Modelling the seasonality of Lyme disease risk and the potential impacts of a warming climate within the heterogeneous landscapes of Scotland. J. R. Soc. Interface 2016, 13, 20160140. [Google Scholar] [CrossRef] [Green Version]
  56. Zhang, Y.; Zhao, X.Q. A reaction-diffusion Lyme disease model with seasonality. SIAM J. Appl. Math. 2013, 73, 2077–2099. [Google Scholar] [CrossRef]
  57. Imai, C.; Armstrong, B.; Chalabi, Z.; Mangtani, P.; Hashizume, M. Time series regression model for infectious disease and weather. Environ. Res. 2015, 142, 319–327. [Google Scholar] [CrossRef] [PubMed] [Green Version]
  58. Dumic, I.; Severnini, E. “Ticking Bomb”: The impact of climate change on the incidence of Lyme disease. Can. J. Infect. Dis. Med. Microbiol. 2018, 2018, 5719081. [Google Scholar] [CrossRef] [PubMed] [Green Version]
  59. Ogden, N.H.; Pang, G.; Ginsberg, H.S.; Hickling, G.J.; Burke, R.L.; Beati, L.; Tsao, J.I. Evidence for geographic variation in life-cycle processes affecting phenology of the Lyme disease vector Ixodes scapularis (Acari: Ixodidae) in the United States. J. Med. Entomol. 2018, 55, 1386–1401. [Google Scholar] [CrossRef] [Green Version]
  60. Zhao, G.P.; Wang, Y.X.; Fan, Z.W.; Ji, Y.; Liu, M.-J.; Zhang, W.-H.; Li, X.-L.; Zhou, S.-X.; Li, H.; Liang, S.; et al. Mapping ticks and tick-borne pathogens in China. Nat. Commun. 2021, 12, 1075. [Google Scholar] [CrossRef]
  61. Nguyen, A.; Mahaffy, J.; Vaidya, N.K. Modeling transmission dynamics of Lyme disease: Multiple vectors, seasonality, and vector mobility. Infect. Dis. Model. 2019, 4, 28–43. [Google Scholar] [CrossRef]
  62. Bobe, J.R.; Jutras, B.L.; Horn, E.J. Recent Progress in Lyme Disease and Remaining Challenges. Front. Med. 2021, 8, 666554. [Google Scholar] [CrossRef]
  63. Waits, A.; Emelyanova, A.; Oksanen, A.; Abass, K.; Rautio, A. Human infectious diseases and the changing climate in the Arctic. Environ. Int. 2018, 121, 703–713. [Google Scholar] [CrossRef]
  64. Why is CDC concerned about Lyme disease? Atlanta: Centers for Disease Control and Prevention. 2021. Available online: https://www.cdc.gov/lyme/why-is-cdc-concerned-about-lyme-disease.html (accessed on 16 February 2022).
  65. Sykes, R.A.; Makiello, P. An estimate of Lyme borreliosis incidence in Western Europe. J. Public Health 2017, 39, 74–81. [Google Scholar] [CrossRef] [Green Version]
  66. Rebman, A.W.; Aucott, J.N. Post-treatment Lyme disease as a model for persistent symptoms in Lyme disease. Front. Med. 2020, 7, 57. [Google Scholar] [CrossRef] [Green Version]
  67. Predkele, N.; Mednieks, J. Lyme disease and associated NMDAR Encephalitis: A case report and literature review. Neurol. Int. 2021, 13, 487–496. [Google Scholar] [CrossRef] [PubMed]
  68. Mac, S.; Evans, G.A.; Patel, S.N.; Pullenayegum, E.M.; Sander, B. Estimating the population health burden of Lyme disease in Ontario, Canada: A microsimulation modelling approach. CMAJ Open 2021, 9, e1005–e1012. [Google Scholar] [CrossRef] [PubMed]
  69. Mac, S.; Silva, S.R.D.; Sander, B. The economic burden of Lyme disease and the cost-effectiveness of Lyme disease interventions: A scoping review. PLoS ONE 2019, 14, e0210280. [Google Scholar] [CrossRef] [PubMed]
  70. Rogalska, A.M.; Pawelczyk, O.; Solarz, K.; Holecki, T. What are the cost of diagnostics and treatment of Lyme Borreliosis in Poland? Front. Public Health 2021, 8, 599239. [Google Scholar] [CrossRef]
  71. Porta, M. A Dictionary of Epidemiology; Oxford University Press: New York, NY, USA, 2014; p. 376. [Google Scholar]
  72. Yakovlev, S.; Bazilevych, K.; Chumachenko, D.; Chumachenko, T.; Hulianytskyi, L.; Meniailov, I.; Tkachenko, A. The concept of developing a decision support system for the epidemic morbidity control. CEUR Workshop Proc. 2020, 2753, 265–274. [Google Scholar]
  73. Pages, F.; Faulde, M.; Orlandi-Pradines, E.; Parola, P. The past and present threat of vector-borne diseases in deployed troops. Clin. Microbiol. Infect. 2010, 16, 209–224. [Google Scholar] [CrossRef] [Green Version]
  74. Tarnas, M.C.; Desai, A.N.; Lassmann, B.; Abbara, A. Increase in vector-borne disease reporting affecting humans and animals in Syria and neighboring countries after the onset of conflict: A ProMED analysis 2003–2018. Int. J. Infect. Dis. 2020, 102, 103–109. [Google Scholar] [CrossRef]
Figure 1. Results of analysis of epidemic processes simulation.
Applsci 12 04282 g001
Figure 2. Neural network architecture for simulation the dynamics of the spread of the incidence of Lyme disease.
Applsci 12 04282 g002
Figure 3. Incidence rate of Lyme disease in the Kharkiv region (per 100 thousands of population).
Applsci 12 04282 g003
Figure 4. The context diagram of a software product.
Applsci 12 04282 g004
Figure 5. Use cases diagram.
Applsci 12 04282 g005
Figure 6. Forecasting results window.
Applsci 12 04282 g006
Figure 7. Forecasting results.
Applsci 12 04282 g007
Figure 8. Error change during the training.
Applsci 12 04282 g008
Table 1. Accuracy of the Lyme disease epidemic process models.
ApproachAverage Absolute Prediction Error
Differential equations21.4%
Binomial chains18.3%
Cellular automata17.2%
Moving average method14.6%
Exponential smoothing11.2%
Brown polynomial model10.8%
Adaptive Holt model10.2%
Multiagent approach5.0%
Neural network approach3.8%
Publisher’s Note: MDPI stays neutral with regard to jurisdictional claims in published maps and institutional affiliations.

