
Linear Programming Coordination for Overcurrent Relay in Electrical Distribution Systems with Distributed Generation

 , ,
, ,  and
and
Abstract
:1. Introduction
- the most significant impacts that DG causes on protection devices are analyzed,
- an adjustment method for OCRs based on LP techniques is proposed,
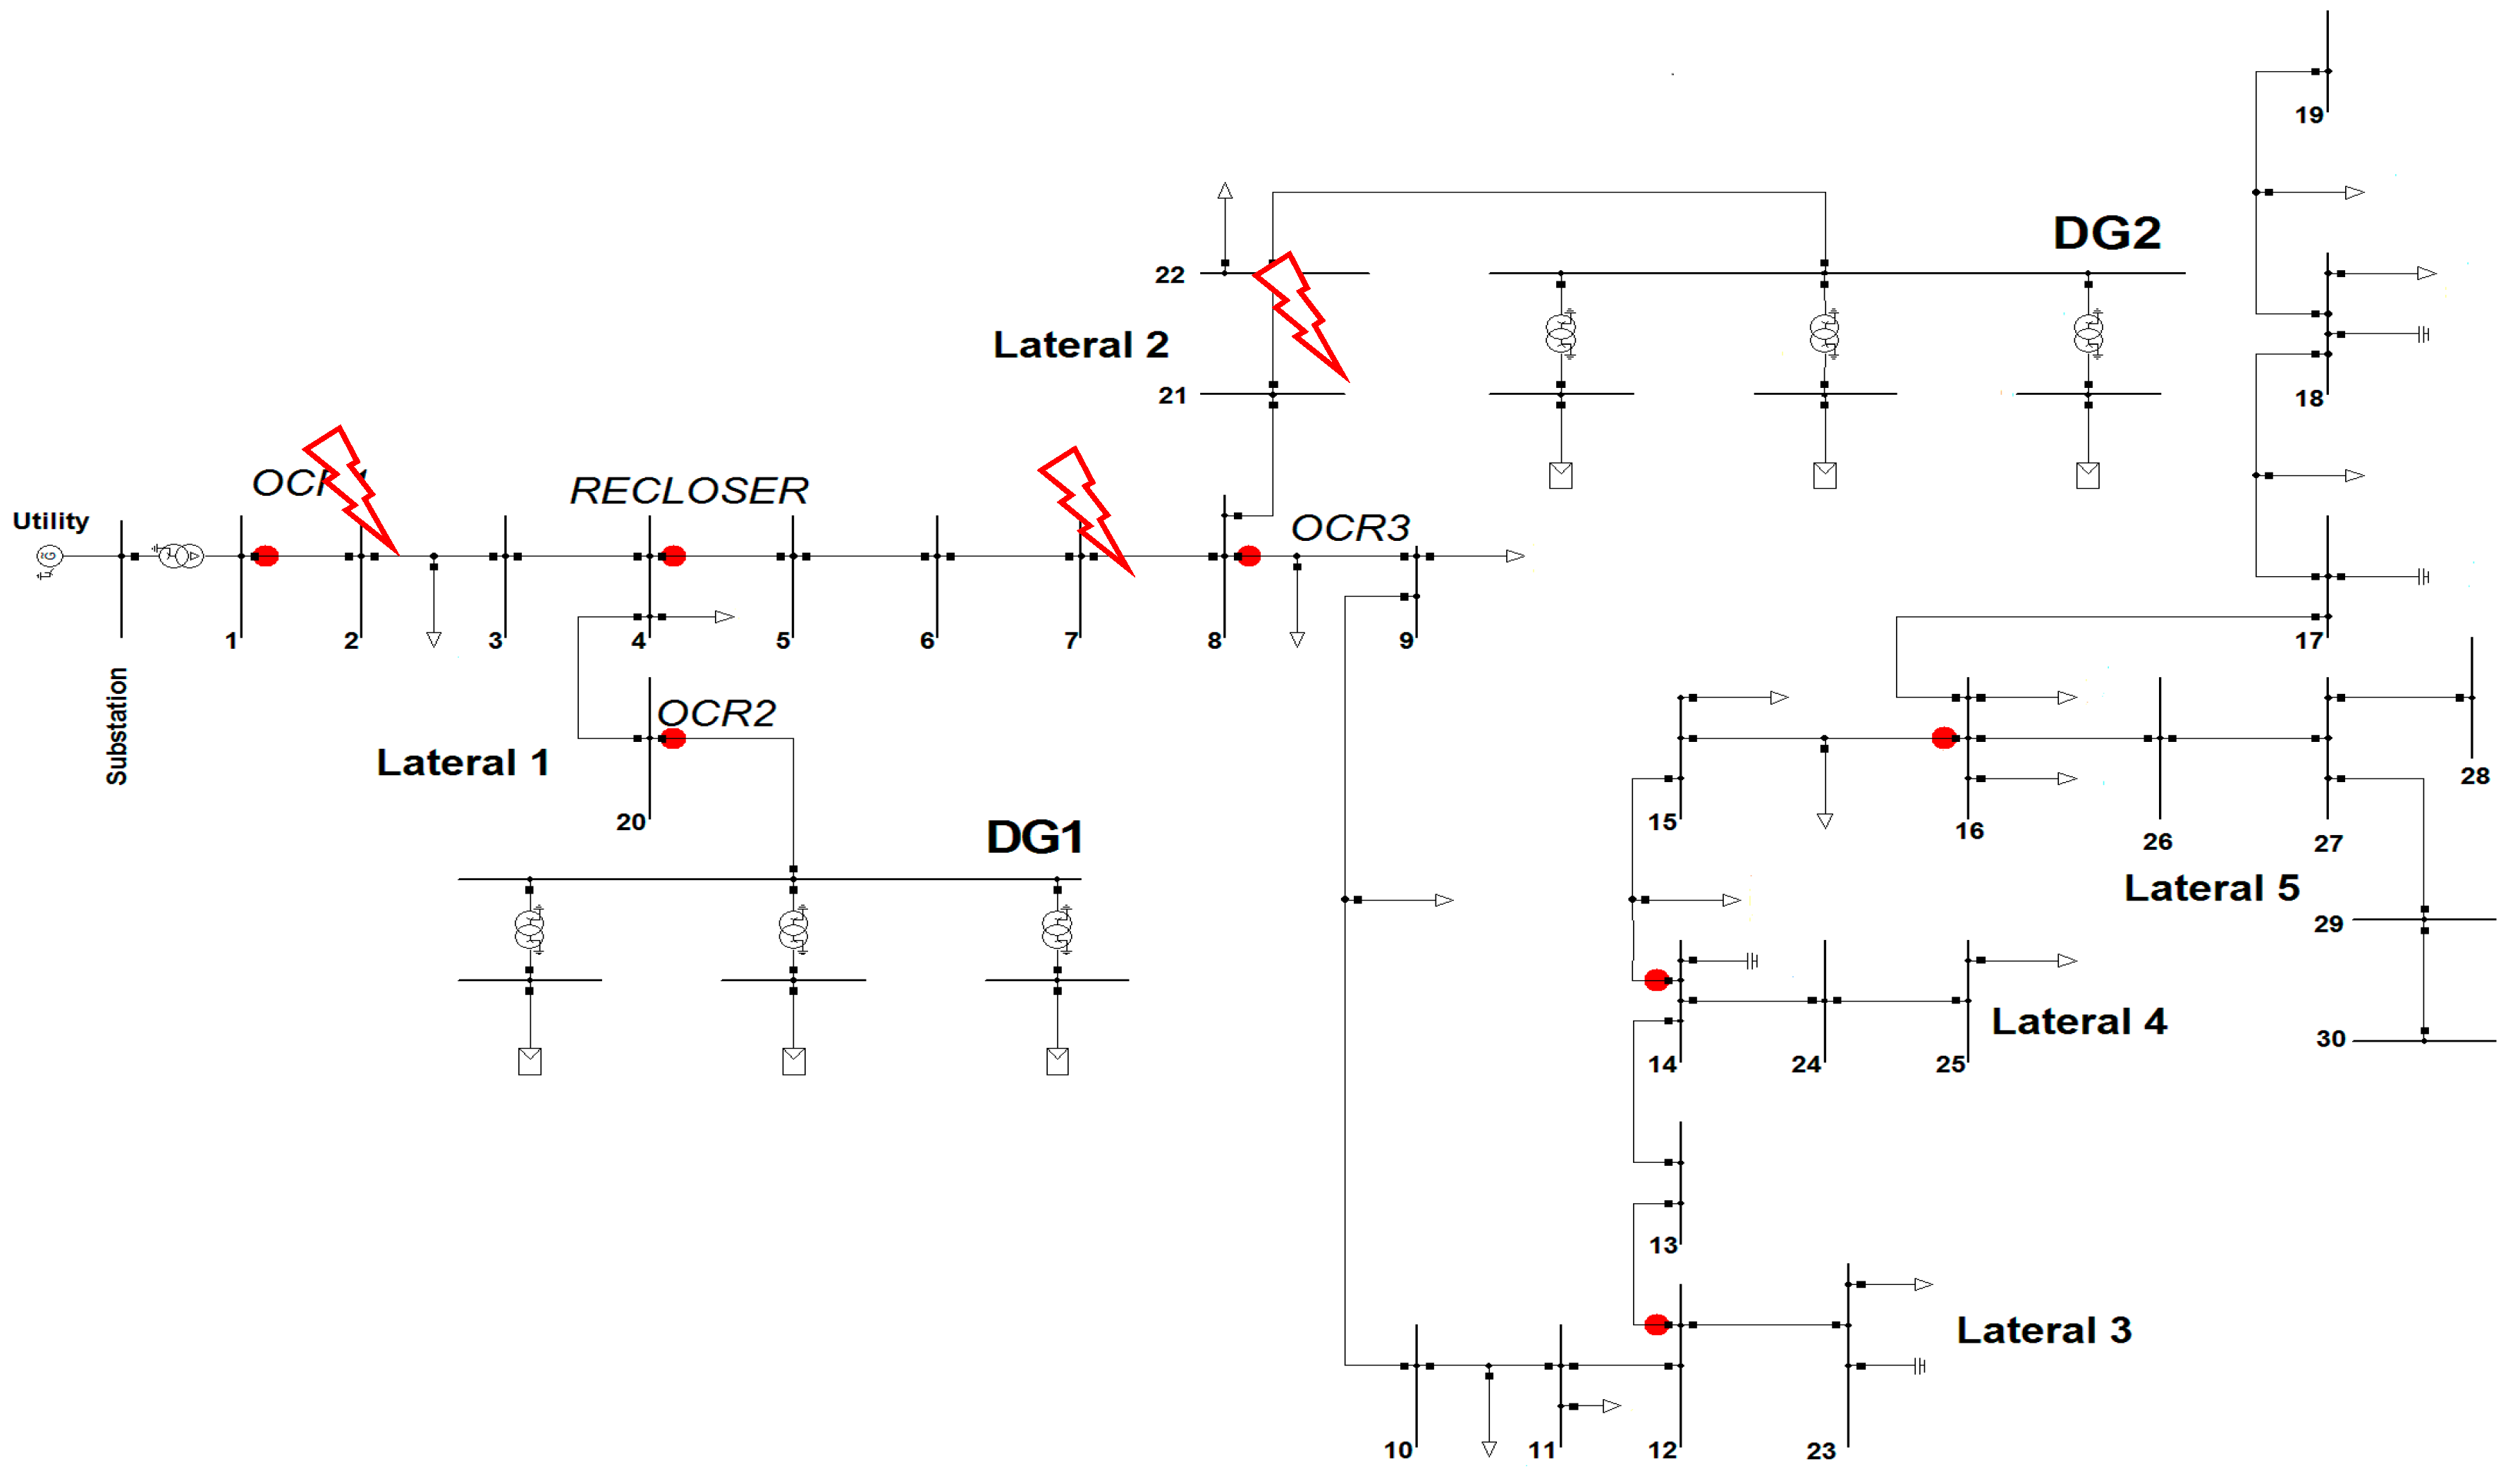
- the analysis is carried out by using the IEEE 34-node test feeder system modeled in DIgSILENT PowerFactory.
2. Effect Caused by the DG on Protective Devices
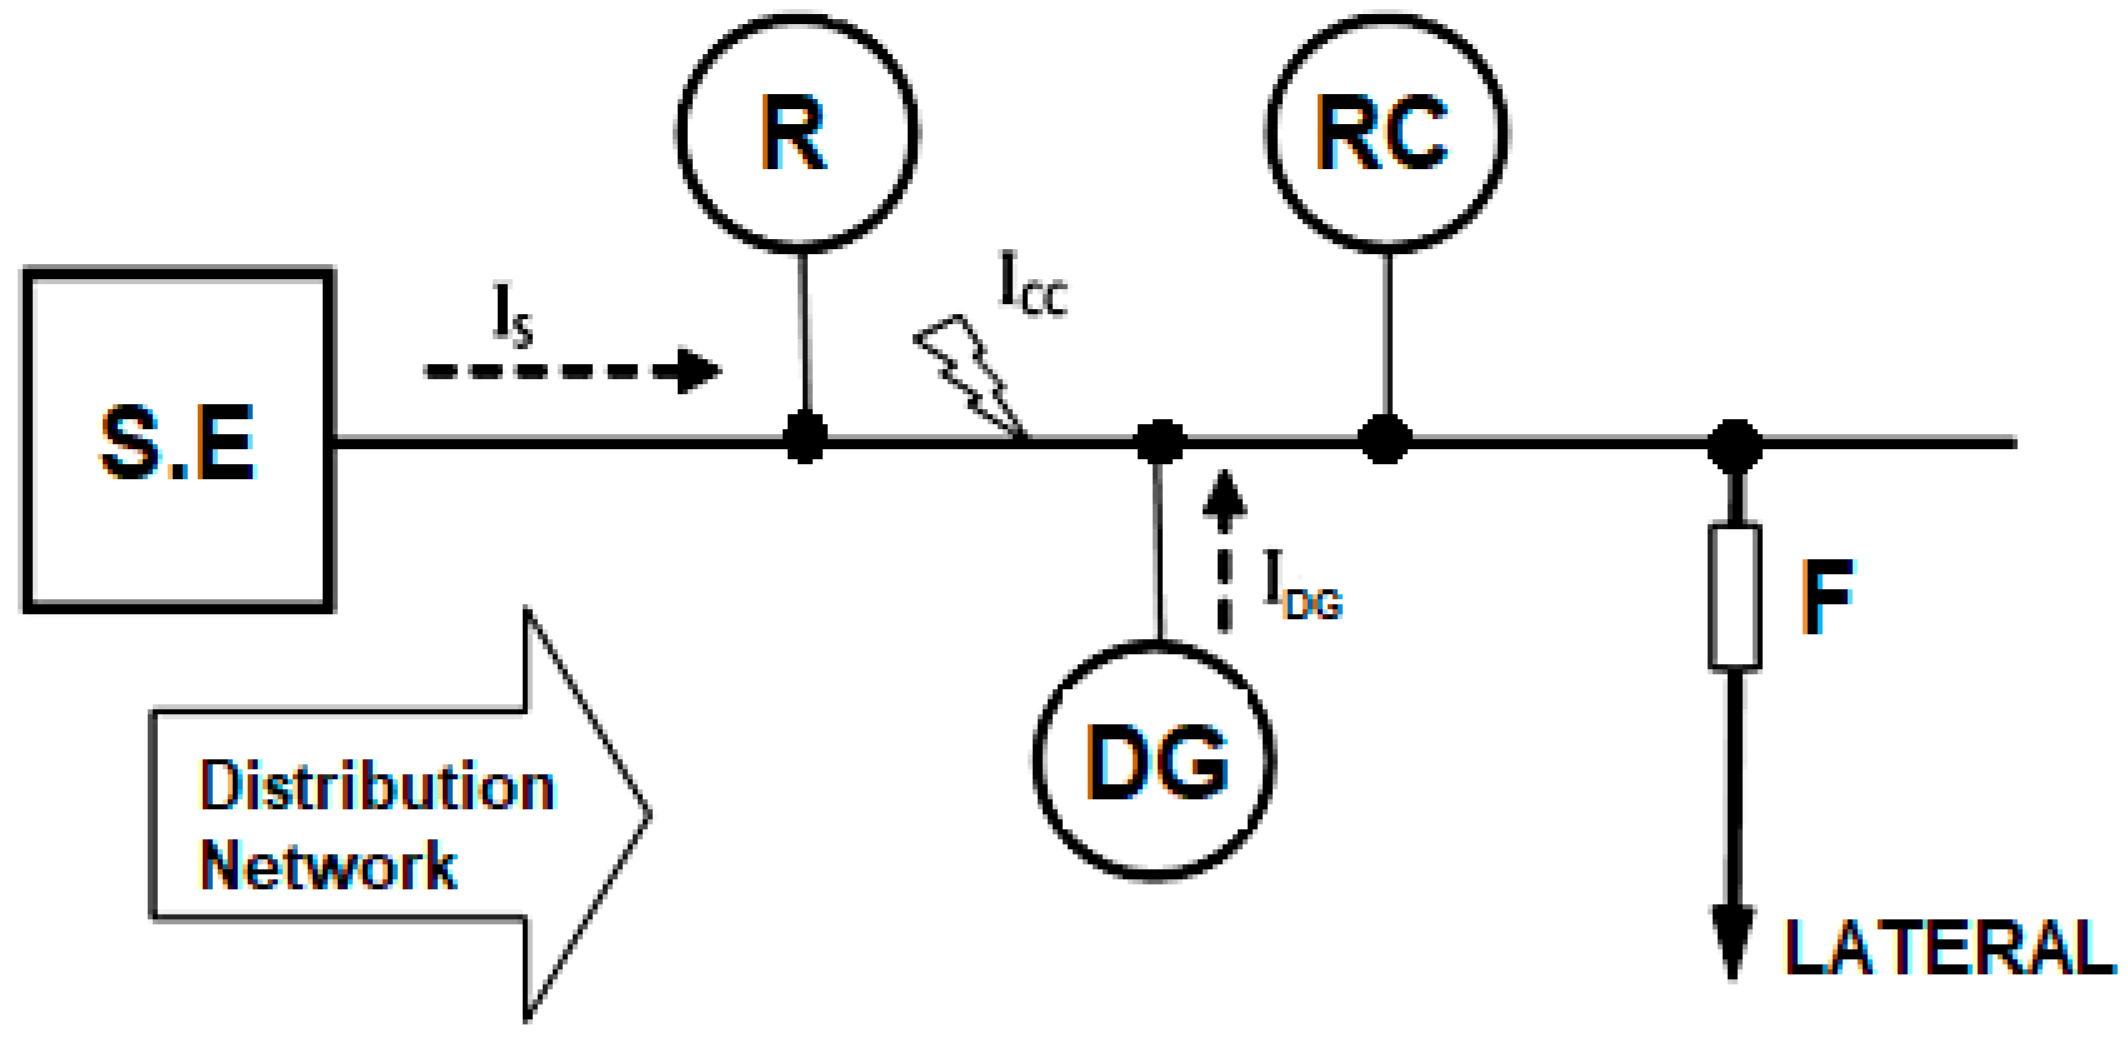
2.1. Loss of Sensitivity
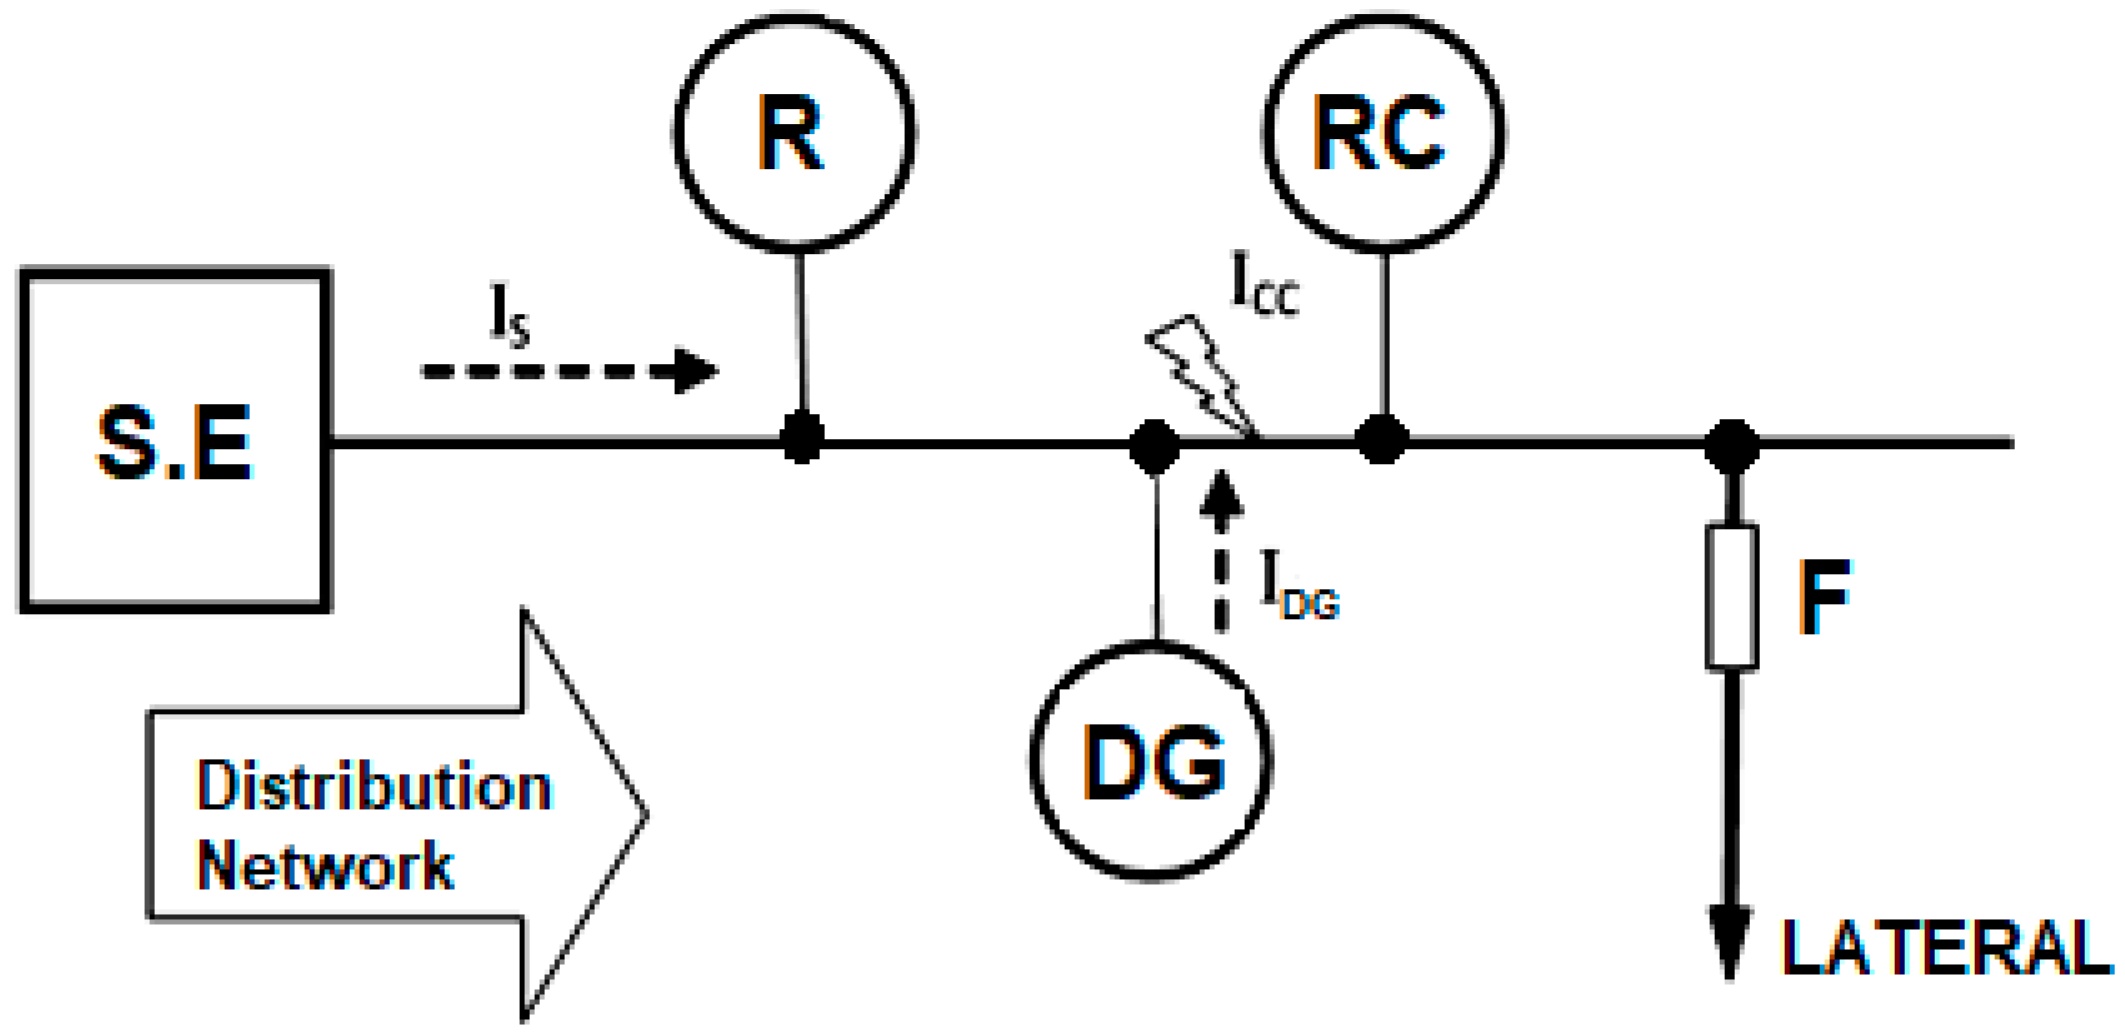
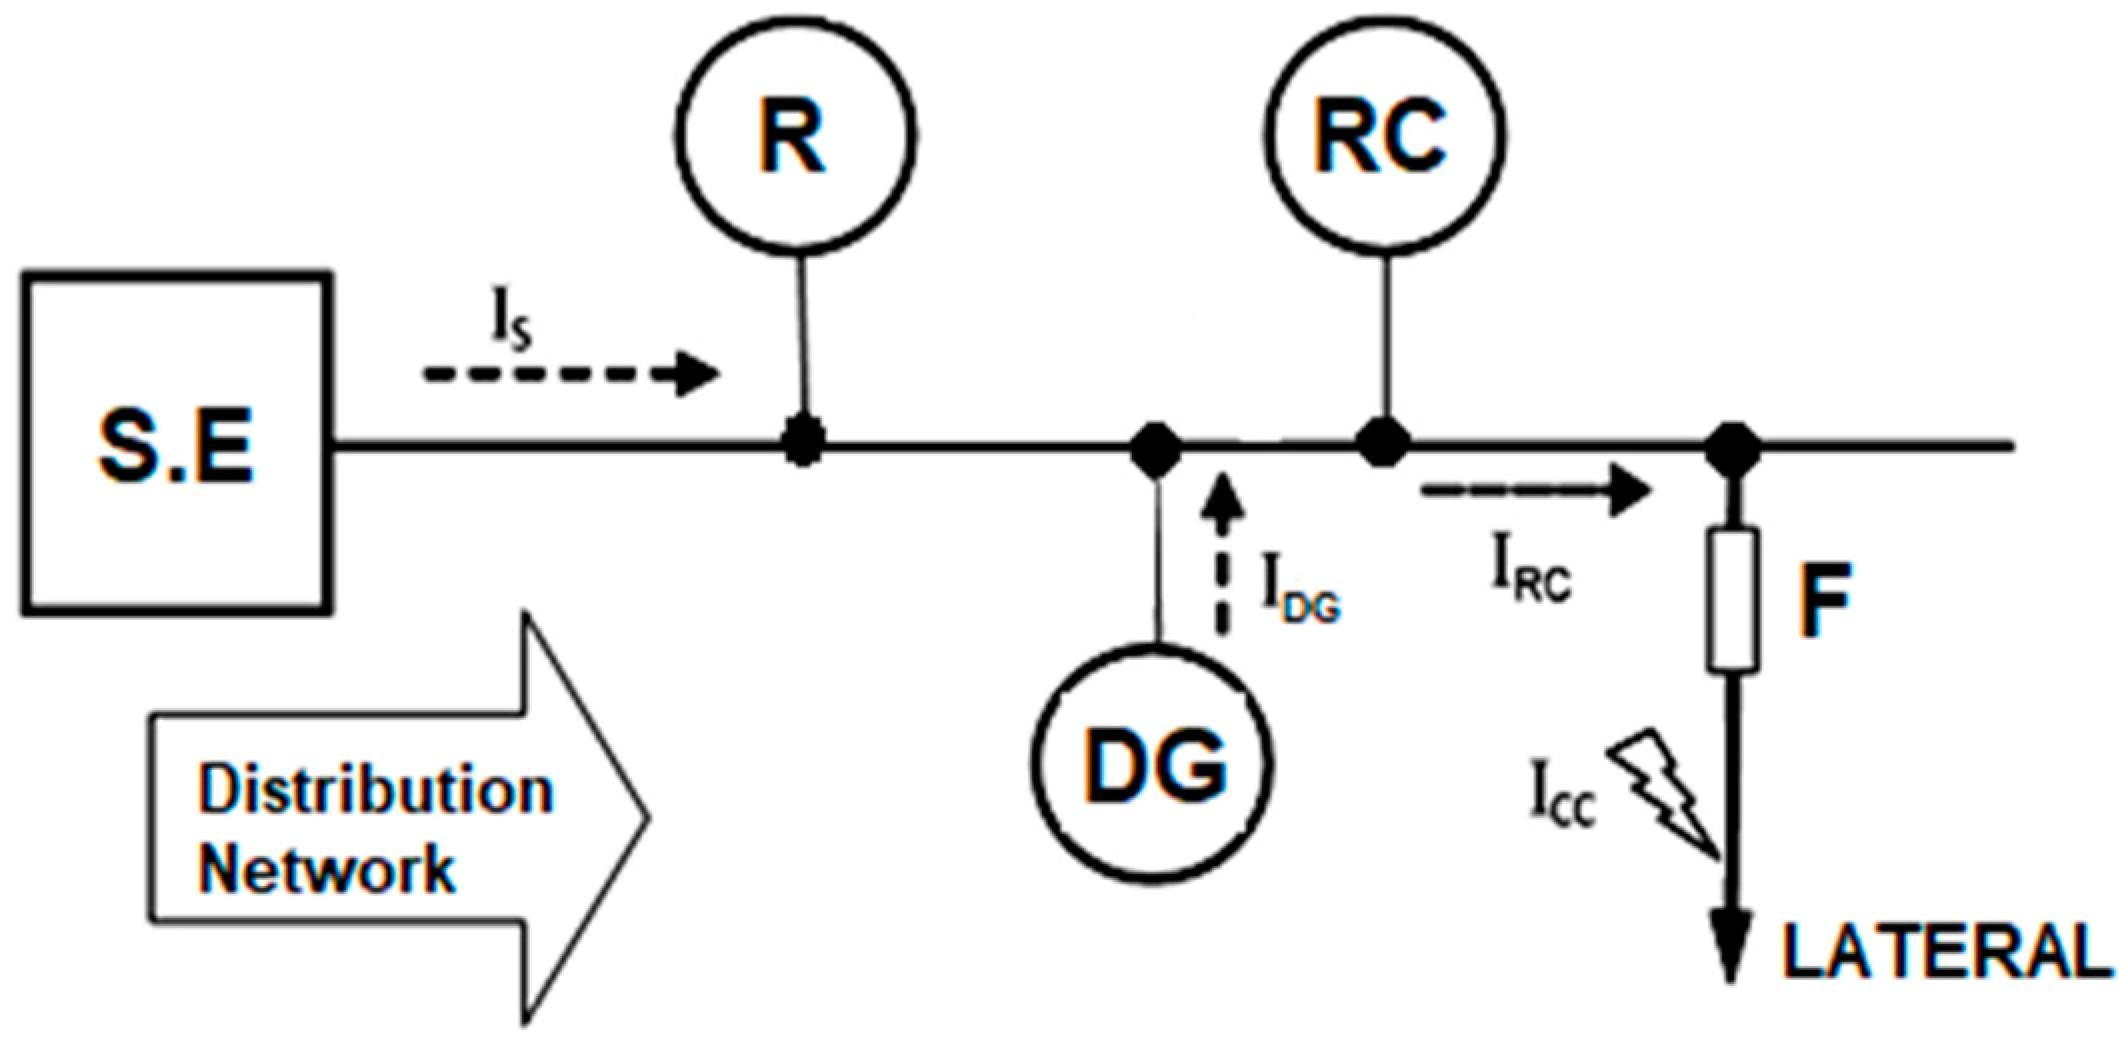
2.2. Loss of Coordination
3. Coordination with Linear Programming
- Coordination criterion—The protection coordination criterion establishes the minimum time that must elapse between the operation of the primary protection and the operation of the backup protection. The fault is detected simultaneously by the primary protection, PP, and the secondary protection, PS. To avoid erroneous operation, the PS will only have to operate in case the PP fails. If we define Ri as the primary fault protection at a certain point, j, and Ri+1 as the secondary or backup protection for the same fault. The constraint condition for coordination criteria is:where, ti+1,j is the operation time of the back-up, PS, operation for fault at point j, ti,j is the operation time of PP operation for the same fault, and ∆t is the coordination time interval (CTI).
- Relay operating time limits—The time taken by a relay to detect and isolate a fault produced in its zone of influence must be bounded. This is the constraint imposed by the operating time of the relays:where, ti,min and ti,max are the minimum and maximum operating times of relay i (at any point).
- Time multiplier setting, TMS, limits—The operating time of a relay is directly proportional to the TMS. Therefore:where TMSi,min is the minimum TMS value for relay i and, TMSi,max is maximum value of TMS for relay i. The TMS values usually taken are 0.025–1.2, respectively [32].
- Relay operating characteristics—To extend the work region of the overcurrent relay specified by the standard [33], the relay’s parameters are optimized considering the maximum value of the relay and the minimum value of the relay, as expressed respectively. We consider all relays with the same characteristics:where top is the relay operating time and PSM is the plug setting multiplier (ki,j in Equation (1)). For inverse characteristic curves it is usually α = 0.02 and β = 0.14 [32,33].
4. Case Study Results and Discussion
- The voltage across the distribution network is 15 kV.
- The short-circuit power of the external network will be 100 MVA.
- The power demand of the electrical loads connected to the network is 12 MW and load flow analysis they have been considered balanced.
- Overhead network with double circuit with LA-110 conductor. The electrical characteristics of this conductor are shown in [35].
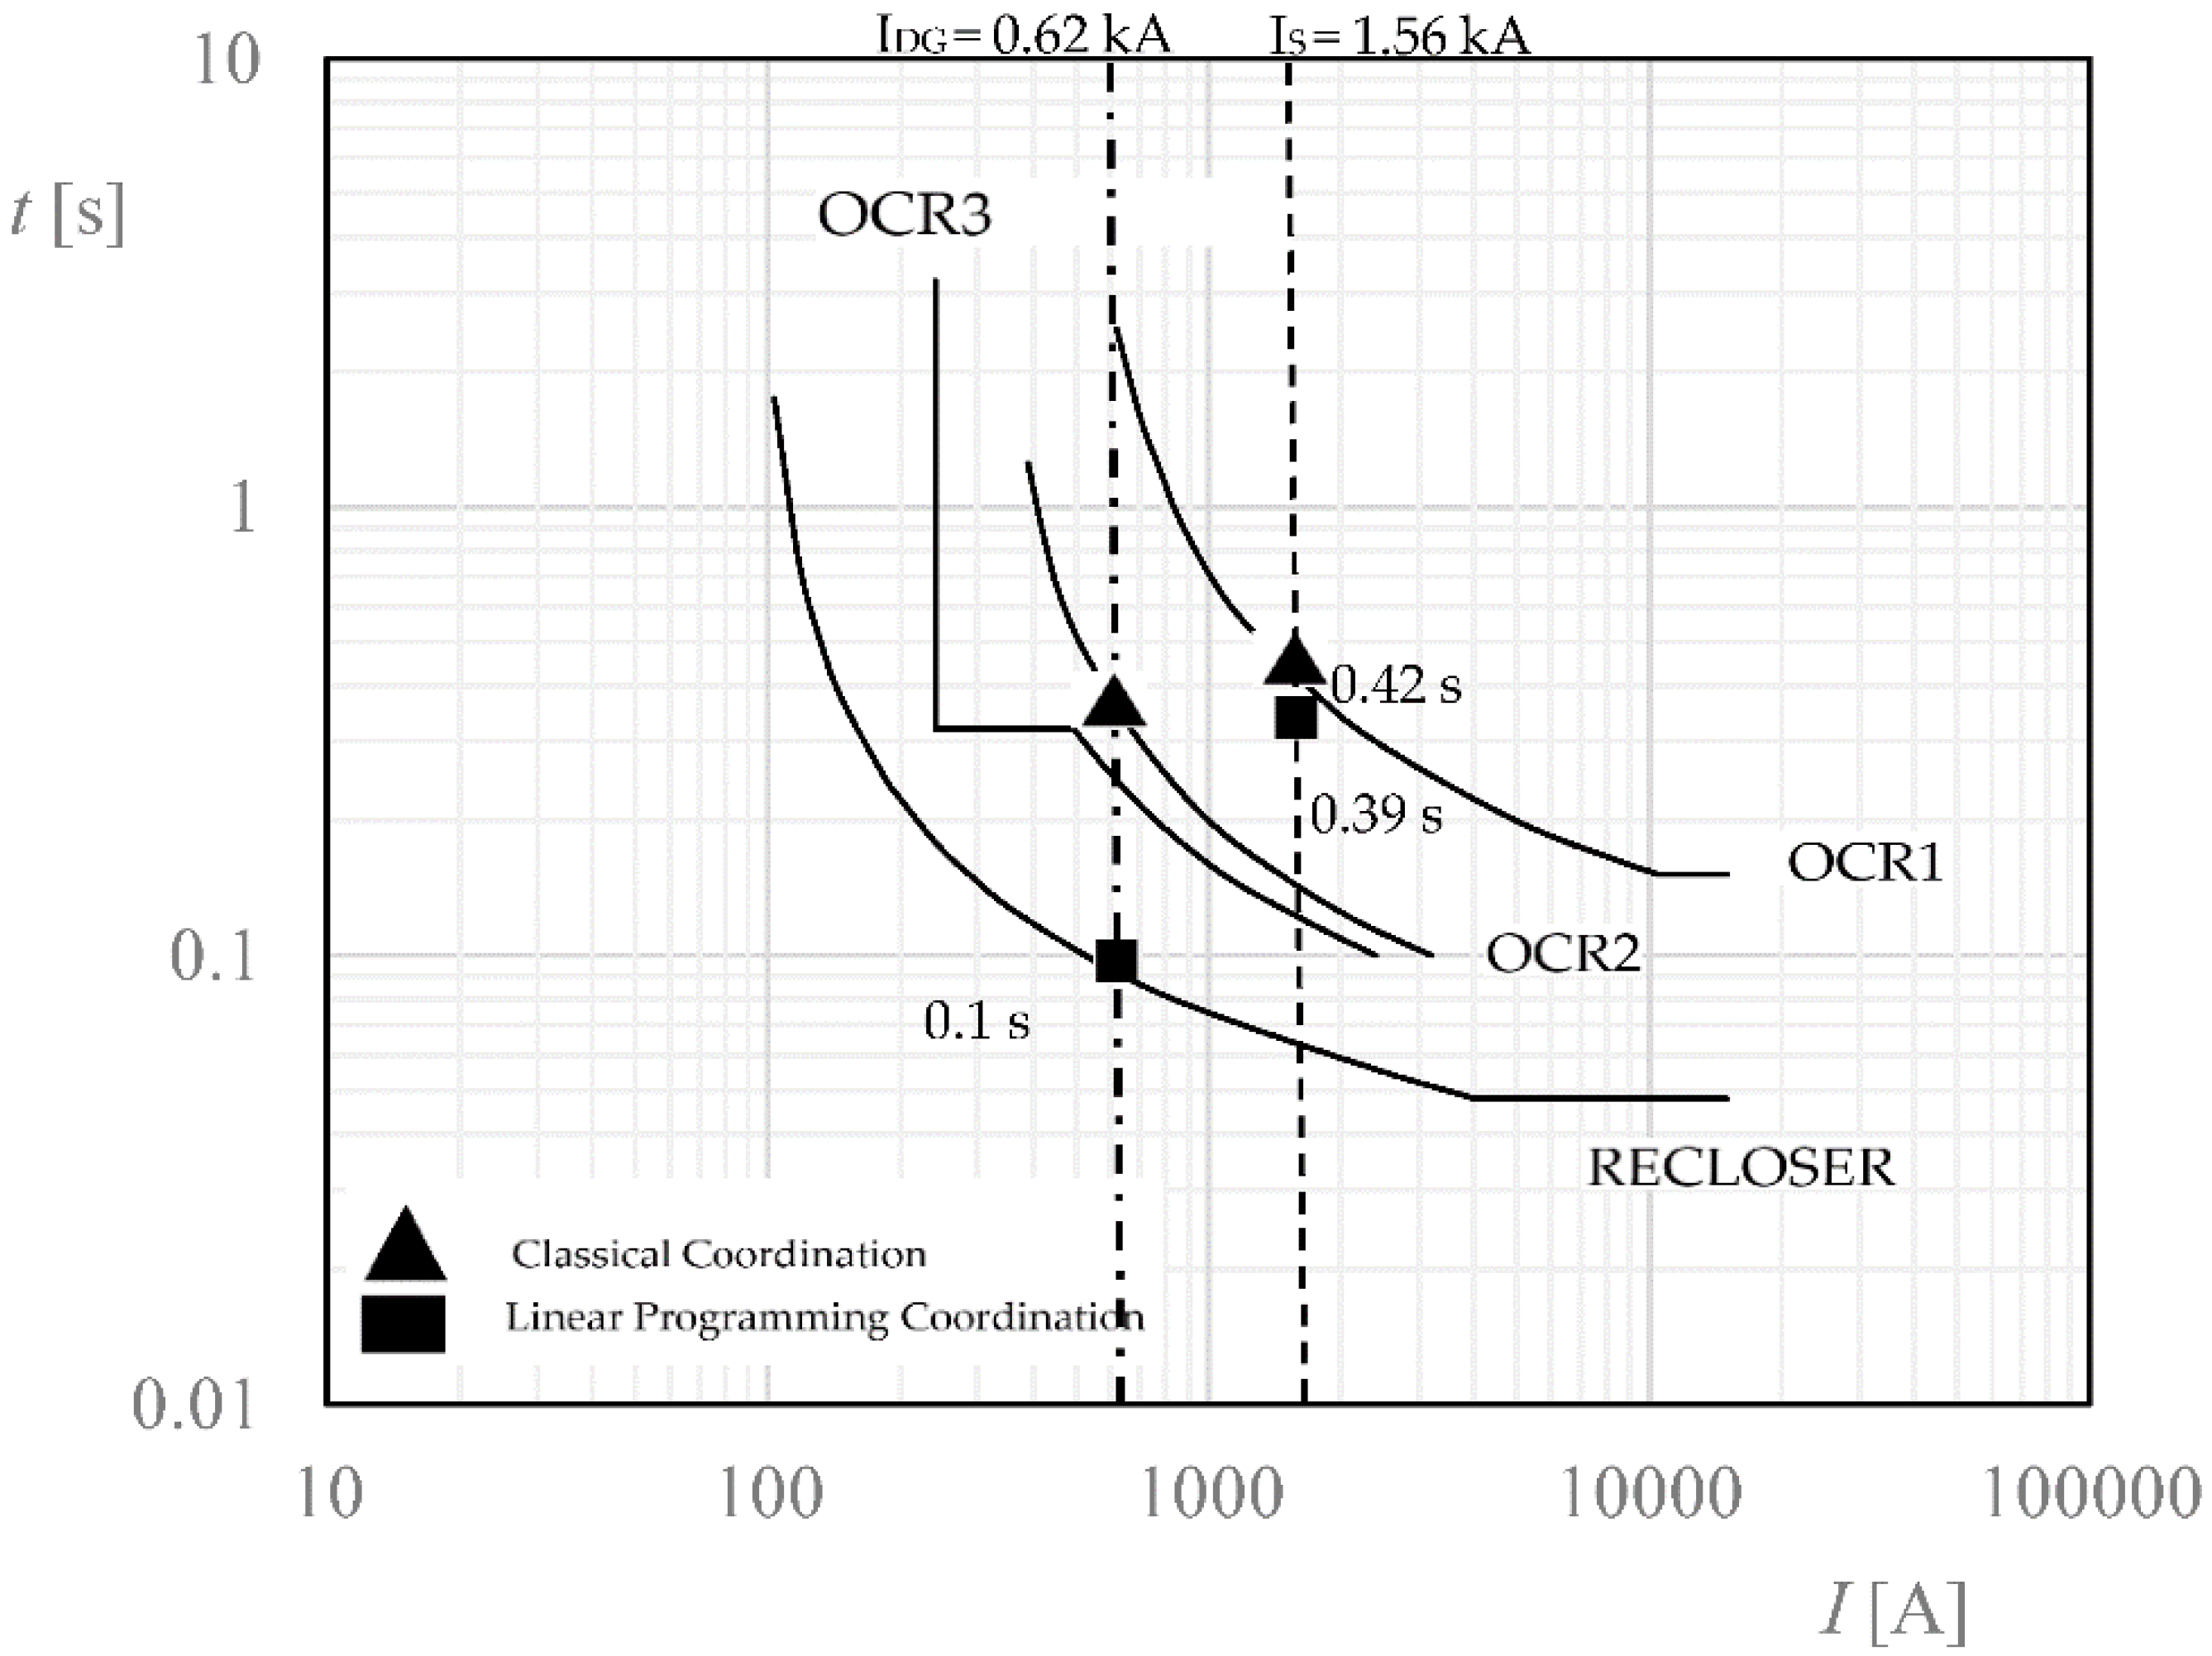
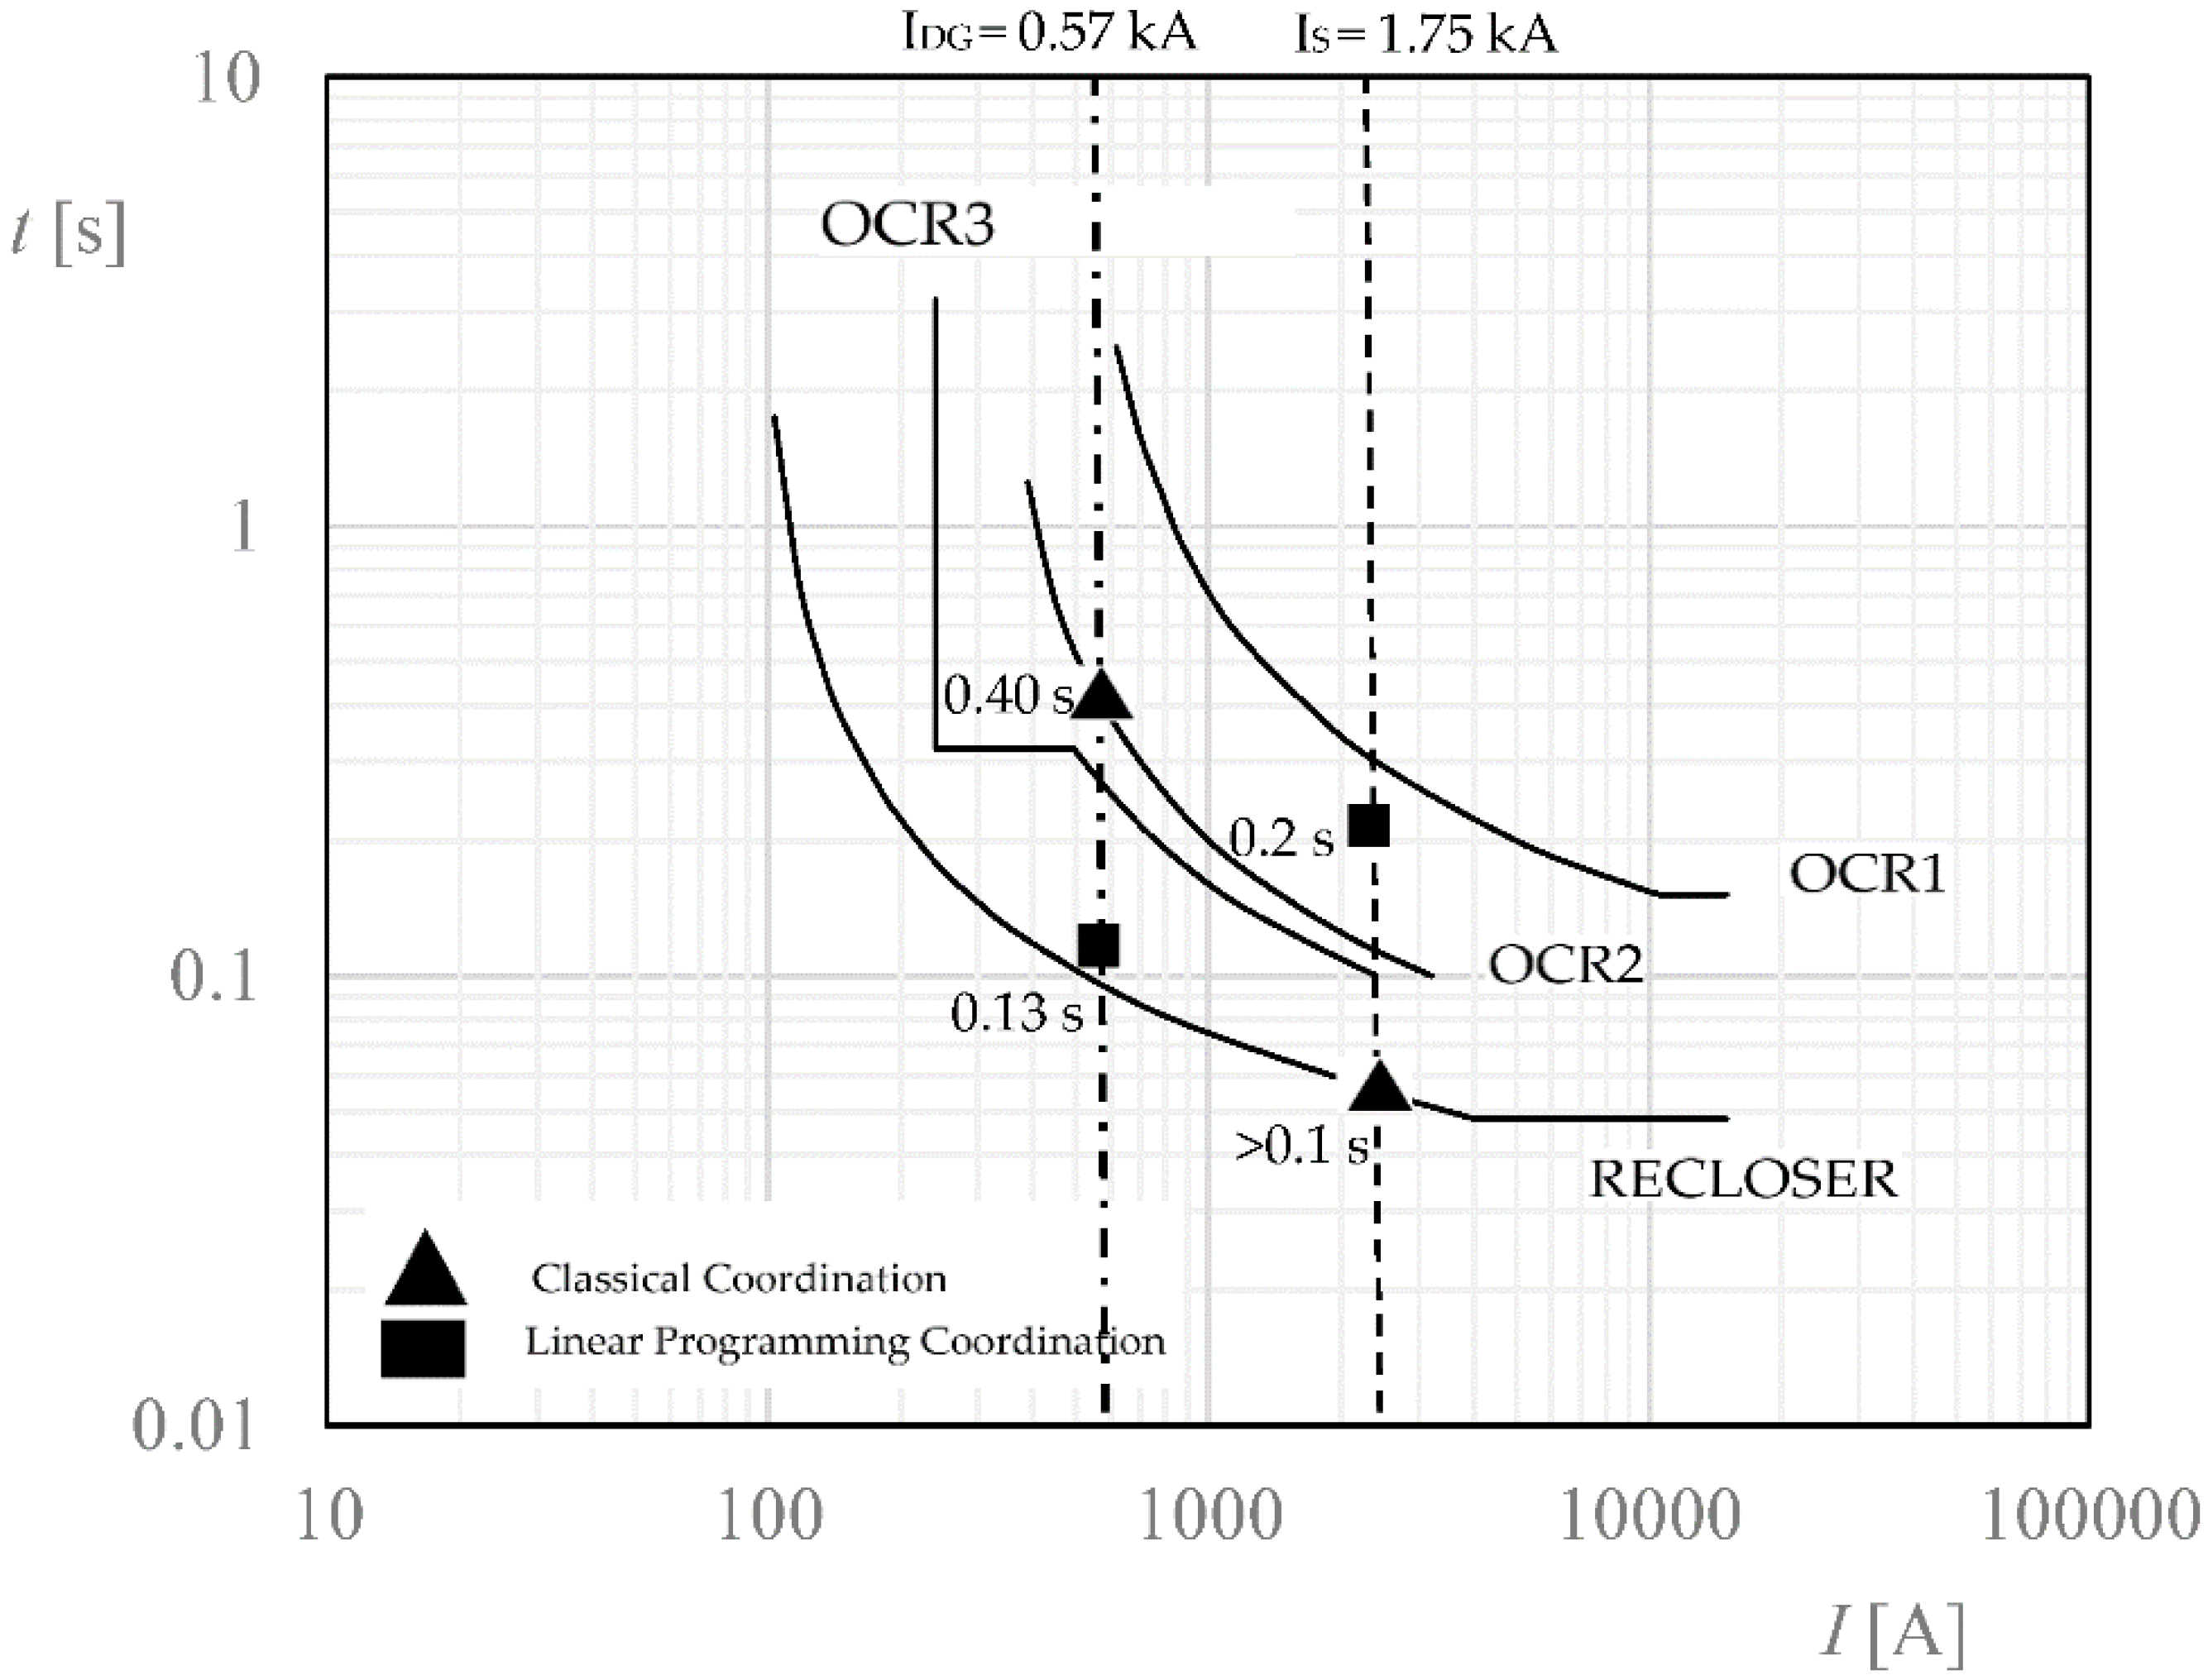
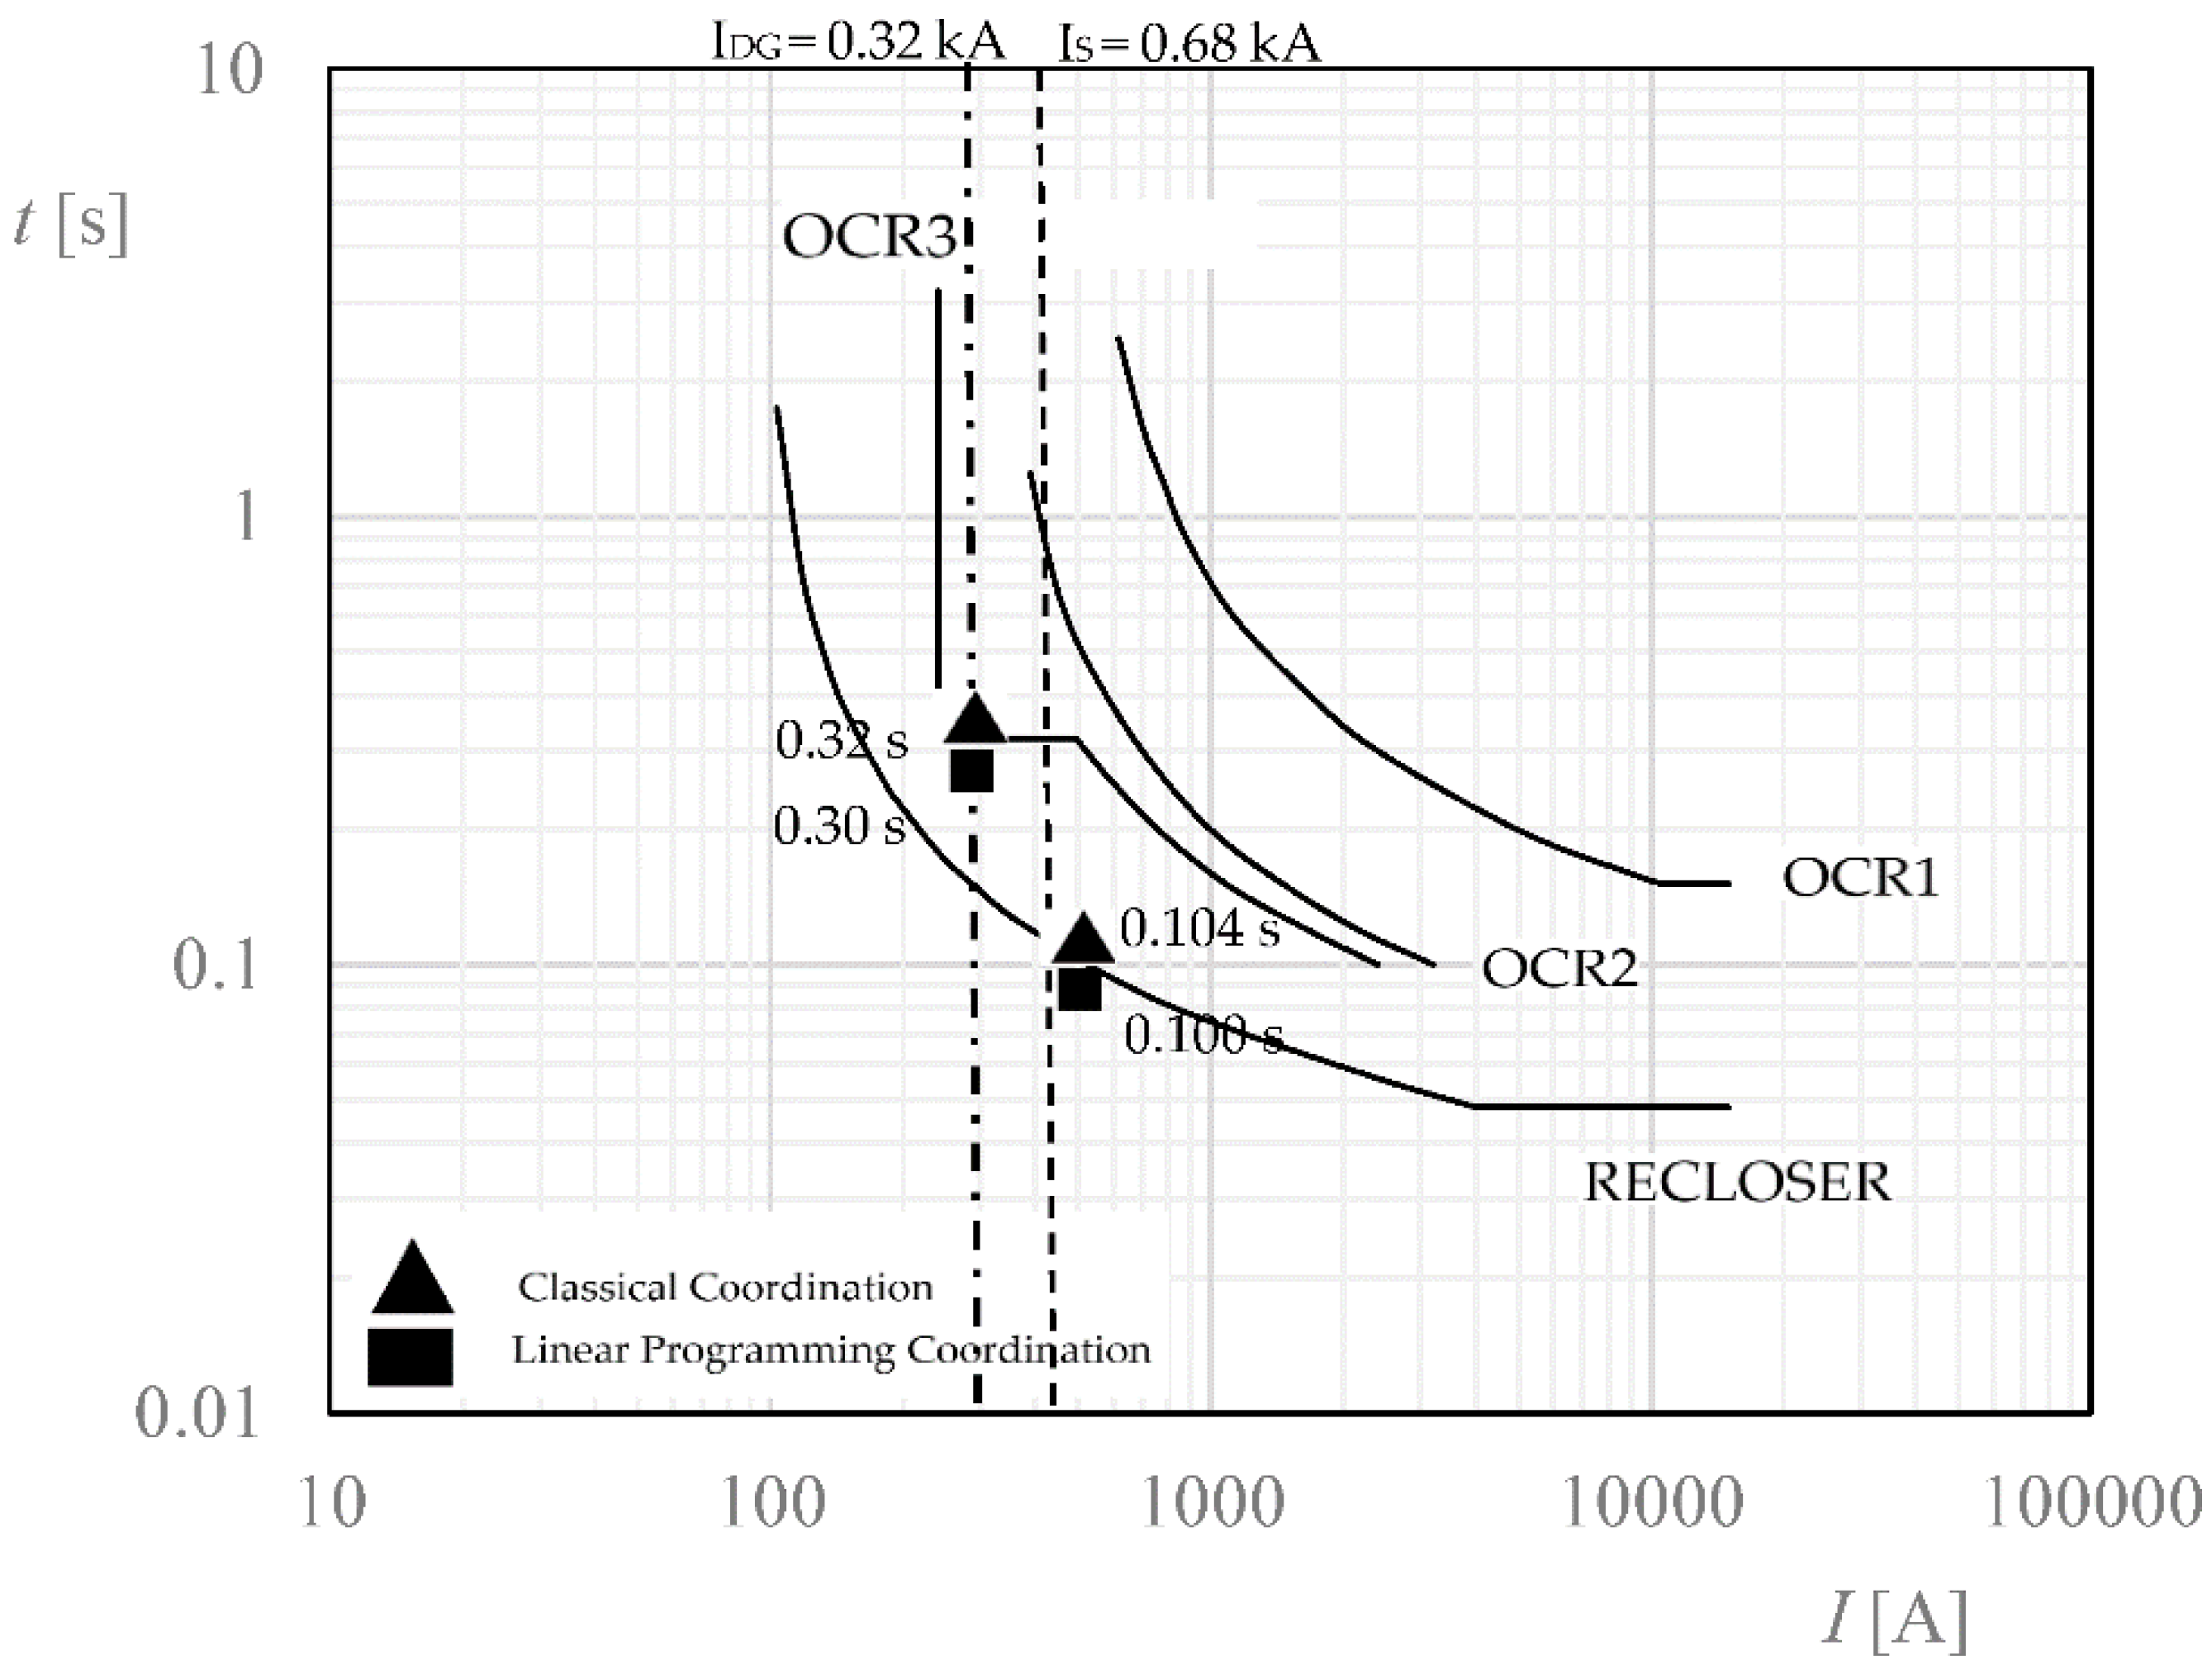
4.1. Objective Function According to Fault Location
- The minimum operating time of each relay is 0.1 s.
- The normal range of TMS from 0.025 to 1.2.
- Typical CTI setting is 0.3 s.
3.33TMS2 ≥ 0.1 TMS2 ≤ 0.030
2.21TMSRC ≥ 0.1 TMSRC ≤ 0.045
3.23TMSRC ≥ 0.1 TMSRC ≤ 0.030
TMS2 ≥ 0.025
TMS3 ≥ 0.025
TMSRC ≥ 0.025
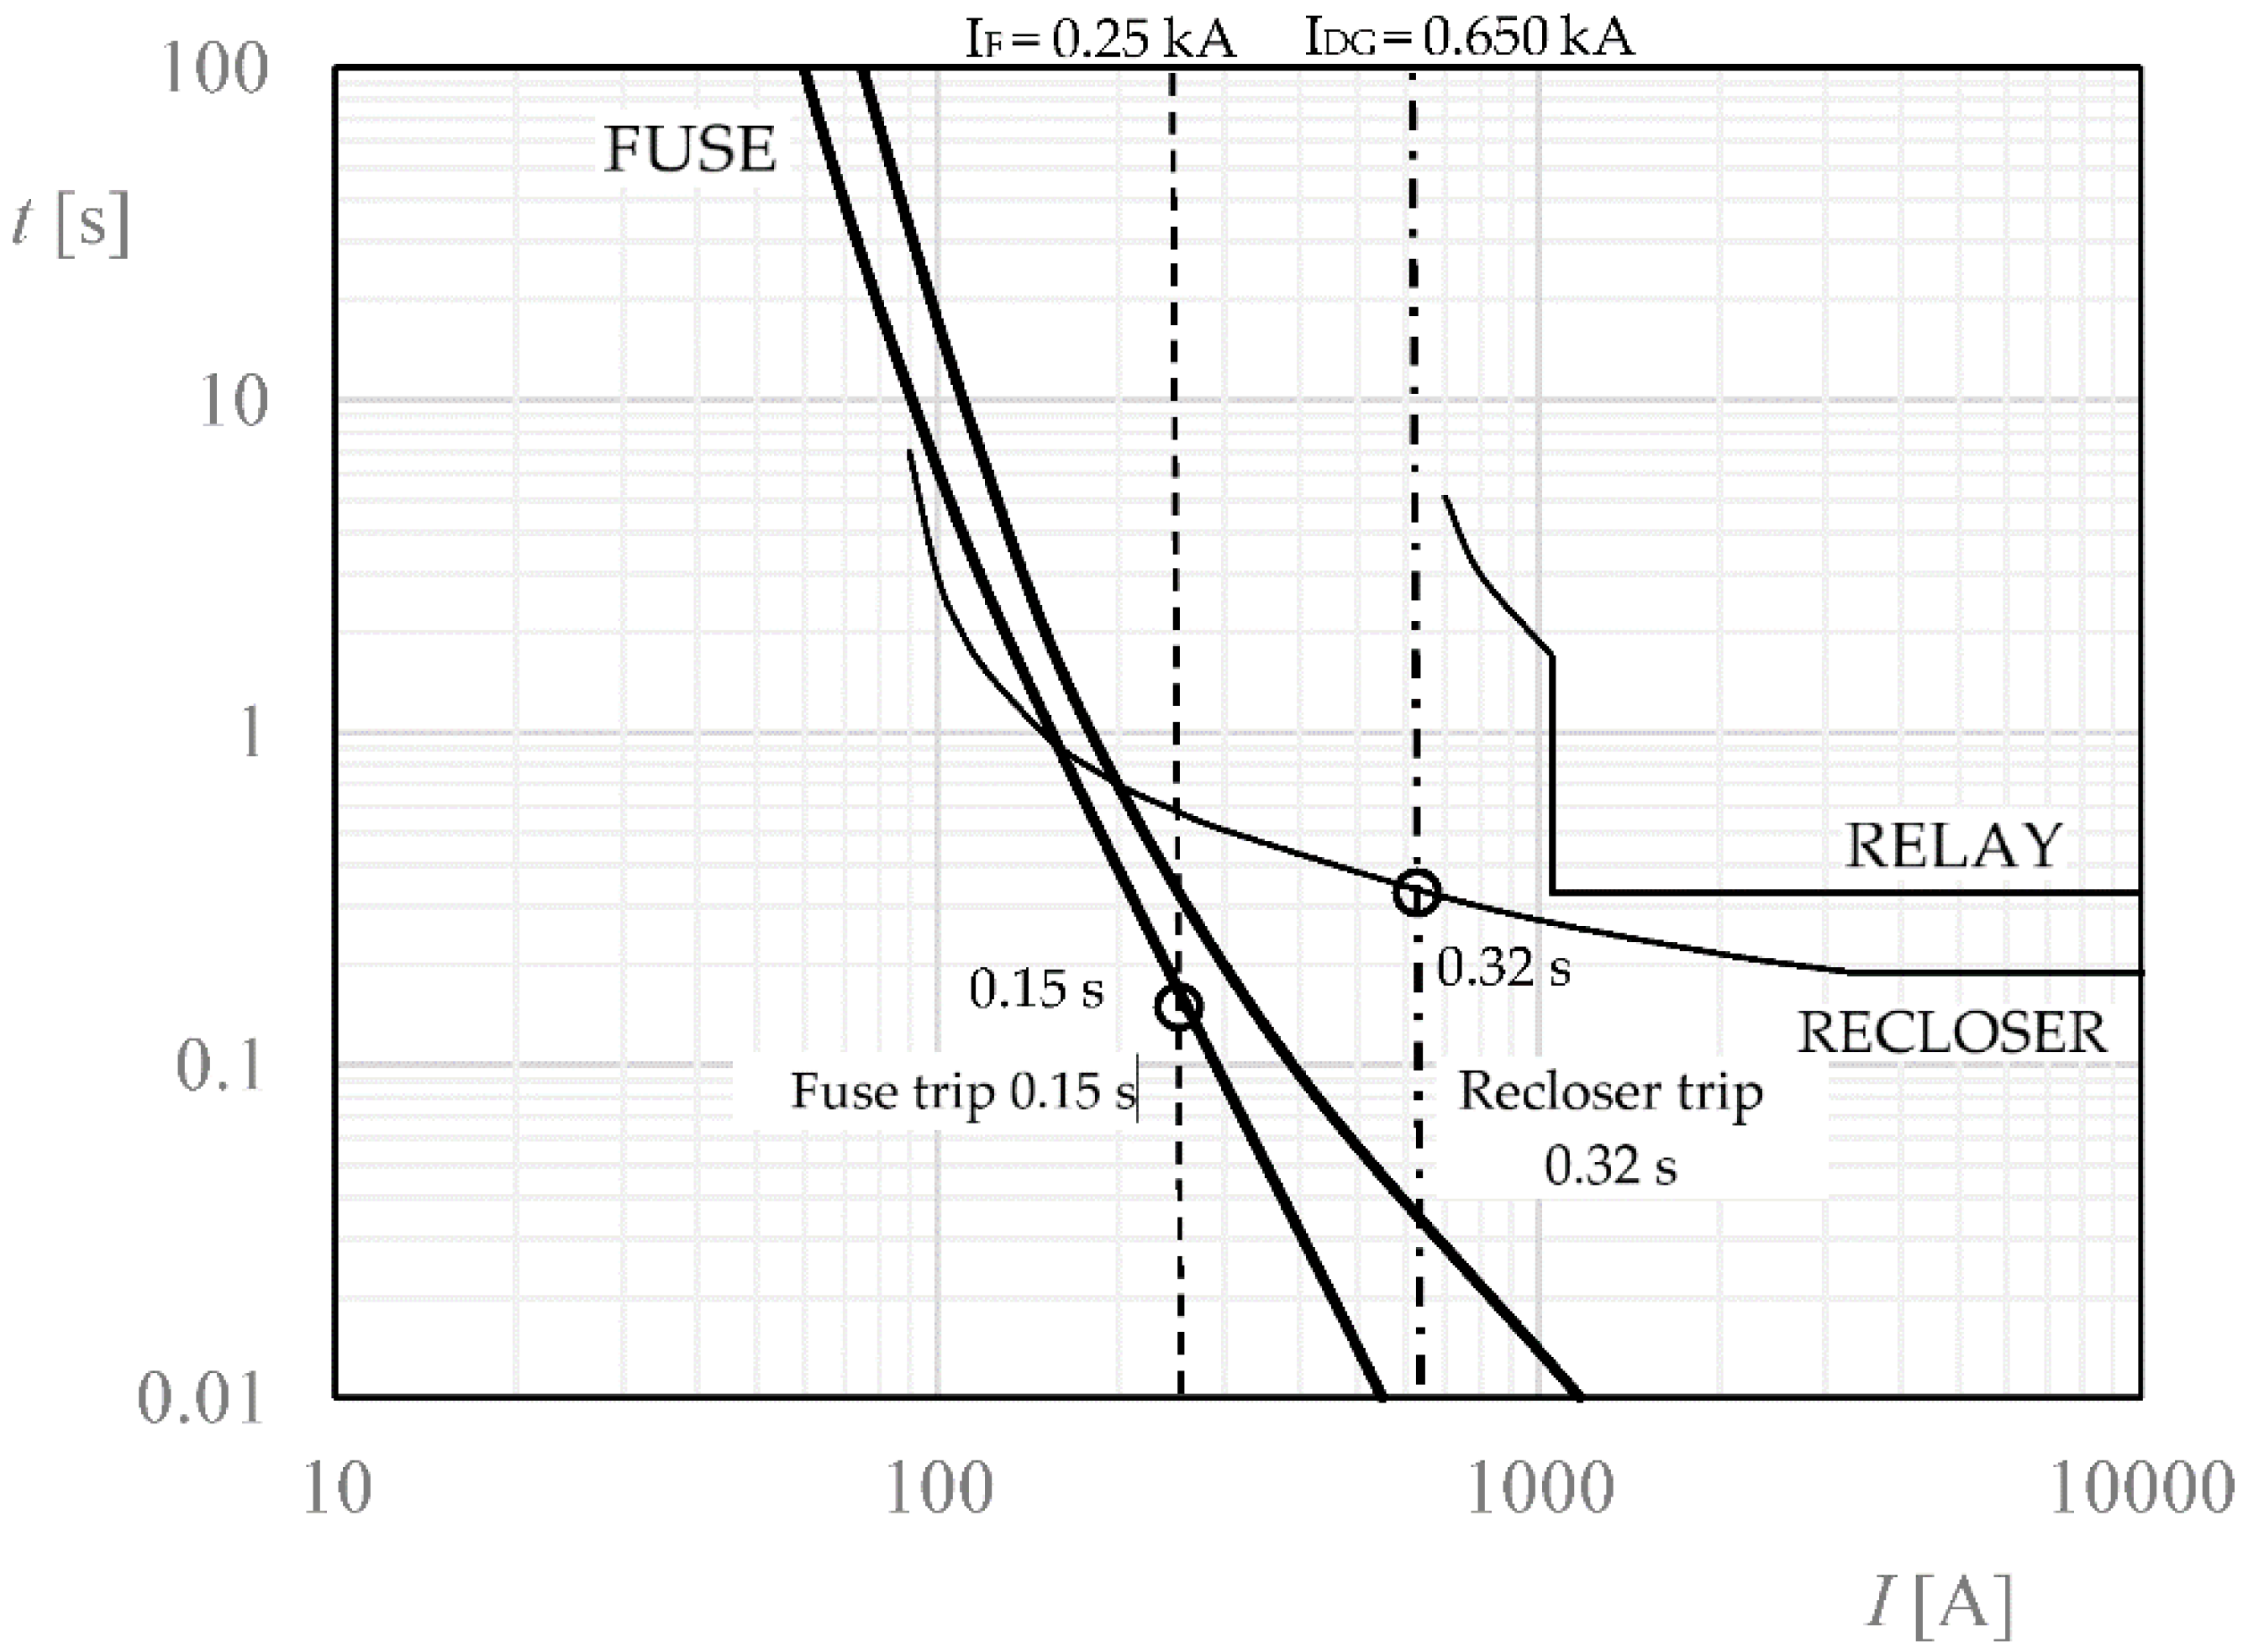
4.2. Relay Operating Time Calculation
OCR2 top2 = a2(TMS2) = 3.33·0.030 = 0.10 s
RECLOSER topRC = aRC(TMSRC) = 2.21·0.11 = 0.24 s
RECLOSER topRC = aRC(TMSRC) = 3.23·0.025 = 0.1 s
5. Conclusions
Author Contributions
Funding
Institutional Review Board Statement
Informed Consent Statement
Data Availability Statement
Conflicts of Interest
Appendix A

| F2 | F7 | F21 | |||||||||
|---|---|---|---|---|---|---|---|---|---|---|---|
| Type of Fault | a17% | a33% | a50% | a17% | a33% | a50% | a17% | a33% | a50% | ||
| Three-phase | IOCR1 | 2.27 | 2.27 | 2.27 | 2.52 | 2.58 | 2.59 | 4.96 | 4.92 | 4.89 | |
| IOCR2(DG) | 3.33 | 2.83 | 2.62 | 3.49 | 3.00 | 2.79 | 4.33 | 4.23 | 4.17 | ||
| IOCR3 | - | - | - | - | - | - | 4.57 | 4.51 | 4.47 | ||
| IRC | - | - | - | 2.21 | 2.13 | 2.08 | 3.23 | 3.19 | 3.18 | ||
| Single-phase | Rf = 0 | IOCR1 | 3.59 | 3.38 | 3.23 | 3.72 | 3.54 | 3.47 | 4.25 | 4.30 | 4.31 |
| IOCR2(DG) | 3.13 | 2.62 | 2.4 | 3.22 | 2.74 | 2.54 | 3.83 | 3.90 | 3.86 | ||
| IOCR3 | - | - | - | - | - | 6.55 | 6.35 | 6.27 | |||
| IRC | 3.28 | 3.33 | 3.35 | 2.62 | 2.34 | 2.23 | 3.10 | 3.06 | 3.05 | ||
| Rf = 5 | IOCR1 | 3.51 | 3.39 | 3.34 | 3.68 | 3.63 | 3.62 | 4.29 | 7.78 | 4.32 | |
| IOCR2(DG) | 3.08 | 2.76 | 2.64 | 3.22 | 2.92 | 2.79 | 4.00 | 3.92 | 3.88 | ||
| IOCR3 | - | - | - | - | - | - | 7.14 | 6.97 | 6.88 | ||
| IRC | 3.2 | 3.16 | 3.14 | 2.63 | 2.46 | 2.40 | 3.09 | 3.06 | 3.05 | ||
| Rf = 10 | IOCR1 | 3.65 | 3.61 | 3.61 | 3.79 | 3.8 | 3.92 | 4.30 | 4.32 | 3.91 | |
| IOCR2(DG) | 3.23 | 3.2 | 2.93 | 3.35 | 3.15 | 3.05 | 4.02 | 3.95 | 4.34 | ||
| IOCR3 | - | - | - | - | - | - | 7.83 | 7.61 | 7.56 | ||
| IRC | 3.16 | 3.14 | 3.14 | 2.7 | 2.59 | 2.56 | 3.08 | 3.06 | 3.05 | ||
| Rf = 15 | IOCR1 | 3.8 | 3.78 | 3.8 | 3.9 | 3.93 | 3.97 | 4.32 | 4.34 | 4.35 | |
| IOCR2(DG) | 3.39 | 3.23 | 3.15 | 3.48 | 3.32 | 3.25 | 4.03 | 3.97 | 3.93 | ||
| IOCR3 | - | - | - | - | - | - | 8.56 | 8.33 | 7.78 | ||
| IRC | 3.16 | 3.15 | 3.15 | 2.76 | 2.69 | 2.67 | 3.08 | 3.06 | 3.05 | ||
| Rf = 20 | IOCR1 | 3.91 | 3.91 | 3.92 | 3.99 | 4.03 | 4.06 | 4.33 | 3.99 | 4.37 | |
| IOCR2(DG) | 3.51 | 3.38 | 3.32 | 3.59 | 3.46 | 3.39 | 4.05 | 4.35 | 3.96 | ||
| IOCR3 | - | - | - | - | - | - | 9.36 | 9.14 | 9.07 | ||
| IRC | 3.16 | 3.15 | 3.15 | 2.82 | 2.77 | 2.75 | 3.08 | 3.06 | 3.06 | ||
| Rf = 25 | IOCR1 | 3.99 | 4.00 | 4.02 | 4.06 | 4.11 | 4.13 | 4.34 | 4.37 | 4.38 | |
| IOCR2(DG) | 3.61 | 3.5 | 3.41 | 3.68 | 3.56 | 3.51 | 4.06 | 4.01 | 3.95 | ||
| IOCR3 | - | - | - | - | - | - | 10.2 | 10.0 | 9.93 | ||
| IRC | 3.16 | 3.16 | 3.16 | 2.86 | 2.82 | 2.81 | 3.09 | 3.07 | 3.06 | ||
| F2 | F7 | F21 | |||||||||
|---|---|---|---|---|---|---|---|---|---|---|---|
| Type of Fault | TMS17% | TMS33% | TMS50% | TMS17% | TMS33% | TMS50% | TMS17% | TMS33% | TMS50% | ||
| Three-phase | IOCR1 | 0.17 | 0.17 | 0.17 | - | - | - | - | -. | - | |
| IOCR2(DG) | 0.03 | 0.04 | 0.04 | 0.04 | 0.03 | 0.04 | - | - | - | ||
| IOCR3 | - | - | - | - | - | - | 0.08 | 0.09 | 0.09 | ||
| IRC | - | - | - | 0.19 | 0.18 | 0.19 | 0.03 | 0.03 | 0.03 | ||
| Single-phase | Rf = 0 | IOCR1 | 0.11 | 0.11 | 0.12 | - | - | - | - | - | - |
| IOCR2(DG) | 0.03 | 0.04 | 0.04 | 0.03 | 0.04 | - | - | - | - | ||
| IOCR3 | - | - | - | - | - | 0.06 | 0.06 | 0.06 | 0.06 | ||
| IRC | - | - | - | 0.15 | 0.14 | 0.03 | 0.03 | 0.03 | 0.03 | ||
| Rf = 5 | IOCR1 | 0.11 | 0.11 | 0.11 | - | - | - | - | - | - | |
| IOCR2(DG) | 0.03 | 0.04 | 0.04 | 0.03 | 0.03 | - | - | - | - | ||
| IOCR3 | - | - | - | - | 0.06 | 0.06 | 0.07 | 0.07 | |||
| IRC | - | - | - | 0.15 | 0.01 | 0.03 | 0.03 | 0.03 | 0.03 | ||
| Rf = 10 | IOCR1 | 0.10 | 0.11 | 0.11 | - | - | - | - | - | - | |
| IOCR2(DG) | 0.03 | 0.03 | 0.04 | 0.03 | 0.03 | - | - | - | - | ||
| IOCR3 | - | - | - | - | - | 0.05 | 0.05 | 0.06 | 0.06 | ||
| IRC | - | - | - | 0.14 | 0.01 | 0.03 | 0.03 | 0.03 | 0.03 | ||
| Rf = 15 | IOCR1 | 0.10 | 0.10 | 0.10 | - | - | - | - | - | - | |
| IOCR2(DG) | 0.03 | 0.03 | 0.03 | 0.03 | - | - | - | - | - | ||
| IOCR3 | - | - | - | - | - | 0.05 | 0.05 | 0.05 | 0.05 | ||
| IRC | - | - | - | 0.14 | 0.03 | 0.03 | 0.03 | 0.03 | |||
| Rf = 20 | IOCR1 | 0.10 | 0.10 | 0.10 | - | - | - | - | - | - | |
| IOCR2(DG) | 0.03 | 0.03 | 0.03 | 0.03 | - | - | - | - | - | ||
| IOCR3 | - | - | - | - | - | 0.04 | 0.04 | 0.05 | 0.05 | ||
| IRC | - | - | - | 0.14 | 0.03 | 0.03 | 0.03 | 0.03 | |||
| Rf = 25 | IOCR1 | 0.10 | 0.10 | 0.10 | - | - | - | - | - | - | |
| IOCR2(DG) | 0.03 | 0.03 | 0.03 | 0.03 | - | - | - | - | - | ||
| IOCR3 | - | - | - | - | - | 0.04 | 0.04 | 0.05 | 0.04 | ||
| IRC | - | - | - | 0.13 | - | 0.03 | 0.03 | 0.03 | 0.03 | ||
| F2 | F7 | F21 | ||||||||||||||||||
|---|---|---|---|---|---|---|---|---|---|---|---|---|---|---|---|---|---|---|---|---|
| Type of Fault | top 17% | top 33% | top 50% | top 17% | top 33% | top 50% | top 17% | top 33% | top 50% | |||||||||||
| Type Coordination | C | PL | C | PL | C | PL | C | PL | C | PL | C | PL | C | PL | C | PL | C | PL | ||
| Three-phase | IOCR1 | 0.42 | 0.39 | 0.42 | 0.39 | 0.42 | 0.39 | - | - | - | - | - | - | - | - | - | - | - | - | |
| IOCR2(GD) | 0.20 | 0.20 | 0.19 | 0.10 | 0.15 | 0.08 | 0.20 | 0.13 | 0.20 | 0.10 | 0.20 | 0.10 | - | - | - | - | - | |||
| IOCR3 | - | - | - | - | - | - | - | - | - | - | - | - | 0.42 | 0.38 | 0.42 | 0.40 | 0.42 | 0.40 | ||
| IRC | - | - | - | - | - | - | 0.45 | 0.42 | 0.45 | 0.38 | 0.45 | 0.40 | 0.12 | 0.08 | 0.12 | 0.10 | 0.12 | 0.10 | ||
| Single-phase | Rf = 0 | IOCR1 | 0.42 | 0.39 | 0.43 | 0.37 | 0.42 | 0.39 | - | - | - | - | - | - | - | - | - | - | - | - |
| IOCR2(DG) | 0.14 | 0.10 | 0.14 | 0.10 | 0.14 | 0.10 | 0.14 | 0.10 | 0.14 | 0.10 | 0.14 | 0.13 | - | - | - | - | - | - | ||
| IOCR3 | - | - | - | - | - | - | - | - | - | - | - | - | 0.40 | 0.39 | 0.14 | 0.38 | 0.14 | 0.38 | ||
| IRC | - | - | - | - | - | - | 0.40 | 0.39 | 0.40 | 0.33 | 0.40 | 0.31 | 0.40 | 0.10 | 0.40 | 0.09 | 0.40 | 0.09 | ||
| Rf = 5 | IOCR1 | 0.41 | 0.39 | 0.42 | 0.37 | 0.41 | 0.37 | - | - | - | - | - | - | - | - | - | - | - | - | |
| IOCR2(DG) | 0.14 | 0.10 | 0.14 | 0.10 | 0.14 | 0.10 | 0.14 | 0.10 | 0.14 | 0.10 | 0.14 | 0.08 | - | - | - | - | - | - | ||
| IOCR3 | - | - | - | - | - | - | - | - | - | - | - | - | 0.39 | 0.43 | 0.45 | 0.49 | 0.45 | 0.48 | ||
| IRC | - | - | - | - | - | - | 0.40 | 0.39 | 0.40 | 0.3 | 0.40 | 0.40 | 0.40 | 0.09 | 0.40 | 0.09 | 0.40 | 0.09 | ||
| Rf = 10 | IOCR1 | 0.41 | 0.37 | 0.42 | 0.40 | 0.41 | 0.40 | - | - | - | - | - | - | - | - | - | - | - | - | |
| IOCR2(DG) | 0.14 | 0.10 | 0.14 | 0.10 | 0.14 | 0.11 | 0.14 | 0.10 | 0.14 | 0.09 | 0.14 | 0.09 | - | - | - | - | - | - | ||
| IOCR3 | - | - | - | - | - | - | - | - | - | - | - | - | - | 0.39 | - | 0.46 | - | 0.45 | ||
| IRC | - | - | - | - | - | - | 0.40 | 0.38 | 0.40 | 0.3 | 0.40 | 0.3 | 0.40 | 0.10 | 0.4 | 0.09 | 0.40 | 0.09 | ||
| Rf = 15 | IOCR1 | 0.40 | 0.38 | 0.41 | 0.38 | 0.40 | 0.38 | - | - | - | - | - | - | - | - | - | - | - | - | |
| IOCR2(DG) | 0.14 | 0.10 | 0.14 | 0.10 | 0.14 | 0.09 | 0.14 | 0.10 | 0.14 | 0.10 | 0.14 | 0.10 | - | - | - | - | - | - | ||
| IOCR3 | - | - | - | - | - | - | - | - | - | - | - | - | 0.45 | 0.39 | - | 0.42 | - | 0.39 | ||
| IRC | - | - | - | - | - | - | 0.40 | 0.39 | 0.40 | 0.3 | 0.40 | 0.3 | 0.40 | 0.09 | - | 0.09 | - | 0.09 | ||
| Rf = 20 | IOCR1 | 0.40 | 0.39 | 0.41 | 0.39 | 0.40 | 0.39 | - | - | - | - | - | - | - | - | - | - | - | - | |
| IOCR2(DG) | 0.14 | 0.10 | 0.14 | 0.10 | 0.14 | 0.11 | 0.14 | 0.10 | 0.14 | 0.10 | 0.14 | 0.10 | - | - | - | - | - | - | ||
| IOCR3 | - | - | - | - | - | - | - | - | - | - | - | - | - | 0.39 | - | 0.46 | - | 0.45 | ||
| IRC | - | - | - | - | - | - | 0.40 | 0.39 | 0.40 | 0.3 | 0.40 | 0.03 | 0.40 | 0.09 | 0.40 | 0.09 | 0.40 | 0.09 | ||
| Rf = 25 | IOCR1 | 0.42 | 0.40 | 0.40 | 0.40 | 0.40 | 0.40 | - | - | - | - | - | - | - | - | - | - | - | - | |
| IOCR2(DG) | 0.14 | 0.10 | 0.14 | 0.10 | 0.14 | 0.11 | 0.14 | 0.10 | 0.14 | 0.11 | 0.14 | 0.11 | - | - | - | - | - | - | ||
| IOCR3 | - | - | - | - | - | - | - | - | - | - | - | - | - | 0.40 | - | 0.50 | - | 0.40 | ||
| IRC | - | - | - | - | - | - | 0.40 | 0.37 | 0.40 | 0.3 | 0.40 | 0.03 | 0.40 | 0.09 | 0.40 | 0.09 | 0.40 | 0.09 | ||
References
- Dugan, R.C.; McDermott, T.E. Distributed generation. IEEE Ind. Appl. Mag. 2002, 8, 19–25. [Google Scholar] [CrossRef]
- Salman, S.; Rida, I. Investigating the impact of embedded generation on relay settings of utilities electrical feeders. IEEE Trans. Power Deliv. 2001, 16, 246–251. [Google Scholar] [CrossRef]
- Anderson, P.M. Power System Protection; Sons, J.W., Ed.; IEEE Press: Piscataway, NJ, USA, 1998. [Google Scholar]
- Girgis, A.; Brahma, S.M. Effect of distributed generation on protective device coordination in distribution system. In Proceedings of the Large Engineering Systems Conference of Power Engineering, Halifax, NS, Canada, 11–13 July 2001. [Google Scholar]
- Scheepers, M.; van Werven, M.; Mutale, J.; Strbac, G.; Porter, D. Distributed generation in electricity markets, its impact on distribution system operators, and the role of regulatory and commercial arrangements. Int. J. Distrib. Energy Resour. 2006, 2, 35–38. [Google Scholar]
- Jenkins, N. Embedded generation. Power Eng. J. 1995, 9, 145–150. [Google Scholar] [CrossRef]
- Doyle, M.T. Reviewing the impacts of distributed generation on distribution system protection. Power Eng. Soc. Summer Meet. IEEE 2002, 1, 103–105. [Google Scholar]
- Repo, S.; Jarventausta, P.; Maki, K. Protection requirement graph for interconnection of distributed generation on distribution level. Int. J. Energy Issues 2007, 28, 47–64. [Google Scholar]
- Girgis, A.; Fallon, C.M.; Lubkeman, D.L. A fault location technique for rural distribution feeders. IEEE Trans. Ind. Appl. 1993, 29, 1170–1175. [Google Scholar] [CrossRef]
- Das, R. Estimating locations of shunt faults on distribution lines. Master’s Thesis, College of Graduate Studies and Research, University of Saskatchewan, Saskatoon, SK, Canada, 1995. [Google Scholar]
- Das, R.; Sachdev, M.S.; Sidhu, T.S. A technique for estimating locations of shunt faults on distribution lines. In Proceedings of the IEEE WESCANEX 95. Communications, Power, and Computing. Conference Proceedings, Winnipeg, MB, Canada, 15–16 May 1995; Volume 1, pp. 6–11. [Google Scholar]
- Tarek, K.; Girgis, A. Protection Coordination Planning with Distributed Generation. Master’s Thesis, CETC Varennes—Energy Technology and Programs Sector, Varennes, QC, Canada, 2007. [Google Scholar]
- Warrington, A.R.V.C. Protective Relays: Their Theory and Practice; Wiley, J., York, S.N., Eds.; Springer: Cham, Switzerland, 1969. [Google Scholar]
- Sant, M.T.; Paithankar, Y.G. Online digital fault locator foroverhead transmission line. Proc. Inst. Electr. 1979, 126, 1181–1185. [Google Scholar] [CrossRef]
- Sant, M.T.; Paithankar, Y. Fault locator for long ehv transmission lines. Electr. Power Syst. Res. 1983, 6, 305–310. [Google Scholar] [CrossRef]
- Takagi, T.; Yamakoshi, Y.; Yamaura, M.; Kondow, R.; Matsushima, T. Development of a new type fault locator using the One-Terminalvoltage and current data. IEEE Trans. Power Appar. Syst. 1982, PAS-101, 2892–2898. [Google Scholar] [CrossRef]
- Edmond, S., III. Evaluation and development of transmission line fault-locating techniques which use sinusoidal steady-state. Comput. Electr. Eng. 1983, 10, 269–278. [Google Scholar]
- Johns, A.T.; Lai, L.L.; El-Hami, M.; Daruvala, D.J. New approach to directional fault location for overhead power distribution feeders. Gener. Transm. Distrib. IEE Proc. C 1991, 138, 351–357. [Google Scholar] [CrossRef]
- Jang, J.S. ANFIS: Adaptive-network-based fuzzy inference system. IEEE Trans. Syst. Man Cybern. 1993, 23, 665–685. [Google Scholar] [CrossRef]
- Russell, S.; Norvig, P. Artificial Intelligence: A Modern Approach, 2nd ed.; Prentice Hall: Hoboken, NJ, UK, 2002. [Google Scholar]
- Brand, C.B.K.; Wimmer, W. Design of IEC 61850 Based Substation Automation Systems According to Customer Requirements; Paper b5-103; CIGRE: Paris, France, 2004. [Google Scholar]
- Paithankar, Y.G. Transmission Network Protection: Theory and Practice; Routledge: Oxfordshire, UK, 1997. [Google Scholar]
- Noghabi, A.S.; Sadeh, J.; Mashhadi, H.R. Considering different network topologies in optimal overcurrent relay coordination using a hybrid GA. IEEE Trans. Power Deliv. 2019, 24, 1857–1863. [Google Scholar] [CrossRef]
- Knable, A. A standardized approach to relay coordination. IEEE Winter Power Meet. 1969, 69, 58. [Google Scholar]
- Jenkins, L.; Khicha, H.; Shivakumar, S.; Dash, P. An application of function dependencies to the topological analysis of protection schemes. IEEE Trans. Power Deliv. 1992, 7, 77–83. [Google Scholar] [CrossRef] [Green Version]
- Urdaneta, A.J.; Nadira, R.; Perez Jimenez, L.G. Optimal coordination of directional overcurrent relays in interconnected power systems. IEEE Trans. Power Deliv. 1988, 3, 903–911. [Google Scholar] [CrossRef]
- Chattopadhyay, B.; Sachdev, M.S.; Sidhu, T.S. An on-line relay coordination algorithm for adaptive protection using linear programming technique. IEEE Trans. Power Deliv. 1996, 11, 165–173. [Google Scholar] [CrossRef]
- So, C.W.; Li, K.K. Time coordination method for power system protection by evolutionary algorithm. IEEE Trans. Ind. Appl. 2000, 36, 1235–1240. [Google Scholar] [CrossRef]
- Laway, N.A.; Gupta, H.O. A method for adaptive coordination of overcurrent relays in an interconnected power system. In Proceedings of the Fifth International Conference on Developments in Power System Protection, York, UK, 30 March–2 April 1993; pp. 240–243. [Google Scholar]
- Bedekar, P.; Bhide, S.; Kale, V. Optimum time coordination of overcurrent relays in distribution system using big-m (penalty) method. WSEAS Trans. Power Syst. 2019, 4, 341–350. [Google Scholar]
- IEC 61850-SER; Communication Networks and Systems in Substations. All Parts. IEC Std: Geneva, Switzerland, 2005.
- Soman, S. Lectures on Power System Protection. Module 5, Lecture 19. NPTEL Online. 2010. Available online: www.cdeep.iitb.ac.in (accessed on 26 March 2022).
- Keil, T.; Jager, J. Advanced coordination method for overcurrent protection relays using nonstandard tripping characteristics. IEEE Trans. Power Deliv. 2018, 23, 52–57. [Google Scholar] [CrossRef]
- IEEE. 34 Node Test Feeder; The Institute of Electrical and Electronics Engineers, Inc.: Piscataway, NJ, USA, 2004. [Google Scholar]
- Proyecto Tipo Unión Fenosa Líneas Eléctricas Aéreas de Hasta 20 kV; UFD: Madrid, Spain, 2017.


| Type of Curve | α | β |
|---|---|---|
| Standard inverse time | 0.14 | 0.02 |
| Very inverse | 13.5 | 1 |
| Extremely inverse | 80 | 2 |
| Long inverse time | 120 | 1 |
| Bus (Node) | Location Faults | Main Protection | Backup Protection |
|---|---|---|---|
| 2 | F2 | OCR2 | OCR1 |
| 7 | F7 | RC | OCR1 |
| 21 | F21 | RC | OCR3 |
| F2 | F7 | F21 | |||||||||
|---|---|---|---|---|---|---|---|---|---|---|---|
| Penetration Level DG | Penetration Level DG | Penetration Level DG | |||||||||
| Fault Type | 17% | 33% | 50% | 17% | 33% | 50% | 17% | 33% | 50% | ||
| Three-phase | IOCR1 | 1568 | 1568 | 1568 | 1193 | 1116 | 1104 | 321 | 325 | 328 | |
| IOCR2(DG) | 625 | 894 | 1077 | 570 | 778 | 919 | 392 | 407 | 417 | ||
| IOCR3 | - | - | - | - | - | - | 361 | 368 | 373 | ||
| IRC | - | - | - | 1717 | 1922 | 2052 | 667 | 681 | 689 | ||
| Single-phase | Rf = 0 | IOCR1 | 539 | 608 | 665 | 505 | 556 | 575 | 404 | 397 | 395 |
| IOCR2(DG) | 710 | 1076 | 1351 | 670 | 960 | 1165 | 480 | 465 | 474 | ||
| IOCR3 | 30.8 | 30 | 29 | 31 | 30 | 29 | 230 | 238 | 241 | ||
| IRC | 644 | 627 | 619 | 1078 | 1445 | 1662 | 728 | 746 | 754 | ||
| Rf = 5 | IOCR1 | 564 | 604 | 623 | 517 | 533 | 532 | 398 | 195 | 393 | |
| IOCR2(DG) | 736 | 943 | 1059 | 669 | 827 | 918 | 446 | 461 | 469 | ||
| IOCR3 | 32.45 | 33 | 33 | 31.6 | 32 | 32 | 211 | 216 | 219 | ||
| IRC | 677 | 697 | 706 | 1060 | 1263 | 1359 | 733 | 748 | 754 | ||
| Rf = 10 | IOCR1 | 523 | 535 | 535 | 490 | 488 | 462 | 396 | 393 | 464 | |
| IOCR2(DG) | 664 | 677 | 820 | 616 | 703 | 751 | 443 | 456 | 391 | ||
| IOCR3 | 33.3 | 33 | 33.9 | 32 | 33 | 33 | 194 | 199 | 200 | ||
| IRC | 695 | 705 | 708 | 1000 | 1103 | 1146 | 735 | 747 | 753 | ||
| Rf = 15 | IOCR1 | 488 | 491 | 488 | 466 | 459 | 452 | 394 | 391 | 389 | |
| IOCR2 | 605 | 667 | 699 | 572 | 628 | 658 | 440 | 452 | 459 | ||
| IOCR3 | 33 | 33 | 33.6 | 32 | 33 | 33 | 180 | 184 | 195 | ||
| IRC | 698 | 703 | 699 | 944 | 1004 | 1028 | 735 | 746 | 751 | ||
| Rf = 20 | IOCR1 | 464 | 464 | 461 | 448 | 440 | 434 | 392 | 448 | 387 | |
| IOCR2(DG) | 563 | 607 | 629 | 540 | 580 | 602 | 437 | 389 | 454 | ||
| IOCR3 | 33 | 33.5 | 33 | 33 | 33 | 33 | 168 | 171 | 172 | ||
| IRC | 697 | 699 | 699 | 900 | 040 | 956 | 734 | 744 | 748 | ||
| Rf = 25 | IOCR1 | 447 | 446 | 443 | 435 | 427 | 422 | 390 | 387 | 385 | |
| IOCR2(DG) | 534 | 567 | 598 | 517 | 548 | 565 | 434 | 444 | 456 | ||
| IOCR3 | 33 | 33.3 | 33.3 | 33 | 33 | 33 | 158 | 160 | 161 | ||
| IRC | 696 | 697 | 696 | 869 | 897 | 908 | 733 | 742 | 745 | ||
Publisher’s Note: MDPI stays neutral with regard to jurisdictional claims in published maps and institutional affiliations. |
© 2022 by the authors. Licensee MDPI, Basel, Switzerland. This article is an open access article distributed under the terms and conditions of the Creative Commons Attribution (CC BY) license (https://creativecommons.org/licenses/by/4.0/).
Share and Cite
Alcala-Gonzalez, D.; García del Toro, E.M.; Más-López, M.I.; García-Salgado, S.; Pindado, S. Linear Programming Coordination for Overcurrent Relay in Electrical Distribution Systems with Distributed Generation. Appl. Sci. 2022, 12, 4279. https://doi.org/10.3390/app12094279
Alcala-Gonzalez D, García del Toro EM, Más-López MI, García-Salgado S, Pindado S. Linear Programming Coordination for Overcurrent Relay in Electrical Distribution Systems with Distributed Generation. Applied Sciences. 2022; 12(9):4279. https://doi.org/10.3390/app12094279
Chicago/Turabian StyleAlcala-Gonzalez, Daniel, Eva M. García del Toro, M. Isabel Más-López, Sara García-Salgado, and Santiago Pindado. 2022. "Linear Programming Coordination for Overcurrent Relay in Electrical Distribution Systems with Distributed Generation" Applied Sciences 12, no. 9: 4279. https://doi.org/10.3390/app12094279
APA StyleAlcala-Gonzalez, D., García del Toro, E. M., Más-López, M. I., García-Salgado, S., & Pindado, S. (2022). Linear Programming Coordination for Overcurrent Relay in Electrical Distribution Systems with Distributed Generation. Applied Sciences, 12(9), 4279. https://doi.org/10.3390/app12094279