Article

Advances in the Characterization of Usnea barbata (L.) Weber ex F.H. Wigg from Călimani Mountains, Romania

by
Violeta Popovici
1,
Laura Bucur
2,*,
Cerasela Elena Gîrd
3,*,
Suzana Ioana Calcan
4,
Elena Iulia Cucolea
4,
Teodor Costache
4,
Dan Rambu
4,
Mădălina Ungureanu-Iuga
5,6,*,
Mircea Oroian
5,*,
Silvia Mironeasa
5,†,
Verginica Schröder
7,*,
Emma Adriana Ozon
8,†,
Aureliana Caraiane
9,† and
Victoria Badea
1,†
1
Department of Microbiology and Immunology, Faculty of Dental Medicine, Ovidius University of Constanta, 7 Ilarie Voronca Street, 900684 Constanta, Romania
2
Department of Pharmacognosy, Faculty of Pharmacy, Ovidius University of Constanta, 6 Capitan Al. Serbanescu Street, 900001 Constanta, Romania
3
Department of Pharmacognosy, Phytochemistry, and Phytotherapy, Faculty of Pharmacy, Carol Davila University of Medicine and Pharmacy, 6 Traian Vuia Street, 020956 Bucharest, Romania
4
Research Center for Instrumental Analysis SCIENT, 1E Petre Ispirescu Street, 077167 Ilfov, Romania
5
Faculty of Food Engineering, Stefan cel Mare University of Suceava, 13th University Street, 720229 Suceava, Romania
6
Integrated Center for Research, Development, and Innovation in Advanced Materials, Nanotechnologies and Distributed Systems for Fabrication and Control (MANSiD), Stefan cel Mare University of Suceava, 13th University Street, 720229 Suceava, Romania
7
Department of Cellular and Molecular Biology, Faculty of Pharmacy, Ovidius University of Constanta, 6 Capitan Al. Serbanescu Street, 900001 Constanta, Romania
8
Department of Pharmaceutical Technology and Biopharmacy, Faculty of Pharmacy, Carol Davila University of Medicine and Pharmacy, 6 Traian Vuia Street, 020956 Bucharest, Romania
9
Department of Oral Rehabilitation, Faculty of Dental Medicine, Ovidius University of Constanta, 7 Ilarie Voronca Street, 900684 Constanta, Romania
*
Authors to whom correspondence should be addressed.
These authors contributed equally to this work.
Appl. Sci. 2022, 12(9), 4234; https://doi.org/10.3390/app12094234
Submission received: 17 February 2022 / Revised: 16 April 2022 / Accepted: 19 April 2022 / Published: 22 April 2022
(This article belongs to the Special Issue Plants, Lichens, Fungi and Algae Ingredients for Nutrition and Health)

Abstract

:
Usnea barbata (L.) Weber ex F.H. Wigg (U. barbata) is a medicinal representative of the lichens from the Usnea genus (Parmeliaceae, lichenized Ascomycetes), containing bioactive secondary metabolites. The aim of this study is a comparative analysis between two separated parts of the thallus layers: medulla–cortex (mcUB) and central cord (ccUB) and the whole dried U. barbata thallus (dUB). These three samples were examined regarding color differences. The U. barbata thallus morphology was examined through fluorescent microscopy (FM) and scanning electron microscopy (SEM). The mineral content was measured using inductively coupled plasma mass spectrometry (ICP-MS), and Fourier transform infrared spectroscopy (FT-IR) preliminarily established the differences in the metabolite content. Finally, extracts in different solvents (ethanol and acetone) were obtained from all studied samples, and their total phenolic content (TPC) and free radical scavenging activity (antiradical activity, AA) were evaluated by spectrophotometry. The ICP-MS results showed that from 23 elements analyzed, 18 minerals were quantified in mcUB, 13 in dUB, and only 12 in ccUB. The ccUB fraction recorded the lowest mineral content, color intensity (chroma), luminosity (L*), and TPC value, followed in increasing order by dUB and mcUB. FT-IR spectra displayed different peaks in ccUB and dUB samples compared to mcUB. The mcUB fraction also showed the highest TPC, significantly correlated with AA. However, dUB had the highest antiradical activity, followed by mcUB and ccUB, with noticeable differences in the acetone extract. The final correlation between all variable data obtained indicates that 99.31% of the total variance was associated with all minerals, total phenolics, and color parameters and was also related to the antiradical activity. These obtained results complete our previous studies on autochthonous U. barbata. Moreover, being a source of bioactive metabolites, extracting them from the mcUB fraction could increase this process’s yield and selectivity.

1. Introduction

Lichens (also known as lichenized fungi [1]) are symbiont organisms between fungi and algae/cyanobacteria [2]. They could be considered a potential source of new drugs [3] due to their bioactive secondary metabolites with various pharmacological effects [4]. One of the most significant representatives in the lichens world is the Usnea genus (Parmeliaceae, lichenized Ascomycetes), a potent phytomedicine with various pharmacological activities [5]. It has more than 600 species, endemic to Asia, Africa, Europe, and America and is used worldwide for traditional medicines (except in Australia) and food preparation [6]. Usnea sp. can be transplanted for air monitoring [7], and, at the same time, their culture conditions could be optimized, aiming for biomass increasing and antioxidant metabolite production [8]. Due to their significant diversity, the Usnea lichens are mainly studied in various Earth regions: Europe [9], India [10], Russia [11], Taiwan [12], Turkey [13], and New Zeeland [14]. U. barbata is a valuable representative of the Usnea genus, used in ethnomedicine, homeopathy, and the cosmetic industry [15]. Moreover, Redzic et al. [16] proved that U. barbata was used as human food (mush and lichen bread) for survival in four-year-long (1992–1995) war conditions in Bosnia.
All U. barbata benefits are due to its chemical composition, which is strongly dependent on growth conditions [17]. Bazarnova et al. [18] quantified in U. barbata various primary and secondary metabolites. The most well-known phenolic secondary metabolites reported are oligosaccharides, monosaccharides (glucose and galactose), citric, succinic, alpha-linolenic, and stearic acids. According to Salgado et al. [19], various polyhydroxylated lipids, fatty acids, and other undetected compounds can be added to the U. barbata phytochemical profile.
The fungal partner (mycobiont) synthesizes these specific compounds mainly due to symbiosis. As a response to biological and abiotic stress, the secondary metabolites are extracellular and are found within the lichen thalli as crystals on the fungal hyphae surface [20]. The primary metabolites are required for lichen growth and nutrition. They are intracellular in fungal or algal (photobiont) cells [20]. By weight, the mycobiont predominates in U. barbata, compared to photobionts, assuring the form of the thallus built due to both symbiotic partners’ activity. U. barbata is a fruticose lichen; its thallus has a heteromerous structure with three layers: cortex, medulla, and central axis (central cord). As a cover, U. barbata has a thin cortex (external layer) with a subcortical, low represented algal zone. These structures are followed by a medulla and a cartilaginous central axis (central cord) [9]. The upper cortex has a compact structure formed by a dense pack of fungal hyphae, with a protective role. Algal cells interweaved with fungal hyphae compose the green algal zone [9]. The medulla is thick and loose, with rare fungal hyphae. Finally, the central axis (central cord) is formed by longitudinal fungal hyphae that are densely packed, forming a compact cartilaginous structure [21]. Around this central cord, the other layers (medulla and cortex) and algal zone have a radial disposition. Both associated organisms function in the symbiotic process. The algal partner provides carbohydrates resulting from photosynthesis; they are directly transferred to the lichen-forming fungus in a specific form, thus increasing the resistance to desiccation [22]. The mycobiont assures the nutrients and metals required for algal metabolic processes. Moreover, the fungal partner synthesizes secondary metabolites to protect the photobiont against extreme temperatures, UV exposure, desiccation, and herbivores [23]. When a high heavy metal accumulation in the lichen thallus occurs, these lichen metabolites form complexes, increasing lichen metal tolerance [24]. When heavy metals pass intracellularly, they are expected to influence the lichen metabolic processes.
Numerous authors analyzed the lichen thallus components in their studies for various reasons. Hájek et al. [25] showed the influence of low temperature on the Usnea sp. thalli structure. Zverina et al. [26] and Carreras et al. [27] described heavy metal accumulation in Usnea sp. and the lichen thallus destruction by heavy metal stress. Bubach et al. [21] performed a correlation between the matrix of the biological elements (Na, Mg, K, Ca, Fe) and geographical parameters in both fractions (cortex–medulla and central axis) of Usnea sp. affected by a volcanic eruption.
Our study’s novelty consists of separating and analyzing these two different parts of the U. barbata thallus (medulla–cortex and central cord). We aimed to explore the morphology of U. barbata lichen native to the volcanic Călimani Mountains using fluorescent microscopy (FM) and electronic scanning microscopy (SEM) images. The obtained micrographs provided the U. barbata integral thallus details compared to ground samples with different particle sizes. The mineral content, phenolic secondary metabolites, and free radical scavenging activity evaluation was completed with an overview of the correlation between the data obtained for all lichen samples. By establishing the fraction with the highest content of phenolic compounds, our study could increase the extraction yield of pharmacologically active secondary metabolites.

2. Materials and Methods

2.1. Lichen Sample Preparation

U. barbata is native to Calimani Mountains, Romania (900 m altitude, 47°29′ N, 25°12′ E). The lichen harvesting was performed in March 2020 from a conifer forest belonging to a natural peat bog region [28]. The freshly collected thalli were cleaned and naturally dried in an airy room sheltered from direct sunlight at 18–25 °C [29].
The dried lichen preservation for an extended period was performed in large paper bags under similar conditions. At the Ovidius University of Constanta, Department of Pharmaceutical Botany, Faculty of Pharmacy, U. barbata identification was realized using standard methods [9]. Samples are preserved at Ovidius University of Constanta, in the Herbarium of Pharmacognosy Department, Faculty of Pharmacy (Popovici 2/2020, Ph-UOC) [29]. The dried lichen thalli were ground in a laboratory mill, LM 120 (Perkin Elmer, Waltham, MA, USA) for 5 min [30]. After grinding, the dried U. barbata lichen was passed through a sieve (no. 5 [31]) and separated into two fractions. The first fraction of the dried lichen (dUB)—medulla–cortex (mcUB)—was passed again through the meshes of the same sieve and separated as a moderately fine (315 μm) powder. The central cord represents the second fraction (ccUB).
All lichen parts were ground again in the laboratory mill and passed through a sieve (no. 7), thus obtaining a fine powder with particle size < 180 μm. The samples were kept in small paper bags until analysis (Supplementary Material, Figure S1).

2.2. Lichen Morphology

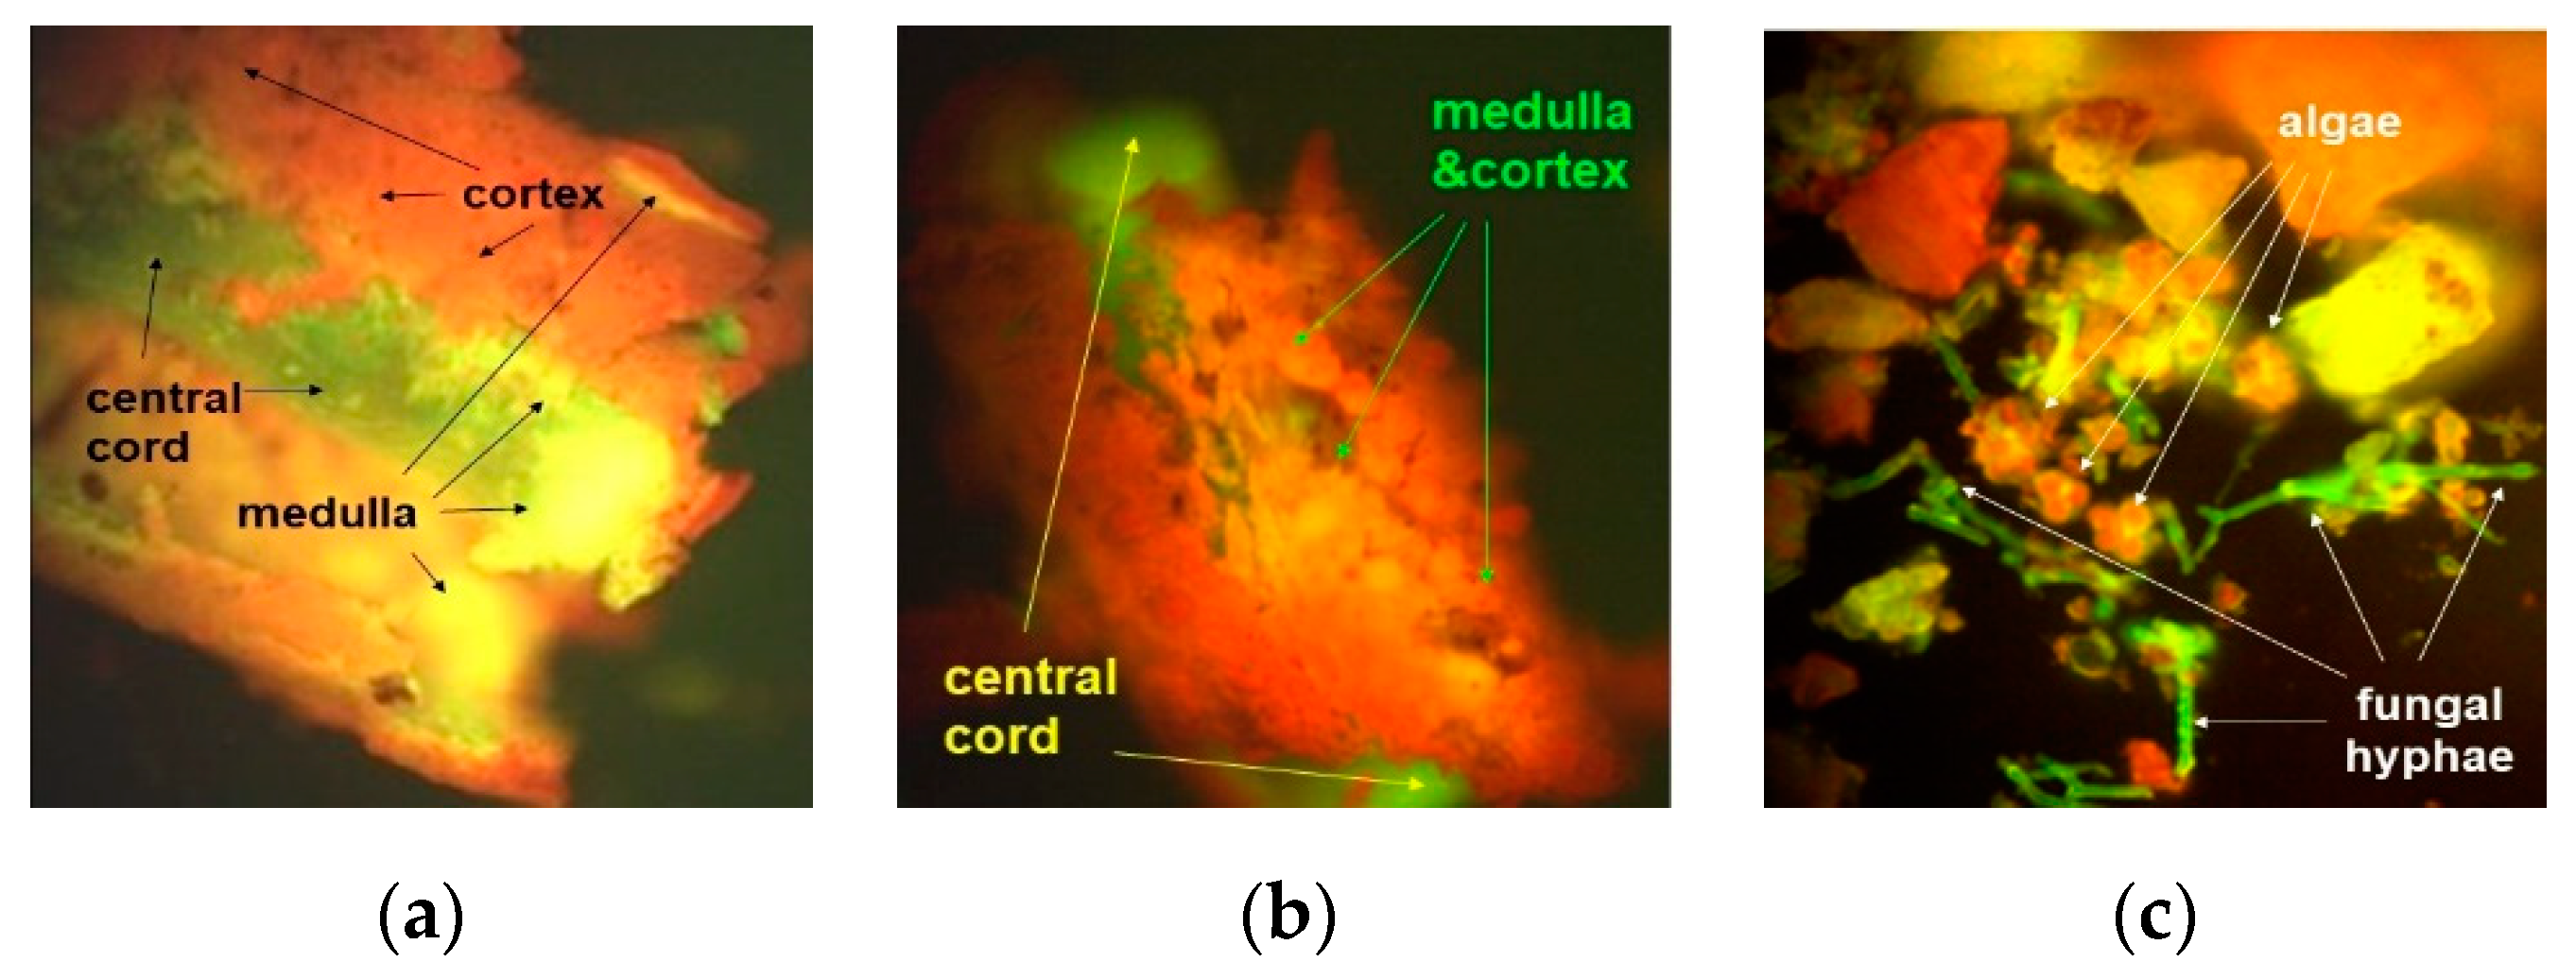
2.2.1. Fluorescent Microscopy

Fluorescent microscopy images were obtained using an OPTIKA B-350 microscope (Ponteranica, BG, Italy) blue filter (λex = 450–490 nm; λem = 515–520 nm) and green filter (λex = 510–550 nm; λem = 590 nm). The dried U. barbata lichen thalli (Figure 1a) were washed with deionized water (DIW, Merck Millipore, Burlington, MA, USA). The hand-cut cross-sections were hydrated with phosphate saline buffer (Thermo Fisher Scientific, Waltham, MA, USA), pH = 7.4, and stained with 3% acridine orange (Merck Millipore, Burlington, MA, USA) for 5 min. The samples were rinsed with DIW and placed on the microscope slides. The FM images were obtained at 100× and 400× magnification and processed with Optikam Pro 3 Software (OPTIKA S.R.L., Ponteranica, BG, Italy). All observations were performed in triplicate.

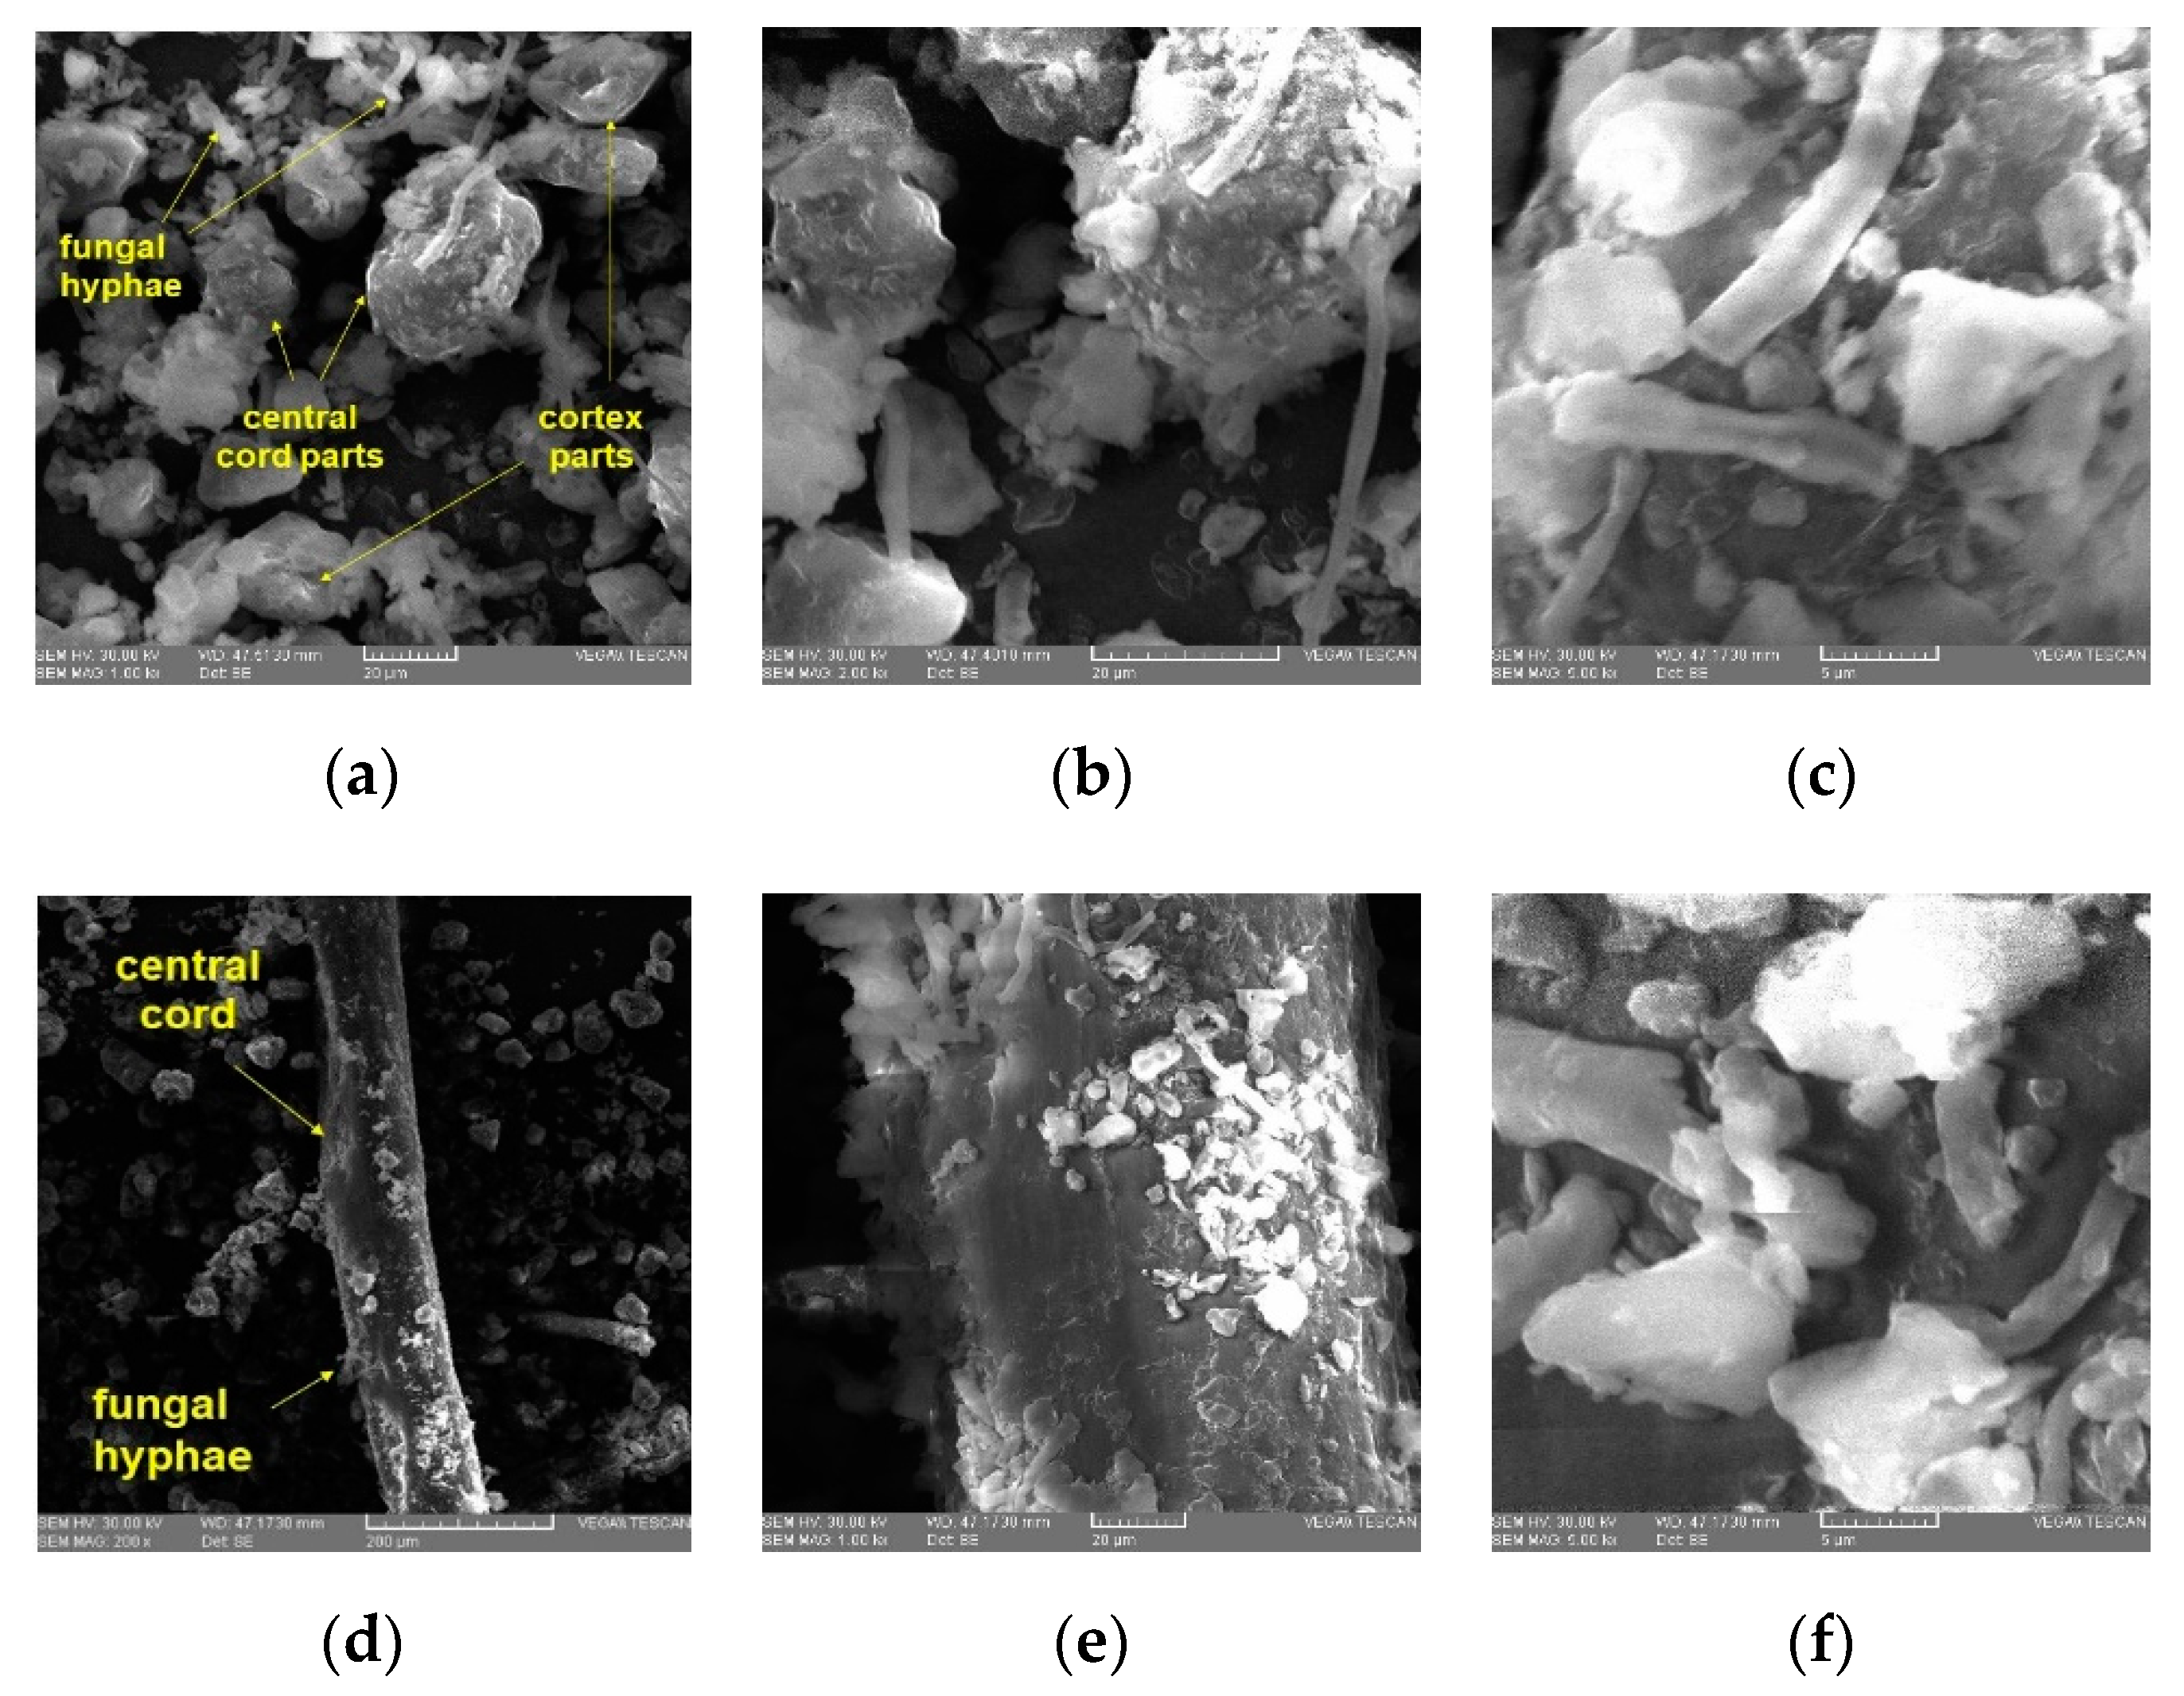
2.2.2. Scanning Electron Microscopy

We aimed to recognize the specific U. barbata morphology by examining the ground samples, dUB, mcUB, and ccUB, with particles of different sizes: approximately 315 μm (Figure 1b–d) and 180 μm (Figure S1, Supplementary Material) using scanning electron microscopy.
Scanning electron microscopy (SEM) images were obtained using a VEGA II LSH (Tescan, Czech Republic) device. The samples were fixed on double-sided carbon adhesive bands, and the acceleration tension was 30 kV. The SEM images were obtained at different magnifications (200×, 300×, 1 k×, 2 k×, 5 k×) and scale bars (200 μm–5 μm). All observations were performed in triplicate.

2.3. Color Evaluation

The color properties of U. barbata dried lichen and both parts (mcUB and ccUB) as a fine powder (particle size < 180 μm) were determined in triplicate in the CIELab system by using a Konica Minolta CR-400 (Konica Minolta, Tokyo, Japan) colorimeter. The color properties in terms of L* (lightness, 0 for absolute black, 100 for absolute white), a* (red-green intensity), and b* (yellow-blue intensity) were recorded in triplicate. The hue angle (0°—red, 90°—yellow, 180°—green, and 270°—blue) and chroma value (0—gray, 100—pure color) were calculated using Equations (1) and (2):
h a b = a r c t a n ( b * a * )
C * = ( a * ) 2 + ( b * ) 2
where hab—hue angle, C*—Chroma, L*—lightness, a*—positive values describe red and negative, green nuance, b*—positive values represent yellow and negative, blue nuance.

2.4. Elemental Analysis
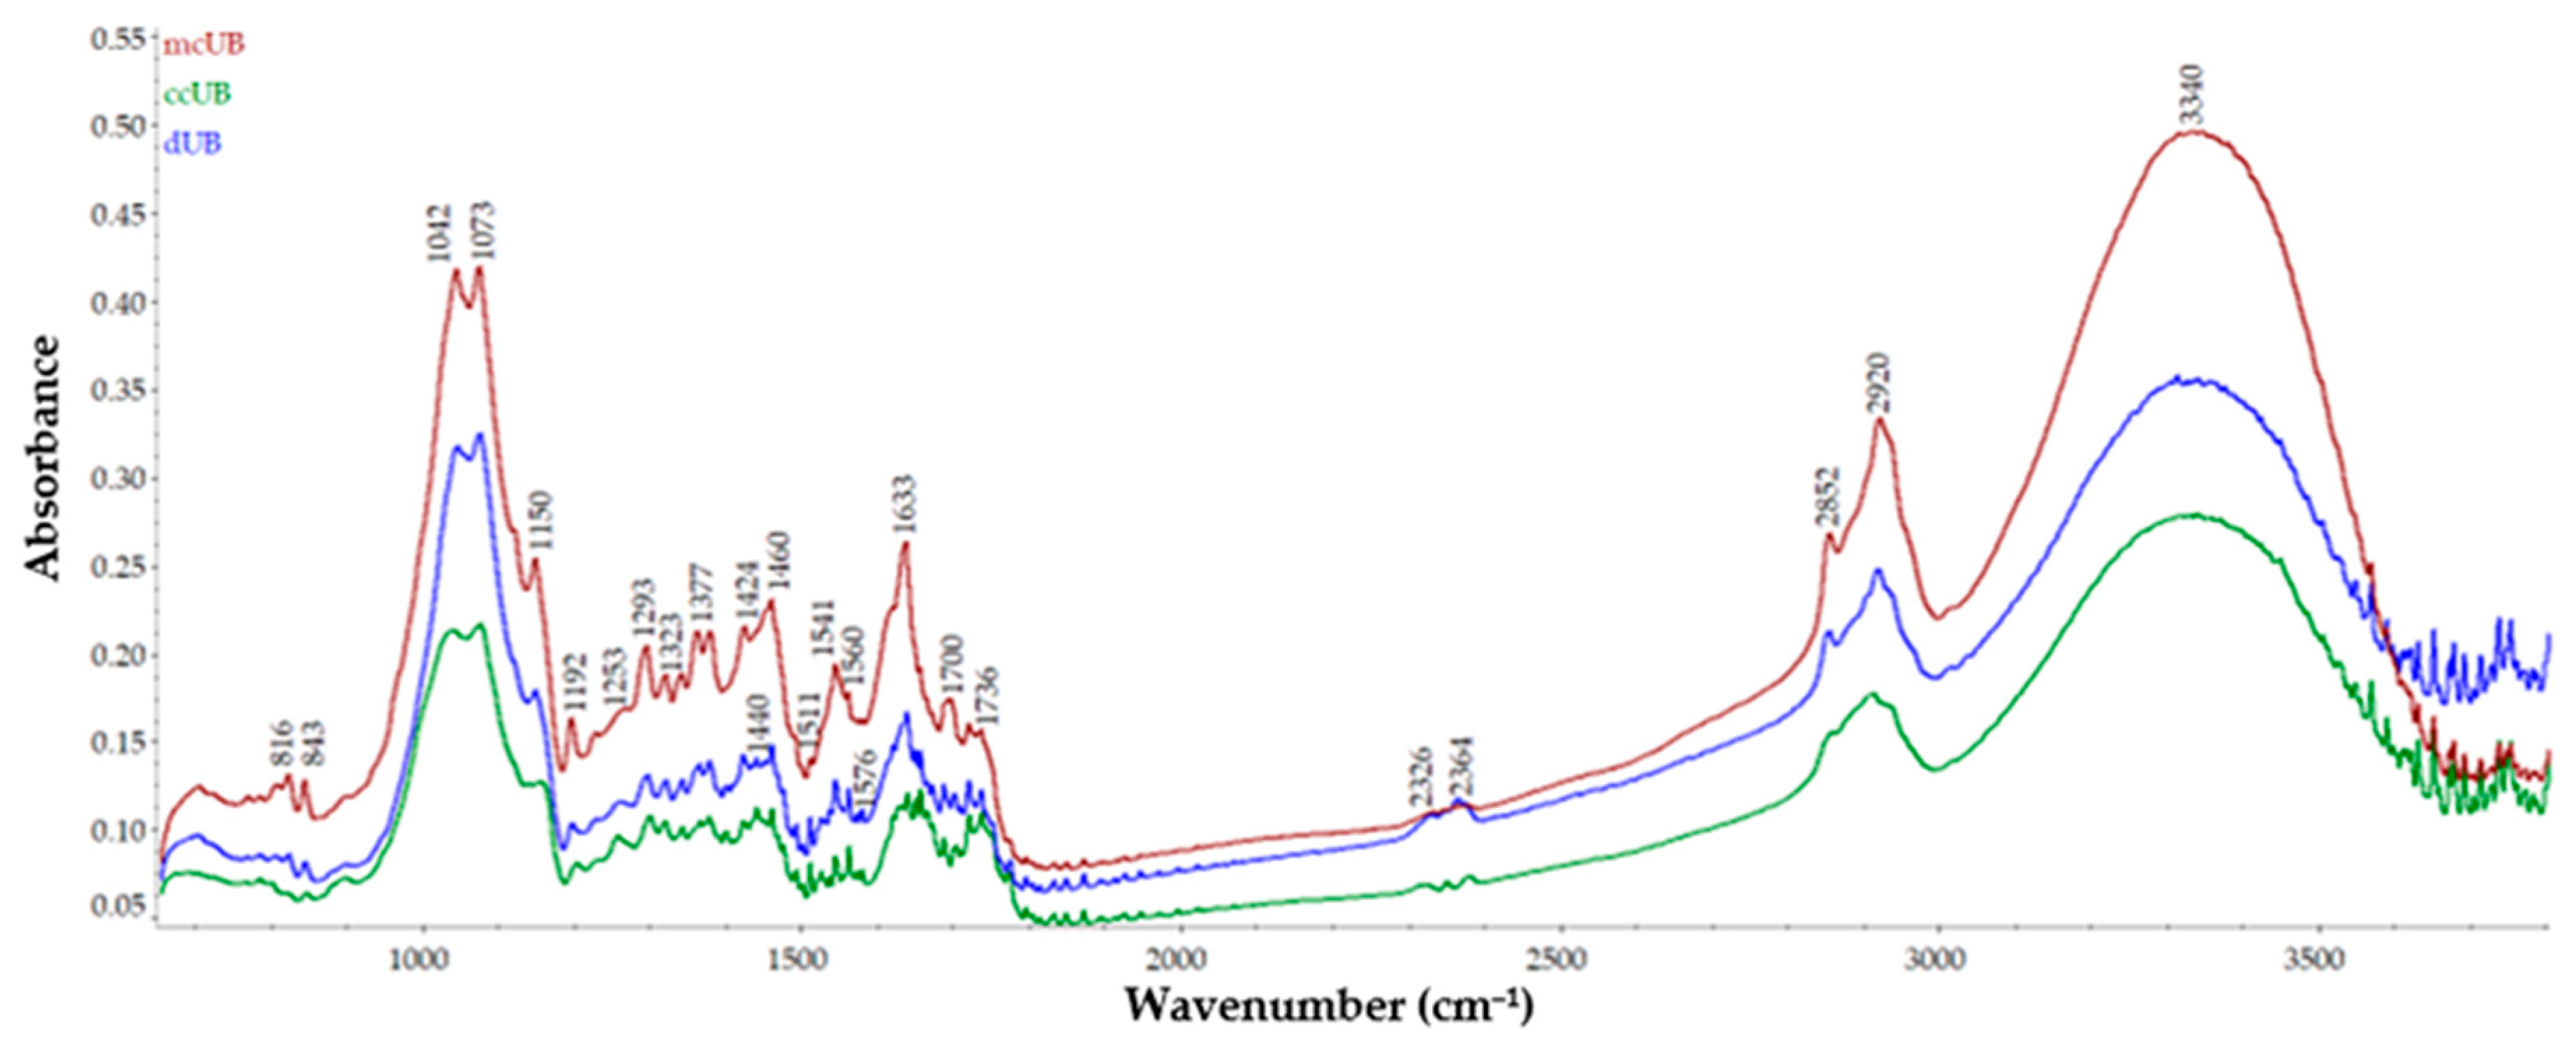
ICP-MS analyzed twenty-three elements in lichen samples: calcium (Ca), iron (Fe), (magnesium (Mg), manganese (Mn), zinc (Zn), aluminum (Al), silver (Ag), barium (Ba), cobalt (Co), chromium (Cr), copper (Cu), lithium (Li), nickel (Ni), thallium (Tl), vanadium (V), molybdenum (Mo), palladium (Pa), platinum (Pt), antimony (Sb), arsenic (As), lead (Pb), cadmium (Cd), and mercury (Hg). Our previous study described this method [28], and detailed data can be found in Supplementary Material, Tables S1–S4.
The NexION™ 300S inductively coupled plasma mass spectrometer (PerkinElmer, Inc., Hopkinton, MA, USA) was the platform for elemental analysis; dried lichen sample digestion was performed with 65% HNO3 and 30% H2O2. [28].
The obtained results from the ICP-MS analysis were processed with Syngistix Software (PerkinElmer, Inc, Hopkinton, MA, USA) Version 2.3. This determination was done in triplicate, and the mineral concentrations were expressed as the mean (n = 3) ± SD [28].

2.5. FT-IR Analysis

Ground lichen samples (particle size ≤180 μm) were analyzed in triplicate by Fourier-transform infrared spectroscopy (FT-IR), by attenuated total reflection (ATR), on a Thermo Scientific Nicolet iS20 (Waltham, MA, USA) spectrometer. The spectra were recorded at 4 cm−1 intervals, in the range of 650 cm−1 to 4000 cm−1. ATR correction was applied, and the average spectra were extracted using Omnic software.

2.6. Total Phenolic Content

2.6.1. Dried Lichen Extracts in Ethanol and Acetone

Two series of approximately 1 g dUB, mcUB, and ccUB were refluxed for 1 h with 100 mL solvent (96% ethanol and acetone). The resulting extractive solutions for each lichen part (dUB, mcUB, and ccUB) were filtered and then made up to 100 mL in a volumetric flask with each corresponding solvent (Figure S3, Supplementary Material).

2.6.2. Folin–Ciocâlteu Method

According to a previously described method, the total phenolic content was determined using the Folin–Ciocâlteu reagent (Merck, Darmstadt, Germany) [32]. Pyrogallol (Merck, Darmstadt, Germany) was used as a standard, and the TPC values were calculated as μg of pyrogallol equivalents (PyE) per g dried sample. For this analysis, in three volumetric flasks of 25 mL, 2 mL of each ethanol extract (from dUB, mcUB, and ccUB) was added, and then 1 mL of Folin–Ciocâlteu reagent, 10 mL water, and 12 mL 290 g/L of Na2CO3 solution up to the mark. In each volumetric flask, a blue coloration appeared. After 30 min of reaction in a dark place at room temperature, the absorbance values (each value being A1 in the calculation formula) were read at 760 nm using a Jasco V630 UV-Vis Spectrophotometer (JASCO Corporation, Tokyo, Japan) with Spectra Manager™ Software. A similar determination of phenolic contents was performed for dUB, mcUB, and ccUB acetone extracts. The total polyphenol content (TPC) determination was done in triplicate, and the obtained data were expressed as the mean (n = 3) ± SD.

2.7. Free Radical Scavenging Activity

The free radical scavenging activity of the dUB, mcUB, and ccUB ethanol and acetone extracts was determined on a Jasco V630 UV-Vis Spectrophotometer (JASCO Corporation, Tokyo, Japan) using the 2,2-diphenyl-1-picrylhydrazyl (DPPH) free radical scavenging assay [28]. The DPPH solution was obtained by dissolution of DPPH (Sigma Aldrich, St. Louis, MO, USA) in methanol to assess an absorbance value of 0.80 ± 0.02; then, 3.90 mL of DPPH solution with 0.1 mL of each dried lichen extract was vortexed for 30 s. The reaction time in a dark place at room temperature was 30 min; finally, the absorbances values at 515 nm were measured. The DPPH solution in methanol with no added dried lichen extract was used as a standard, while methanol was the blank. Two dilutions in ethanol and acetone were obtained (1:2 and 1:4) for both lichen extracts, and the DPPH radical scavenging activity was calculated according to Equation (3).
Scavenging   of   DPPH   free   radicals   ( % ) = 100 ×   A   c o n t r o l A   s a m p l e   A   c o n t r o l
A control and A sample are the absorbance values at 515 nm for the DPPH and sample solutions. This determination was performed in triplicate; the obtained data are expressed as the mean (n = 3) ± SD.

2.8. Statistical Analysis

Mean values of three determinations were compared using analysis of variance (ANOVA) with the Tukey test and Student’s t-test. The differences were considered significant when p < 0.05. Principal component analysis (PCA) was performed using XLSTAT for Excel software, 2022 version (Addinsoft, New York, NY, USA).

3. Results

3.1. Lichen Samples

Dried U. barbata lichen (Figure 1a) had a green-gray color; after grinding for 5 min, the ground U. barbata thallus (dUB) obtained is shown in Figure 1b. After passing through the meshes of sieve no. 5, two fractions were separated: mcUB (Figure 1c) as a moderate fine green-gray powder and ccUB (Figure 1d) as filiform, white-yellow fragments, about 5 mm long.

3.2. Lichen Morphology

The U. barbata lichen thallus morphology, which allows the separation of both fractions (mcUB and ccUB), was visualized using two modern microscopy techniques. We performed fluorescent microscopy (FM) for the entire dried lichen and scanning electron microscopy (SEM) for ground lichen and fractions with different particle sizes.

3.2.1. Fluorescence Microscopy

Fluorescence microscopy is an efficient method for viewing the lichen internal anatomy [33]. The FM images (Figure 2) were obtained using inherent autofluorescence and acridine-orange-induced fluorescence. Thus, the U. barbata layers (Figure 2a,b) and their cellular and subcellular structures (Figure 2c) can be highlighted.
Figure 2a indicates the three layers of the lichen thallus: cortex, medulla, and central cord. Due to the thick and loose medulla, the three layers separating into two distinct parts—medulla–cortex (mcUB) and central cord (ccUB)—is clear, as shown in Figure 2a,b. With rare fungal hyphae, the loose medulla is the morphological property of U. barbata and several Usnea sp. (U. cornuta, U. fragilescens). Usnea lichens can have a compact medulla (U. longissima, U. rubicunda) or a dense one (U. ceratina, U. florida) [9].
The algal zone between the cortex and medulla in U. barbata is visible in Figure 2c. It is a subcortical structure formed by algal cells intertwined with fungal hyphae (Figure 2c).

3.2.2. Scanning Electron Microscopy

Scanning electron microscopy (SEM) is an optimal hybrid method for examining lichen thalli at high resolution [34], showing the micro-morphology of U. barbata thallus layers [35]. The obtained SEM images combined the optical microscopy visualization performance and facility with high-resolution electron microscopy [36].
Thus, the morphological characteristics were easily identified in all ground U. barbata samples with particle sizes around 315 μm. The SEM micrographs are displayed in Figure 3 and Figure 4.
Figure 3 shows SEM images of the central cord, ccUB (particle size > 315 μm), and medulla–cortex, mcUB (particle size ≤ 315 μm). The SEM micrographs of ccUB (Figure 3a–d) were obtained at the following magnifications and scale bars: 300× (scale bar = 100 μm), 1 k× (scale bar = 20 μm), 2 k× (scale bar = 20 μm), 5 k× (5 μm). The cartilaginous structure of the central cord can be observed and, on its surface, free fungal hyphae (Figure 3a,b). This particular structure of the central axis and the aspect of free fungal hyphae are detailed in Figure 3c,d at 2 k× and 5 k× magnification (scale bar = 20 μm and 5 μm).
In mcUB (particle size ≤ 315 μm), cortex fragments with a compact structure and rare fungal hyphae can be seen (Figure 3e–h). On the surface of fungal hyphae, secondary metabolite crystals can be observed (Figure 3e). In Usnea lichens, usnic acid is the most common secondary metabolite in high concentrations; for this reason, usnic acid is commonly indicated in the corresponding figures [37]. Figure 3f–h displays a cortex fragment at different magnifications: 1 k× (scale bar = 20 μm), 2 k× (scale bar = 20 μm), 5 k× (scale bar = 5 μm). At high magnifications, the structural differences between the central axis and cortex (both constituted by fungal hyphae)—which are the basis of their different properties—can be observed.
In dUB (particle size > 315 μm), we can identify the morphology of U. barbata thallus: central cord parts, cortex fragments, and rare fungal hyphae (Figure 4a–c). An isolated fragment of the central axis can be observed at different magnifications (Figure 4d–f).
The structures of both layers (central cord and cortex) formed by mycelial hyphae are essential, supporting dried lichen separation in ccUB and mcUB fractions. Their longitudinal arrangement and interweaving in the central axis give it a particular strength and elasticity. This property explains that it separates after a short grinding time and cannot be finely ground unless the grinding time is long.
The SEM micrographs of all ground lichen samples (ccUB, mcUB, and dUB) as a fine powder (particle size ≤ 180 μm) are shown in Figure 5. SEM images displayed in Figure 5 highlighted the microstructure of ccUB (Figure 5a–c) and mcUB (Figure 5d,e) achieved at different magnifications: 1 k× (scale bar = 20 μm), 2 k× (scale bar = 20 μm), and 5 k× (scale bar = 5 μm). A noticeable difference can be observed between the central cord fragments (Figure 5a–c) and the cortex ones (Figure 5d–f). Due to the compact cartilaginous structure of the intertwined longitudinal mycelial hyphae, the fragments of the central axis appear as pieces of a broken vessel, with a glossy, deep surface, irregular sharpness, or rounded edges. The structure from Figure 3d can be recognized in Figure 5c. The cortex fragments are porous, and the compact structure’s rupture during grinding occurs along with a series of pores on its thickness. The images of dUB powder (Figure 5g–i) show differentiated fragments belonging to both layers of the lichen thalli (central axis and cortex) and fungal hyphae.

3.3. Color Evaluation

The data obtained for the color parameters of U. barbata fractions are displayed in Table 1. Significant differences (p < 0.05) between all samples were observed for all color parameters considered, supported by the images from Figure 1. The highest luminosity was observed for ccUB (70.29), while the mcUB fraction presented the lowest value (59.08). The samples containing the medulla–cortex (dUB and mcUB) exhibited a green nuance indicated by the negative values of the a* parameter. In contrast, the positive values observed for ccUB suggested a red nuance. Both fractions and integral lichen showed a yellow nuance, as the positive values of the b* parameter showed, the nuance being more pronounced in ccUB (13.92). Compared to the ccUB fraction, the mcUB sample showed a lower hue angle and chroma value.
The green color is due to chlorophyll from the algal layer [22], and the yellow one to usnic acid, the most well-known phenolic secondary metabolite [38].
Chlorophyll degradation significantly increases in prolonged sunlight and heavy metal exposure of lichens [39], and their color can be modified. Due to usnic acid’s photoprotective effect, Usnea species show a moderate level of photoinhibition [40]. Zulaini et al. [41] reported that U. diffracta thalli change color chane from greyish-green to brownish-green through massive heavy metal accumulation due to chlorophyll breakdown.

3.4. Elemental Analysis

The elemental content of dried U. barbata lichen and both fractions is presented in Table 2.
It can be noted that Ca, Fe, Mg, Mn, and Zn had the highest LOQ values (5 μg/g), followed by Al (1 μg/g) and the other metals (most numerous), which had LOQ = 0.1 μg/g. Generally, the LOQ value was directly proportional to their content (Table S5, Supplementary Material).
Comparing both fractions (mcUB and ccUB) with dried lichen (dUB), the data registered in Table 2 highlight other notable aspects. Thus, mcUB reported the highest metal contents and ccUB the lowest ones; these differences were significant for macro-elements (mcUB > dUB > ccUB): Al (285.828 > 87.879 > 21.111 μg/g), Ca (1549.600 > 979.766 > 434.269 μg/g), Fe (282.468 > 52.561 > 33.107 μg/g), Mg (524.239 > 172.721 > 53.482 μg/g), and Mn (354.041 > 101.425 > 29.098 μg/g).
Generally, trace elements showed a similar distribution in dUB and both fractions, but the differences were significantly lower: Ba (12.113 > 3.782 > 0.596 μg/g), Cr (2.494 > 1.002 > 0.864 μg/g), Cu (2.246 > 1.523 > 1.286 μg/g), Ni (1.033 > 0.449 > 0.355 μg/g), Pb (2.177 > 1.296 > 0.584 μg/g), Zn (33.223 > 20.536 > 13.588 μg/g), Hg (0.708 > 0.671 > 0.539 μg/g). Another metal (V) was quantified only in mcUB and dUB (1.237 > 0.241 μg/g), being undetected in ccUB. Moreover, five trace elements undetected in dUB (As, Cd, Co, Li, Sb) were quantified in mcUB: As (0.219 μg/g), Cd (0.164 μg/g), Co (0.225 μg/g), Li (0.185 μg/g), and Sb (0.152 μg/g)

3.5. FT-IR Analysis

The molecular characteristics of U. barbata fractions are presented in Figure 6. Noticeable differences in absorbance values between fractions were observed for almost all peaks, with the highest intensities obtained for mcUB, followed by dUB and ccUB. Furthermore, in the regions 1380–1700 cm−1 and 2310–2380 cm−1, different peaks appeared in ccUB and dUB samples compared to mcUB.

3.6. Total Phenolic Content

The values of the total phenolic compounds extracted from dUB, mcUB, and ccUB in ethanol and acetone are displayed in Table 3.
Phenolic values of both extracts decreased in the order mcUB, dUB, and ccUB. TPC values for dUB and ccUB were higher in ethanol extracts (23.481 and 18.383 mg PyE/g) than in acetone ones (22.675 and 15.170 mg PyE/g). The TPC value in mcUB acetone extract was 36.243 mg PyE/g, significantly higher than that in ethanol (25.212 mg PyE/g). These differences are due to the nature and amount of phenolic compounds in each sample extracted by each solvent. The coloration of the ethanol and acetone extracts from each of the three lichen samples (Figure S2, Supplementary Material) also supports this observation.

3.7. Free Radical Scavenging Activity

The obtained results are displayed in Table 3. Both extracts’ free radical scavenging activity decreased in the order dUB, mcUB, and ccUB (Table 3). In ethanol extracts, % DPPH radical scavenging values registered were not significantly different between dUB (15.985%) and mcUB (15.735%), while ccUB showed a significantly different value (15.080%). Moreover, only mcUB had AA highly correlated with TPC (R2 = 0.976); the others showed a moderate correlation: R2 = 0.776 (dUB) and R2 = 0.738 (ccUB). Acetone extracts displayed considerable differences: 16.878% (dUB), 12.747% (mcUB), and 11.336% (ccUB). In this case, ccUB (R2 = 0.997) showed the highest correlation between antiradical activity and the TPC value, followed by mcUB (R2 = 0.969) and dUB (R2 = 0.883). Only dUB acetone extract had AA higher than the ethanol one; mcUB and ccUB acetone extracts had lower antiradical activity compared to ethanol ones (Table 3). Finally, comparing the AA and TPC for all lichen samples in each solvent, we can see that only the antiradical activity of ethanol extracts had a moderate correlation with TPC (R2 ethanol = 0.755).

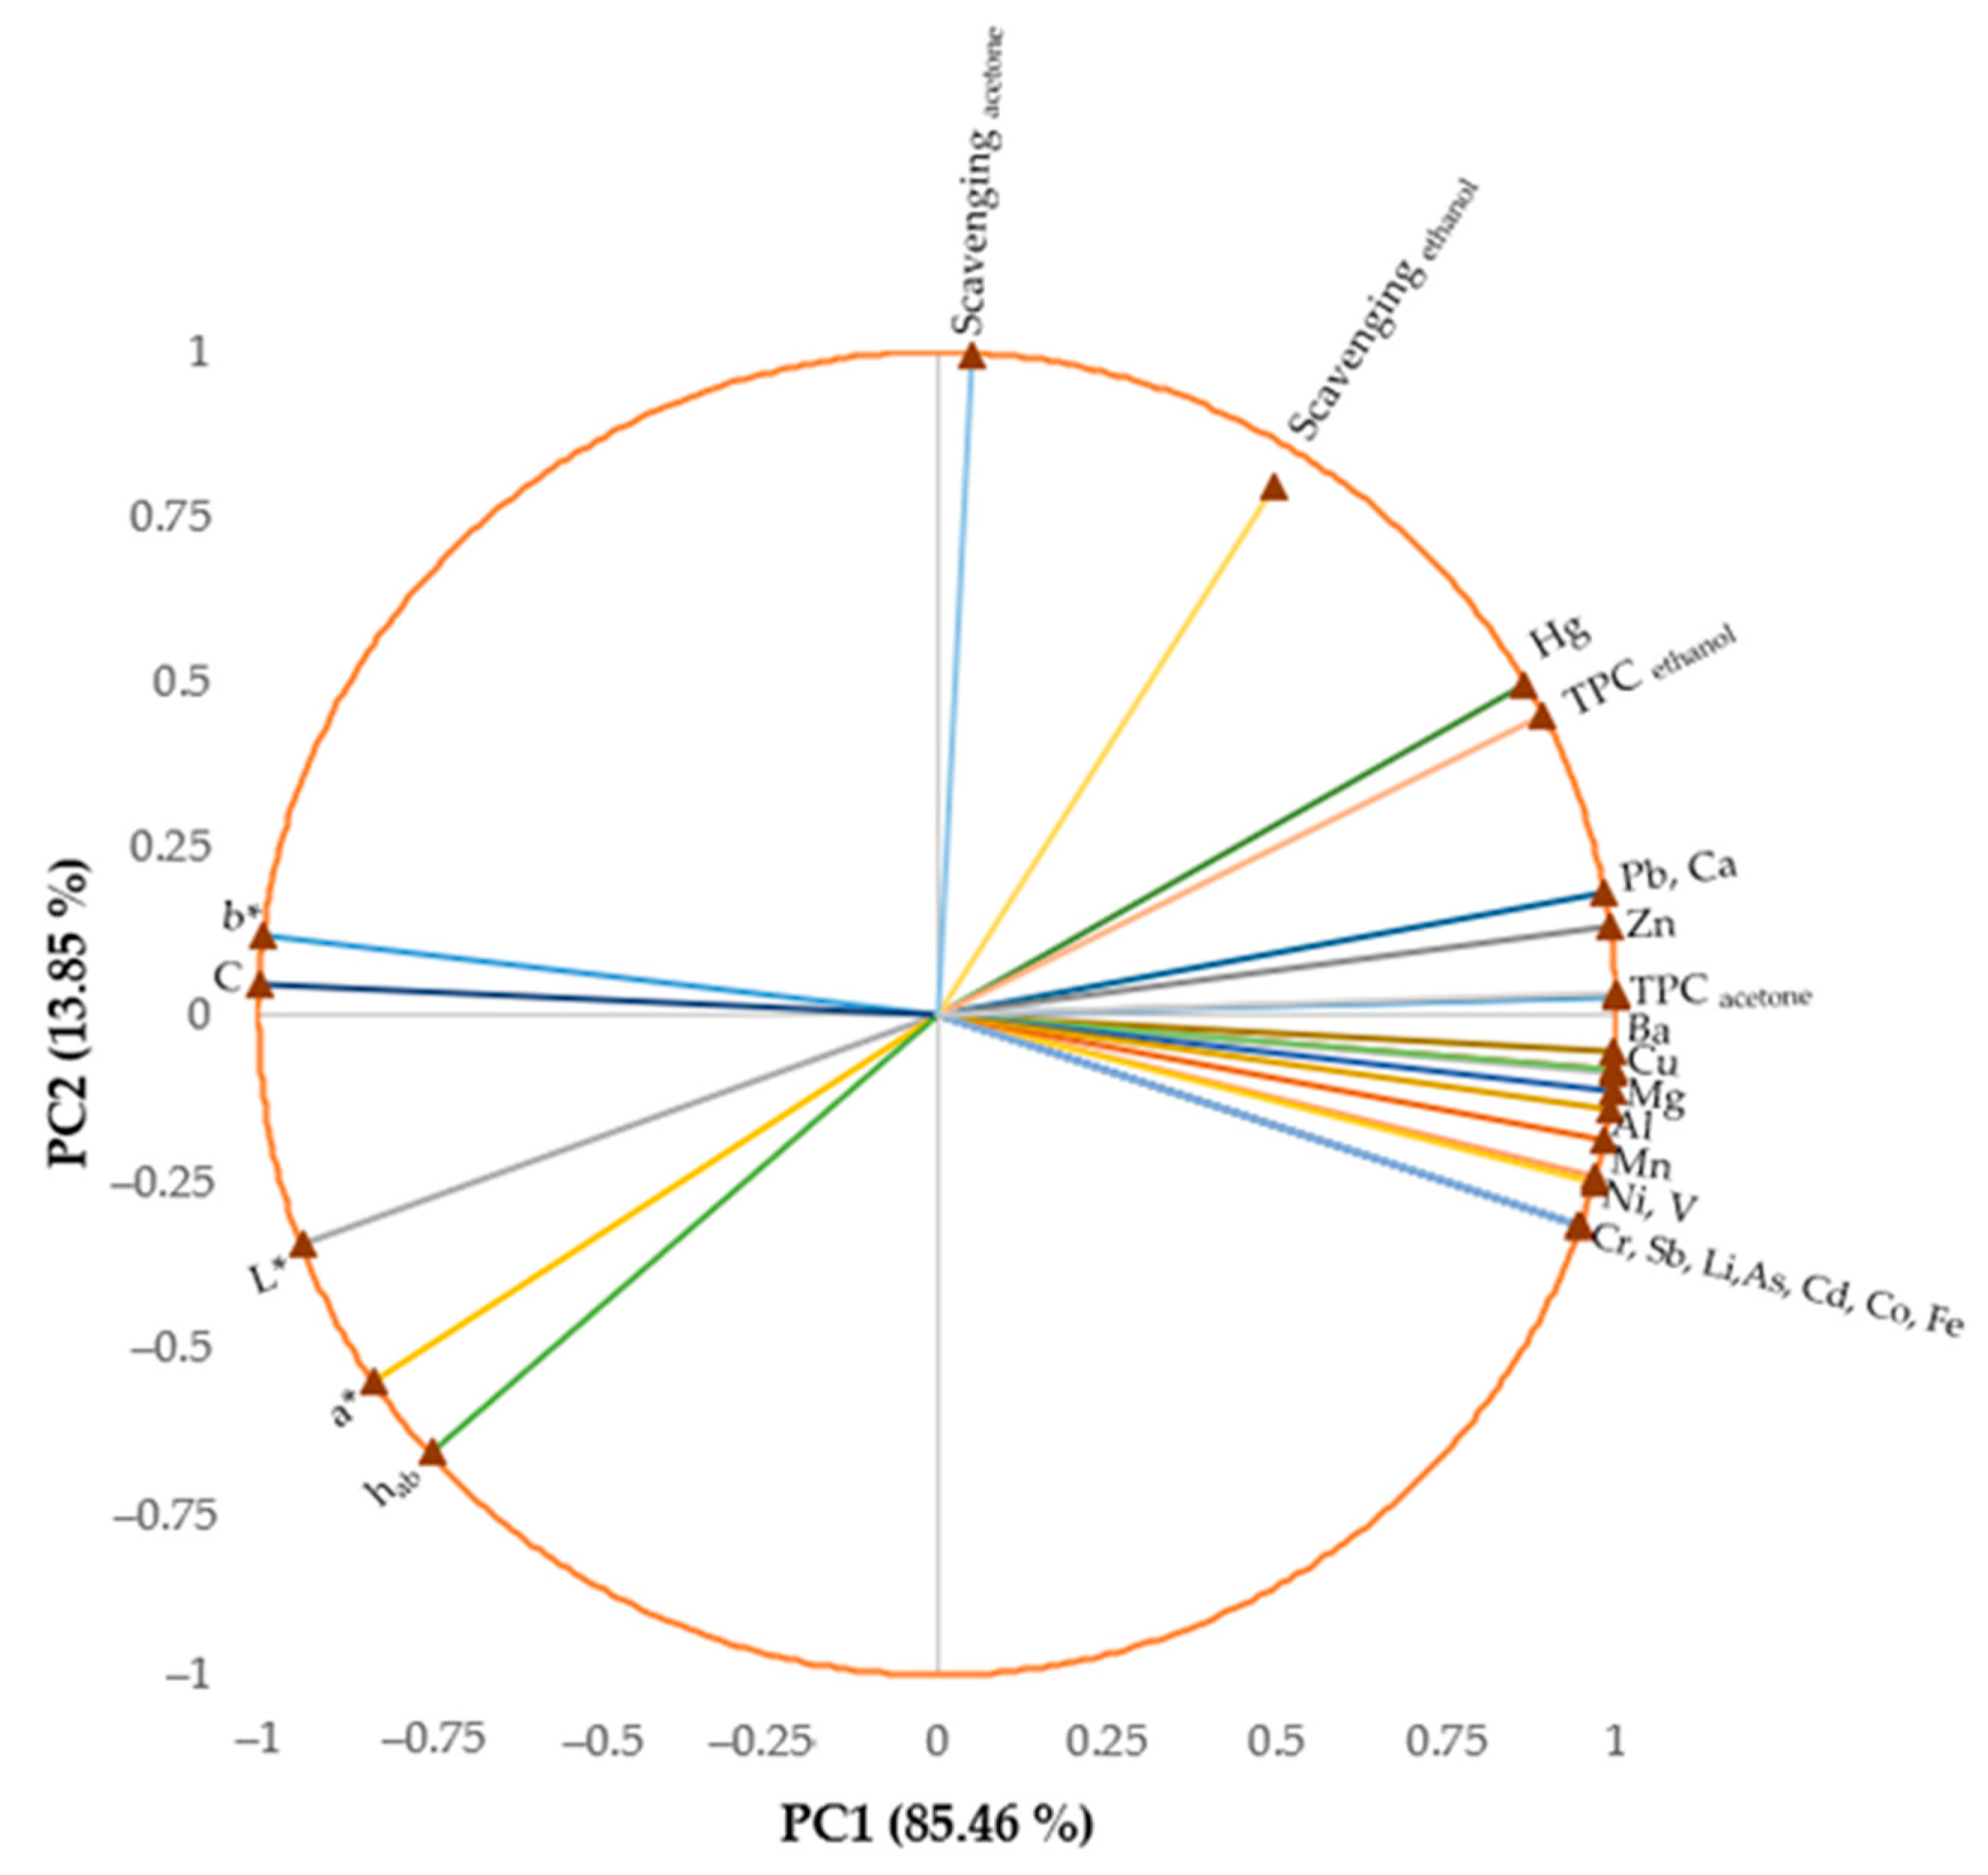
3.8. Relationships between Variables

The similarities and dissimilarities between the characteristics of U. barbata samples are displayed in Figure 7.
The two principal components explained 99.31% of the total data variance, with 85.46% attributed to the first (PC1) and 13.85% to the second (PC2). The PC1 was associated with all minerals, total phenolics, and color parameters, while PC2 was related to scavenging activity. Luminosity (L*), b* parameter, and chroma (C*) were negatively correlated (r > −0.768, p < 0.05) with all metals and the total phenolic content (TPC) in both solvents; the b* parameter was negatively correlated (r > 0.706, p < 0.05) only with Al, Ba, Ca, Cu, Mg, Mn, Ni, Pb, V, Zn, Hg, Sb, and TPC. TPC values in both solvents were positively correlated (r > 0.696, p < 0.05) with all mineral contents.
An opposition between TPC in ethanol extracts and the a* parameter and between b* and C* with some minerals (Cu, Mg, Al) was observed. The scavenging activity in ethanol extracts was positively correlated with the TPC content (r > 0.775, p < 0.05).

4. Discussion

Using advanced microscopical analysis, the present study provides an accurate morphological characterization of U. barbata, offering a complete structural investigation. The microstructure of U. barbata integral and fractions displayed in our study agreed with those reported by Ivanovic et al. [37] and Bubach et al. [21]. The whole lichen consists of 90% mycobiont and only 10% photobiont [24]. Of the separated fractions, one is formed exclusively of mycelial hyphae (ccUB), and the other (mcUB) has both symbionts. It is known that, in symbiotic partnerships, only the fungus synthesizes the lichen’s secondary metabolites. Thus, we wanted to know which lichen fraction had phenolic metabolites and a mineral content higher than the entire lichen. Being a source of bioactive metabolites, extracting them from the fraction with the highest content could increase the process yield and selectivity.
Bubach et al. [21] revealed an entire micrograph of a cross-section of Usnea sp. thallus obtained by SEM-EDS analysis. These authors separated only two U. barbata thallus fractions (cortex–medulla and axis), similar to those described in our study (mcUB and ccUB). The cortex consisted of densely packed thick-walled fungal hyphae in their image, and the central cord had a compact, cartilaginous structure [21].
Most numerous organic compounds found in lichens are secondary metabolites of fungal origin [20]. Their amount is usually 0.1–10% in dried lichen and can reach 30% in some cases. These substances are mostly phenolic compounds, poorly soluble in water, and can be extracted using organic solvents [42]. They are deposited in the cortex and medulla as crystals on the hyphae surface. The lichen metabolites are differentially distributed in the thallus layers, correlated with their bioactivities [20]. Thus, the compounds from the upper cortex act as a light filter, having a photoprotective effect [40]. The most common cortical metabolites are usnic acid, atranorin, xanthones, pulvinic acid derivates, and anthraquinones. With few exceptions (atranorin), they are colored compounds (yellow, orange), giving the lichen thalli specific coloration [40]. These cortical constituents can be distinguished from numerous medullary ones [20].
Bioactive metabolites localization in the lichen thallus was explored using various methods. Some researchers used spot tests (directly applying suitable reagents to the lichen thallus) or after extraction and analyses of specific lichen parts [43]. Other studies described classical fluorescent techniques based on the molecule chromophore, where metabolites are only differentiated by their emission wavelength; then, the metabolite localization in living plant cells was obtained using multiphoton microscopy [44]. In 2016, based on the auto-ionisability of all main classes of lichenic bioactive compounds [45], Le Pogam et al. [46] achieved histolocalisation of the lichen Ophioparma ventosa by laser desorption ionization coupled to mass spectrometry imaging (LDI-MSI). They applied different slicing procedures to obtain lichen thalli transverse sections (cryosectioning and hand-cutting), fixed them on a carbon-conductive adhesive tape, and examined the metabolites’ spatial distribution. MSI displayed the molecular images of usnic acid, thamnolic acid, divaricatic acid, miriquidic acid, haemoventosin, and all overlaid ions in cryosectioned pieces of the O. ventosa thallus [46]. Using the same method, Gadea et al. [43] obtained spatial mapping that revealed phenolic metabolites in the lichen Pseudocyphellaria crocata.
Moreover, for optimal extraction of localized lichen metabolites, different methods of sample preparation were elaborated. Komaty et al. [47] proposed two types of preparations for atranorin extraction from Pseudevernia furfuracea. In the first case, the lichen sample was milled (with a planetary ball mill), resulting in a homogeneous powder. The lichen thallus was ground in a blender in the second case, obtaining a mixture of medulla pieces and fine cortex powder. The higher extraction yield with acetone under microwave irradiation was obtained using cortex powder because atranorin is mainly a cortical metabolite. Ivanovic et al. [37] optimized usnic acid supercritical fluid extraction with CO2 from U. barbata, using various grinding methods and conditions (temperature, CO2 pressure).
In the case of pharmaceutical applications, either supplements or drugs, the regulatory agencies approve only one or a maximum of two unpolluted sources for the contained ingredients. The results are reproducible only for raw materials developed under the same conditions; therefore, restricting the harvesting area leads to accurate results, essential for human use formulations. However, only a few data on metal concentrations in U. barbata from unpolluted zones were found in previous studies. Culicov et al. [48] investigated U. barbata from the Mountain Natural Park in Bulgaria, Jayasekera et al. [49] examined U. barbata from the Sri Lanka rain forest, and Conti et al. [50] analyzed U. barbata from central and southern Tierra del Fuego, Patagonia, Argentina. Arsenic (As) was detected only in mcUB (0.219 μg/g), not in the whole dried lichen sample. However, this element was quantified in lichens belonging to the three mentioned regions: 0.134 μg/g in Sri Lanka, 0.823 μg/g in Tierra del Fuego, and 1.100 μg/g in Bulgaria Natural Park. Cadmium (Cd) was quantified in increased values in U. barbata from all three zones: 0.096 μg/g in Sri Lanka, 0.174 μg/g in Tierra del Fuego, and 0.590 μg/g in Bulgaria; in our study, Cd was detected only in mcUB (0.164 μg/g). The cobalt (Co) content in mcUB was 0.225 μg/g; however, U. barbata from all other zones displayed different Co contents: 0.522 μg/g in Tierra del Fuego, 0.260 μg/g in Sri Lanka, and 0.130 μg/g in Bulgarian Mountain Park. We found the highest lead content in dried U. barbata from Călimani Mountains (1.296 μg/g). In contrast, the lead amounts in the lichen from other zones were significantly lower (0.426 and 0.221 μg/g Pb in U. barbata from Sri Lanka and Tierra del Fuego). The zinc content in autochthonous lichen (20.536 μg/g) was lower than 42 μg/g (Tierra del Fuego) and 51 μg (Bulgaria) and higher than 15 μg/g (Sri Lanka). The U. barbata from Tierra del Fuego had a 0.827 μg/g nickel content, higher than the Călimani Mountains one (0.449 μg/g). Finally, an amount of 0.056 μg/g Sb was quantified by Conti et al. in U. barbata from Tierra del Fuego; only in the mcUB was 0.152 μg/g Sb detected.
From their native zones, U. barbata and other lichen species can be transplanted to various polluted zones for biomonitoring reasons [51]. Conti et al. [52] confirmed the considerable ability of U. barbata to reflect the levels of environmental elements on a global scale, signaling, at distant places, volcanic emissions. Previous studies reported that Usnea sp. was used in this scope, and their action was compared with other lichen species. Thus, U. hirta transplanted to a city in northern Italy had a similar capacity to accumulate various metals as H. physodes and P. furfuracea [53]. Meli et al. [54] showed that lichens, obtaining numerous nutrients from the air, significantly accumulate different air pollutants through the thallus surface. Lichens take in metals in different ways. The common ones are the physical passing of metal particles in the medulla intercellular spaces and their binding to extracellular sites of the mycobiont and photobiont [55]. Hence, the highest mineral content in the mcUB fraction, followed, in decreasing order, by dUB and ccUB, can be justified.
Accumulation of heavy/trace metals in lichens is essential for their use for nutrition and/or therapeutical purposes [56]. Moreover, usnic acid, the most bioactive metabolite from Usnea sp., has high hepatotoxicity [57]; that aspect represents another reason that further restricts their possible use in these scopes.
Heavy metal accumulation by food intake [58] disturbs various biochemical processes [59] in the human body. Thereby, permissible limits of heavy metals were established for edible plants by the Food and Agriculture Organization of the United Nations (FAO) and the World Health Organization (WHO, 1996) [60,61]. These values are displayed in Table 4.
As a culinary plant for bread and mush ingredients, U. barbata was used in the Balkan region [64]. In dUB and ccUB, the metal content values (Table 4) show that Cr, Pb, Cu, and Zn were lower than the allowable limit. Other heavy metals, Hg, Ni, and V, were found in higher contents compared to permissible ones. The other toxic elements (As, Cd, and Co) were not detected. On the other hand, U. barbata arsenic contents of 0.823 μg/g in Tierra del Fuego and 1.100 μg/g in Bulgaria Natural Park were higher than the acceptable limit. The cadmium and cobalt contents were higher than the permissible limit in U. barbata from all three zones compared with the Călimani mountains, while zinc and nickel contents were only measured in the Natural Park of Bulgaria and in Tierra del Fuego. It can be seen that the heavy metal content in U. barbata from other unpolluted earth zones was significantly higher than in our one. In mcUB, Cd and Co were higher than the permissible limits. The same fraction had other heavy metals higher than the allowable limits: Cr, Cu, Ni, Pb, Hg, and V; only Zn and As contents were lower than the permissible limits (Table 4).
The approvable limits for heavy metals in medicinal plants are higher compared to edible ones (Table 4).
Dobrescu et al. [65] reported that U. barbata is commonly used as an antiseptic (in Spain and USA). According to the same authors, it is a good remedy for various symptoms (insomnia, whooping cough, bleeding, jaundice, and nausea; in Europe). Our results showed that most heavy metals in autochthonous U. barbata were present lower amounts than permissible limits values. However, the Cr content in mcUB exceeded the permissible limit according to European Pharmacopoeia; the mercury contents in all three lichen fractions were lower than the WHO’s and the FDA’s acceptable limits [62] and higher than the ones according to the Chinese Pharmacopoeia [59], and European Pharmacopoeia [63] (Table 4).
The metals can generate complexes with polysaccharides, lichen secondary metabolites, and organic acids [55]. Bačkor and Fahselt (2004) [24] proved that, in C. pleurota, usnic acid might be associated with Fe, Cu, Ni, and Al. Thus, the significant positive correlation (p > 0.05) between the total phenolic and mineral contents highlighted in the final PCA plot could be explained.
As a preview of lichen constituents from all analyzed samples, the FT-IR spectra of mcUB showed different peaks compared to the ccUB fraction, while dUB presented all peaks found in both previous fractions. The peaks observed at 3340 cm−1 given by the O-H and N-H stretching vibration and 2852 and 2920 cm−1 due to the C-H stretching vibration could depict the presence of phenols, water, carbohydrates, polysaccharides [66], and lipids [67] in U. barbata fractions. Similar results were reported by Zaini et al. [68] for usnic acid extracted from Usnea sp. The peak at 3320 cm−1, along with the ones at 2920 and 2852 and 1700 cm−1, may be related to the placodiolic and usnic acid characteristics of U. barbata lichen [69]. The bands observed at 1633, 1700, and 1736 cm−1 attributed to the N-H and C=O bending vibration could indicate amino acids and esters [67]. The peaks found at 1700 and 1736 cm−1 can be attributed to the C=O vibrations in lipids, their presence being suggested by the bands observed at 1323 and 1377 cm−1 given by the CH3 bending [67]. The peaks observed at 1633 and 1700 cm−1 can be assigned to the C=O, C-N, and/or C-O-NH- vibrations which may be due to proteins [67]. The aromatic and N-H bending vibrations found at 1511, 1541, 1560, and 1576 cm−1 can depict the presence of amino acids [67]. The bands at 1511 and 1576 cm−1 were observed only for ccUB and dUB, indicating the differences in amino acids and proteins compared to the mcUB sample; this hypothesis is supported by the appearance of the peak at 1440 cm−1. The peaks in the regions 1377–1460 cm−1 can also be assigned to the CH3 lipids/proteins and COO- of amino acids, while the vibrations of N-H and C-N had peaks at 1460–1576 cm−1 [64] and reveal the presence of proteins in U. barbata fractions. The bands observed in the region 1323–1440 cm−1 could be attributed to the primary or secondary O–H bending (in-plane) and phenol or tertiary alcohol (O–H bend) [67]; the peak at 1440 cm−1 was observed only in ccUB and dUB samples. The secondary aromatic amine and CN stretching vibration could be responsible for the peaks obtained at 1293 and 1323 cm−1, while the band observed at 1253 cm−1, attributed to the C-O stretching vibrations, could be due to acids or esters [67]. The specific bands at 1293 and 1323 cm−1 could be associated with usenamine A, a detected compound in U. barbata lichen [70]. The peaks obtained at 1042 and 1073 cm−1 can be due to the C-O stretching vibrations of carbohydrates and glycoproteins.
The most important phenolic secondary metabolites (usnic acid, for Usnea sp.) synthesized by mycobionts are deposited on the hyphae surface in the cortex and medulla [37,71]. Therefore, the highest TPC values in mcUB in both solvents, followed by dUB and ccUB, could be justified. Usnic acid and other specific secondary metabolites have a higher solubility in acetone than ethanol; this property can explain that mcUB has a higher TPC value in acetone extract than ethanol extract [32]. The free radical scavenging activity [72] was evaluated, and, in both extracts, dUB recorded the most significant antiradical potential [73], followed by mcUB and ccUB. However, due to the various free radical scavenging ability of phenolic metabolites found in each lichen extract (ethanol and acetone), AA values considerably differed. Consequently, the correlation between antiradical activity and TPC recorded significant variations. The highest AA of dUB in both extracts could be induced by the synergic interaction between the primary metabolites with a non-phenolic structure, the secondary ones, and the metals found in the whole lichen.

5. Conclusions

Our study could complete the scientific database, which must be constantly updated with the characteristics of U. barbata separated fractions (medulla–cortex and central cord) compared to whole lichen. Proving that the medulla–cortex fraction has the highest phenolic metabolite content, the obtained results could help increase their extraction yield. Further studies could quantify usnic acid and other bioactive metabolites in each separated lichen fraction. Moreover, this separation process could be investigated as a potential pre-treatment method for U. barbata dried lichen thalli, aiming for their extraction process optimization.

Supplementary Materials

The following supporting information can be downloaded at https://www.mdpi.com/article/10.3390/app12094234/s1, Figure S1. Ground U. barbata samples, as a fine powder with particle size < 180 μm (Dub—dried U. barbata lichen, mcUB—medulla–cortex, ccUB—central cord); Figure S2. The calibration curves of 23 metals analyzed in U. barbata dried samples using the ICP-MS method; Figure S3. Extracts in ethanol 96% (A) and acetone (B) from dried U. barbata lichen—dUB (a), medulla–cortex—mcUB (b), and central cord—ccUB (c). Table S1. Dried U. barbata sample digestion conditions for ICP-MS mineral analysis; Table S2. ICP-MS Standard solutions; Table S3. Preparation of calibration standard solutions (E1–E5); Table S4. Concentrations of calibration standard solutions (E1–E5) for different elements; Table S5. Calibration Curve Range, R2, LOD, and LOQ (μg/L and μg/g) for each element.

Author Contributions

Conceptualization, V.P. and M.U.-I.; methodology, L.B., C.E.G., D.R., S.I.C., E.I.C., T.C., M.U.-I., M.O. and V.S.; software, V.P., L.B., D.R., S.I.C., E.I.C., T.C., M.U.-I., M.O., S.M. and V.S.; validation, L.B., D.R., S.I.C., E.I.C., T.C., M.U.-I. and M.O.; formal analysis, V.P. and V.S. investigation, V.P., E.A.O. and A.C.; resources, V.P., L.B., M.U.-I. and M.O.; data curation, C.E.G., S.M., E.A.O. and A.C.; writing—original draft preparation, V.P., D.R., S.I.C. and M.U.-I.; writing—review and editing, V.P., C.E.G., L.B., M.U.-I., M.O. and S.M.; visualization, L.B., C.E.G., M.O., S.M., V.S., E.A.O., A.C. and V.B.; supervision, E.I.C., T.C., L.B., C.E.G., M.O., S.M., V.S., E.A.O., A.C. and V.B.; project administration, V.B.; funding acquisition, V.P. All authors have read and agreed to the published version of the manuscript.

Funding

This work is supported by the project ANTREPRENORDOC, in the framework of the Human Resources Development Operational Programme 2014–2020, financed by the European Social Fund under the contract number 36355/23.05.2019 HRD OP/380/6/13—SMIS Code: 123847.

Institutional Review Board Statement

Not applicable.

Informed Consent Statement

Not applicable.

Data Availability Statement

Not applicable.

Acknowledgments

This study was performed in collaboration with the Research Centre of Instrumental Analysis SCIENT, Ilfov, Romania, Faculty of Food Engineering and Integrated Center for Research, Development, and Innovation in Advanced Materials, Nanotechnologies and Distributed Systems for Fabrication and Control (MANSiD), Stefan cel Mare University of Suceava, Romania, and Faculty of Pharmacy, Carol Davila University of Medicine and Pharmacy, Bucharest, Romania.

Conflicts of Interest

The authors declare no conflict of interest.

References

  1. Grube, M.; Wedin, M. Lichenized Fungi and the Evolution of Symbiotic Organization. Microbiol. Spectr. 2016, 4, funk-0011-2016. [Google Scholar] [CrossRef] [PubMed] [Green Version]
  2. Garrido-Benavent, I.; Pérez-Ortega, S. Past, present, and future research in bipolar lichen-forming fungi and their photobionts. Am. J. Bot. 2017, 104, 1660–1674. [Google Scholar] [CrossRef] [Green Version]
  3. Shukla, V.; Joshi, G.P.; Rawat, M.S.M. Lichens as a potential natural source of bioactive compounds: A review. Phytochem. Rev. 2010, 9, 303–314. [Google Scholar] [CrossRef]
  4. Zambare, V.P.; Christopher, L.P. Biopharmaceutical potential of lichens. Pharm. Biol. 2012, 50, 778–798. [Google Scholar] [CrossRef]
  5. Prateeksha; Paliya, B.S.; Bajpai, R.; Jadaun, V.; Kumar, J.; Kumar, S.; Upreti, D.K.; Singh, B.N.R.; Nayaka, S.; Joshi, Y.; et al. The genus Usnea: A potent phytomedicine with multifarious ethnobotany, phytochemistry and pharmacology. RSC Adv. 2016, 6, 21672–21696. [Google Scholar] [CrossRef]
  6. Yang, M.X.; Devkota, S.; Wang, L.S.; Scheidegger, C. Ethnolichenology—the use of lichens in the himalayas and southwestern parts of china. Diversity 2021, 13, 330. [Google Scholar] [CrossRef]
  7. Huang, Y.P.; Xiang, J.T.; Wang, C.H.; Ren, D.; Johnson, D.; Xu, T. Lichen as a Biomonitor for Vehicular Emission of Metals: A Risk Assessment of Lichen Consumption by the Sichuan Snub-Nosed Monkey (Rhinopithecus roxellana). Ecotoxicol. Environ. Saf. 2019, 180, 679–685. [Google Scholar] [CrossRef]
  8. Behera, B.C.; Verma, N.; Sonone, A.; Makhija, U. Optimization of culture conditions for lichen Usnea ghattensis G. Awasthi to increase biomass and antioxidant metabolite production. Food Technol. Biotechnol. 2009, 47, 7–12. [Google Scholar]
  9. Randlane, T.; Tõrra, T.; Saag, A.; Saag, L. Key to European Usnea species. Bibl. Lichenol. 2009, 100, 419–462. [Google Scholar]
  10. Mesta, A.R.; Rajeswari, N.; Kanivebagilu, V.S. Distribution of bioactive compounds in usneoid lichens from Western Ghats. Plant Arch. 2019, 19, 2163–2168. [Google Scholar]
  11. Shcherbokova, A.; Koptina, A.; Samiento-Diaz, M.; Ulrich-Merzenich, G. Pharmacological activities of lichens from Russia. Planta Med. 2015, 81, PM_134. [Google Scholar] [CrossRef]
  12. Ohmura, Y. A synopsis of the lichen genus Usnea (Parmeliaceae, Ascomycota) in Taiwan. Mem. Natl. Museum Nat. Sci. Tokyo 2012, 48, 91–137. [Google Scholar]
  13. Cansaran, D.; Kahya, D.; Yurdakulol, E.; Atakol, O. Identification and quantitation of usnic acid from the lichen Usnea species of Anatolia and antimicrobial activity. Z. Naturforsch. Sect. C J. Biosci. 2006, 61, 773–776. [Google Scholar] [CrossRef] [PubMed]
  14. Rafat, A. Ecological and Biological Studies of New Zealand Lichens in the Genus Usnea. Ph.D. Thesis, Lincoln University, Chester County, PA, USA, 2014; pp. 18–153. [Google Scholar]
  15. Đorðević, S.; Ivanović, J.; Kukić-Marković, J.; Petrović, S.; Žižović, I.; Tadić, V.; Marković, G. HPLC determination of usnic acid content in different extracts of Usnea barbata. Planta Med. 2010, 76, LS1. [Google Scholar] [CrossRef]
  16. Redzic, S.; Barudanovic, S.; Pilipovic, S. Wild Mushrooms and Lichens used as Human Food for Survival in War Conditions; Podrinje. Hum. Ecol. Rev. 2010, 17, 175–181. [Google Scholar]
  17. Gómez-Serranillos, M.P.; Fernández-Moriano, C.; González-Burgos, E.; Divakar, P.K.; Crespo, A. Parmeliaceae family: Phytochemistry, pharmacological potential and phylogenetic features. RSC Adv. 2014, 4, 59017–59047. [Google Scholar] [CrossRef]
  18. Bazarnova, Y.; Politaeva, N.; Lyskova, N. Research for the lichen Usnea barbata metabolites. Z. Naturforsch. Sect. C J. Biosci. 2018, 73, 291–296. [Google Scholar] [CrossRef]
  19. Salgado, F.; Albornoz, L.; Cortéz, C.; Stashenko, E.; Urrea-Vallejo, K.; Nagles, E.; Galicia-Virviescas, C.; Cornejo, A.; Ardiles, A.; Simirgiotis, M.; et al. Secondary metabolite profiling of species of the genus Usnea by UHPLC-ESI-OT-MS-MS. Molecules 2018, 23, 54. [Google Scholar] [CrossRef] [Green Version]
  20. Ranković, B. Lichen Secondary Metabolites: Bioactive Properties and Pharmaceutical Potential; Springer: Cham, Switzerland, 2015; pp. 1–29. [Google Scholar]
  21. Bubach, D.; Dufou, L.; Catán, S.P. Evaluation of dispersal volcanic products of recent events in lichens in environmental gradient, Nahuel Huapi National Park, Argentina. Environ. Monit. Assess. 2014, 186, 4997–5007. [Google Scholar] [CrossRef]
  22. Sanders, W.B.; Masumoto, H. Lichen algae: The photosynthetic partners in lichen symbioses. Lichenologist 2021, 53, 347–393. [Google Scholar] [CrossRef]
  23. Lyskova, N.S.; Bazarnova, I.G.; Kruchina-Bogdanov, I.V. Study of the composition and properties of secondary metabolites of the Lichen Usnea barbata. Khimiya Rastit. Syr’ya 2018, 1, 121–127. [Google Scholar]
  24. Bačkor, M.; Fahselt, D. Lichen photobionts and metal toxicity. Symbiosis 2008, 46, 1–10. [Google Scholar]
  25. Hájek, J.; Hojdová, A.; Trnková, K.; Váczi, P.; Bednaříková, M.; Barták, M. Responses of thallus anatomy and chlorophyll fluorescence-based photosynthetic characteristics of two antarctic species of genus Usnea to low temperature. Photosynthetica 2021, 59, 95–105. [Google Scholar] [CrossRef]
  26. Coufalík, P.; Uher, A.; Zvěřina, O.; Komárek, J. Determination of cadmium in lichens by solid sampling graphite furnace atomic absorption spectrometry (SS-GF-AAS). Environ. Monit. Assess. 2020, 192, 222. [Google Scholar] [CrossRef]
  27. Carreras, H.A.; Wannaz, E.D.; Perez, C.A.; Pignata, M.L. The role of urban air pollutants on the performance of heavy metal accumulation in Usnea amblyoclada. Environ. Res. 2005, 97, 50–57. [Google Scholar] [CrossRef]
  28. Popovici, V.; Bucur, L.; Calcan, S.I.; Cucolea, E.I.; Costache, T.; Rambu, D.; Schröder, V.; Gîrd, C.E.; Gherghel, D.; Vochita, G.; et al. Elemental Analysis and In Vitro Evaluation of Antibacterial and Antifungal Activities of Usnea barbata (L.) Weber ex F.H. Wigg from Călimani Mountains, Romania. Plants 2022, 11, 32. [Google Scholar] [CrossRef]
  29. Popovici, V.; Bucur, L.; Gîrd, C.E.; Rambu, D.; Calcan, S.I.; Cucolea, E.I.; Costache, T.; Ungureanu-Iuga, M.; Oroian, M.; Mironeasa, S.; et al. Antioxidant, Cytotoxic, and Rheological Properties of Canola Oil Extract of Usnea barbata ( L.) Weber ex F. H. Wigg from Călimani Mountains, Romania. Plants 2022, 11, 854. [Google Scholar] [CrossRef]
  30. Pop, A.; Fizeșan, I.; Vlase, L.; Rusu, M.E.; Cherfan, J.; Babota, M.; Gheldiu, A.M.; Tomuta, I.; Popa, D.S. Enhanced recovery of phenolic and tocopherolic compounds from walnut (Juglans regia L.) male flowers based on process optimization of ultrasonic assisted-extraction: Phytochemical profile and biological activities. Antioxidants 2021, 10, 607. [Google Scholar] [CrossRef]
  31. Farmacopeea Rom. Ed. X, 1993. Available online: https://ro.scribd.com/doc/215542717/Farmacopeea-Romana-X (accessed on 2 February 2022).
  32. Popovici, V.; Bucur, L.; Popescu, A.; Schröder, V.; Costache, T.; Rambu, D.; Cucolea, I.E.; Gîrd, C.E.; Caraiane, A.; Gherghel, D.; et al. Antioxidant and cytotoxic activities of Usnea barbata (L.) F.H. Wigg. dry extracts in different solvents. Plants 2021, 10, 909. [Google Scholar] [CrossRef]
  33. Pegg, T.J.; Gladish, D.K.; Baker, R.L. Algae to angiosperms: Autofluorescence for rapid visualization of plant anatomy among diverse taxa. Appl. Plant Sci. 2021, 9, 1–8. [Google Scholar] [CrossRef]
  34. Pathan, A.K.; Bond, J.; Gaskin, R.E. Sample preparation for SEM of plant surfaces. Mater. Today 2010, 12, 32–43. [Google Scholar] [CrossRef]
  35. Yuan, J.; Wang, X.; Zhou, H.; Li, Y.; Zhang, J.; Yu, S.; Wang, M.; Hao, M.; Zhao, Q.; Liu, L.; et al. Comparison of Sample Preparation Techniques for Inspection of Leaf Epidermises Using Light Microscopy and Scanning Electronic Microscopy. Front. Plant Sci. 2020, 11, 133. [Google Scholar] [CrossRef]
  36. Thiberge, S.; Nechushtan, A.; Sprinzak, D.; Gileadi, O.; Behar, V.; Zik, O.; Chowers, Y.; Michaeli, S.; Schlessinger, J.; Moses, E. Scanning electron microscopy of cells and tissues under fully hydrated conditions. Proc. Natl. Acad. Sci. USA 2004, 101, 3346–3351. [Google Scholar] [CrossRef] [PubMed] [Green Version]
  37. Ivanovic, J.; Meyer, F.; Misic, D.; Asanin, J.; Jaeger, P.; Zizovic, I.; Eggers, R. Influence of different pre-treatment methods on isolation of extracts with strong antibacterial activity from lichen Usnea barbata using carbon dioxide as a solvent. J. Supercrit. Fluids 2013, 76, 1–9. [Google Scholar] [CrossRef]
  38. Ingoífsdotir, K. Molecules of Interest Usnic acid. Phytochemistry 2002, 61, 729–736. [Google Scholar] [CrossRef]
  39. Gauslaa, Y.; Solhaug, K.A. Differences in the Susceptibility to Light Stress Between Epiphytic Lichens of Ancient and Young Boreal Forest Stands. Funct. Ecol. 1996, 10, 344. [Google Scholar] [CrossRef]
  40. Varol, M.; Tay, T.; Candan, M.; Türk, A.; Koparal, A.T. Evaluation of the sunscreen lichen substances usnic acid and atranorin. Biocell 2015, 39, 25–31. [Google Scholar]
  41. Zulaini, A.A.M.; Muhammad, N.; Asman, S.; Hashim, N.H.; Jusoh, S.; Abas, A.; Yusof, H.; Din, L. Evaluation of transplanted lichens, Parmotrema tinctorum and Usnea diffracta as bioindicator on heavy metals accumulation in southern Peninsular Malaysia. J. Sustain. Sci. Manag. 2019, 14, 1–13. [Google Scholar]
  42. Bačkorová, M.; Jendželovský, R.; Kello, M.; Bačkor, M.; Mikeš, J.; Fedoročko, P. Lichen secondary metabolites are responsible for induction of apoptosis in HT-29 and A2780 human cancer cell lines. Toxicol. Vitr. 2012, 26, 462–468. [Google Scholar] [CrossRef]
  43. Gadea, A.; Fanuel, M.; Le Lamer, A.C.; Boustie, J.; Rogniaux, H.; Charrier, M.; Devehat, F.L. Le Mass spectrometry imaging of specialized metabolites for predicting lichen fitness and snail foraging. Plants 2020, 9, 70. [Google Scholar] [CrossRef] [Green Version]
  44. Talamond, P.; Verdeil, J.L.; Conéjéro, G. Secondary metabolite localization by autofluorescence in living plant cells. Molecules 2015, 20, 5024–5037. [Google Scholar] [CrossRef] [PubMed] [Green Version]
  45. Le Pogam, P.; Legouin, B.; Le Lamer, A.C.; Boustie, J.; Rondeau, D. Analysis of the cyanolichen Lichina pygmaea metabolites using in situ DART-MS: From detection to thermochemistry of mycosporine serinol. J. Mass Spectrom. 2015, 50, 445–462. [Google Scholar] [CrossRef]
  46. Le Pogam, P.; Legouin, B.; Geairon, A.; Rogniaux, H.; Lohézic-Le Dévéhat, F.; Obermayer, W.; Boustie, J.; Le Lamer, A.C. Spatial mapping of lichen specialized metabolites using LDI-MSI: Chemical ecology issues for Ophioparma ventosa. Sci. Rep. 2016, 6, 37807. [Google Scholar] [CrossRef] [PubMed] [Green Version]
  47. Komaty, S.; Letertre, M.; Dang, H.D.; Jungnickel, H.; Laux, P.; Luch, A.; Carrié, D.; Merdrignac-Conanec, O.; Bazureau, J.P.; Gauffre, F.; et al. Sample preparation for an optimized extraction of localized metabolites in lichens: Application to Pseudevernia furfuracea. Talanta 2016, 150, 525–530. [Google Scholar] [CrossRef] [PubMed]
  48. Culicov, O.A.; Yurukova, L. Comparison of element accumulation of different moss and lichen-bags, exposed in the city of Sofia (Bulgaria). J. Atmos. Chem. 2006, 55, 1–12. [Google Scholar] [CrossRef]
  49. Jayasekera, R.; Rossbach, M. Background levels of heavy metals in plants of different taxonomic groups from a montane rain forest in Sri Lanka. Environ. Geochem. Health 1996, 18, 55–62. [Google Scholar] [CrossRef] [PubMed]
  50. Conti, M.E.; Finoia, M.G.; Bocca, B.; Mele, G.; Alimonti, A.; Pino, A. Atmospheric background trace elements deposition in Tierra del Fuego region (Patagonia, Argentina), using transplanted Usnea barbata lichens. Environ. Monit. Assess. 2012, 184, 527–538. [Google Scholar] [CrossRef]
  51. Zambrano, A.; Nash, T.H. Lichen responses to short-term transplantation in Desierto de los Leones, Mexico City. Environ. Pollut. 2000, 107, 407–412. [Google Scholar] [CrossRef]
  52. Conti, M.E.; Jasan, R.; Finoia, M.G.; Iavicoli, I.; Plá, R. Trace elements deposition in the Tierra del Fuego region (south Patagonia) by using lichen transplants after the Puyehue-Cordón Caulle (north Patagonia) volcanic eruption in 2011. Environ. Sci. Pollut. Res. 2016, 23, 6574–6583. [Google Scholar] [CrossRef] [Green Version]
  53. Bergamaschi, L.; Rizzio, E.; Giaveri, G.; Loppi, S.; Gallorini, M. Comparison between the accumulation capacity of four lichen species transplanted to a urban site. Environ. Pollut. 2007, 148, 468–476. [Google Scholar] [CrossRef]
  54. Meli, M.A.; Desideri, D.; Cantaluppi, C.; Ceccotto, F.; Feduzi, L.; Roselli, C. Elemental and radiological characterization of commercial Cetraria islandica (L.) Acharius pharmaceutical and food supplementation products. Sci. Total Environ. 2018, 613–614, 1566–1572. [Google Scholar] [CrossRef] [PubMed]
  55. Rola, K. Insight into the pattern of heavy-metal accumulation in lichen thalli. J. Trace Elem. Med. Biol. 2020, 61, 126512. [Google Scholar] [CrossRef] [PubMed]
  56. Zhao, Y.; Wang, M.; Xu, B. A comprehensive review on secondary metabolites and health-promoting effects of edible lichen. J. Funct. Foods 2021, 80, 104283. [Google Scholar] [CrossRef]
  57. Kwong, S.P.; Wang, C. Review: Usnic acid-induced hepatotoxicity and cell death. Environ. Toxicol. Pharmacol. 2020, 80, 103493. [Google Scholar] [CrossRef] [PubMed]
  58. Marinescu, E.; Elisei, A.M.; Aprotosoaie, A.C.; Cioancă, O.; Trifan, A.; Miron, A.; Robu, S.; Ifrim, C.; Hăncianu, M. Assessment of heavy metals content in some medicinal plants and spices commonly used in Romania. Farmacia 2020, 68, 1099–1105. [Google Scholar] [CrossRef]
  59. Luo, L.; Wang, B.; Jiang, J.; Fitzgerald, M.; Huang, Q.; Yu, Z.; Li, H.; Zhang, J.; Wei, J.; Yang, C.; et al. Heavy Metal Contaminations in Herbal Medicines: Determination, Comprehensive Risk Assessments, and Solutions. Front. Pharmacol. 2021, 11, 1–14. [Google Scholar] [CrossRef]
  60. FAO/WHO, General Standard for Contaminants and Toxins in Food and Feed. Codex Alimentarius Commission, Adopted in 1995. Revised in 1997, 2006, 2008, 2009 Amended in 2010, 2012, 2013, 2014, 2015. Available online: http://www.fao.org/fao-who-codexalimentarius/shproxy/en/?lnk=1&url=https%253A%252F%252Fworkspace.fao.org%252Fsites%252Fcodex%252FStandards%252FCXS%2B193-1995%252FCXS_193e.pdf (accessed on 2 April 2022).
  61. Union, E. Health and Food Safety; (EC) No 118/2006-Maximum Levels for Contaminants in Food Incl Mycotoxins. Off. J. Eur. Union 2006, 5–24. Available online: https://eur-lex.europa.eu/eli/reg/2021/1323/oj (accessed on 2 April 2022).
  62. FAO/WHO Guidelines for Assessing Quality of Herbal Medicines with Reference to Contaminants and Residues. WHO Libr. Cat. 2007, 118. Available online: https://apps.who.int/iris/bitstream/handle/10665/43510/9789241594448_eng.pdf?sequence=1&isAllowed=y (accessed on 2 April 2022).
  63. European Pharmacopoeia (Ph. Eur.) 10th Edition|EDQM European Directorate for the Quality of Medicines. Available online: https://www.edqm.eu/en/european-pharmacopoeia-ph-eur-10th-edition (accessed on 17 November 2020).
  64. Simkova, K.; Polesny, Z. Ethnobotanical review of wild edible plants used in the Czech Republic. J. Appl. Bot. Food Qual. 2015, 88, 49–67. [Google Scholar]
  65. Dobrescu, D.; Tanasescu, M.; Mezdrea, A.; Ivan, C.; Ordosch, E.; Neagoe, F.; Rizeanu, A.; Trifu, L.; Enescu, V. Contributions to the complex study of some lichens-Usnea genus. Pharmacological studies on Usnea barbata and Usnea hirta species. Rom. J. Physiol. 1993, 30, 101–107. [Google Scholar]
  66. Yang, Z.; Hu, Y.; Yue, P.; Luo, H.; Li, Q.; Li, H.; Zhang, Z.; Peng, F. Physicochemical Properties and Skin Protection Activities of Polysaccharides from Usnea longissima by Graded Ethanol Precipitation. ACS Omega 2021, 6, 25010–25018. [Google Scholar] [CrossRef]
  67. Thummajitsakul, S.; Samaikam, S.; Tacha, S.; Silprasit, K. Study on FTIR spectroscopy, total phenolic content, antioxidant activity and anti-amylase activity of extracts and different tea forms of Garcinia schomburgkiana leaves. LWT 2020, 134, 110005. [Google Scholar] [CrossRef]
  68. Zaini, E.; Nisak, R.K.; Utami, R.D.; Fitriani, L.; Ismed, F. Effect of milling on physicochemical properties of usnic acid isolated from Usnea sp. Orient. J. Chem. 2017, 33, 3031–3036. [Google Scholar] [CrossRef]
  69. Popovici, V.; Bucur, L.; Vochita, G.; Gherghel, D.; Mihai, C.T.; Rambu, D.; Calcan, S.I.; Costache, T.; Cucolea, I.E.; Matei, E.; et al. In vitro anticancer activity and oxidative stress biomarkers status determined by Usnea barbata (L.) F.H. Wigg. dry extracts. Antioxidants 2021, 10, 1141. [Google Scholar] [CrossRef] [PubMed]
  70. Kondratiuk, A.S.; Savchuk, O.M.; Hur, J.S. Optimization of protein extraction for lichen thalli. Mycobiology 2015, 43, 157–162. [Google Scholar] [CrossRef] [PubMed] [Green Version]
  71. He, Y.; Tang, H.; Zhang, Z. Ultramicromorphological observation of Usnea longissima Ach. Afr. J. Biotechnol. 2012, 11, 7102–7108. [Google Scholar]
  72. Rahman, M.M.; Islam, M.B.; Biswas, M.; Khurshid Alam, A.H.M. In vitro antioxidant and free radical scavenging activity of different parts of Tabebuia pallida growing in Bangladesh. BMC Res. Notes 2015, 8, 621. [Google Scholar] [CrossRef] [Green Version]
  73. Tirzitis, G.; Bartosz, G. Determination of antiradical and antioxidant activity: Basic principles and new insights. Acta Biochim. Pol. 2010, 57, 139–142. [Google Scholar] [CrossRef]
Figure 1. U. barbata dried lichen—entire thallus (a) and ground—dUB (b); both separated fractions: medulla–cortex—mcUB (c) and central cord—ccUB (d).
Applsci 12 04234 g001
Figure 2. Microstructure of unground U. barbata lichen thallus—FM images with different magnifications: 100× (a) and 400× (b,c).
Applsci 12 04234 g002
Figure 3. (ad) Microstructure of the central cord (ccUB) with particle size > 315 μm, in SEM images with different magnifications: (a) 300× (scale bar = 100 μm), (b) 1 k× (scale bar = 20 μm), (c) 2 k× (scale bar = 20 μm), (d) 5 k× (scale bar = 5 μm); (eh) SEM micrographs of mcUB (medulla–cortex) with particle size ≤ 315 μm: (e) cortex parts with rare fungal hyphae on the surface, 1 k× (scale bar = 20 μm), (fh) cortex fragment at different magnifications: (f) 1 k× (scale bar = 20 μm), (g) 2 k× (scale bar = 20 μm), (h) 5 k× (scale bar = 5 μm).
Applsci 12 04234 g003
Figure 4. SEM micrographs in dUB (particle size > 315 μm): (ac) cortex fragments, central cord, and fungal hyphae, at different magnifications: (a) 1 k× (scale bar = 20 μm), (b) 2 k× (scale bar = 20 μm), (c) 5 k× (scale bar = 5 μm); (df) central cord with fungal hyphae between cortex fragments, at different magnifications: (d) 200 k× (scale bar = 200 μm), (e) 1 k× (scale bar = 20 μm), (f) 5 k× (scale bar = 5 μm).
Applsci 12 04234 g004
Figure 5. SEM micrographs of ccUB, mcUB, and dUB as a fine powder (particle size ≤ 180 μm): ccUB (ac); mcUB (df); dUB (gi) with different magnifications: 1 k× and scale bar = 20 μm (a,d,g), 2 k× and scale bar = 20 μm (b,e,h), and 5 k× and scale bar = 5 μm (c,f,i).
Applsci 12 04234 g005
Figure 6. Overlay of FT-IR spectra of U. barbata dried lichen (dUB), medulla–cortex (mcUB), and central cord (ccUB).
Applsci 12 04234 g006
Figure 7. The Principal Components Analysis (PCA) plot.
Applsci 12 04234 g007
Table 1. Color evaluation of U. barbata samples.
PropertydUBmcUBccUBF-Value
Color Properties
L* (adim.)63.02 ± 0.11 b59.08 ± 0.15 c70.29 ± 0.13 a5703.14 ***
a* (adim.)−1.29 ± 0.02 b−1.83 ± 0.03 c2.12 ± 0.17 a1414.01 ***
b* (adim.)13.60 ± 0.02 b12.52 ± 0.04 c13.92 ± 0.05 a1086.01 ***
hab (°)178.52 ± 0.00 c178.57 ± 0.00 b181.42 ± 0.01 a165,195.71 ***
C* (adim.)13.66 ± 0.02 b12.65 ± 0.05 c14.08 ± 0.04 a1125.62 ***
dUB—dried U. barbata integral lichen, mcUB—medulla–cortex, ccUB—central cord, L*—lightness, a*—positive values describe red and negative, green nuance, b*—positive values represent yellow and negative, blue nuance; hab—hue angle, C*—Chroma, adim.—adimensional. Mean values followed by different superscript letters are significantly different, *** significant at p < 0.001.
Table 2. Mineral composition of Usnea barbata (L.) Weber ex F.H. Wigg dried lichen (dUB) and both fractions: medulla–cortex (mcUB) and central cord (ccUB).
Element Content (μg/g)Sample F-Value
dUBmcUBccUB
Al87.879 ± 1.152 b285.828 ± 2.748 a21.111 ± 0.608 c18,444.13 ***
AsND0.219 ± 0.005ND-
Ba3.782 ± 0.052 b12.113 ± 0.604 a0.596 ± 0.004 c866.03 ***
Ca979.766 ± 12.285 b1549.600 ± 18.406 a434.269 ± 22.222 c2846.40 ***
CdND0.164 ± 0.001ND-
CoND0.225 ± 0.001ND-
Cr1.002 ± 0.008 b2.494 ± 0.010 a0.864 ± 0.007 c34,521.18 ***
Cu1.523 ± 0.013 b2.246 ± 0.005 a1.286 ± 0.014 c5771.15 ***
Fe52.561 ± 2.582 b282.468 ± 1.149 a33.107 ± 0.322 c21,398.25 ***
LiND0.185 ± 0.007ND-
Mg172.721 ± 0.647 b524.239 ± 2.419 a53.482 ± 0.597 c81,353.06 ***
Mn101.425 ± 1.423 b354.041 ± 1.083 a29.098 ± 0.347 c78,943.06 ***
Ni0.449 ± 0.011 b1.033 ± 0.005 a0.355 ± 0.007 c5658.89 ***
Pb1.296 ± 0.007 b2.177 ± 0.014 a0.584 ± 0.004 c21,958.36 ***
V0.241 ± 0.004 b1.237 ± 0.005 aND92,152.36 ***
Zn20.536 ± 0.125 b33.223 ± 0.164 a13.588 ± 0.097 c17,179.89 ***
Hg0.671 ± 0.020 b0.708 ± 0.005 a0.539 ± 0.017 c99.48 ***
SbND0.152 ± 0.003ND-
The analysis was performed in triplicate. The results are shown as the mean ± standard deviation (SD). ND—non-detected, Al—aluminum, As—arsenic, Ba—barium, Ca—calcium, Cd—cadmium, Co—cobalt, Cr—chromium, Cu—copper, Fe—iron, Li—lithium, Mg—magnesium, Mn—manganese, Ni—nickel, Pb—lead, V—vanadium, Zn—zinc, Hg—mercury, Sb—antimony. Mean values followed by different letters are significantly different, *** significant at p < 0.001.
Table 3. Total phenolic content (TPC, expressed as mg PyE/g dried sample) and free radical scavenging activity (AA, expressed as % DPPH radical scavenging) of U. barbata dried lichen and both fractions (mcUB and ccUB) extracted in ethanol and acetone.
ParameterdUBmcUBccUBF-Value
TPC ethanol23.481 ± 0.039 b,x25.212 ± 0.084 a,y18.383 ± 0.004 c,x13200.49 ***
TPC acetone22.675 ± 0.108 b,y36.243 ± 0.093 a,x15.170 ± 0.129 c,y27784.01 ***
t-value12.16 ***152.42 ***43.12 **
AA acetone (% DPPH scavenging)16.878 ± 0.204 a,x12.747 ± 0.221 b,y11.336 ± 0.174 c,y10.96 **
AA ethanol (% DPPH scavenging)15.985 ± 0.197 a,y15.735 ± 0.185 a,x15.080 ± 0.326 b,x618.35 **
t-value5.45 **17.96 ***17.55 ***
dUB—dried U. barbata lichen, mcUB—medulla–cortex, ccUB—central cord, TPC—total phenolic content (mg PyE/g dried sample), mgPyE/g—milligram equivalent pyrogallol per 1 g lichen sample, AA—antioxidant activity. The mean values followed by superscript letters are significantly different: a–c in the same row for sample comparison, x–y in the same column for solvent comparison, *** significant at p < 0.001, ** significant at p < 0.01.
Table 4. Permissible limits for heavy metals in edible and medicinal plants and their content in U. barbata whole lichen (dUB) and fractions (mcUB and ccUB).
Legislative
Authority
WHO/EU
[60,61]
WHO
[62]
Eu.Ph.
[63]
Ch.Ph.
[59]
Heavy Metals Content
in U. barbata (μg/g)
Heavy MetalPermissible Limits (μg/g)dUBmcUBccUB
Edible PlantsMedicinal Plants
As0.510 2ND0.219ND
Cd0.020.210.3ND0.164ND
Cr1.3 2 ND0.225ND
Co0.01 1.0022.4940.864
Cu1020 201.5232.2461.286
Hg0.0310.10.20.6710.7080.539
Ni0.1 0.4491.0330.355
Pb2105 1.2962.1770.584
V0.03 0.2411.237ND
Zn5050 20.53633.22313.588
WHO = World and Health Organisation, EU = European Union, Eu.Ph.= European Pharmacopoeia, Ch.Ph. = Chinese Pharmacopoeia, dUB—dried U. barbata lichen, mcUB—medulla–cortex, ccUB—central cord, ND = not detected.
Publisher’s Note: MDPI stays neutral with regard to jurisdictional claims in published maps and institutional affiliations.

