1. Introduction
Metrology is a science that covers the issues of measurement related to both experimental and theoretical determinations. It includes the definition and practice realization of measurement units, and reference standards. The most important purpose is to provide a common understanding of measurement principles, not only for research, but for every area of life. The development of technology and applied sciences is very closely related to the development of new and improvement of existing measurement methods. As a result, less measurement uncertainty as well as greater accuracy and precision can be ensured. It manifests itself in increasingly sophisticated scientific discoveries and improvements in everyday devices. What is more, the pursuit of better and better measurements somehow forced the redefinition of International System of Units (SI), which took place in 2019 [
1].
Photonics plays an important role in metrology as a technology for the precise measurements of physical and chemical factors ensuring a high level of accuracy, precision and resolution. As the science of photon, it has a decisive influence on the recent scientific and technology achievements. It includes aspects of photon generation, photon-matter interaction and detection. Although it finds many applications in the whole optical range of wavelengths, most solutions operate in the visible and infrared ranges. Since the laser invention, the source of the highly coherent optical radiation, optical measurements have become a perfect tool for highly precise and accurate measurements. Such measurements have additional advantages of being non-contact methods and having fast rates suitable for in-process metrology. However, their extreme precision is ultimately limited by, e.g., the noise of both lasers and photodetectors. Therefore, breakthroughs in the field of optical sources, detectors and optics play a crucial role. They provide the state-of-the-art of photonic technology for precision metrology, and to identify directions for its future development. As a result, the cutting-edge optoelectronic systems are developed and improved in many fields of science and technology (e.g., industry, environment, healthcare, telecommunication, security and space). The most significant areas of photonics applications are:
Spectroscopy and interferometry;
Imaging, reflectometry, radiometry photometry and polarimetry;
In situ, remote and stand-off sensing;
PICs (photonic integrated circuits), QPICs (photonic quantum sensors) and hybrid sensing;
Smart sensors and sensors for robots and unmanned systems;
High-resolution and frequency metrology, and optical clocks.
The importance of photon-based technology, selected principles of metrology and measuring instrumentation in spectroscopy in solving difficult engineering problems in the detection of trace matter are presented in the further and tutorial sections of the article.
2. From the Beginning of Spectroscopy to High-Spectral-Resolution Measurements
Atomic and molecular spectroscopy appeared earlier than quantum mechanics, after Isaac Newton’s fundamental study of the spectra of sunlight in 1672, and the demonstration of a narrow slit, instead of a circular hole, for generating spectral lines by William H. Wollaston in 1802 and Joseph Fraunhofer in 1814, who also constructed transmission diffraction grating (an array of slits) and made the first observations of star emission spectra and measurements of dark line wavelengths in the solar spectrum. In 1859, Gustav Kirchhoff (physicist) and Robert Bunsen (chemist) explained that the structure of these spectra is the result of absorption by the components of the Sun’s cooler atmosphere of the continuous spectrum emitted by the hotter interior of the Sun. They recognized that each atom and molecule has its own characteristic spectrum (a so-called fingerprint) and established spectroscopy as a scientific tool for analyzing the composition of materials. Another eminent scientist, John F.W. Herschel, proposed the use of continuous curves to illustrate absorption spectra in various media in 1827. Thanks to these and many other achievements, optical spectrometers have found wide application in many fields as a very common analytical tool for the analysis of both terrestrial and stellar objects. Fraunhofer described 574 lines of solar spectrum [
2], but, to date, there are over 25,000 lines that have been identified [
3].
From the first spectrometer, constructed by Kirchhoff and Benson, to the present day, spectroscopy has become one of the most important tools in the study of matter. Thanks to the development of optomechanical technologies, optical sources and detectors, as well as analog and digital electronics, today’s spectrophotometers achieve resolutions that, until recently, were only offered by simulation programs.
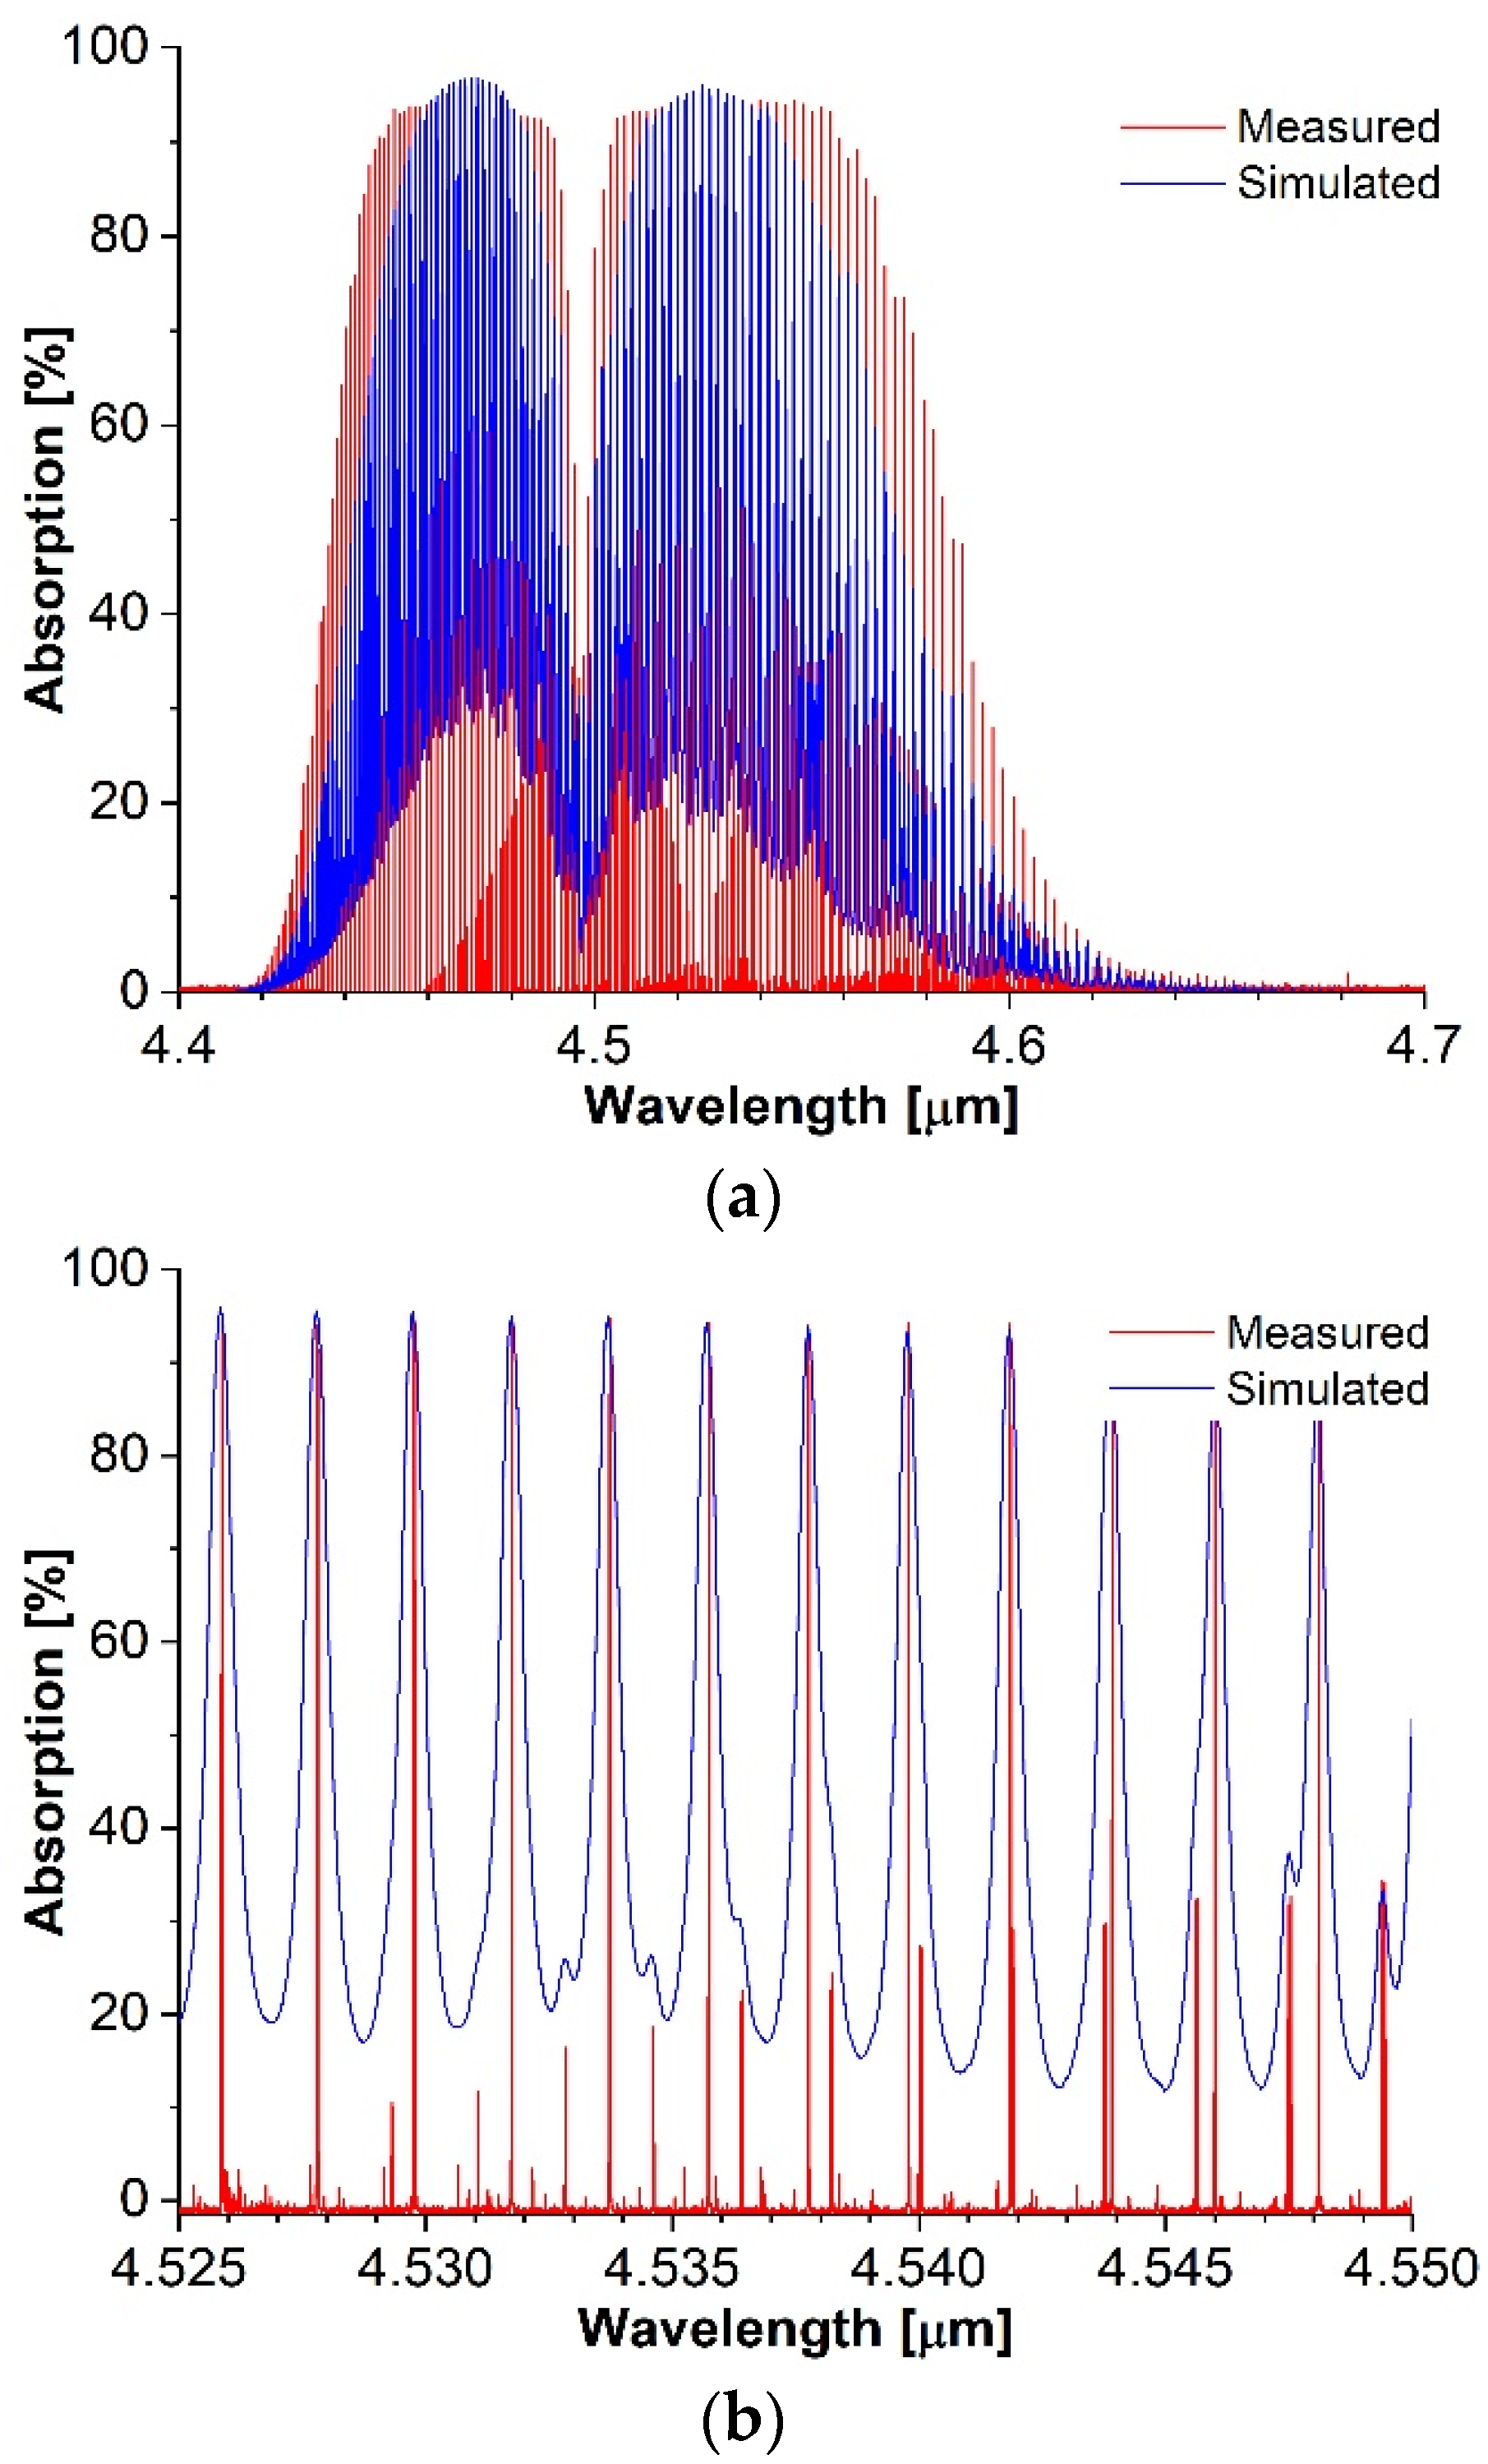
Figure 1 shows an example of absorption spectra simulated and measured in a mid-infrared range of wavelength, which is very common for gas detection research. There is a comparison of the nitrous oxide (N
2O) absorption spectra obtained in the commonly used HITRAN database and measured with the use of the Bruker IFS 125HR spectrophotometer, which currently offers one of the highest spectral resolutions of absorption spectrum measurements, amounting to 16 × 10
−4 cm
−1. On the basis of the obtained spectra, it is possible to determine the maximum values of the absorption coefficient for a given wavelength, temperature and pressure. Additionally, it should be noted that, in the oscillatory spectrum, one can distinguish the narrow component lines lying very close to each other, which form the so-called rotational spectrum related to the rotations of molecules. Both types of vibrations, together, constitute the so-called ro-vibronic spectrum. The separation of the rotational spectrum lines was possible, only thanks to the high-resolution measurements. Therefore, the spectra obtained in this way are important from the point of view of the development of optical systems for detecting trace amounts of substances based on laser absorption spectroscopy.
Resolution, apart from accuracy and precision, is one of the most important and most frequently reported metrological factor-characterizing instruments. It is defined as the smallest change that can be measured. As can be observed in
Figure 1b, the higher spectral resolution allows the identification of N
2O absorption lines that are invisible at the smaller ones, which is of great importance in the construction of laser gas sensors. This issue will be explained later in the article.
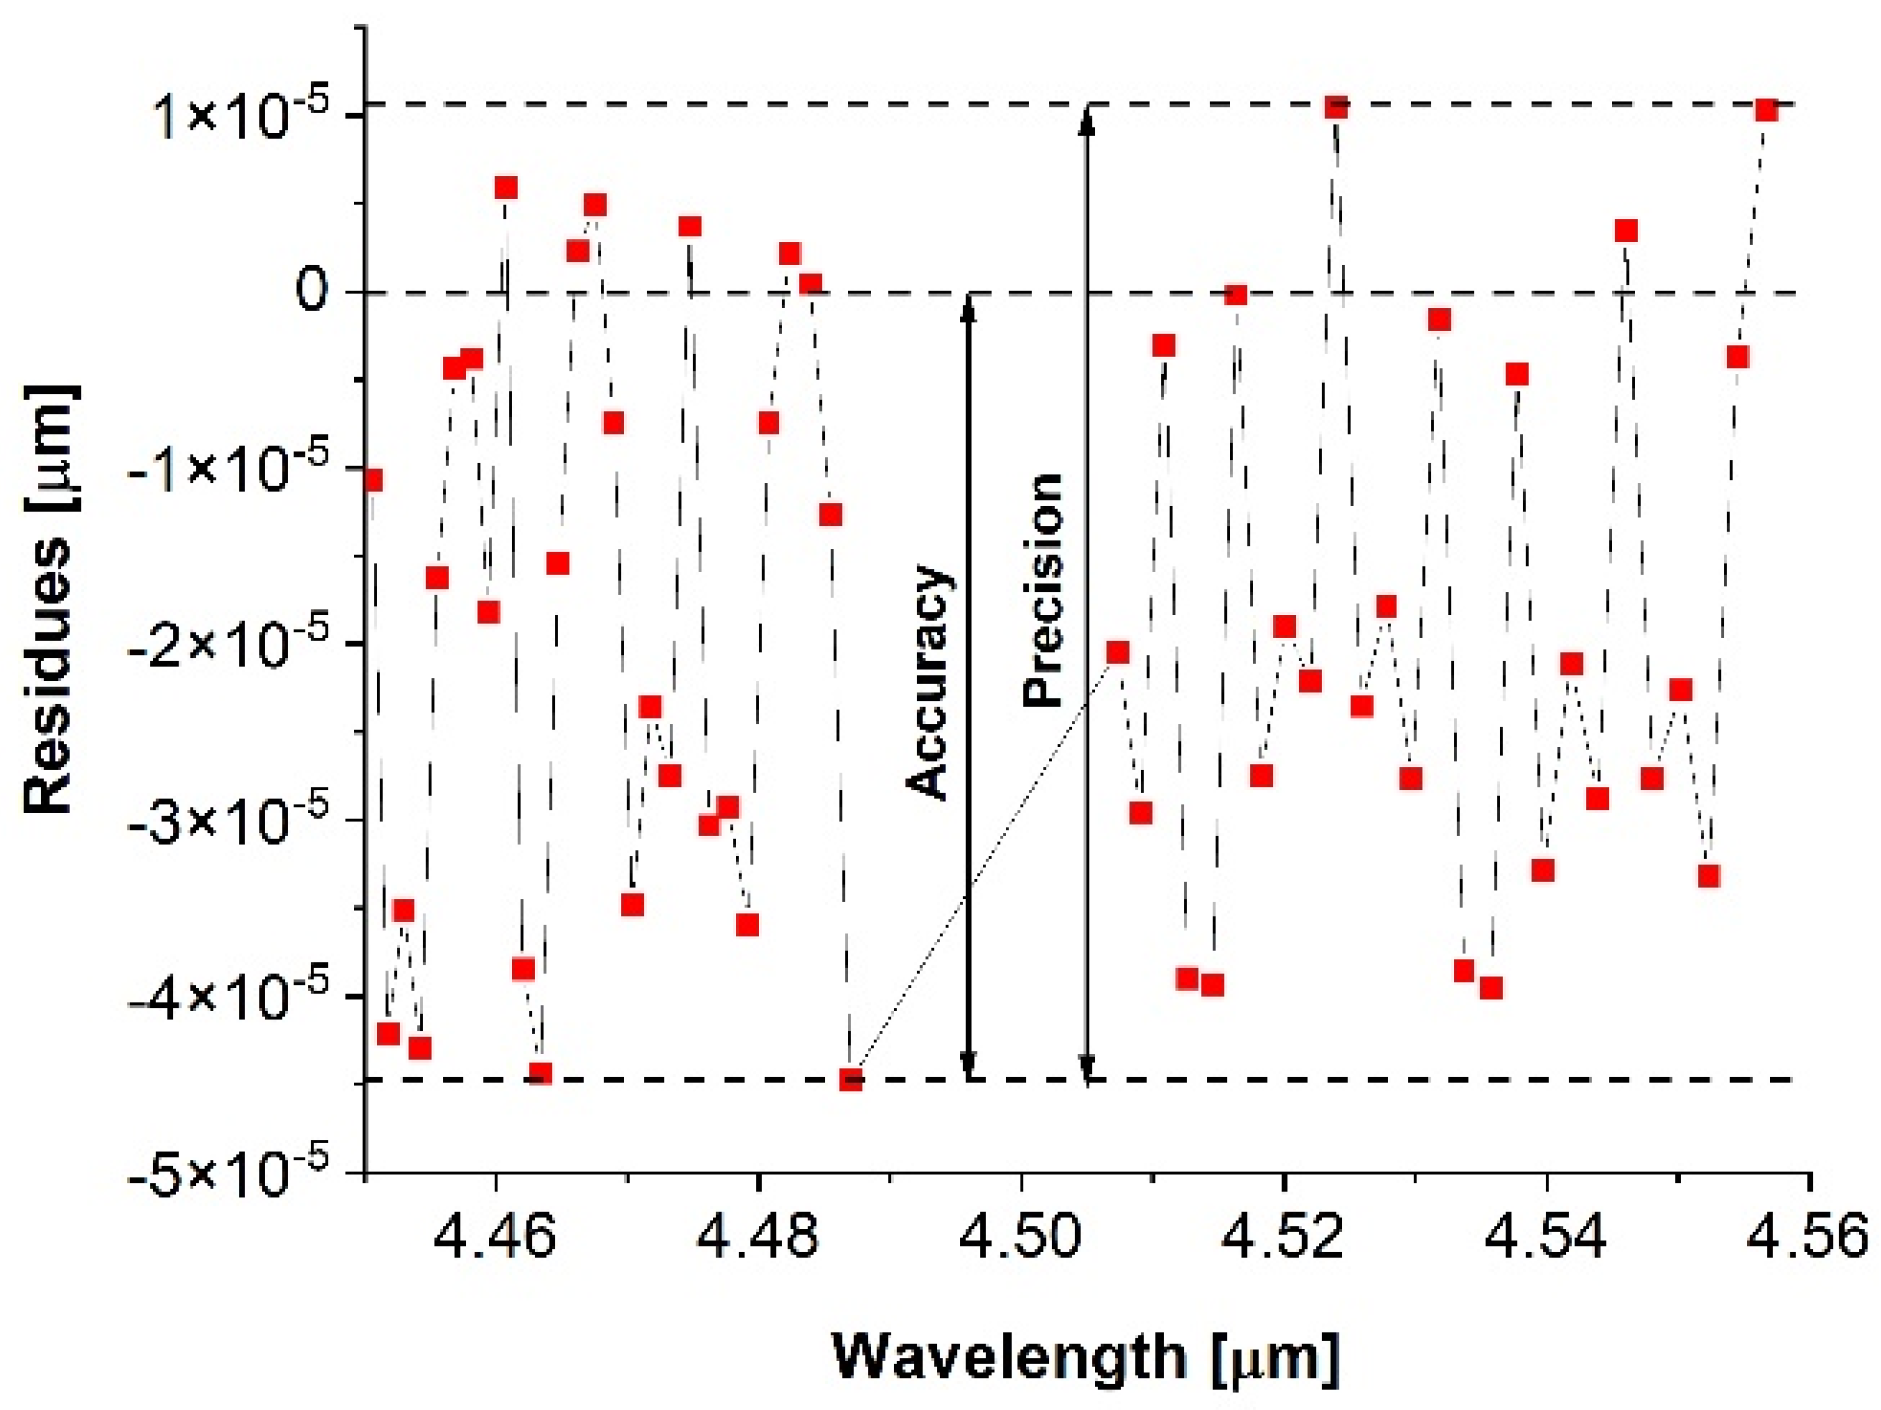
Accuracy, in turn, can be described as a certain amount of measurement uncertainty, with respect to an absolute standard. In other words, this means that an accurate instrument will provide measurements closest to the true value or standard (low uncertainty). Precision describes the reproducibility of the measurement. Accuracy is sometimes confused with precision; that is, the ability of a device to make consecutive, close measurements. The instrument can produce extremely precise measurements that are not at all accurate. Precision is a direct result of the repeatability and reproducibility of the measurements. The differences between these parameters are shown in
Figure 2.
The manner by which the accuracy and precision of the measuring instrument, in this case a spectrophotometer, influences the results is presented.
In the presented definitions, there is a term that is very important for all measurements, uncertainty, which describes the doubt concerning the validity of the measurement result. It generally characterizes a dispersion of values that can reasonably be assigned to the measurand, such as, for example, standard deviation or the half-width of an interval with a certain confidence level [
4]. In the presented example, the standard deviation (
, calculated from Formula (1), is 2.51 × 10
−5 µm.
where
N is the number of measurements,
—results of the subsequent measurements, and
is the mean value.
3. Some Practical Aspects of High-Resolution Measurements of Absorption Spectra
Nitrous oxide is primarily known as a laughing gas and a gas used to improve the power of car engines (during racing). However, the most important motivation is that N
2O is an explosives marker. It is used to assess their condition (aging process) as well as for detection [
5,
6]. From a chemical point of view, most of the modern explosives are organic nitro compounds of aromatic, heterocyclic or aliphatic series, having one or more nitro groups linked to the molecular skeleton through carbon (C-NO
2), nitrogen (N-NO
2) or oxygen (O-NO
2). It is well known that, as a result of the thermal decomposition of nitrates and nitro compounds, nitrogen oxides are formed (including N
2O), and therefore an indirect method of explosives detection may be the analysis of gases released during their heating. The composition of gaseous products of thermolysis, including the amount and type of nitrogen oxides, depends primarily on the conditions of its operation (e.g., temperature and state of aggregation), but also on the structure of the explosive compound undergoing decomposition, i.e., on the number of nitro groups and the method of their connection with the skeleton carbon molecule. For this reason, the results of the analysis can also be used to identify the compound to be degraded (or at least a group of compounds) [
7,
8]. Extensive research on the decomposition products of various explosives, where N
2O has been identified as a common marker, is described in refs. [
6,
9].
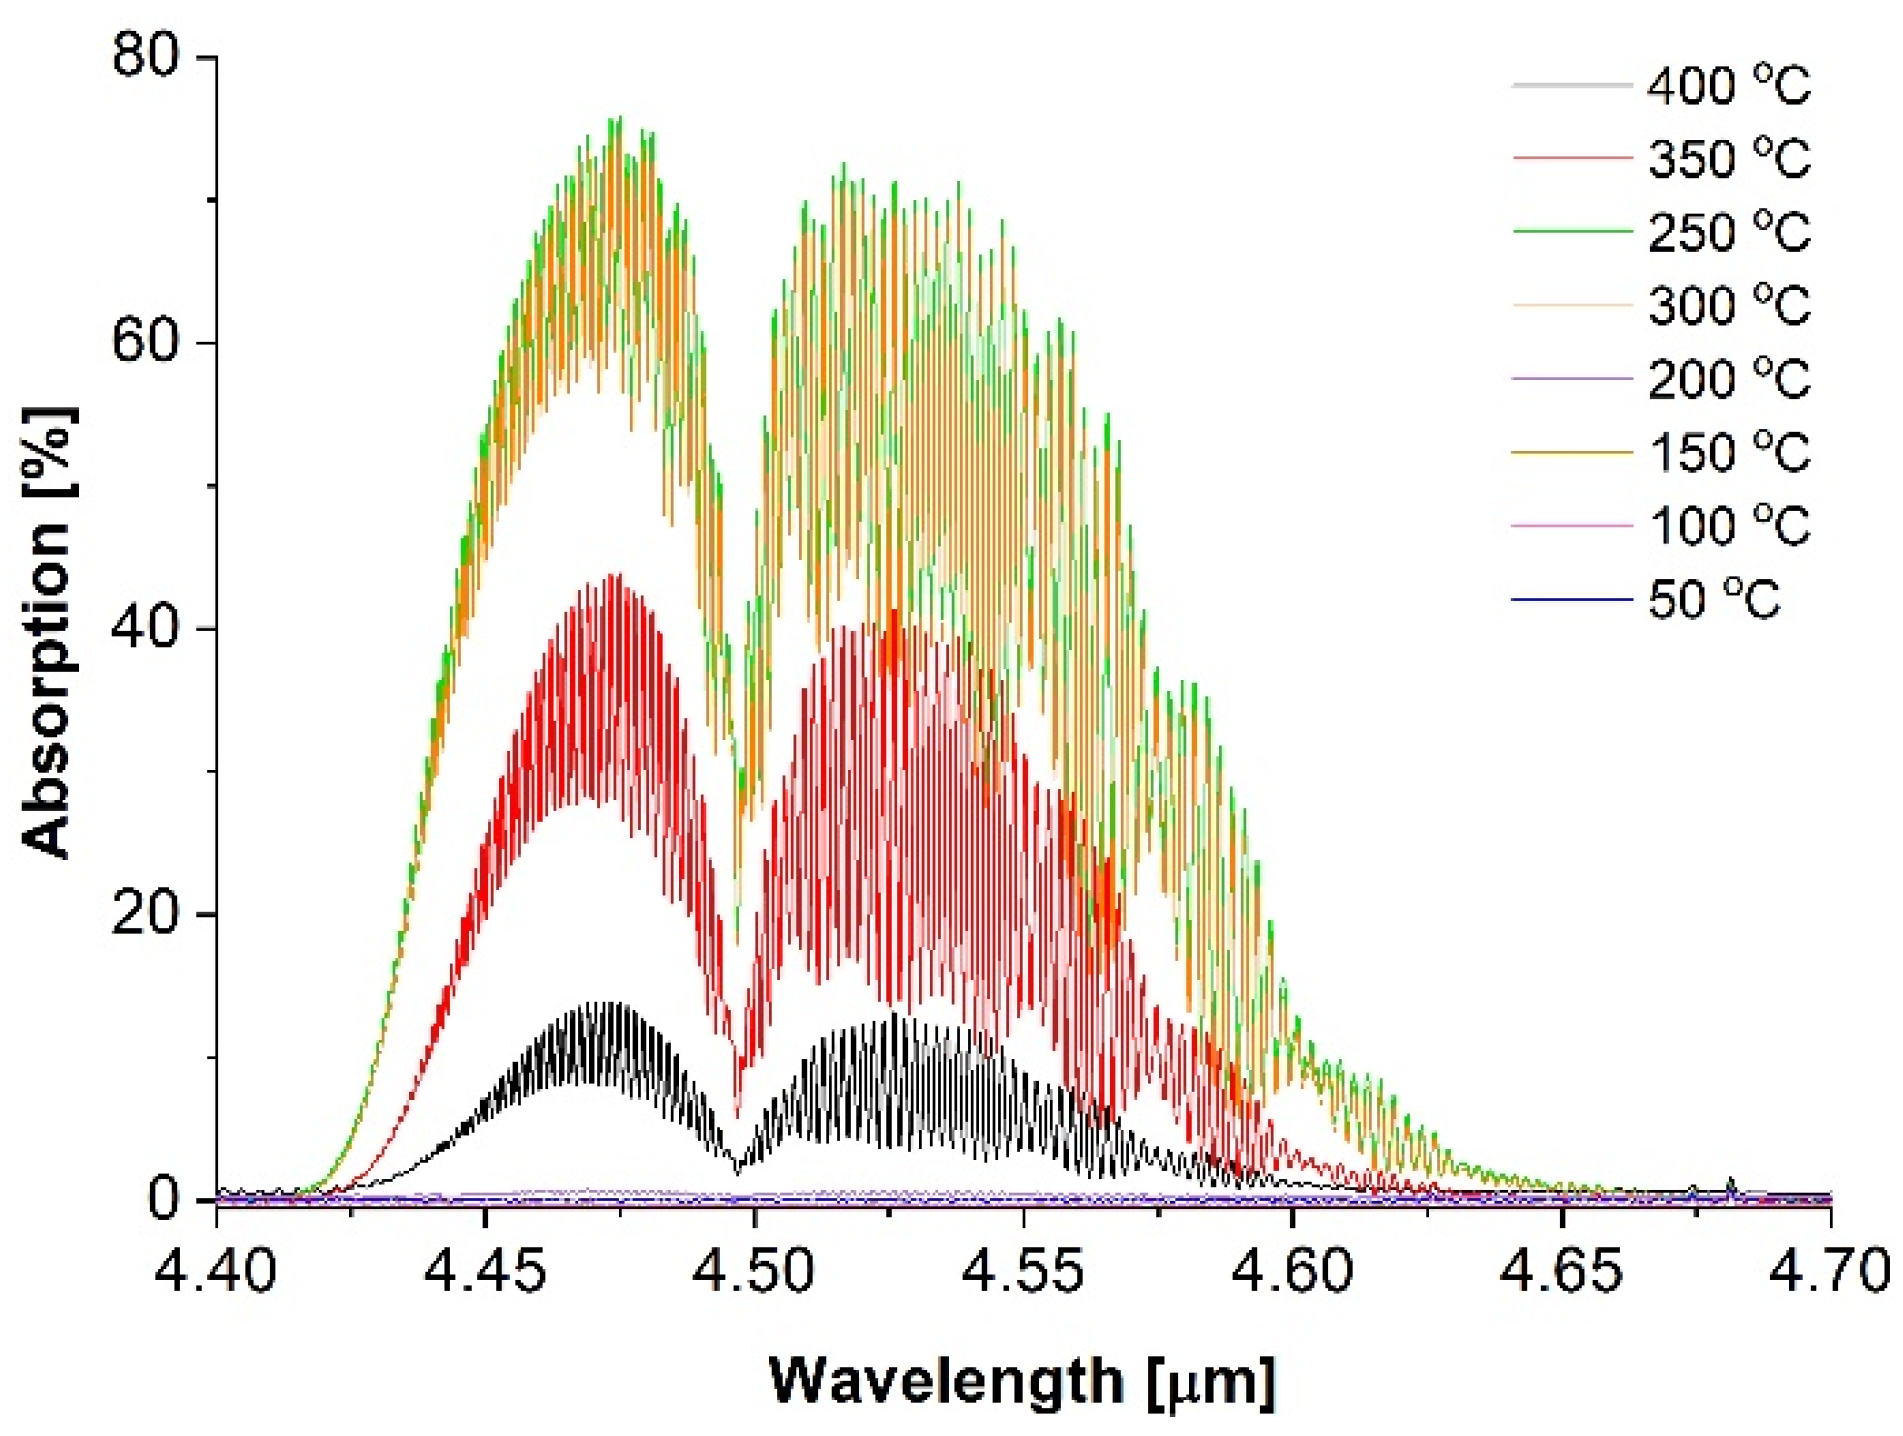
Figure 3 shows the examples of the research results conducted in this area at the Institute of Optoelectronics MUT. The graph shows the N
2O spectra recorded during the decomposition of propylnitroguanidine (PrNQ), which is a future TNT substitute.
Taking this into account, it makes sense to develop sensors capable of detecting N
2O. It should also be taken into consideration that these are trace concentrations. and therefore the sensor must have the highest possible sensitivity and excellent parameters, which were previously described. Therefore, the sensors that use laser absorption spectroscopy (LAS) are ideal for this purpose [
8,
9]. The fast response, non-invasive measurement and high reliability of these sensors can be highlighted alongside their other advantages. However, in order to achieve such features, one of the fundamental conditions that must be met is to match the wavelength of the radiation source to the absorption spectrum of the test substance. Therefore, lasers that have narrow spectral lines (e.g., FWHM < 0.001 cm
−1) are used. As a result, a precise adjustment of the laser radiation wavelength to the selected absorption bands (lines), the half-width of which is also often below 0.001 cm
−1, can be achieved. Moreover, in order to ensure the possibility of detecting the lowest possible concentration of the molecules of a given substance, the bands with the largest absorption coefficient are selected. However, to ensure the high accuracy of the detection system, the interference of the absorption bands of other substances in the vicinity of the analyzed sample should also be taken into account. As can be observed in
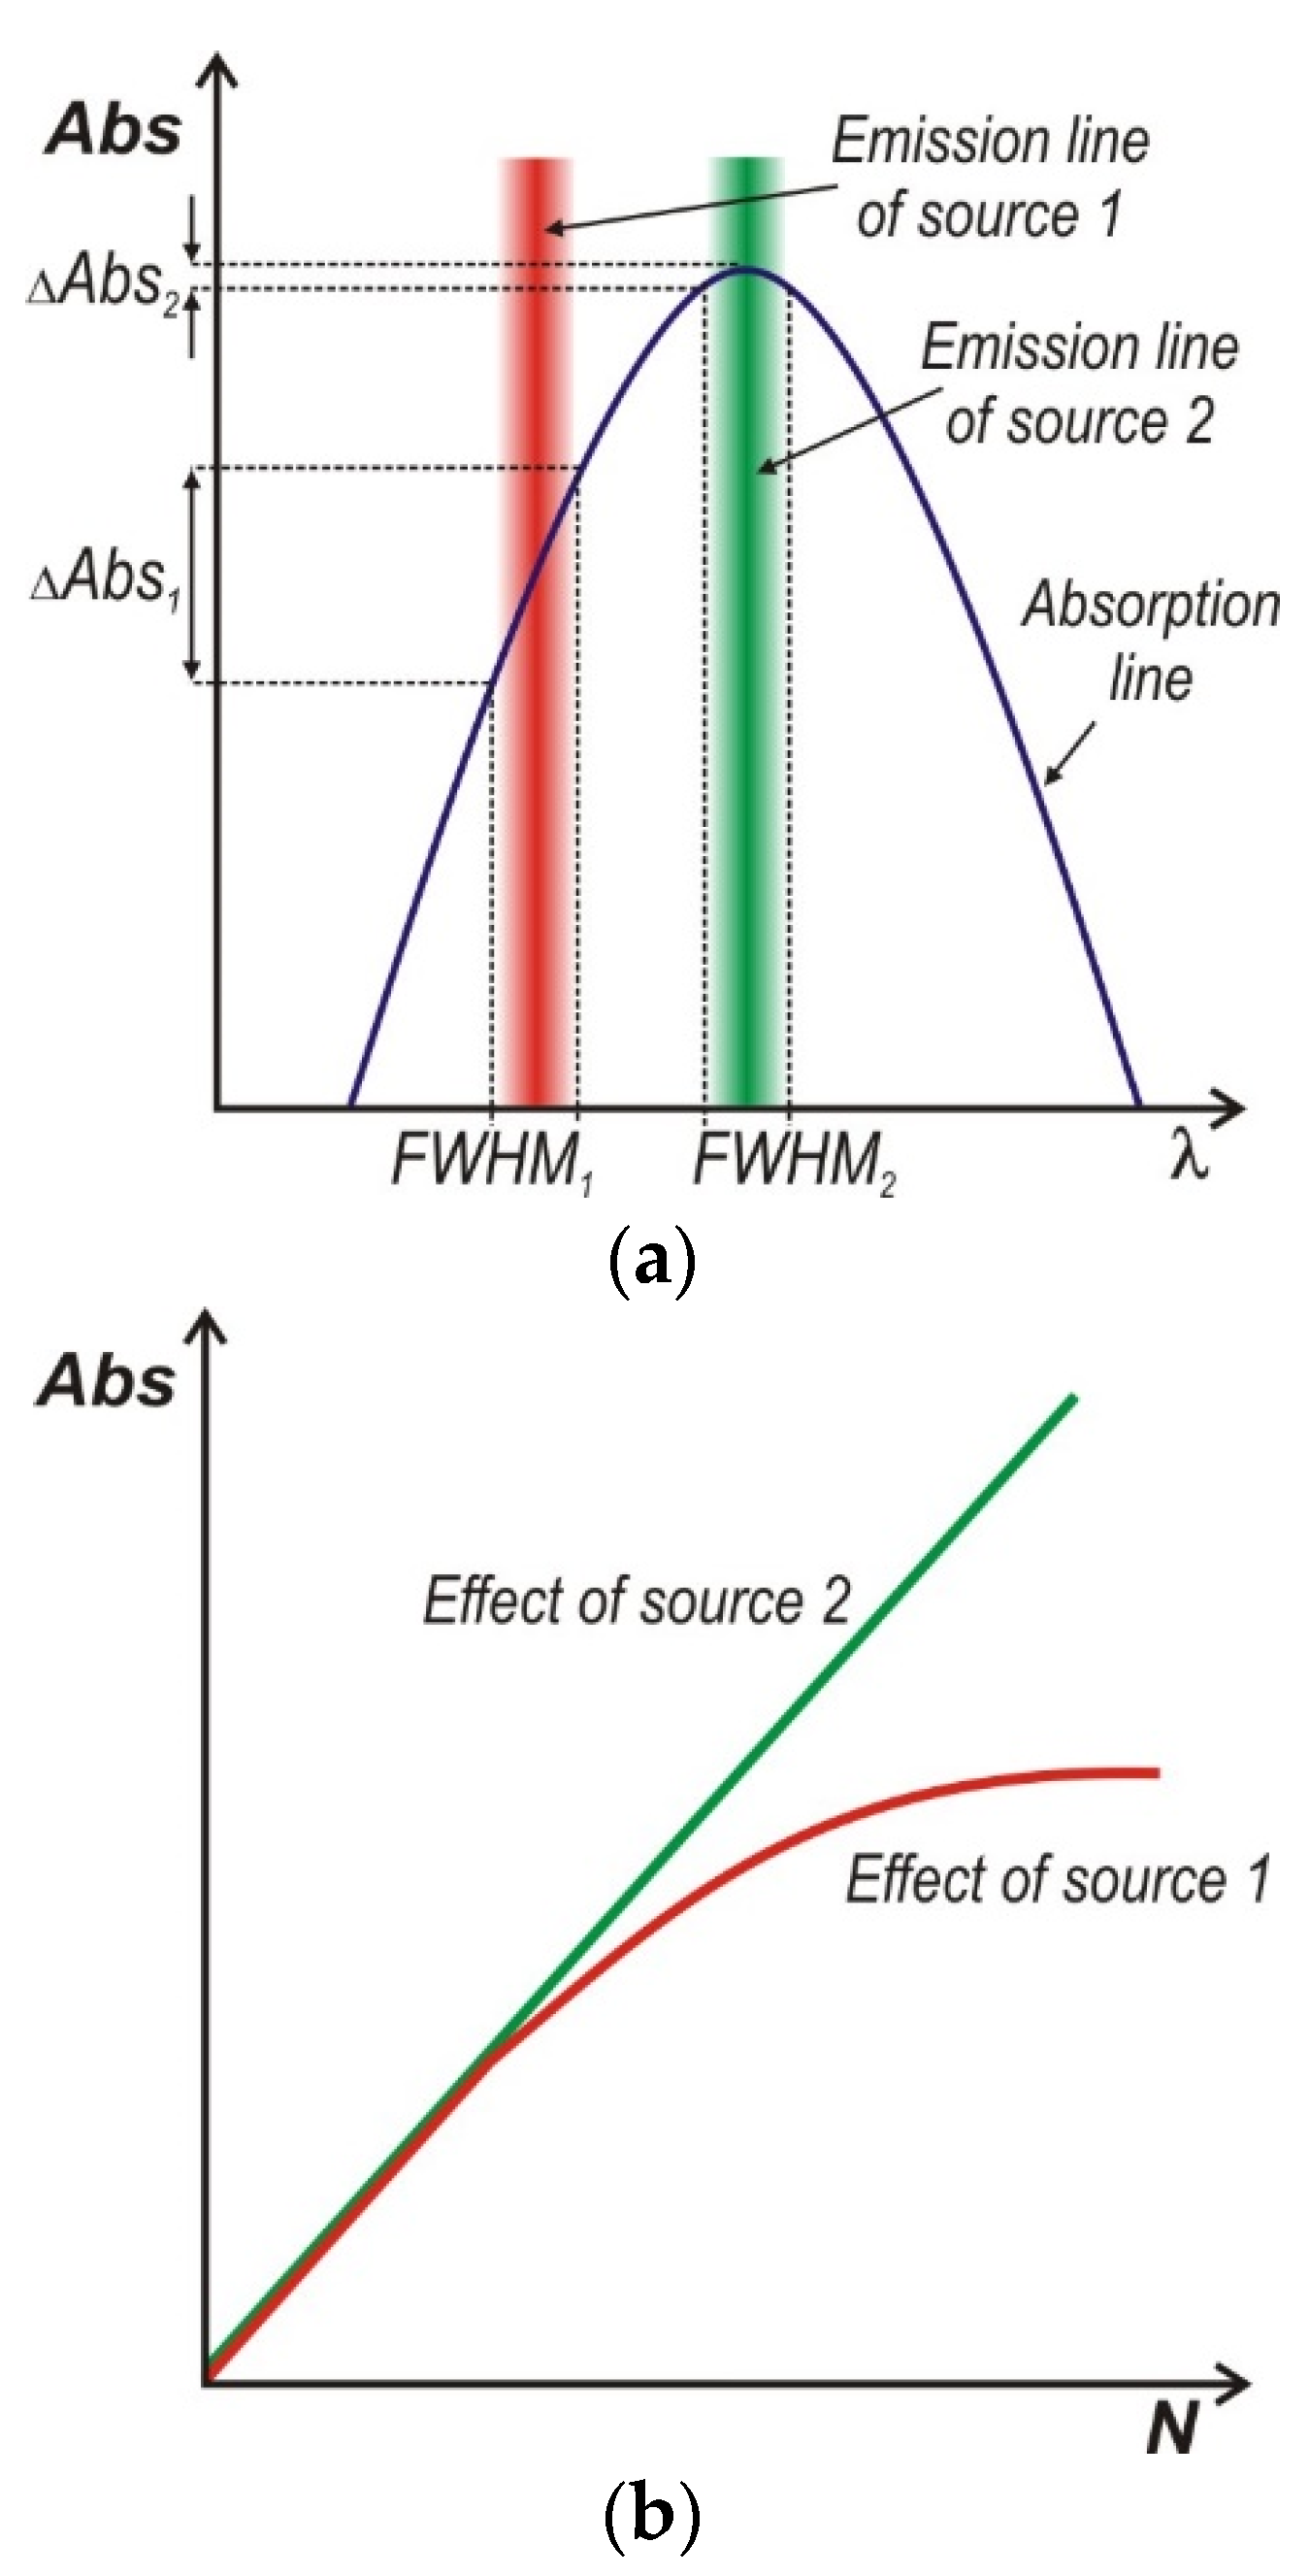
Figure 1b, in the case of low-resolution absorption spectra, it may occur that the laser is tuned between the absorption lines due to the apparent shape of the absorption lines formed as envelopes from the points included in different and independent absorption lines.
The accurate and precise measurements of the absorption spectra have another very important meaning. If the sensor is not perfectly tuned at the maximum of the absorption line, not only will it decrease its sensitivity, but it will also be exposed to a highly non-linear operation. Some well-known equations are needed to explain this. Absorption gas sensors use the effect of the absorption of radiation by molecules, the wavelength
of which is matched to their resonance frequency, the so-called absorption band. The radiation
passing through the layer of gas (
L) with the absorption coefficient α
is attenuated according to the Beer–Lambert law:
where
is the initial intensity, before the absorbing layer. Absorbance (
Abs) can be used to define the quantity characterizing the absorption of radiation, which is described by the following formula:
where
denotes the absorption cross section in cm
2, and
N is the absorber concentration in cm
−3. In the case of the inaccurate matching of the laser wavelength to the absorption line or using not single-mode laser, then the absorption coefficient does not possess the same value. This is illustrated in
Figure 4. For the sake of simplicity, the same spectral full widths in the half maximum (
FWHM1 =
FWHM2) of the radiation sources were assumed.
Figure 4a shows that, for the first source, small changes in the wavelength cause significant changes in the absorbance (Δ
Abs1). On the other hand, in the case of source 2, these changes are much smaller (Δ
Abs2 << Δ
Abs1). It follows that such an arrangement is much less sensitive to the shape of the absorption line. As the absorber concentration increases, the shape of the absorption line changes (its amplitude and width increase). This results in the non-linear response of the absorption sensor with source 1 (
Figure 4b).
4. Summary
Photonics plays a key role in increasing the precision of measurements in many areas of life and science. The present article justifies this thesis on the example of evolution and some principles of photon spectroscopy. Since the inception of spectroscopy, to which such eminent scientists as Newton, Wollaston, Fraunhofer, Kirchhoff, and Herschel have contributed, this field of research has come a long way to produce advanced devices that can be used today. They offer a high spectral resolution and precise, accurate, non-invasive and fast measurements. The meaning of these parameters is presented in the present article. As this paper demonstrates, they have a direct impact on practical applications. Measurements, with the use of such spectrophotometers, make it possible to record the rotating structure of the oscillating spectrum of the characteristic absorption bands of various substances. Thanks to this, in gas absorption sensors, it is possible to precisely match the wavelength of the laser radiation to the selected spectral line, where the absorption coefficient is the highest. With the development of technology, both in the field of semiconductor radiation sources and highly responsive detectors, there are opportunities to develop improved and miniaturized sensors based on absorption analysis and in previously unused spectral ranges.

