
Time-Dependent Behavior of Reinforced Concrete Beams under High Sustained Loads


Abstract
1. Introduction
2. Materials and Methods
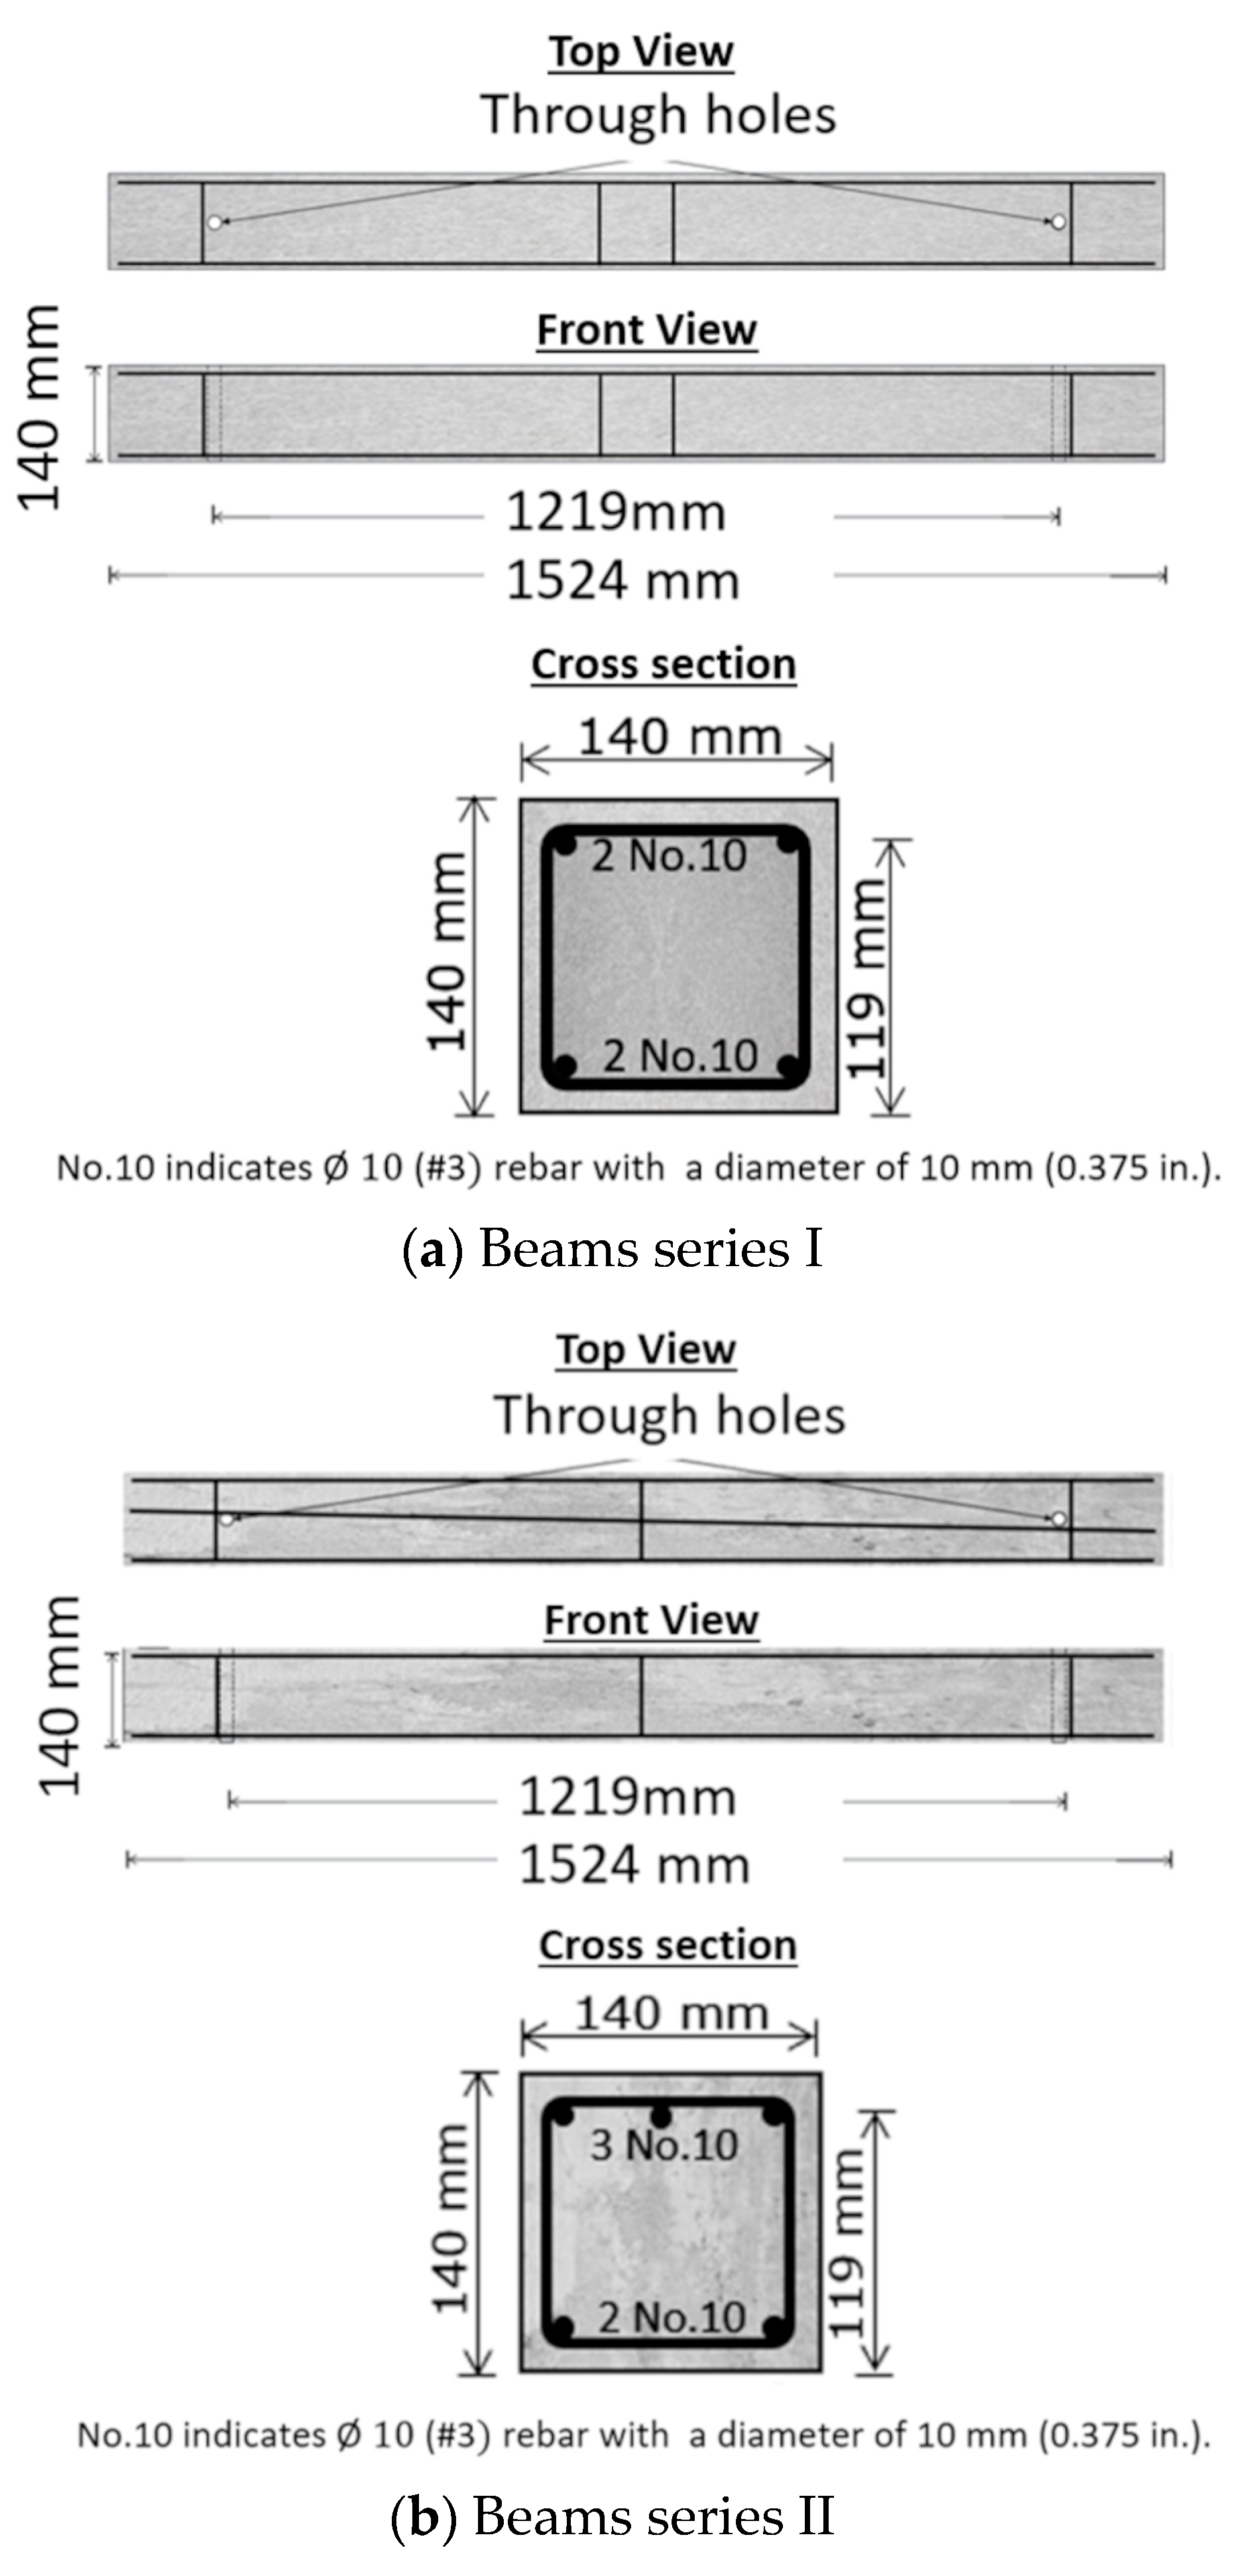
2.1. Specimen Design
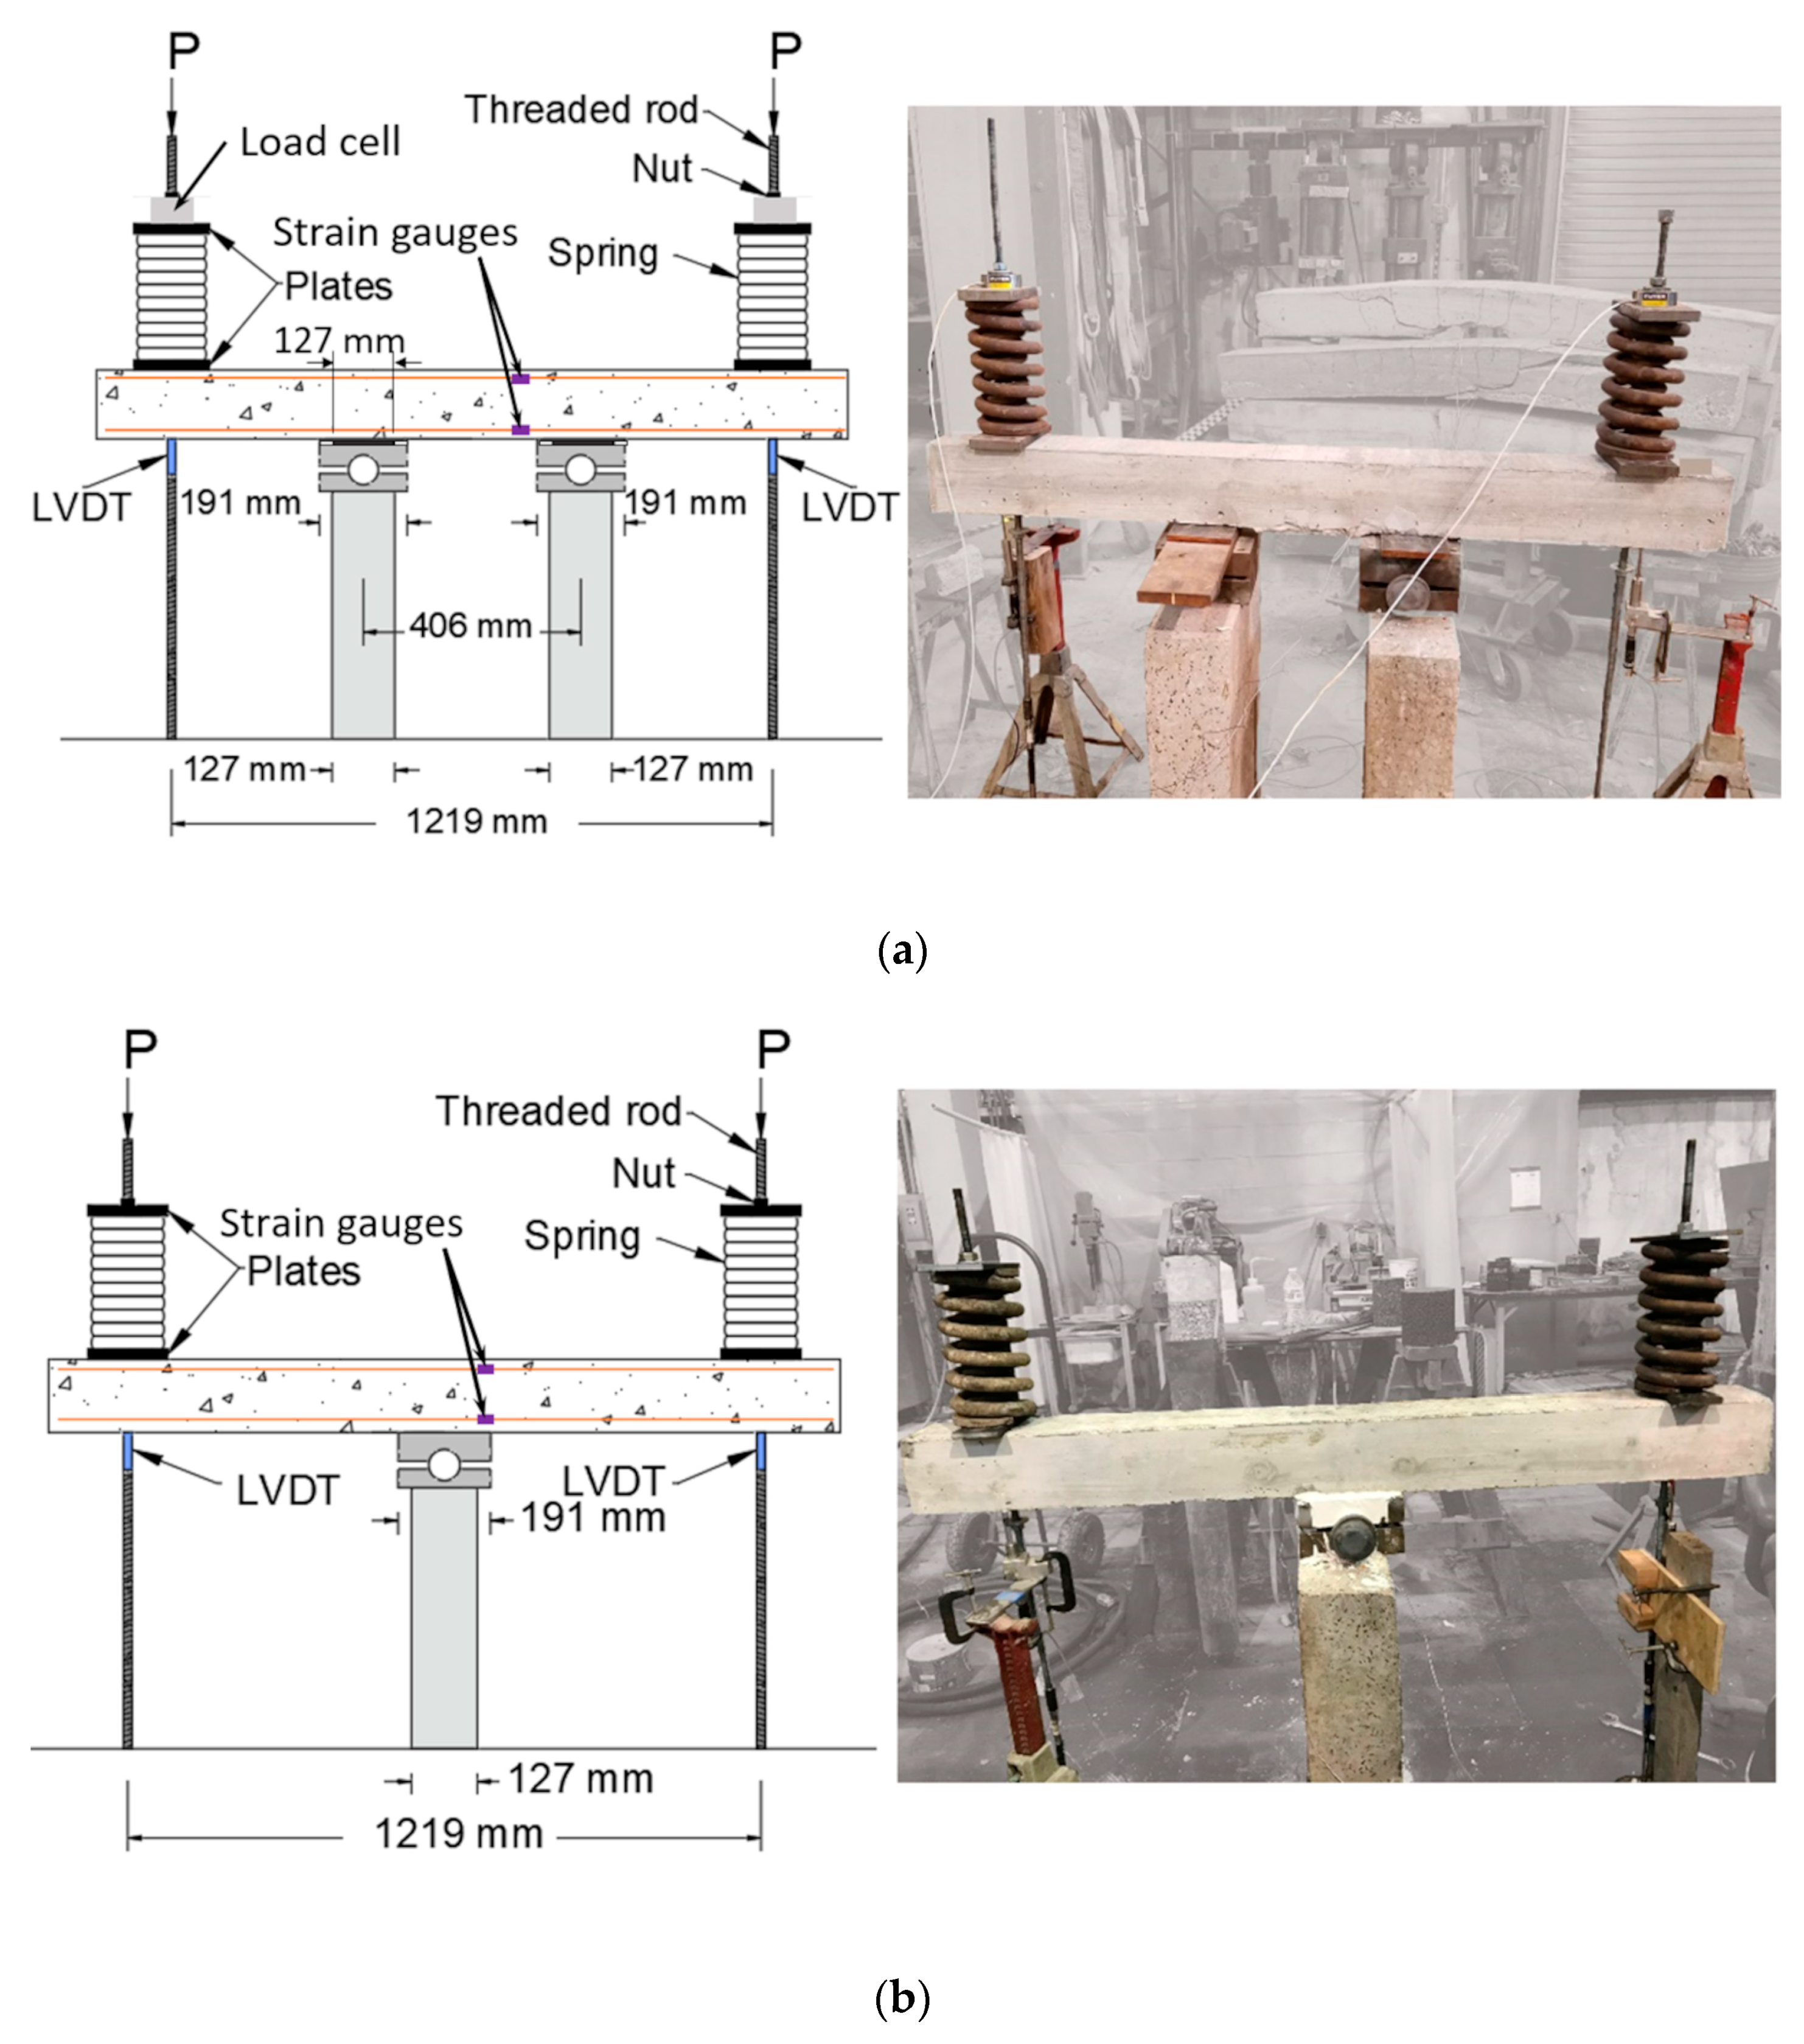
2.2. Test Setup
2.3. Instrumentation
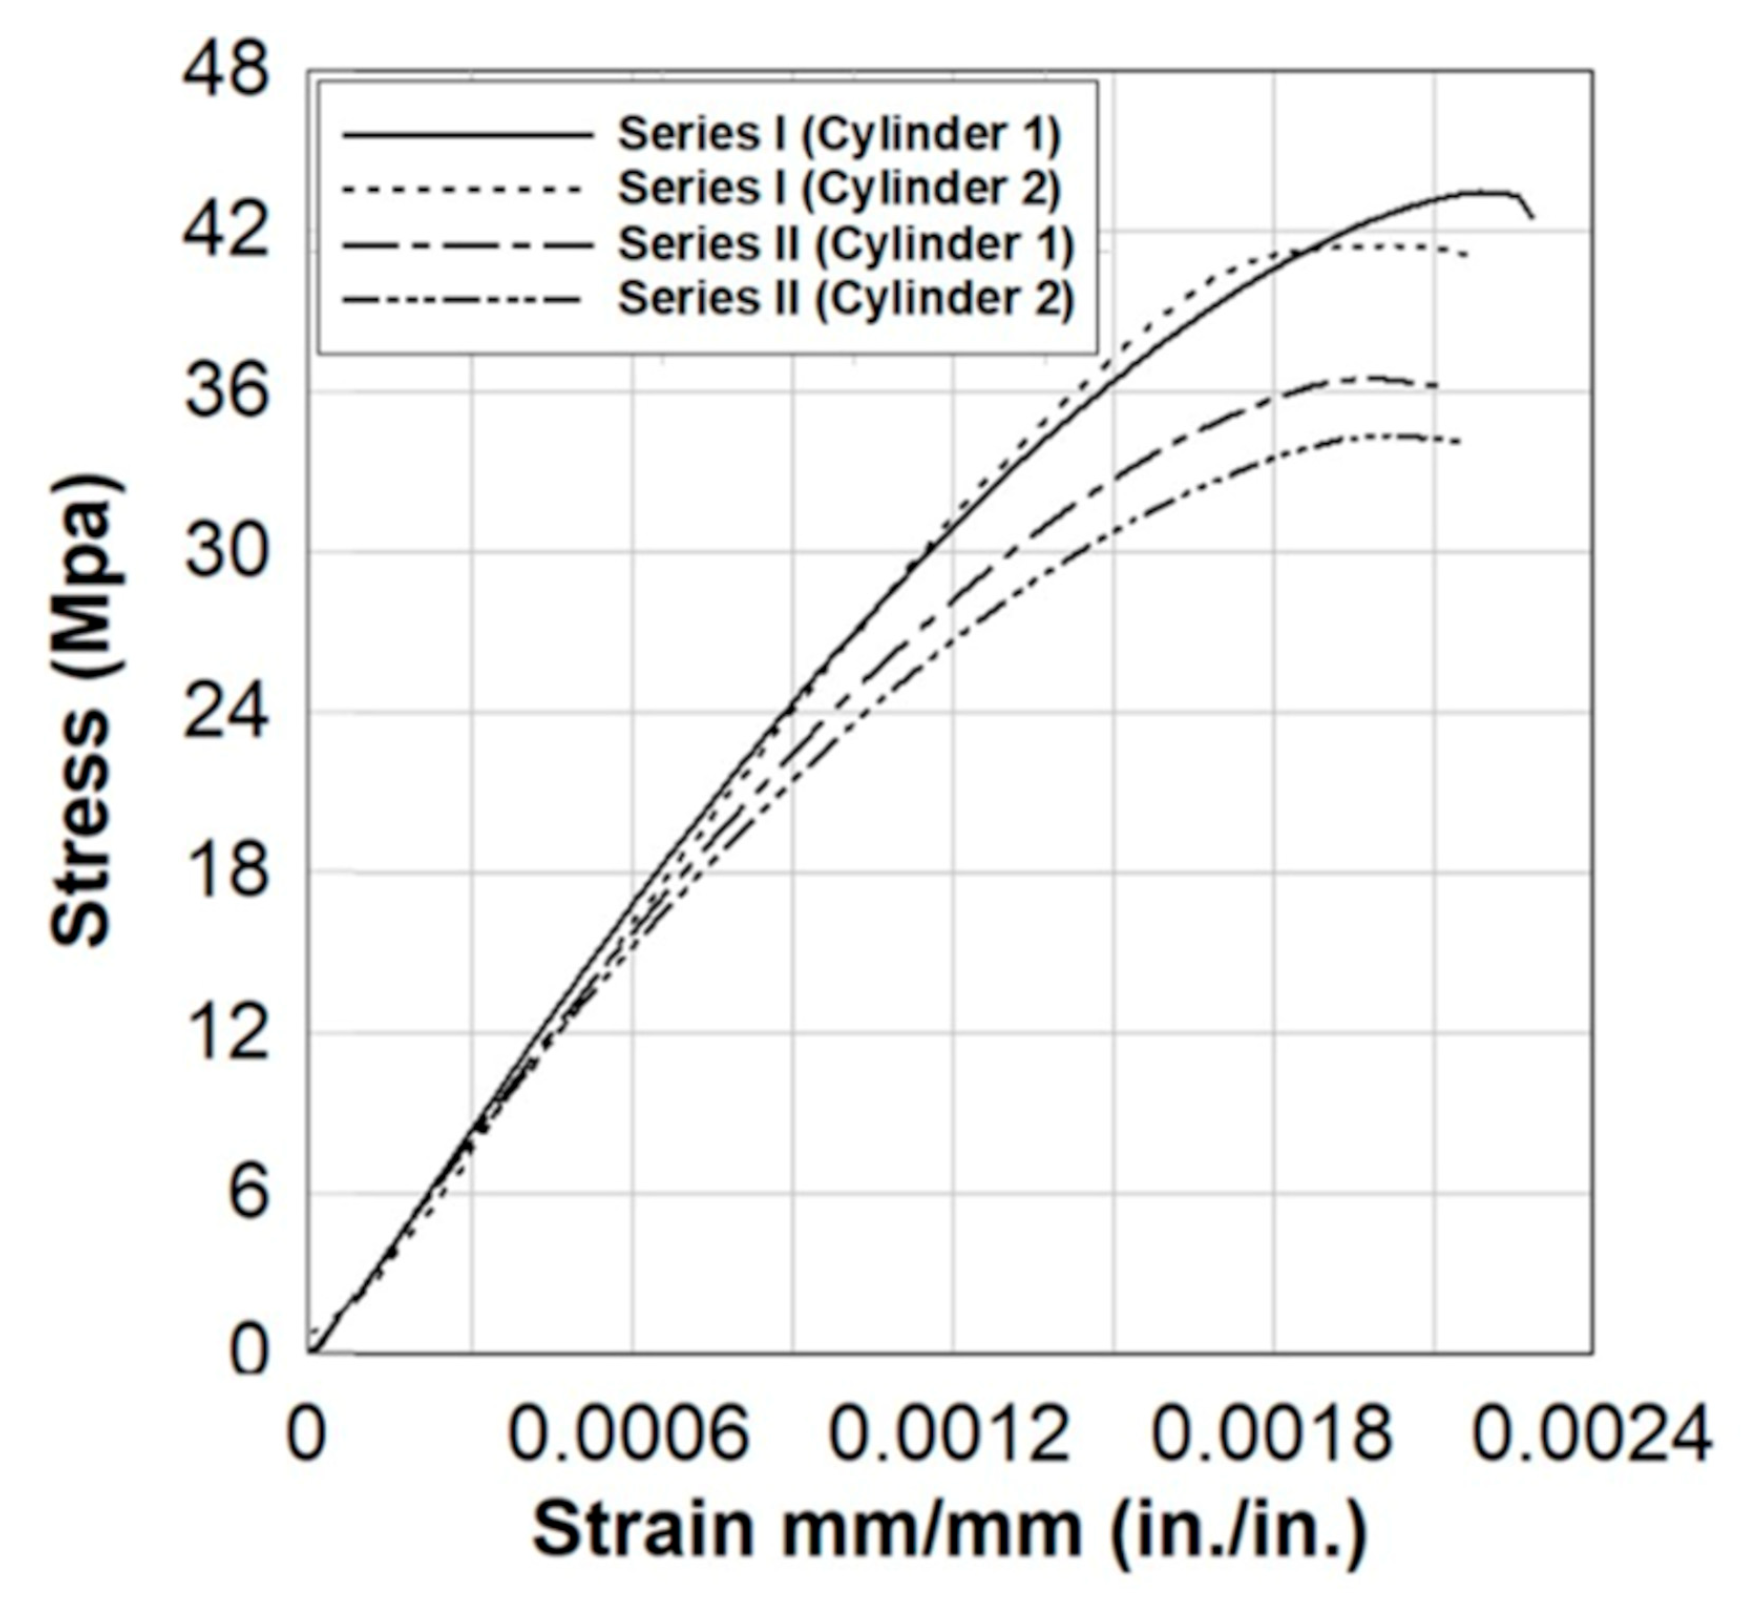
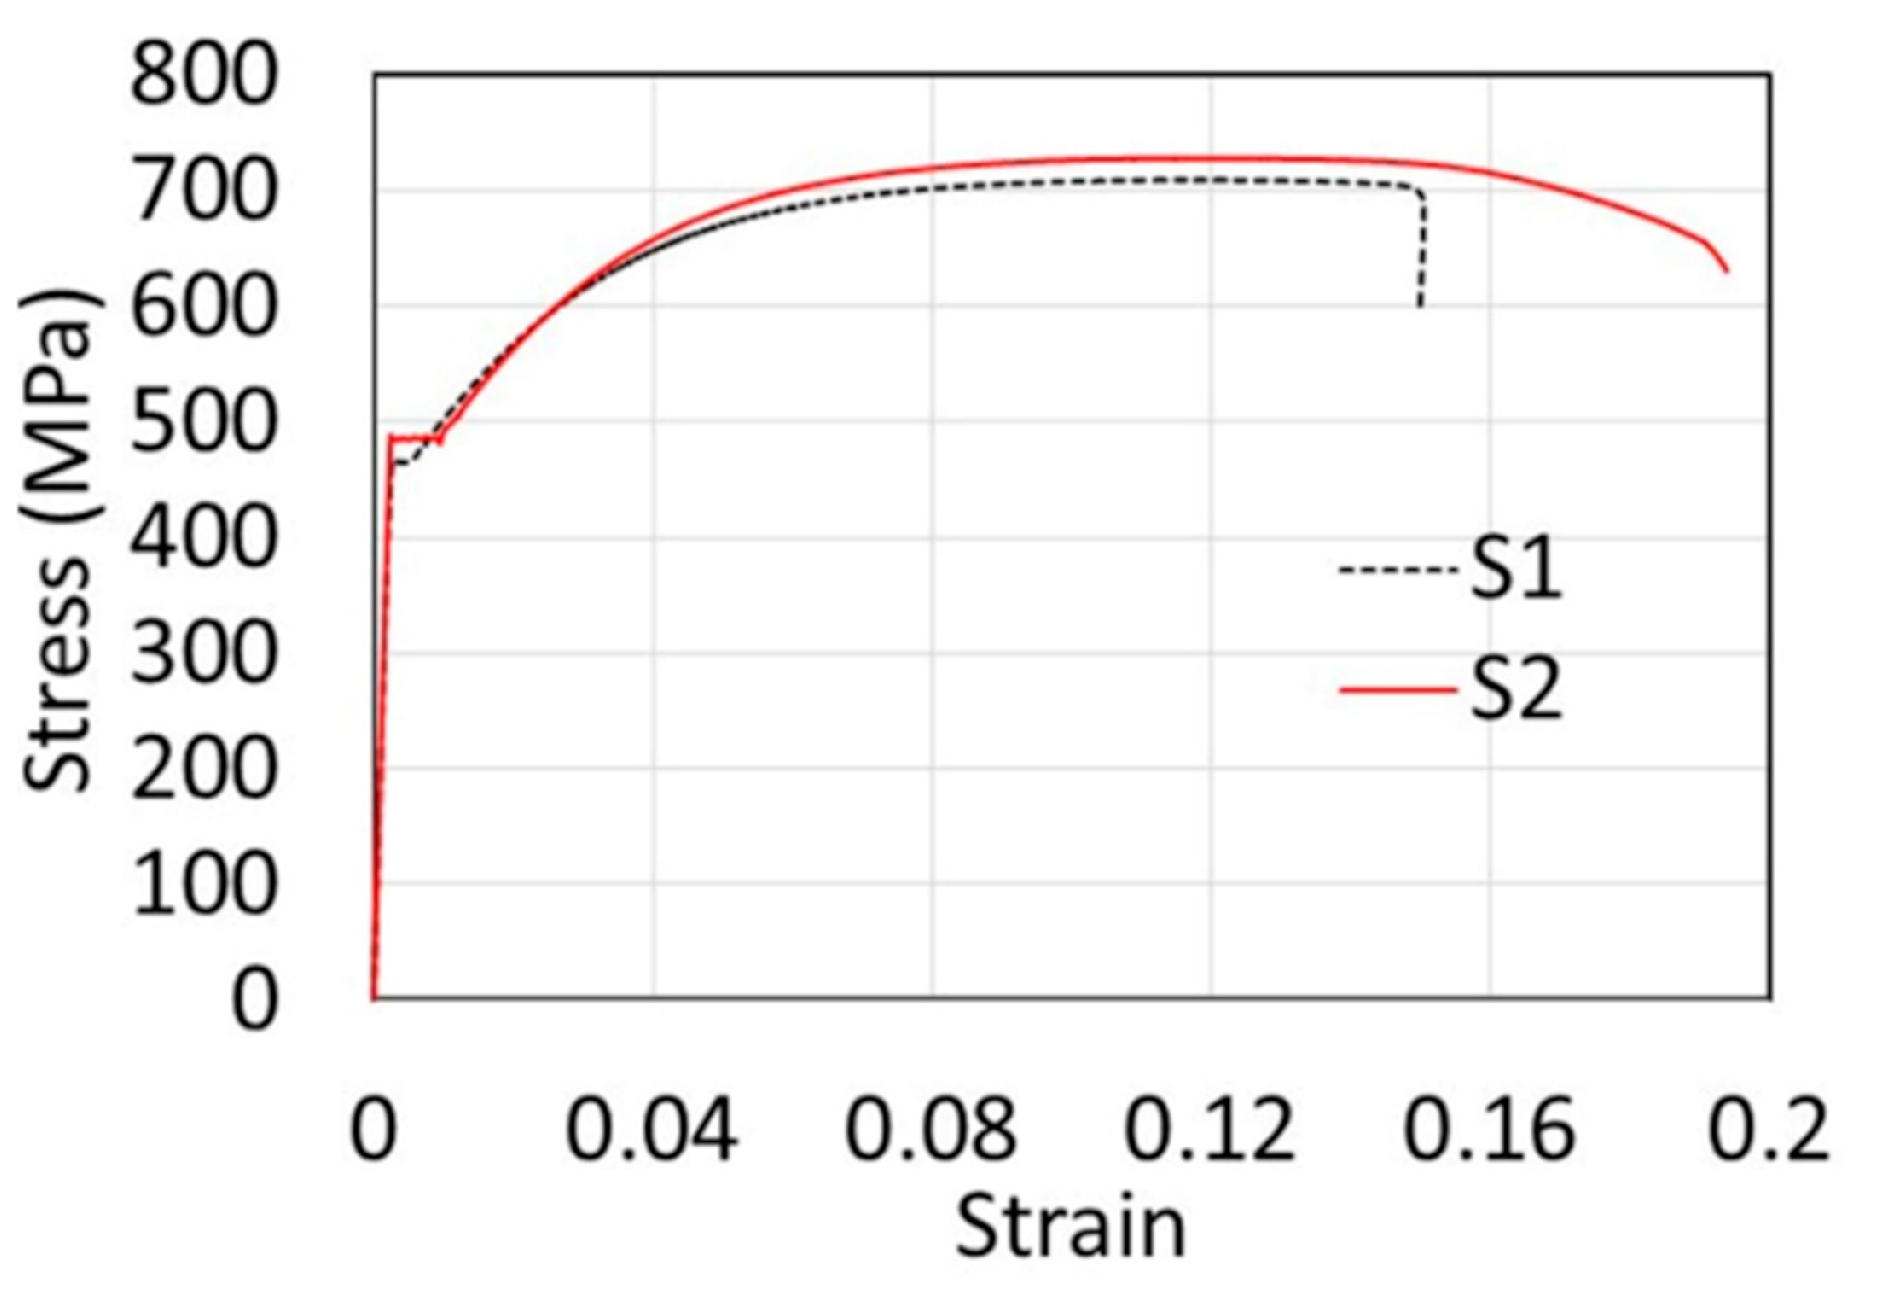
2.4. Material Properties
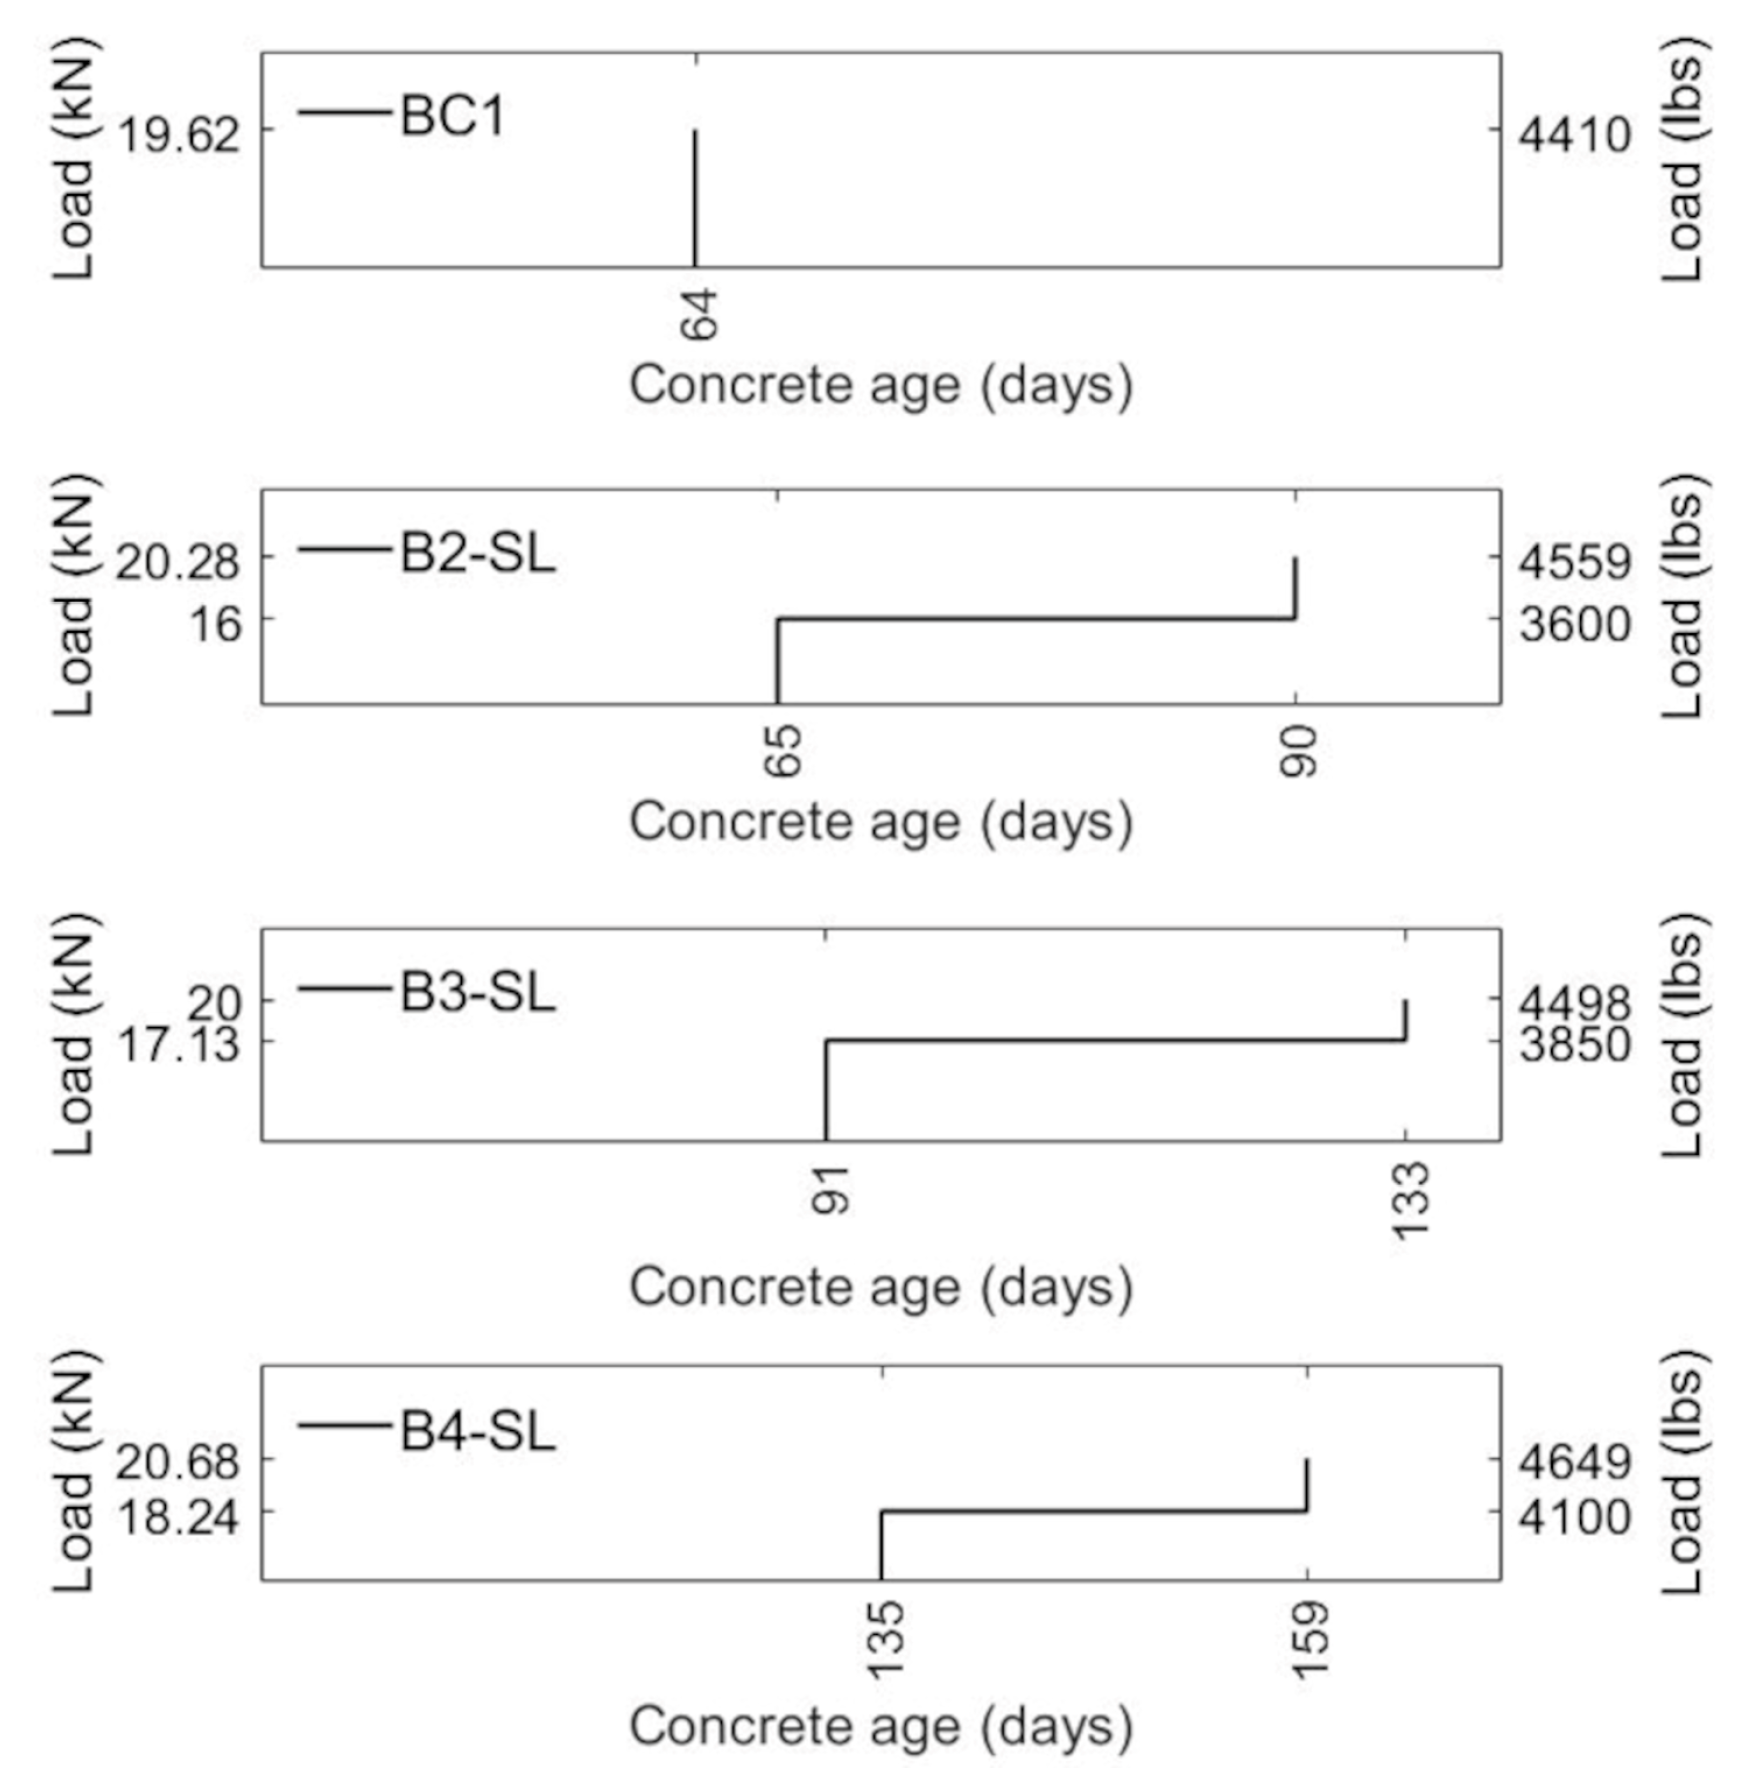
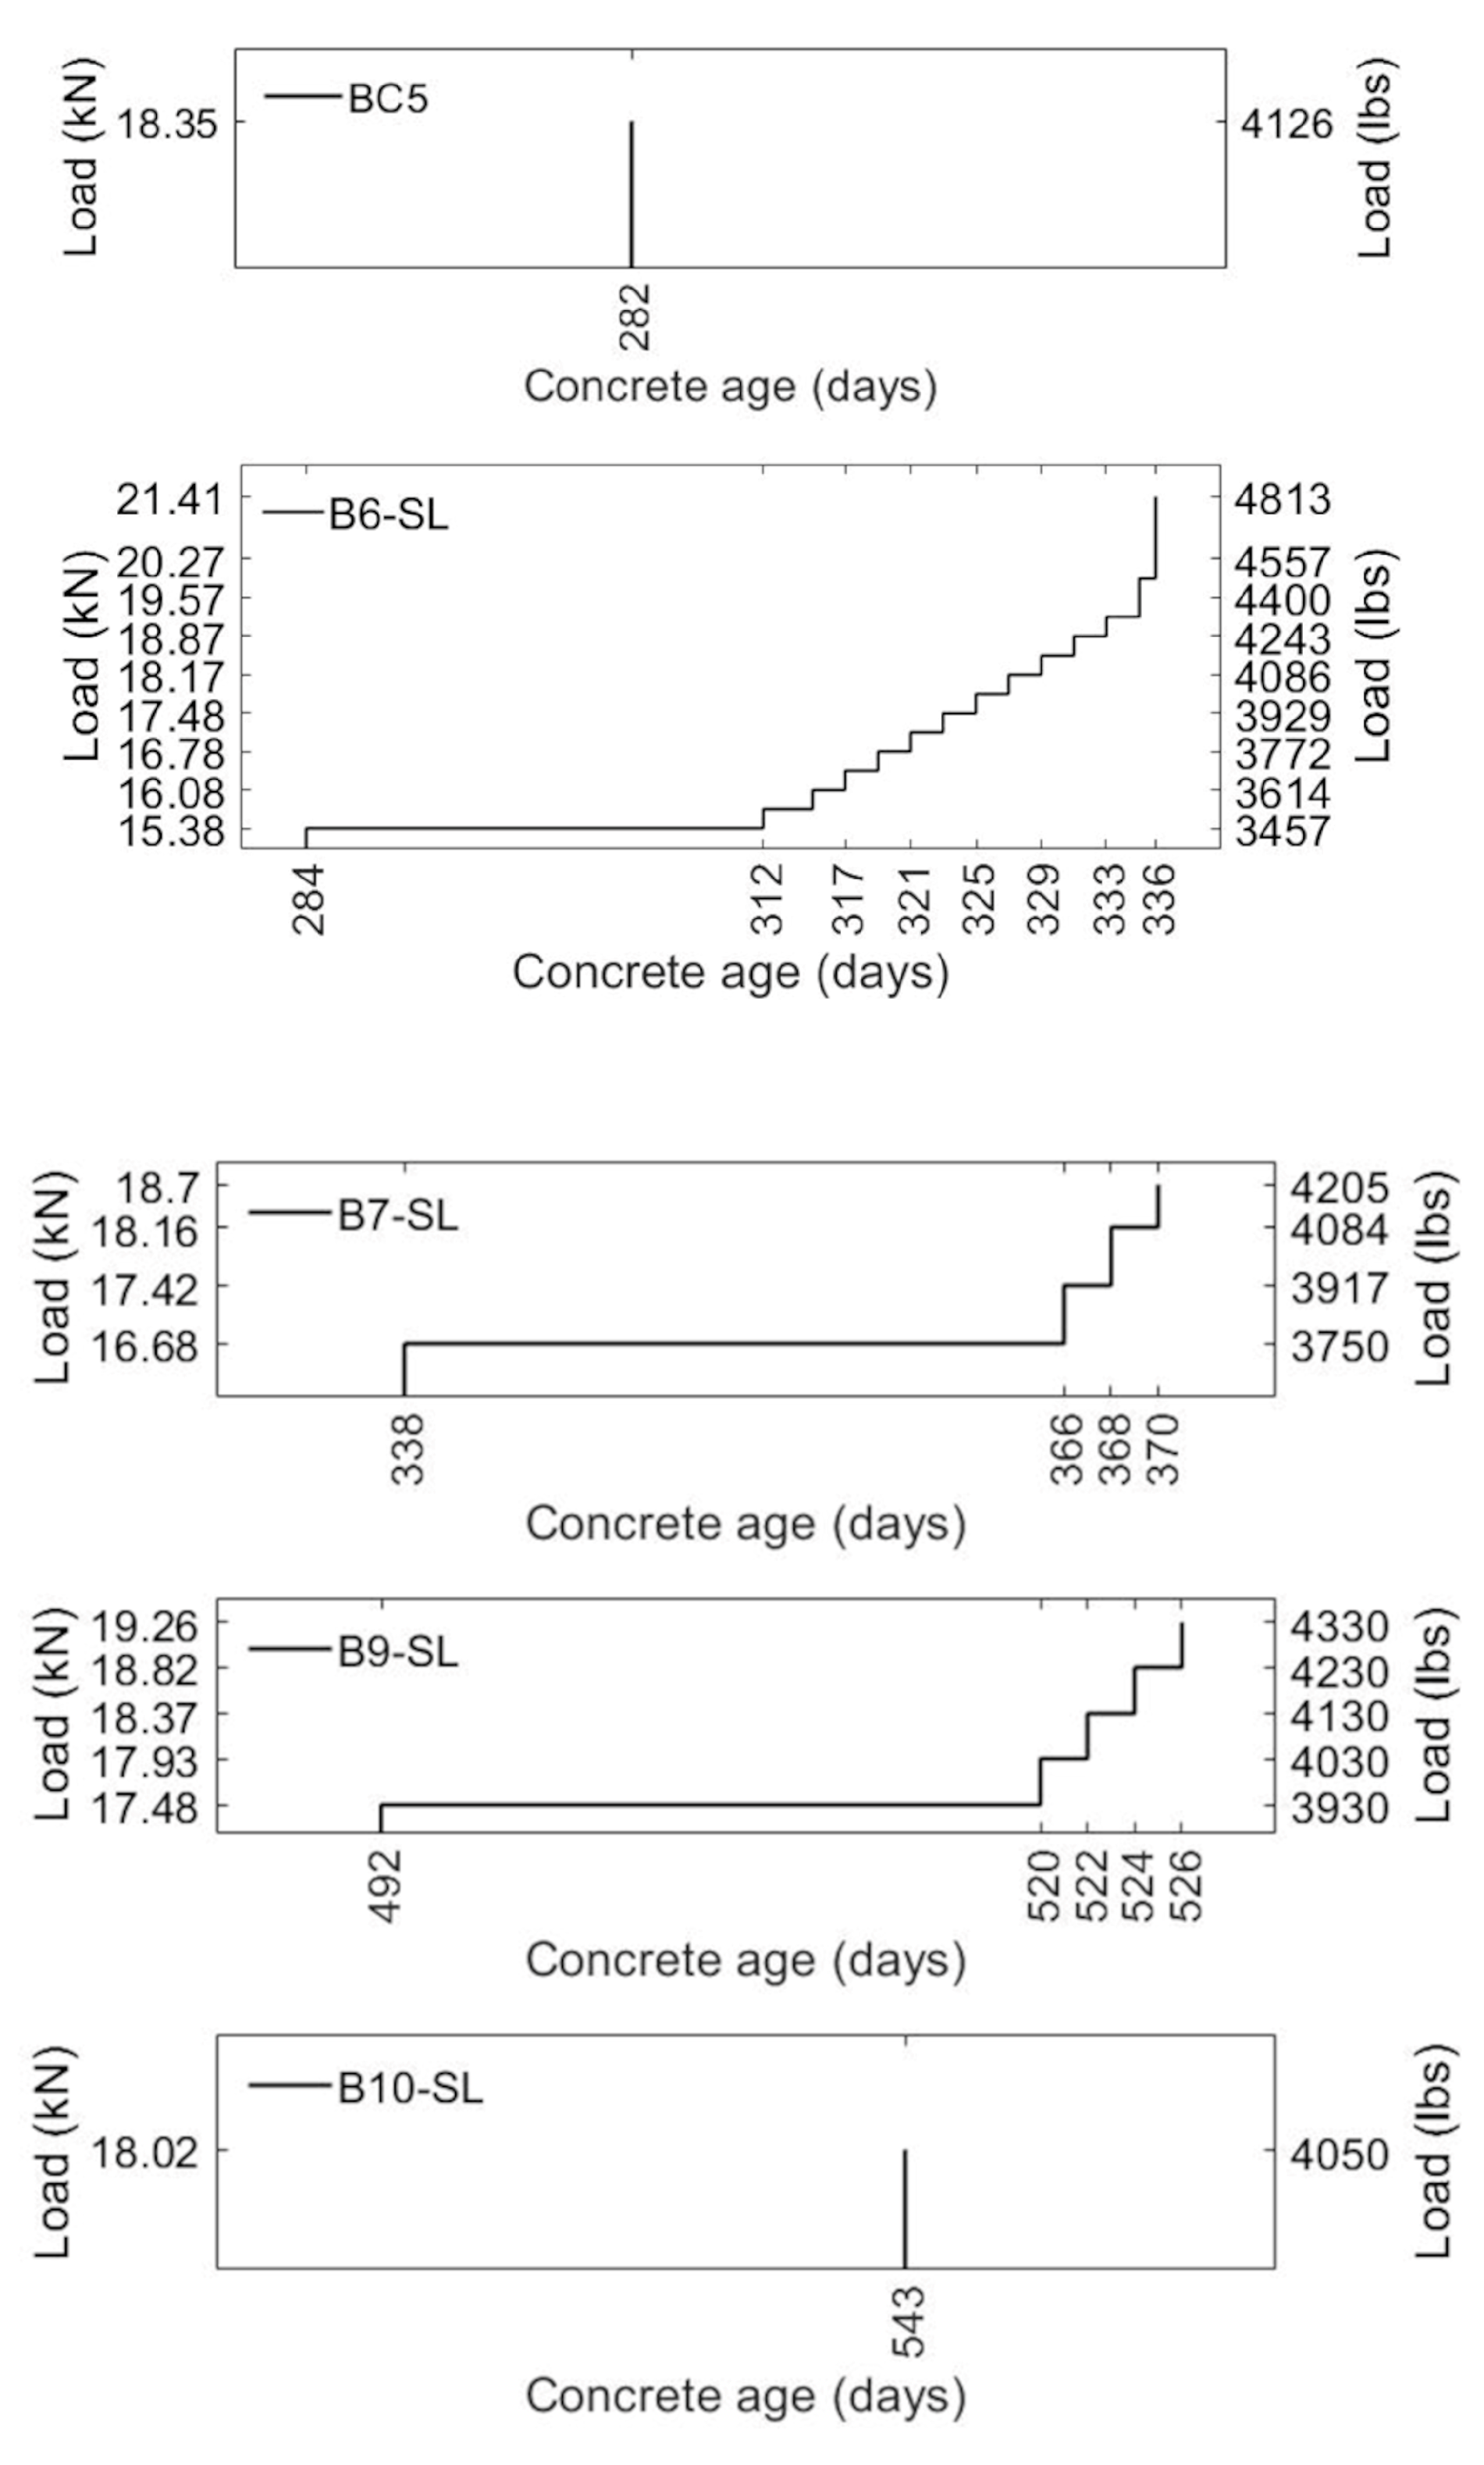
2.5. Testing Procedure
3. Results
4. Discussion
4.1. Deflection under Sustained Loading
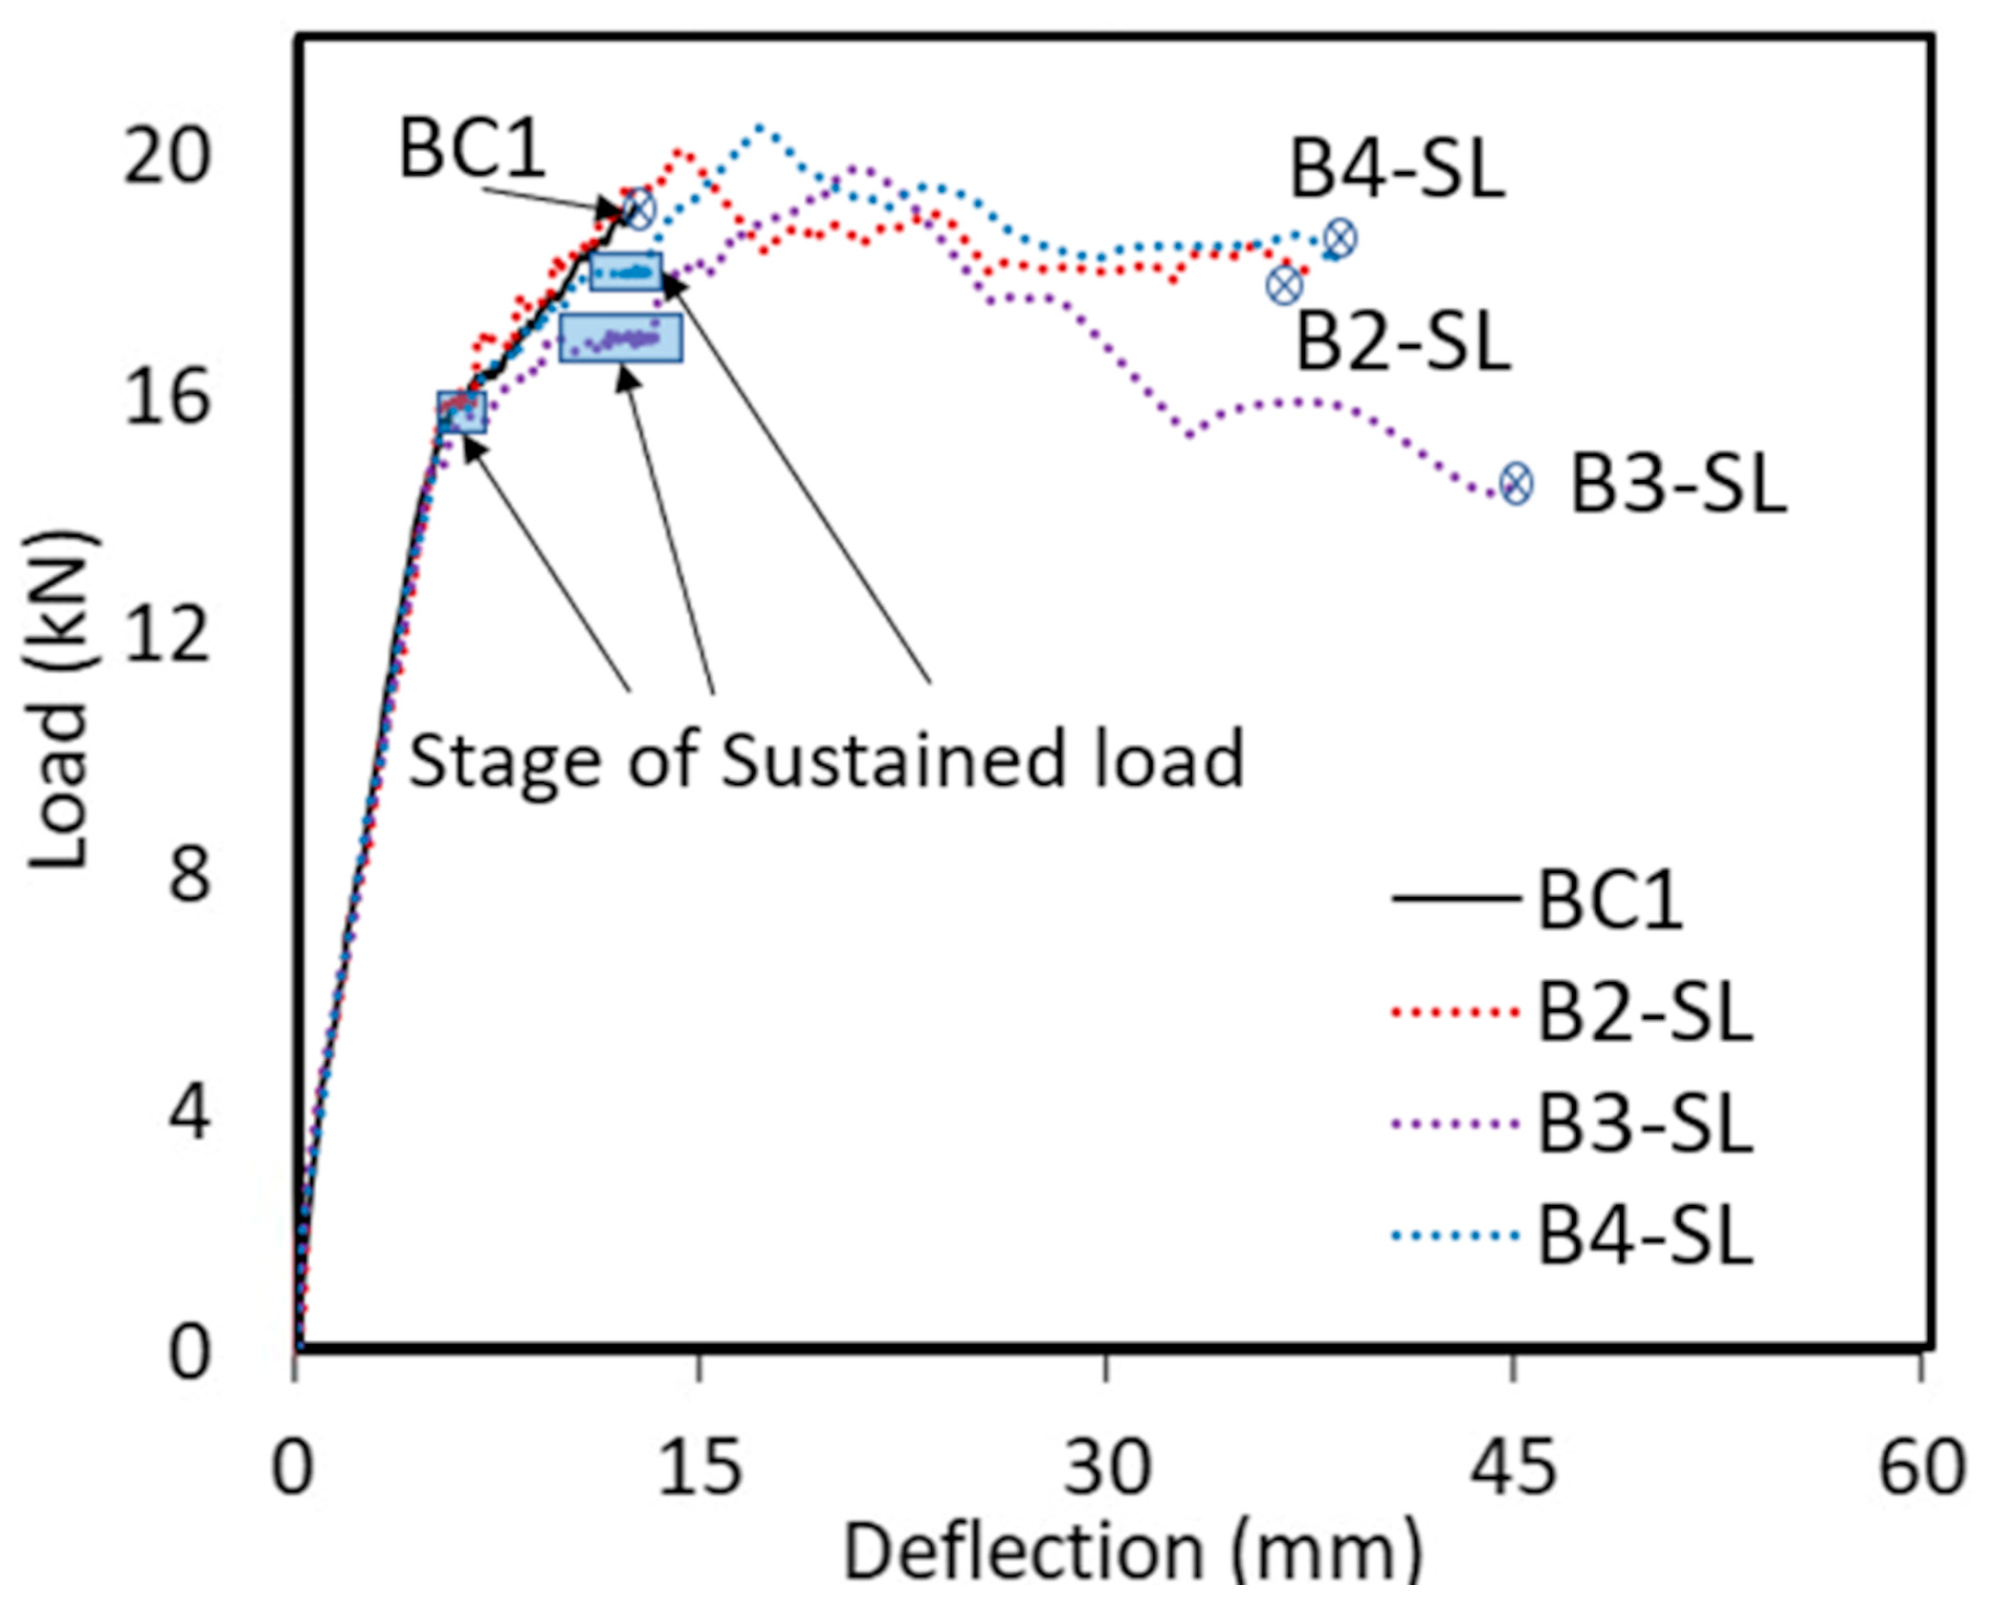
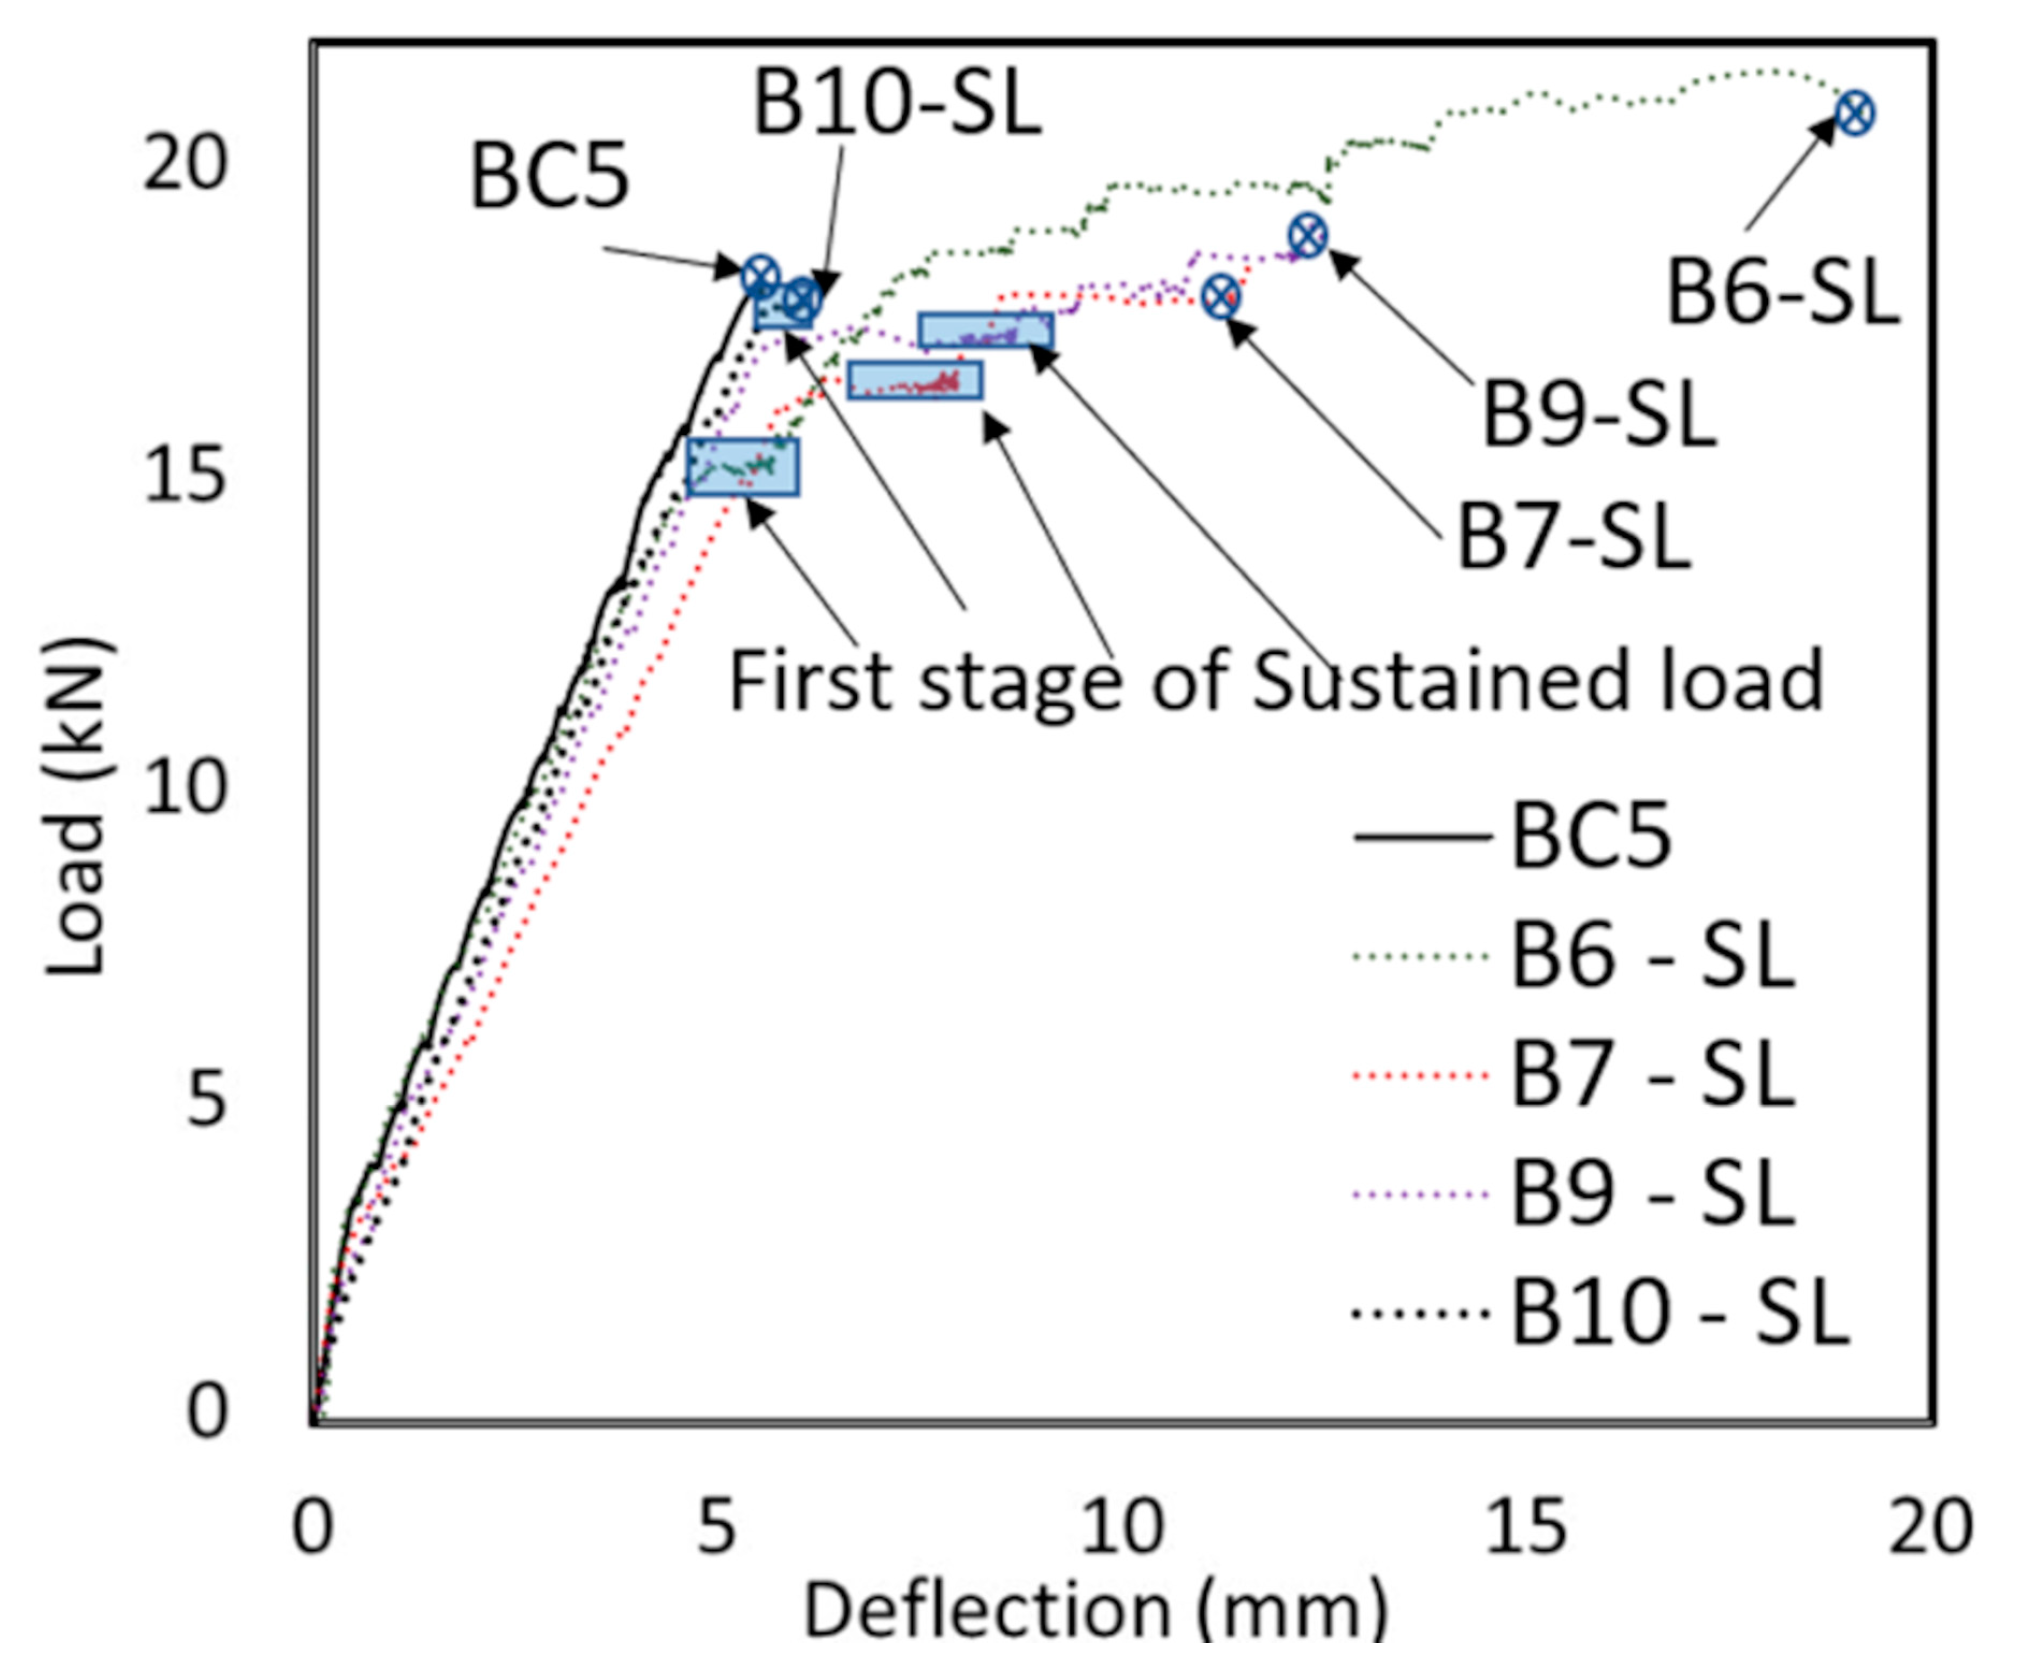
4.2. Peak Load
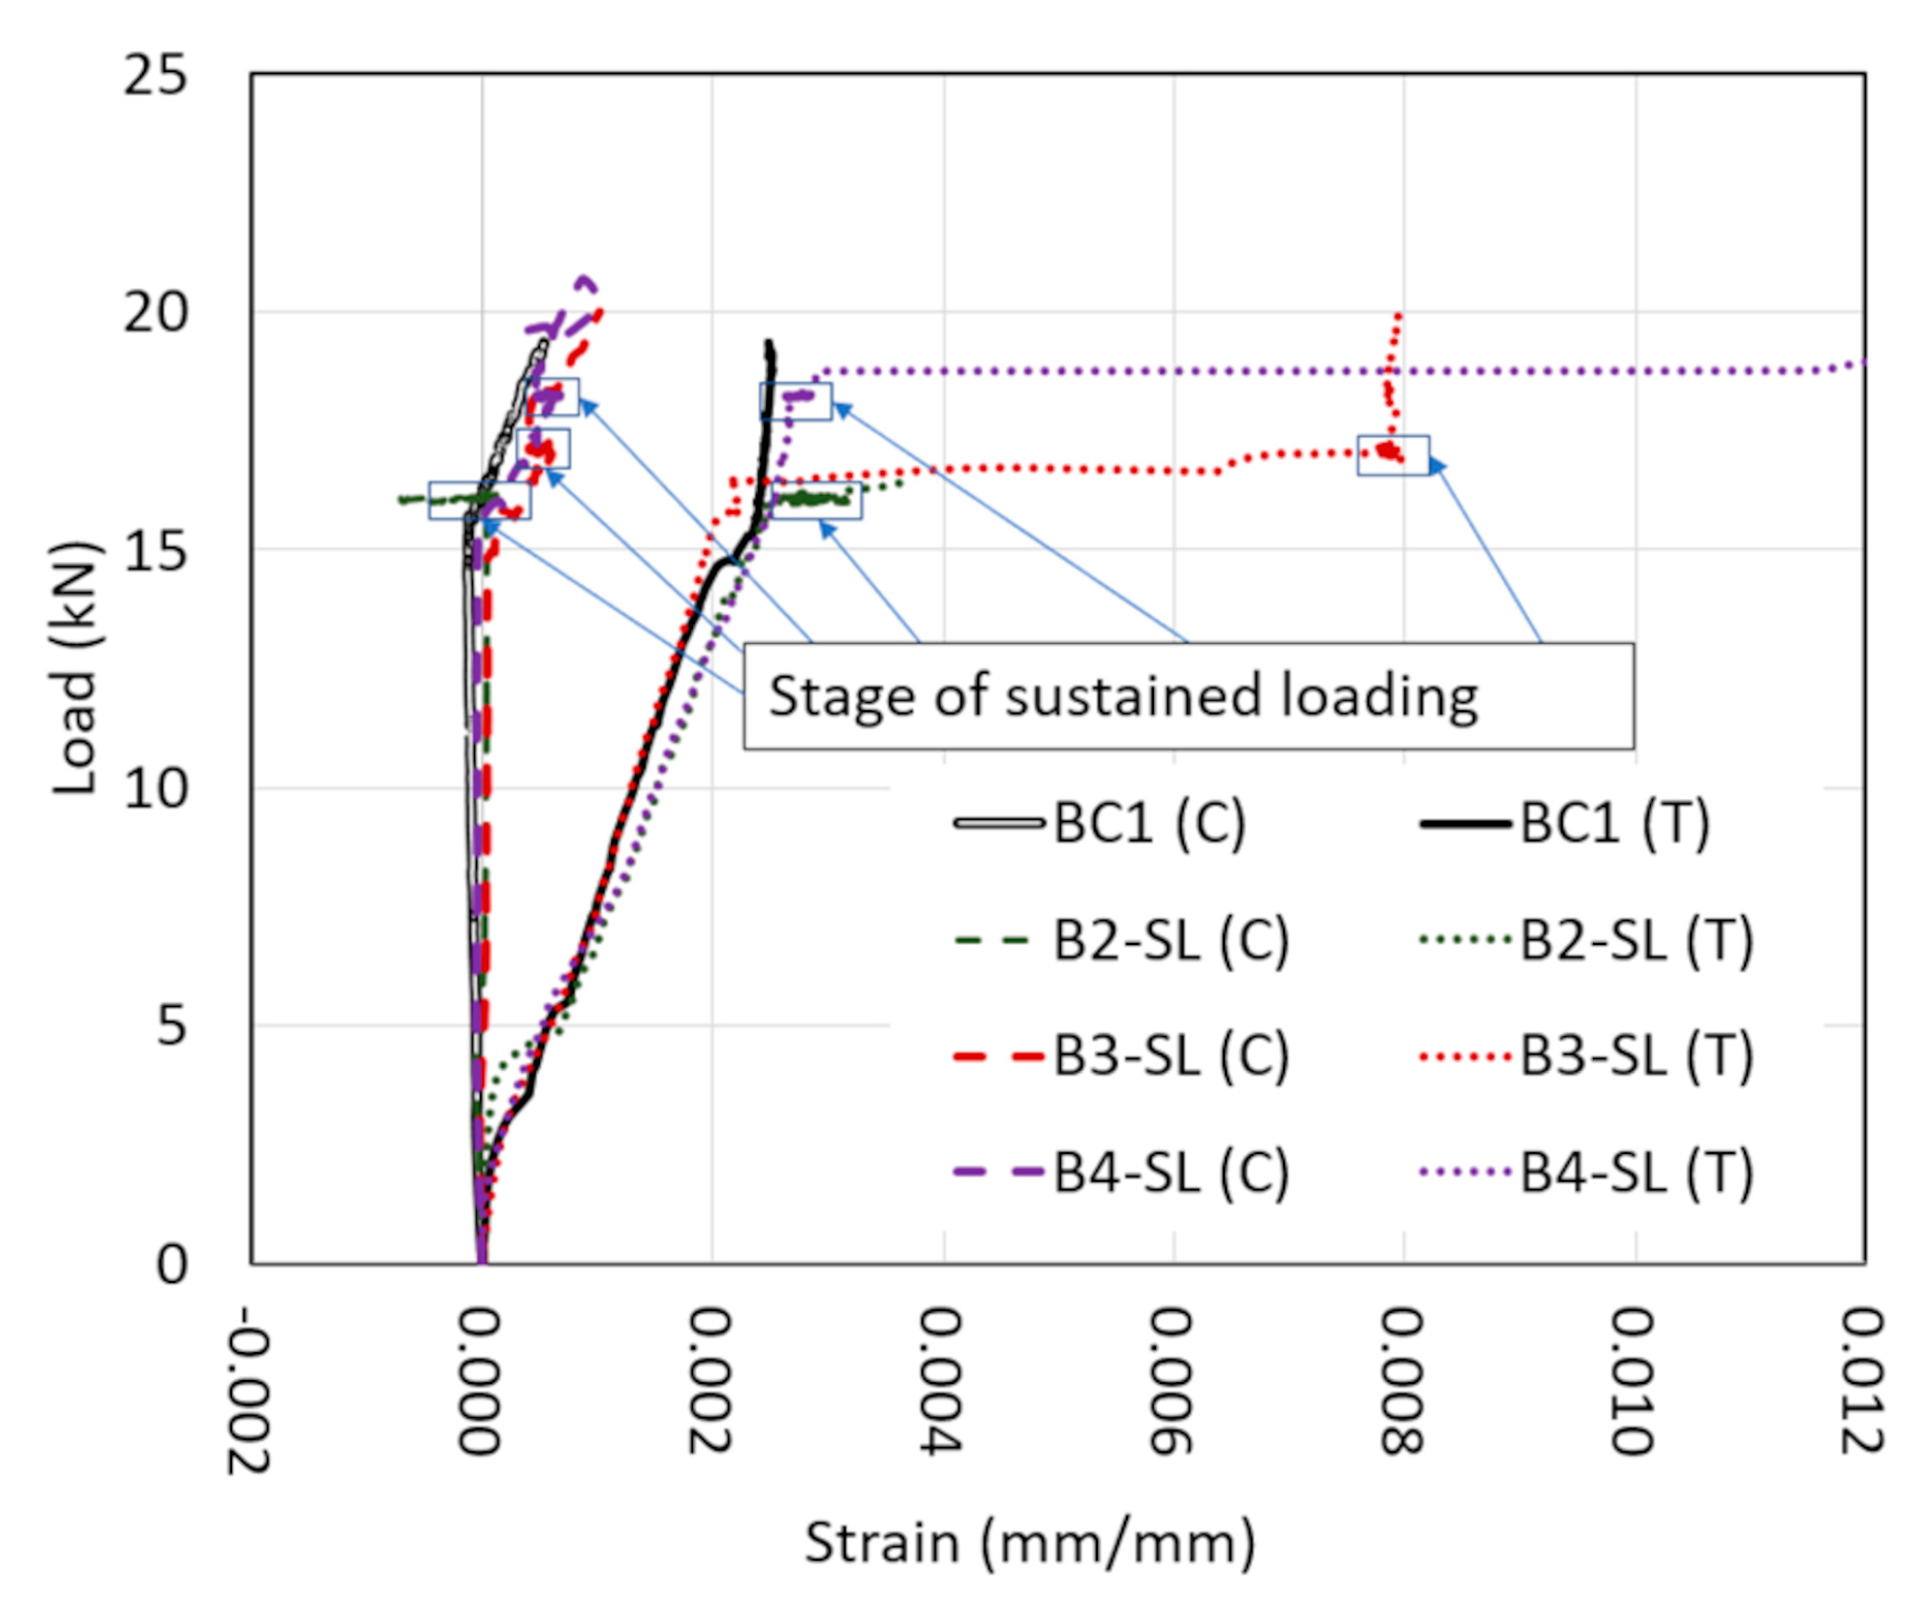
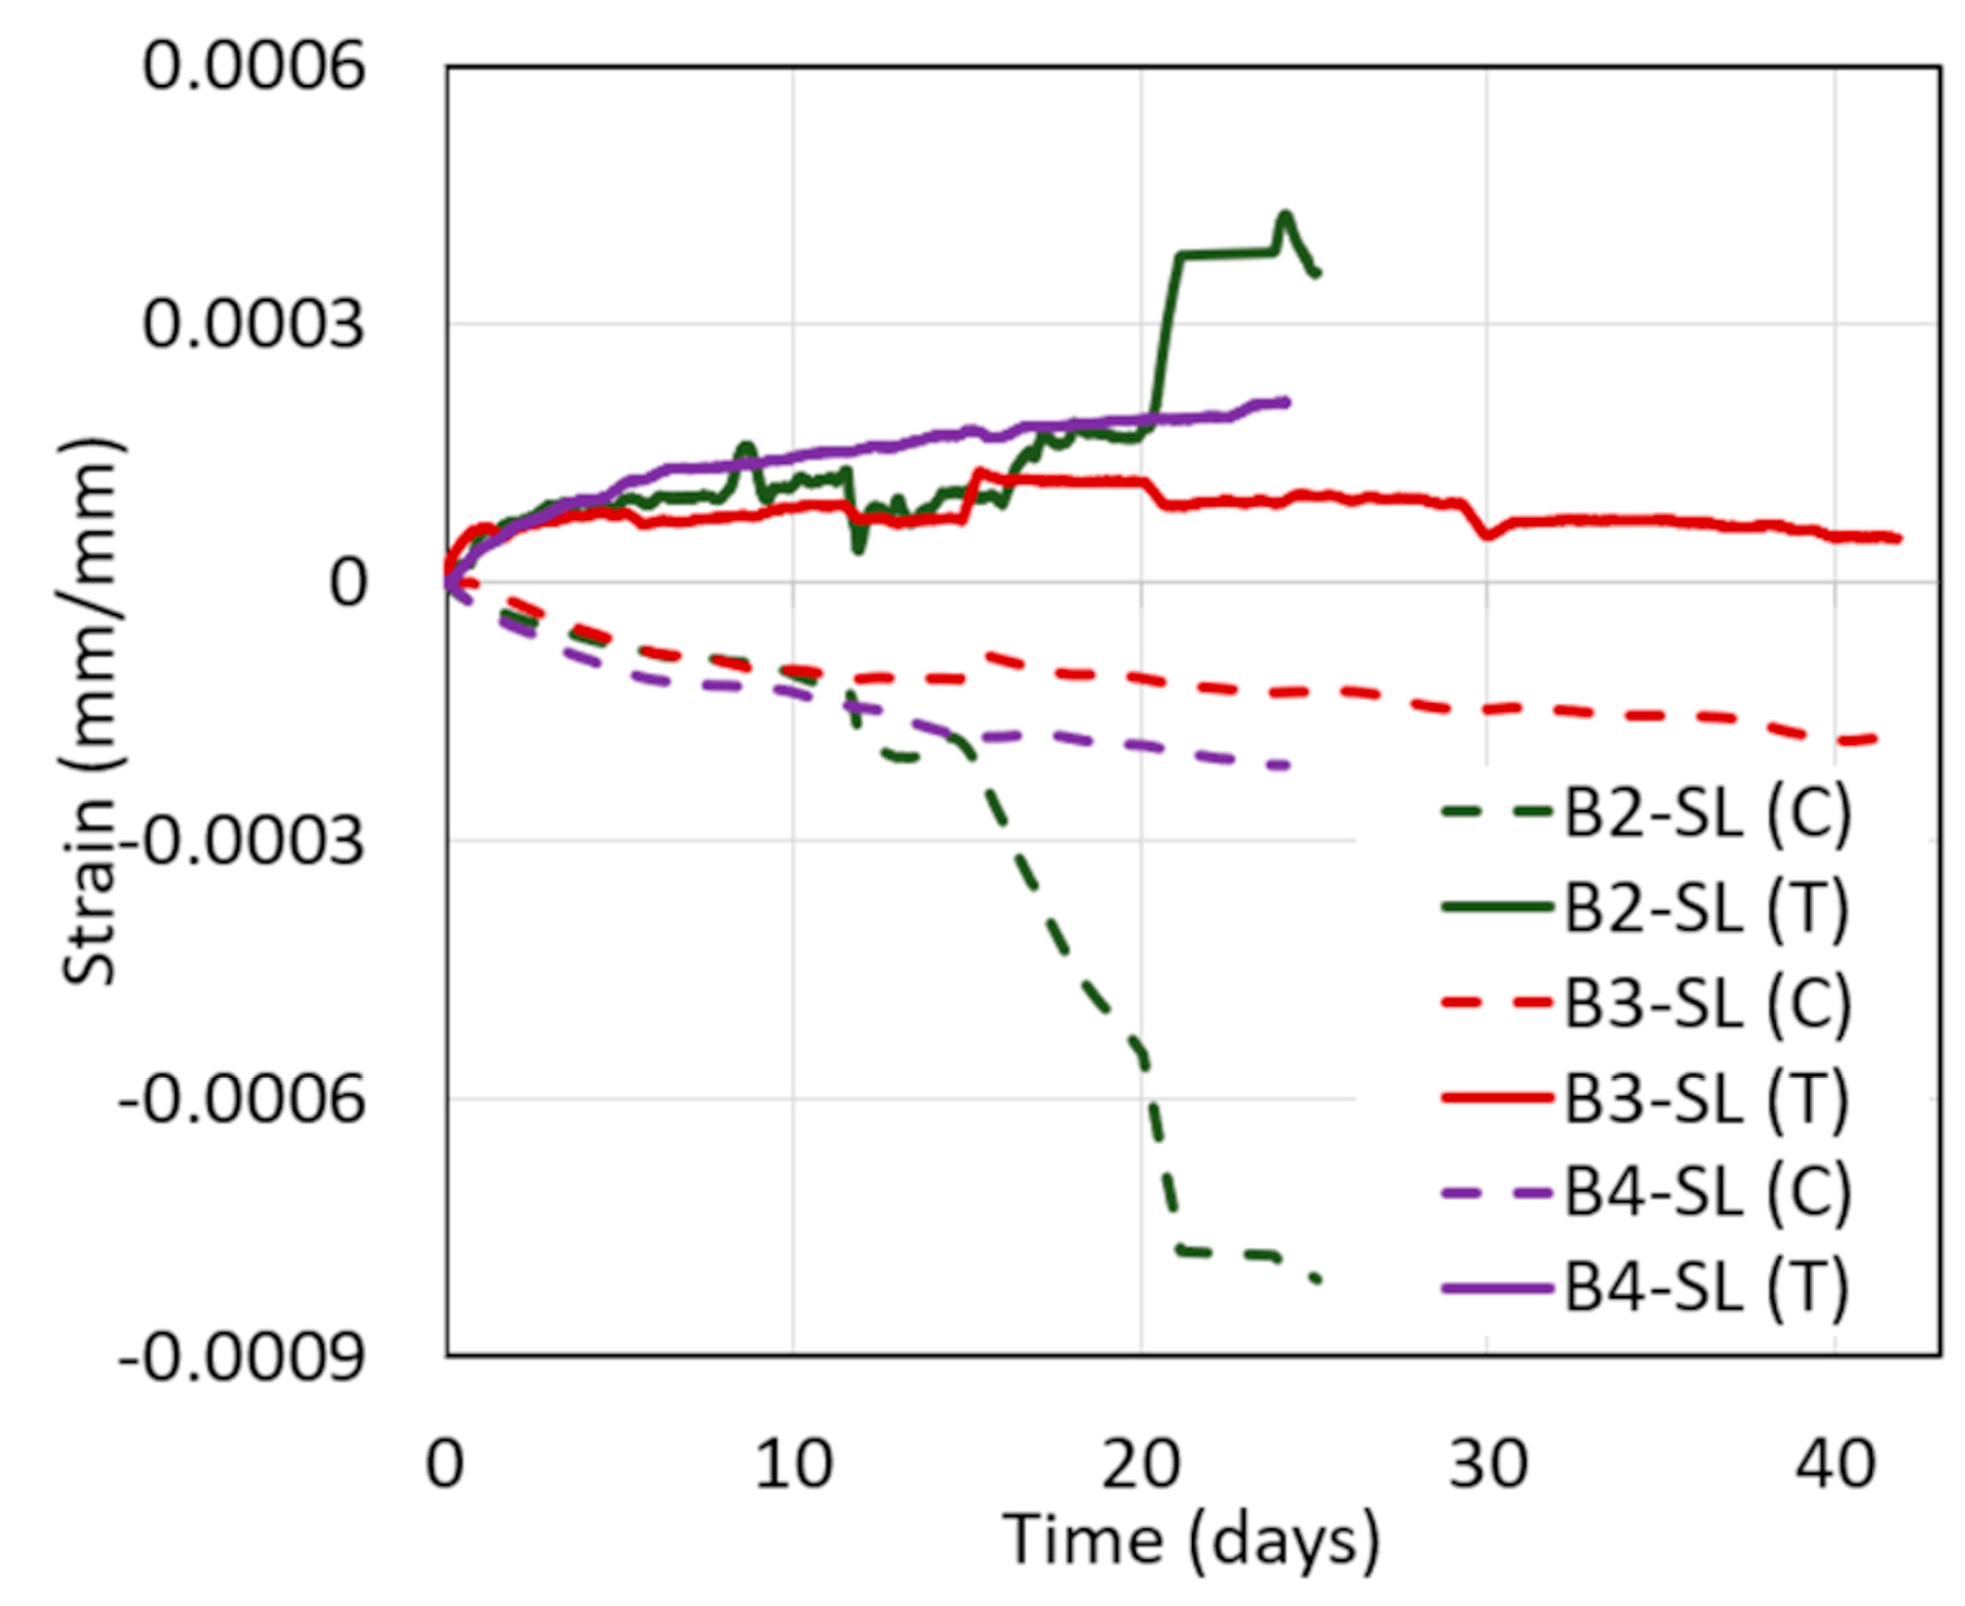
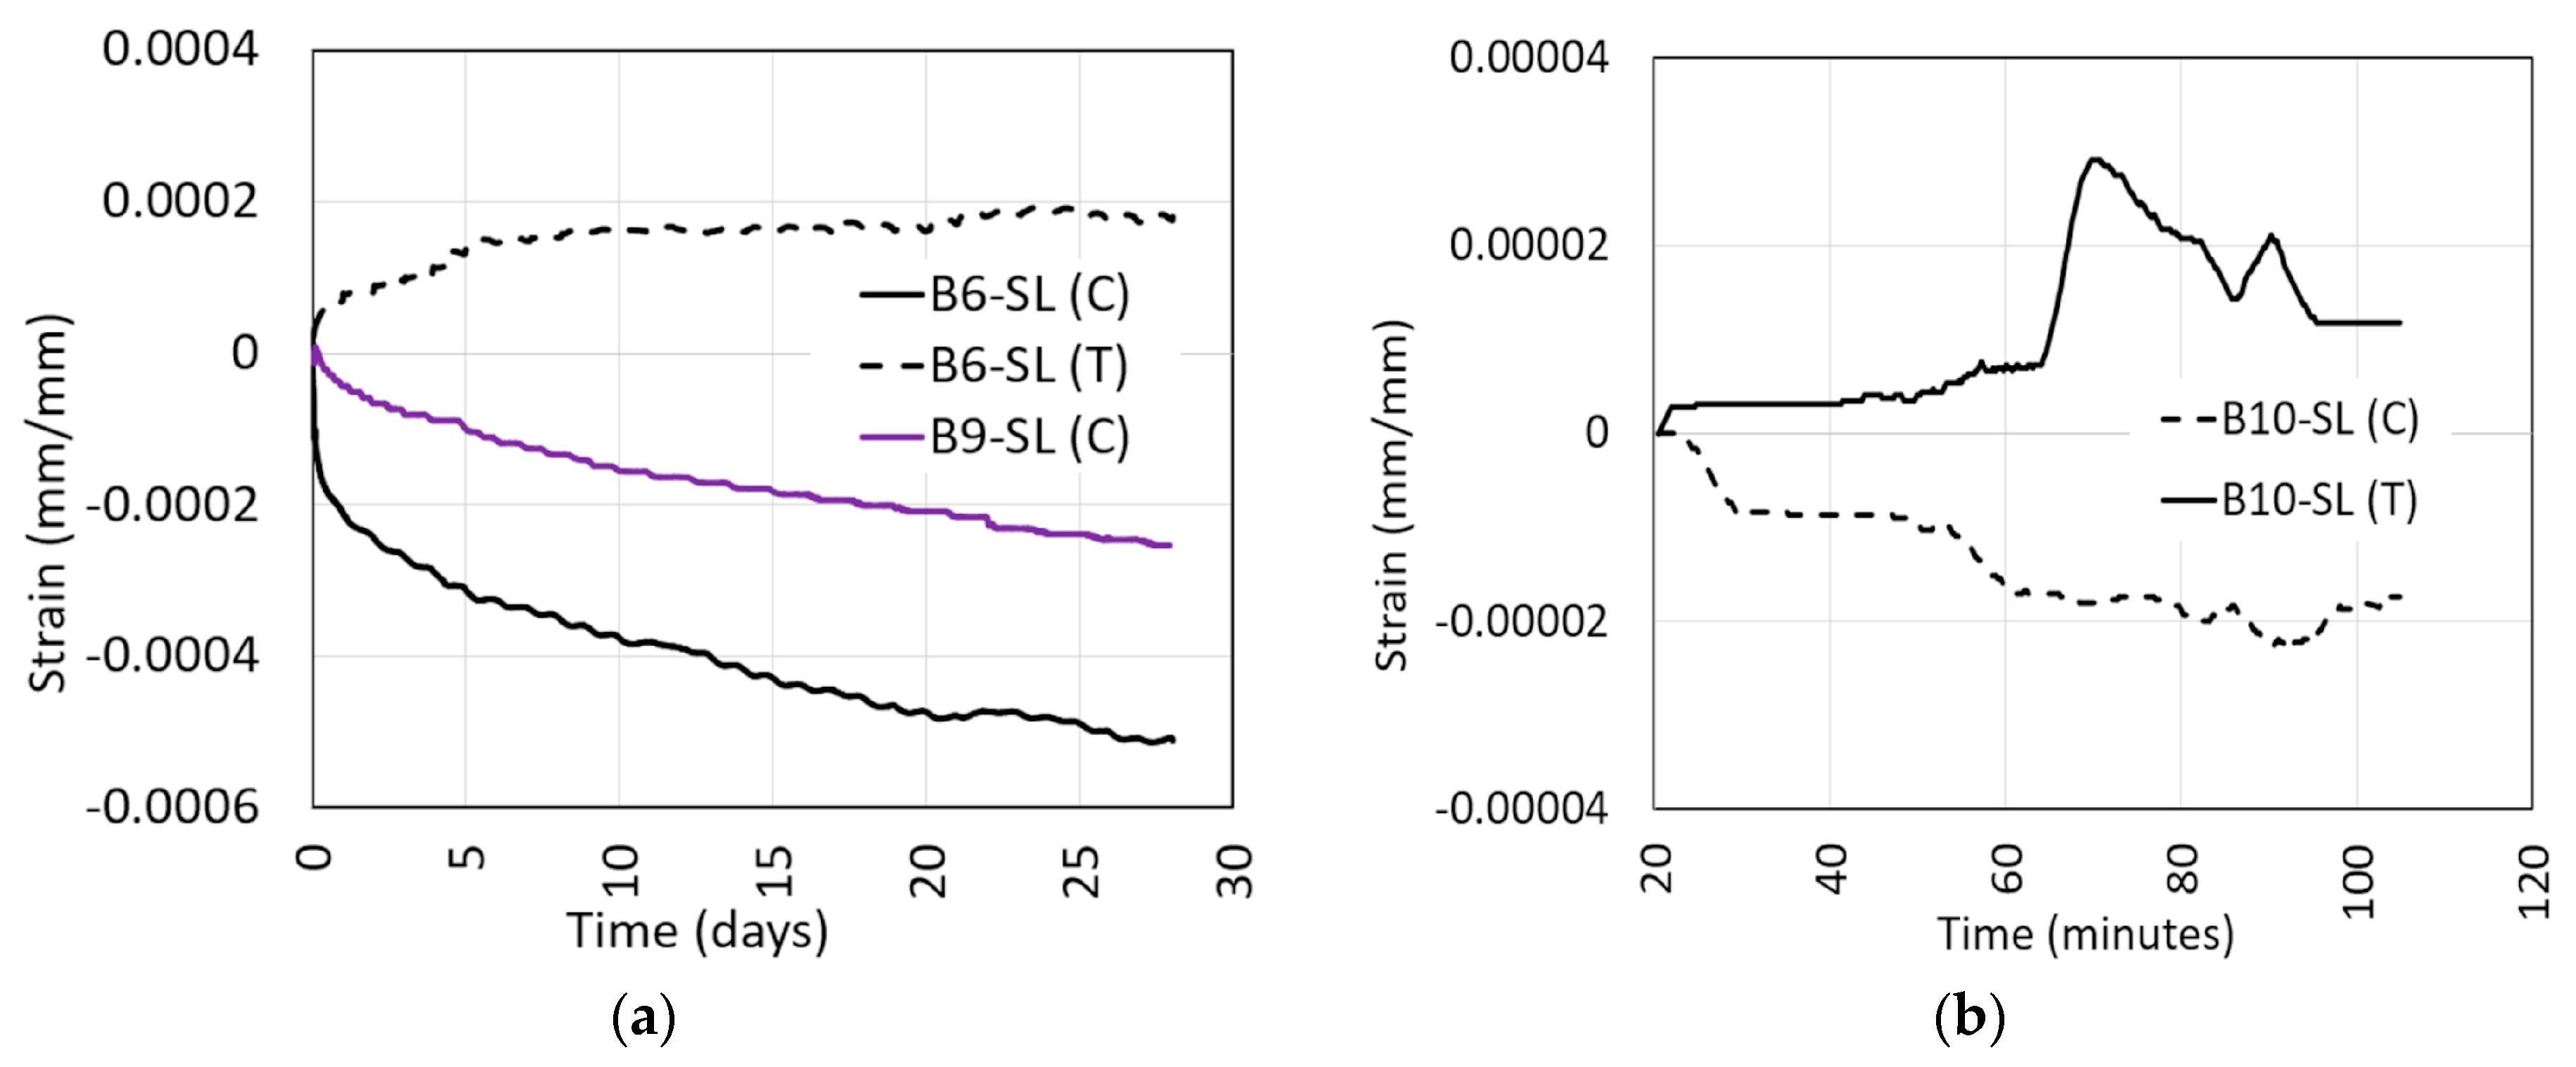
4.3. Strain
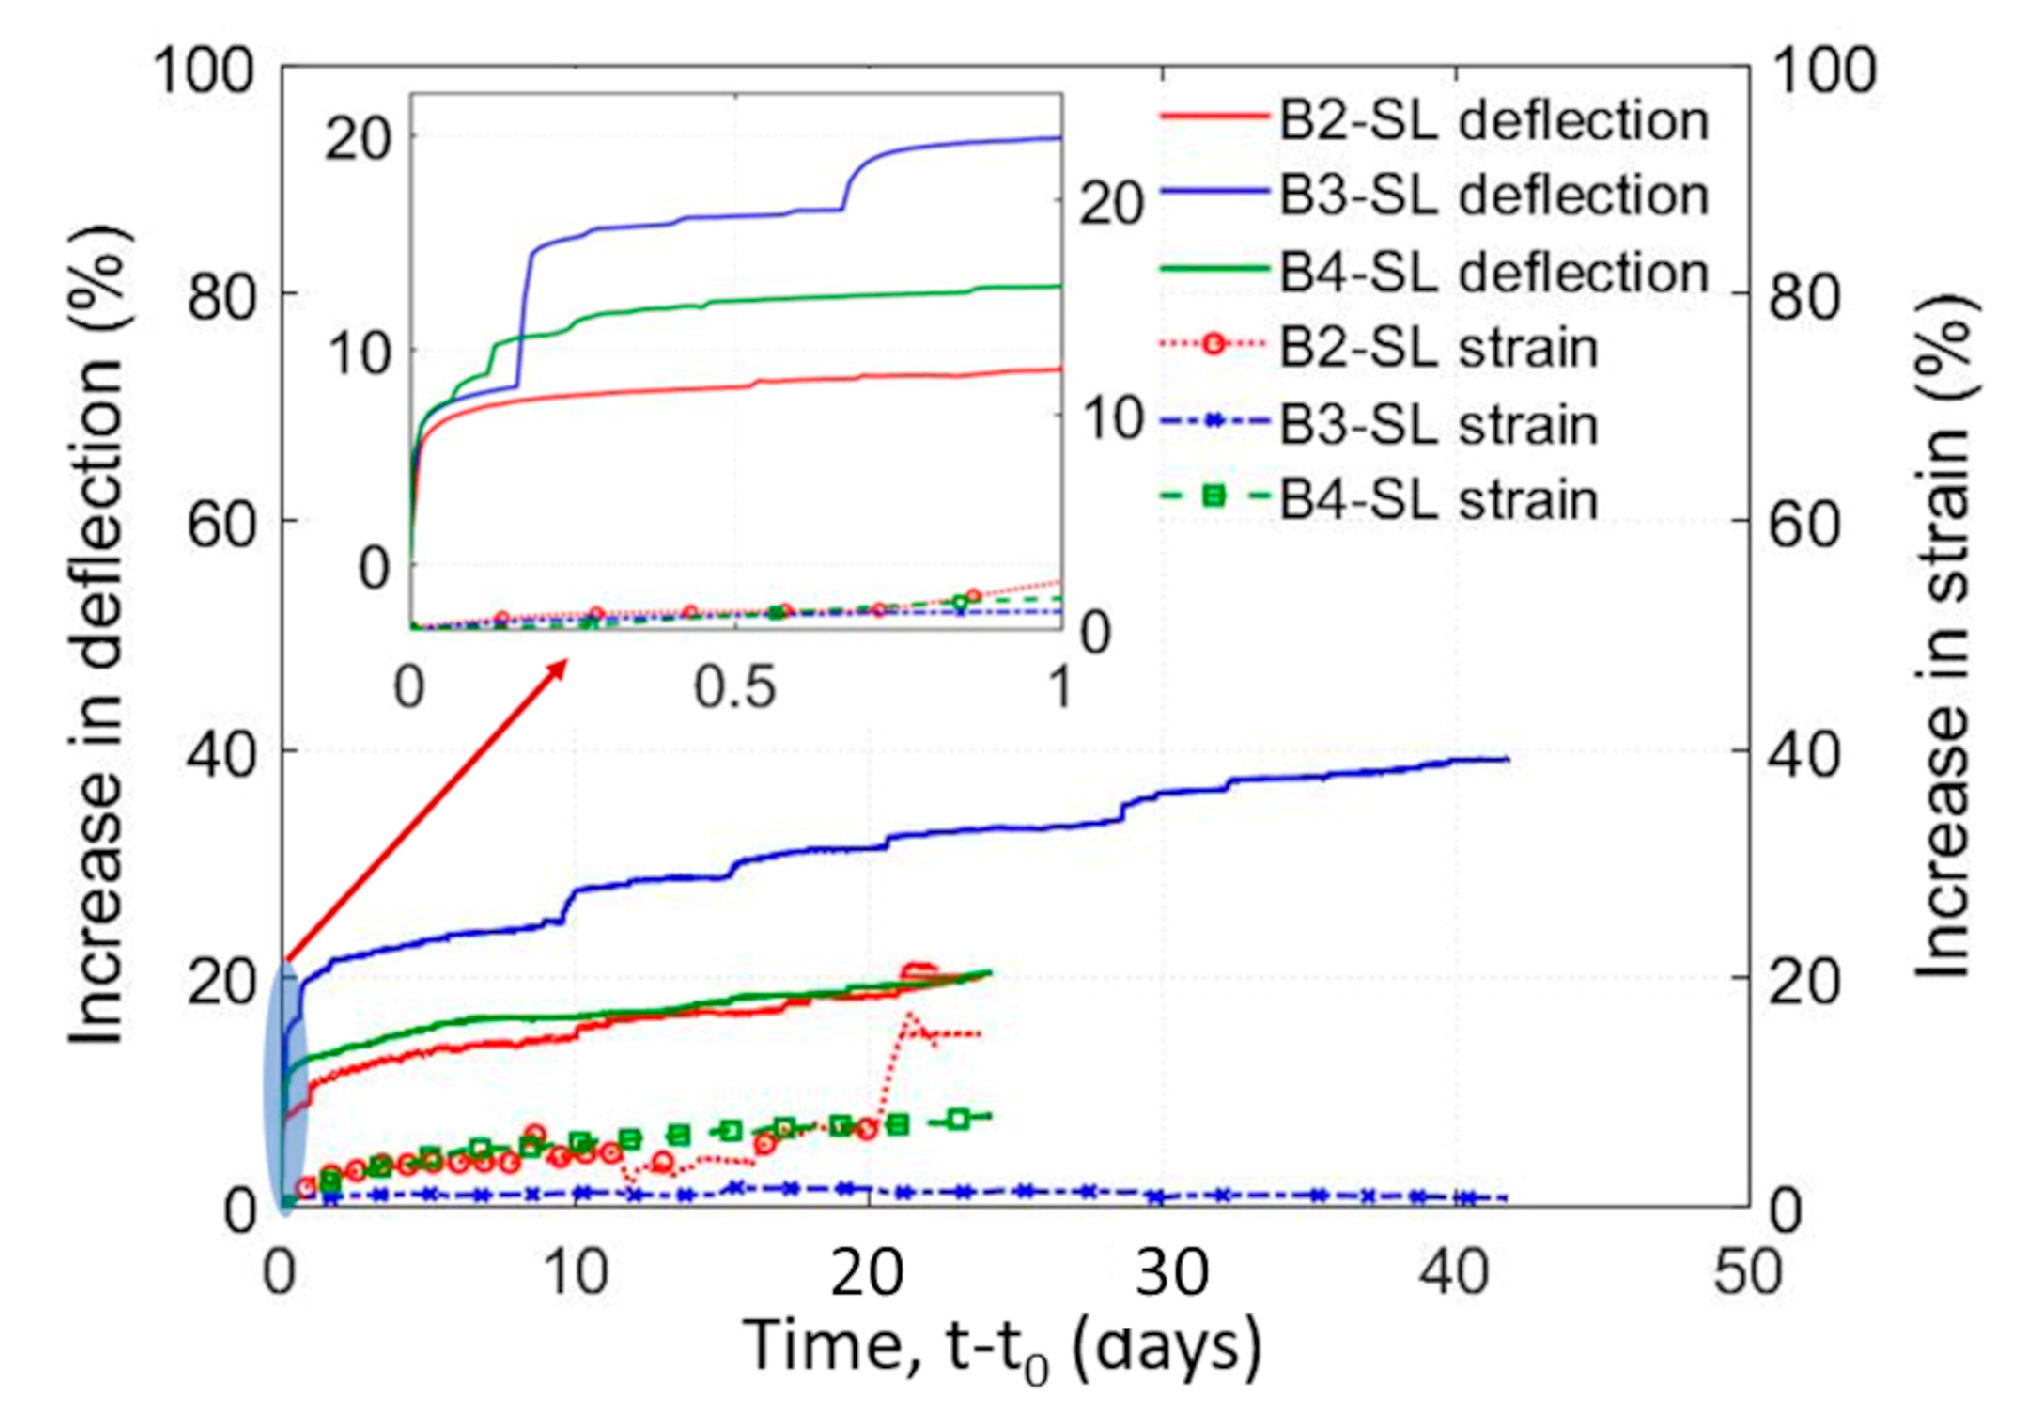
4.4. Deflection vs. Strain
5. Conclusions
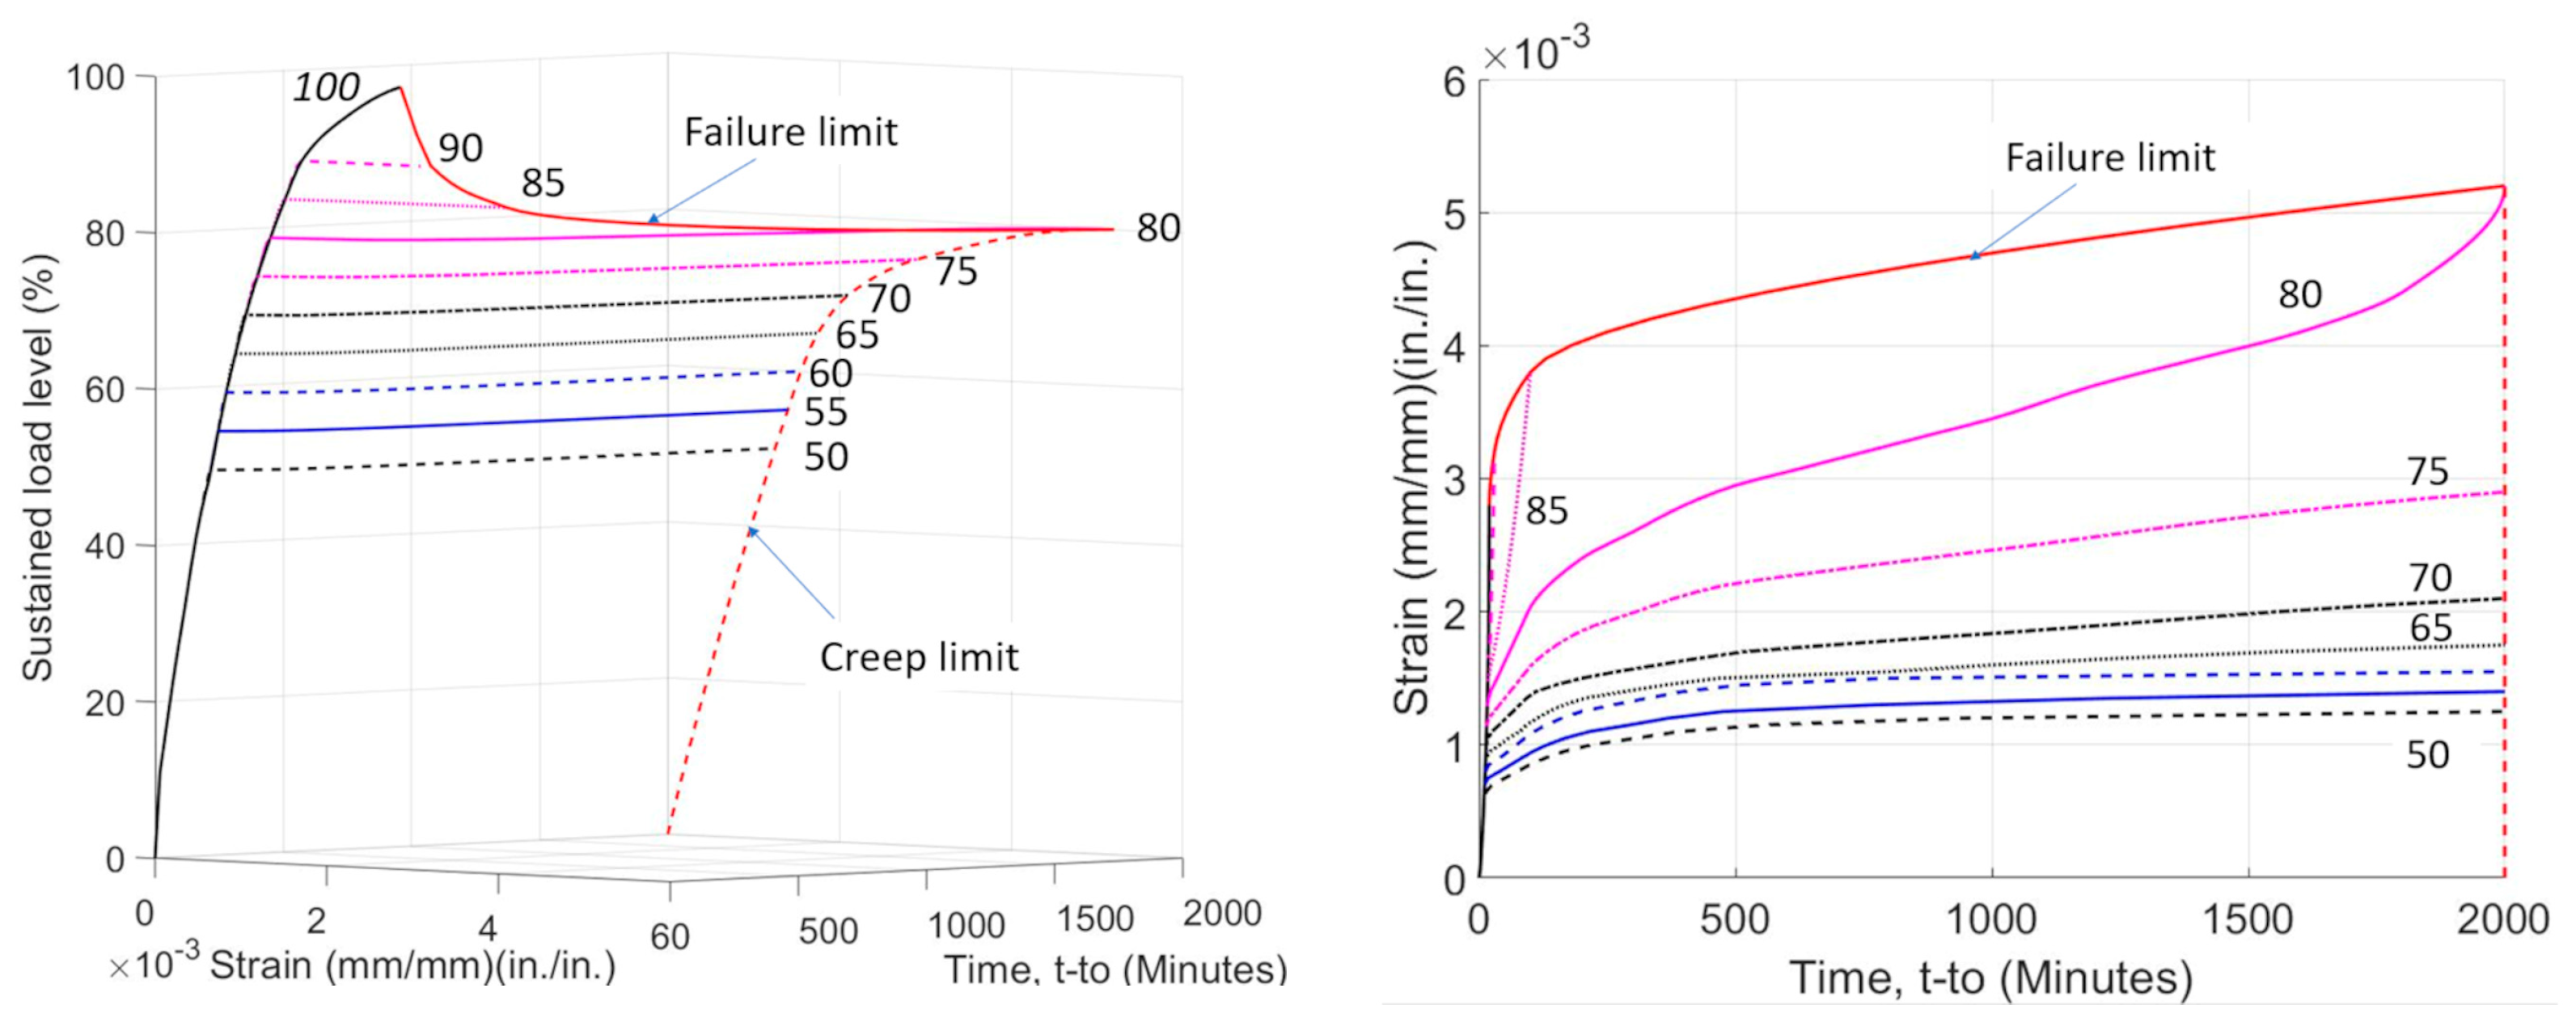
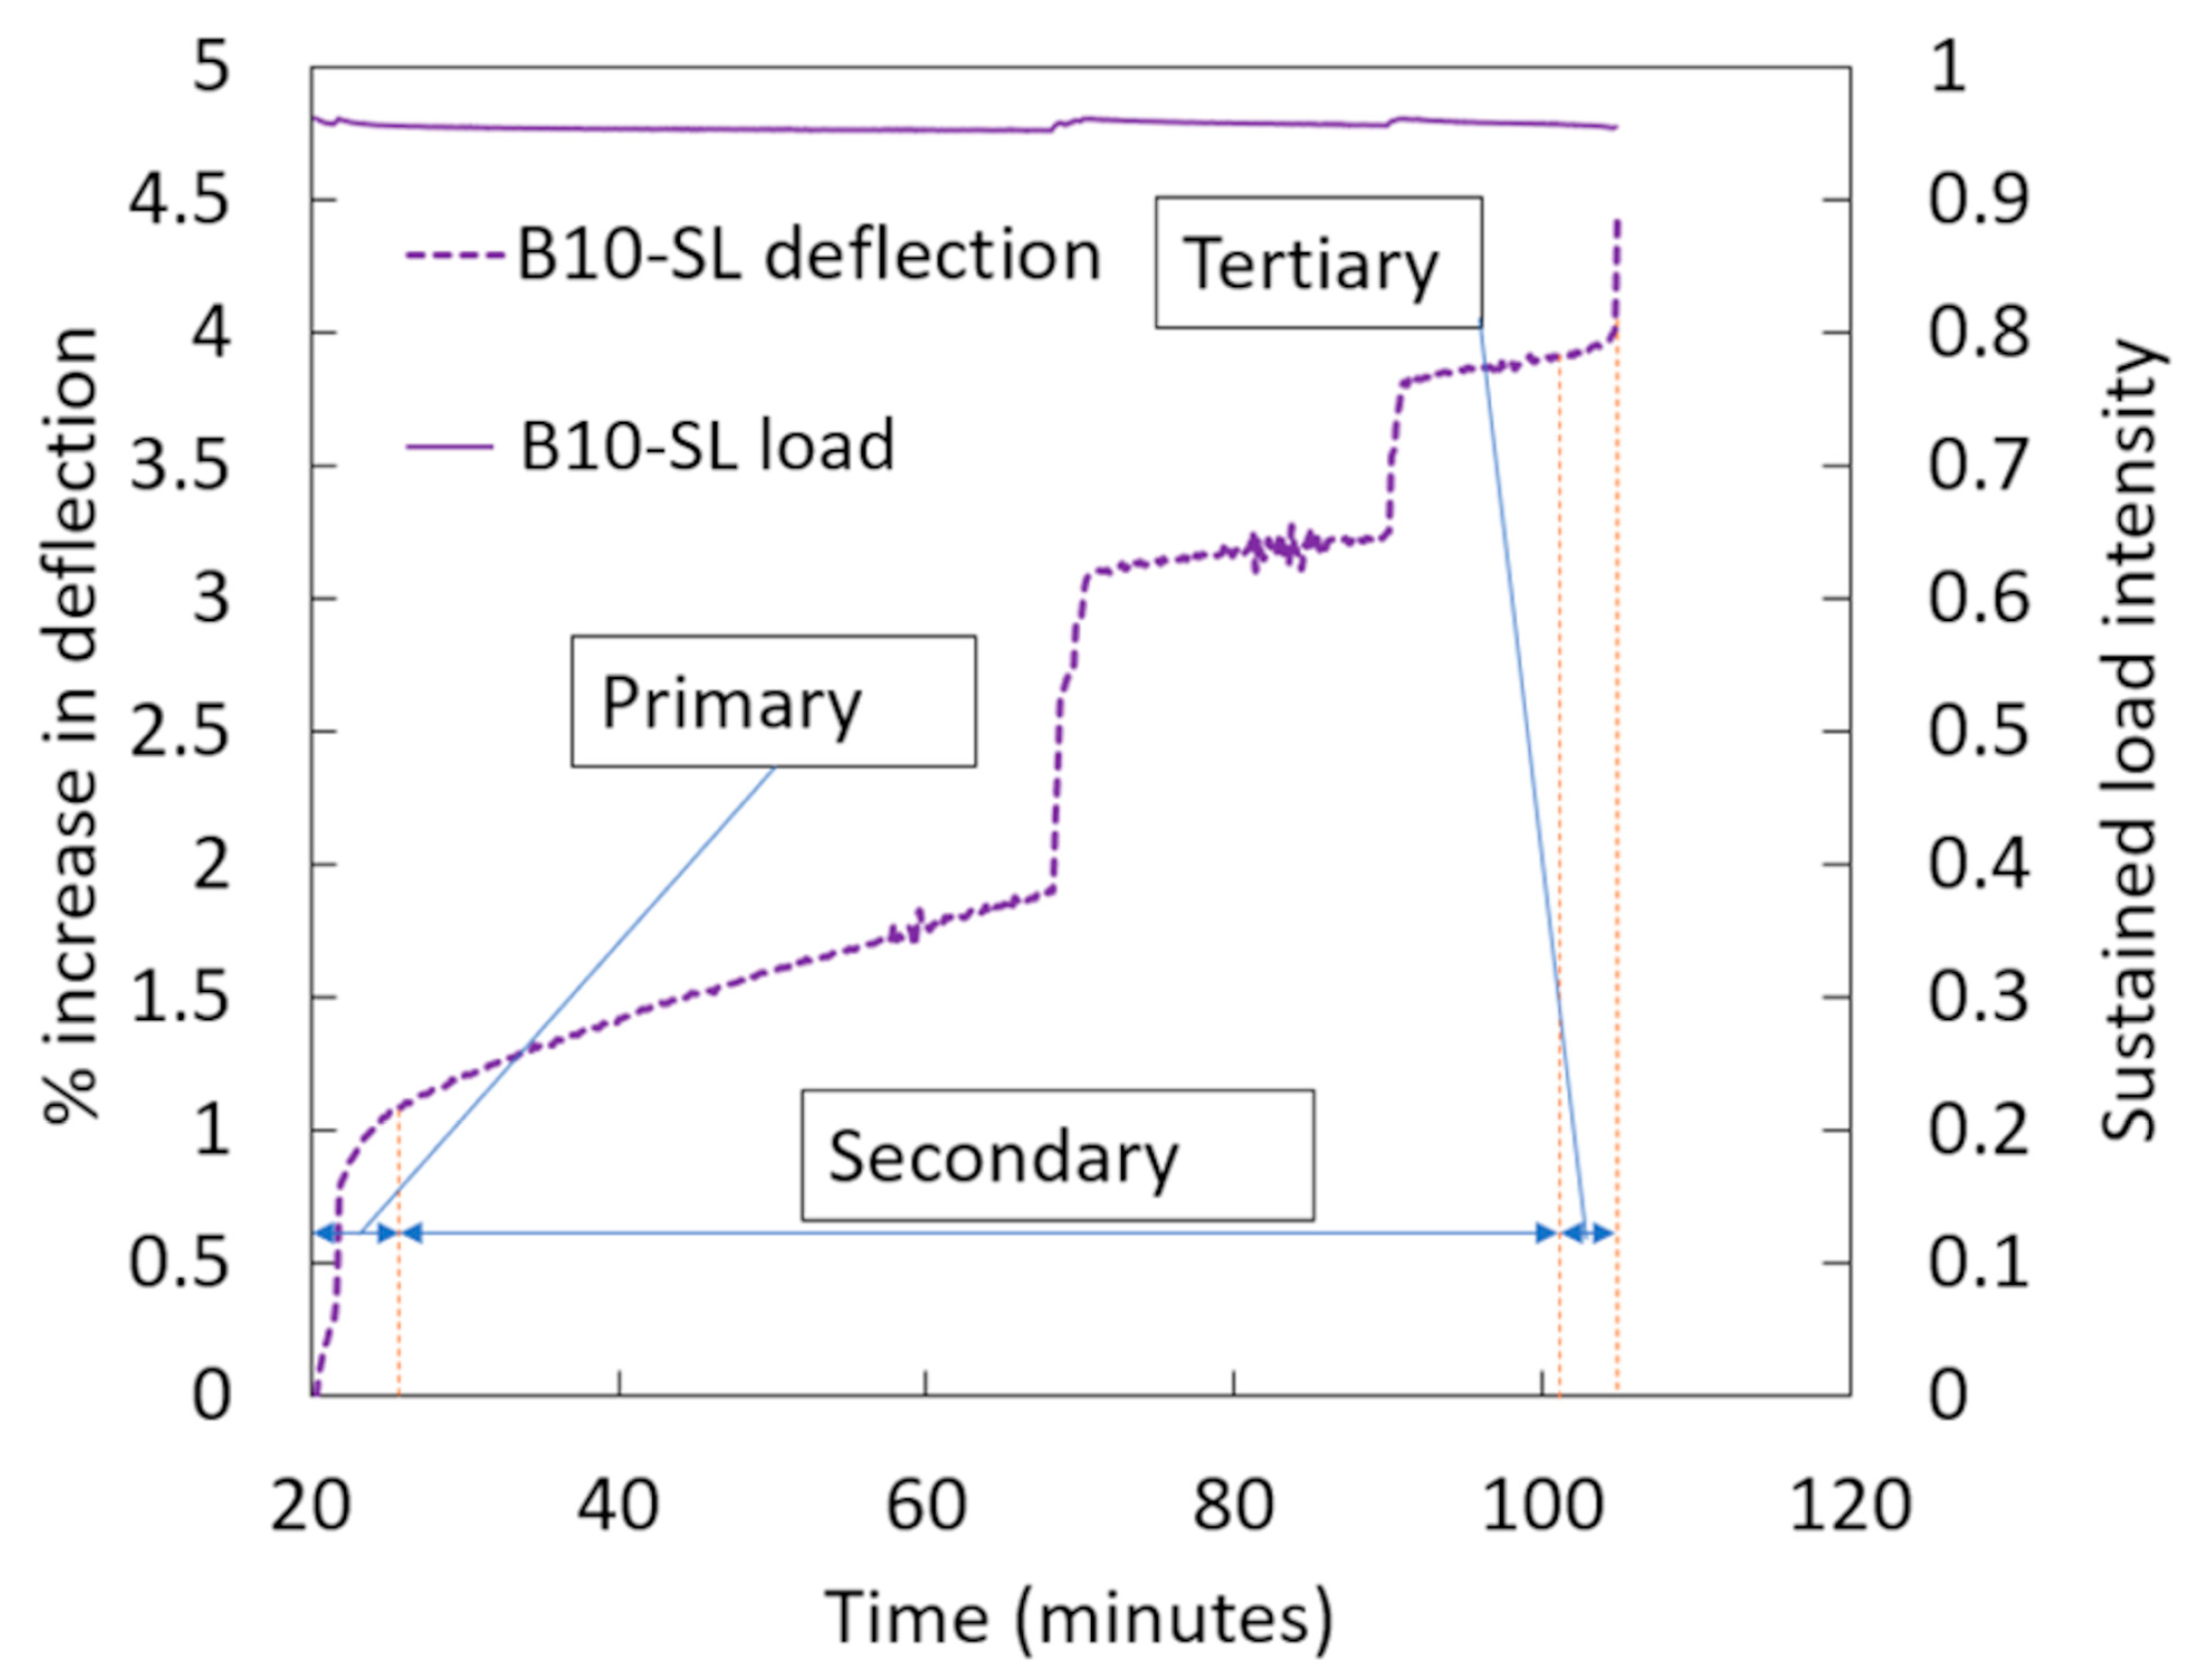
- Even if plain concrete can experience tertiary creep and eventual failure under load levels near 75–80% of its compressive strength, the sustained load level for RC beams to cause failure is very close to their short-term capacity. Only one beam (B10-SL) failed under sustained load at a load level of 98%. Another beam (B9-SL) was able to carry a load level of 95% for 30 days without failure.
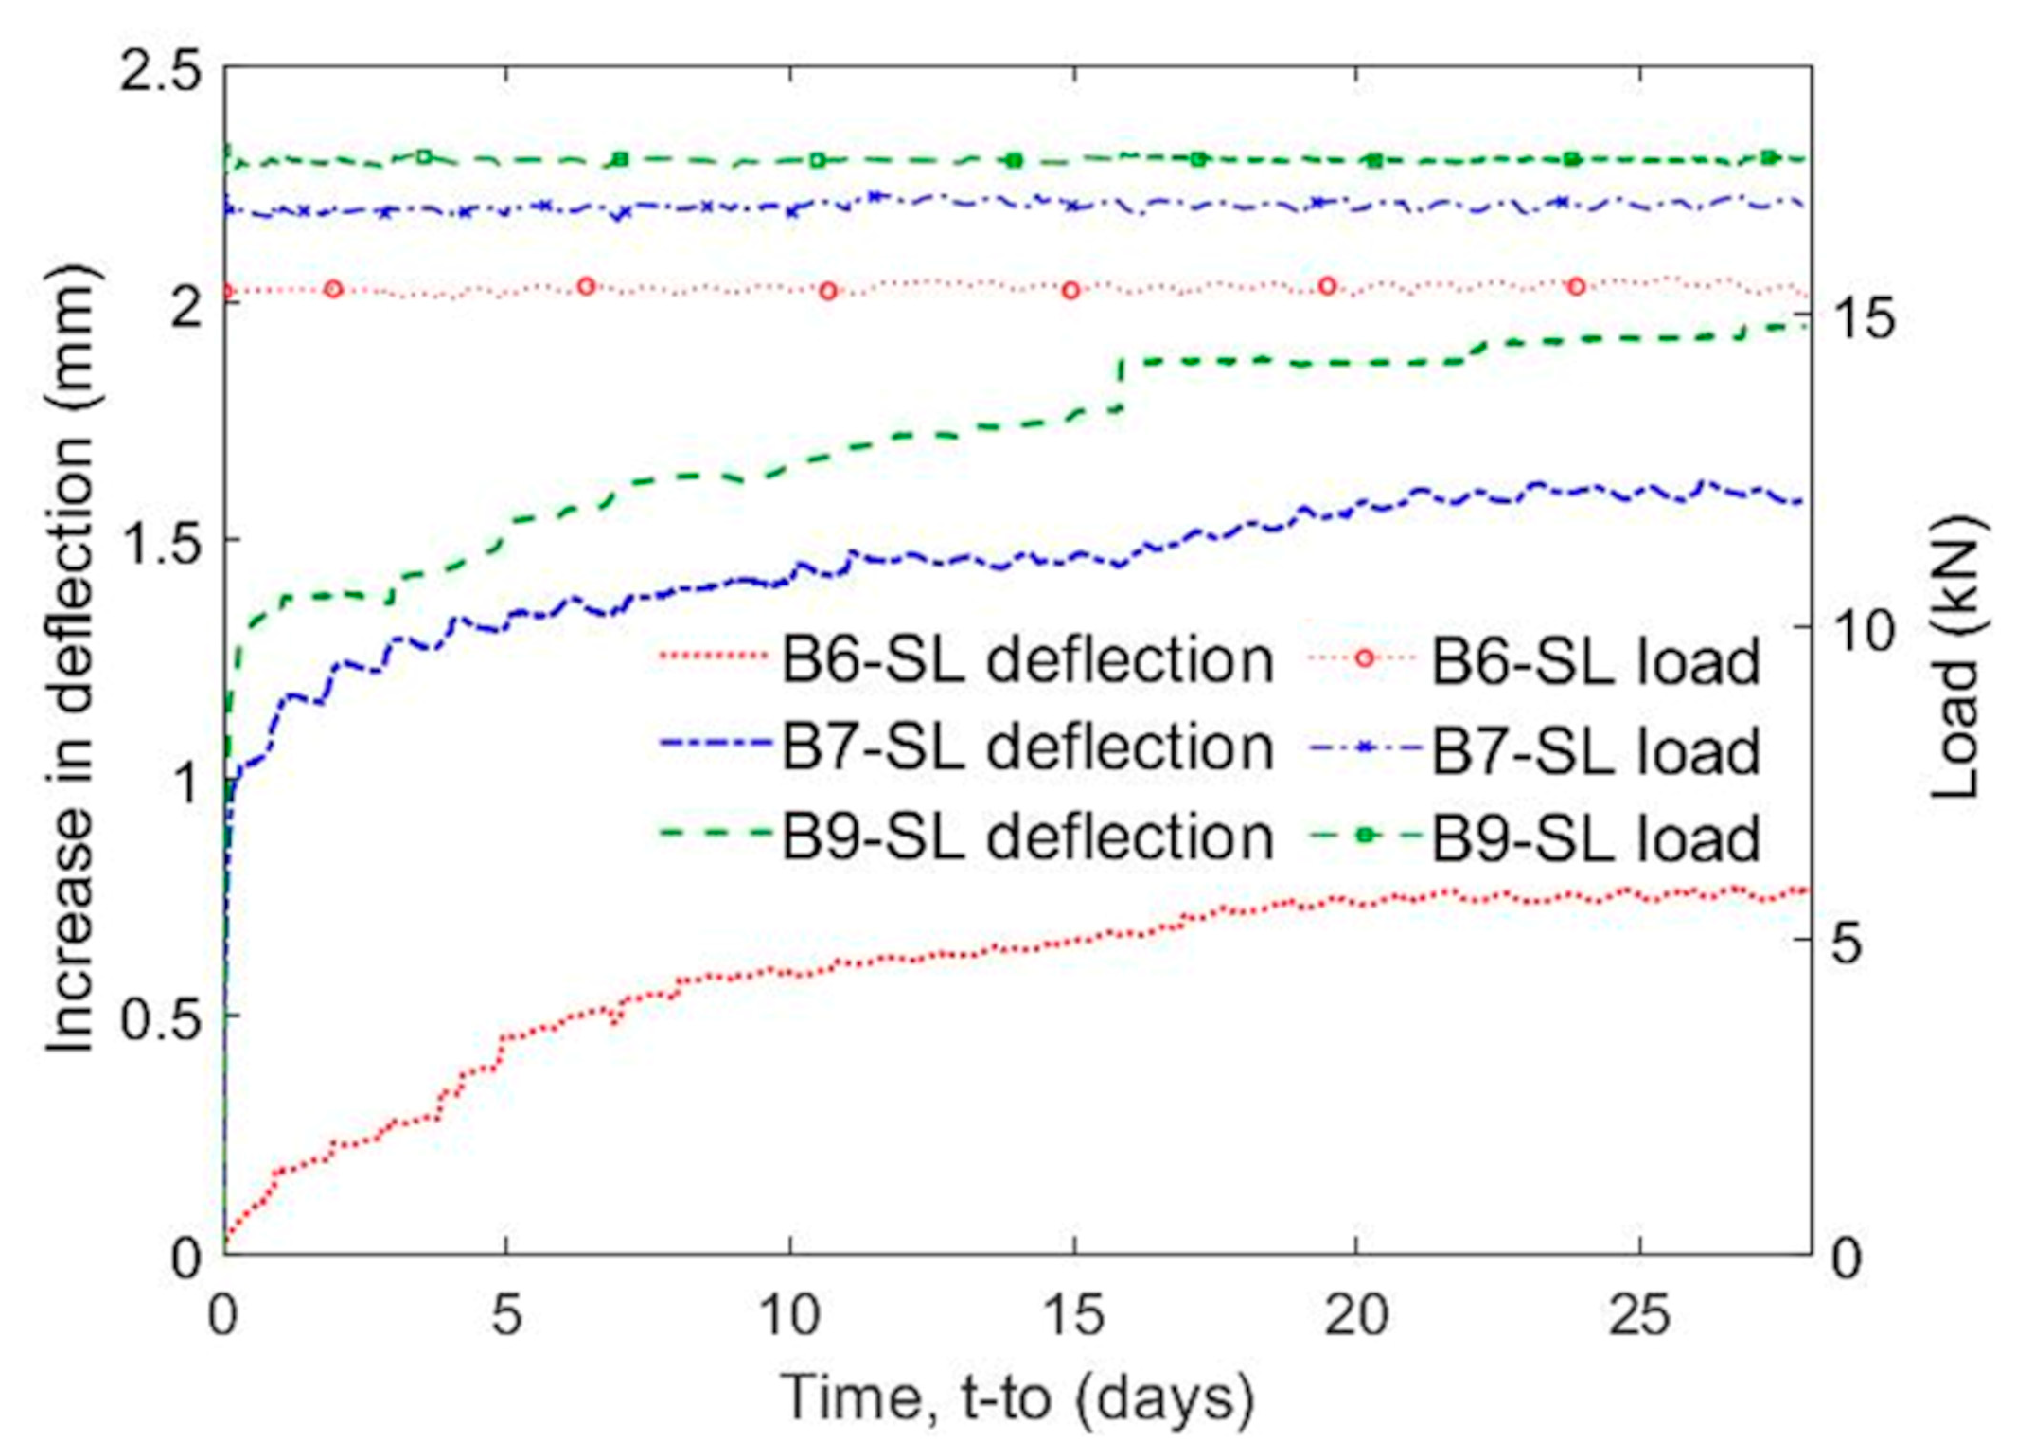
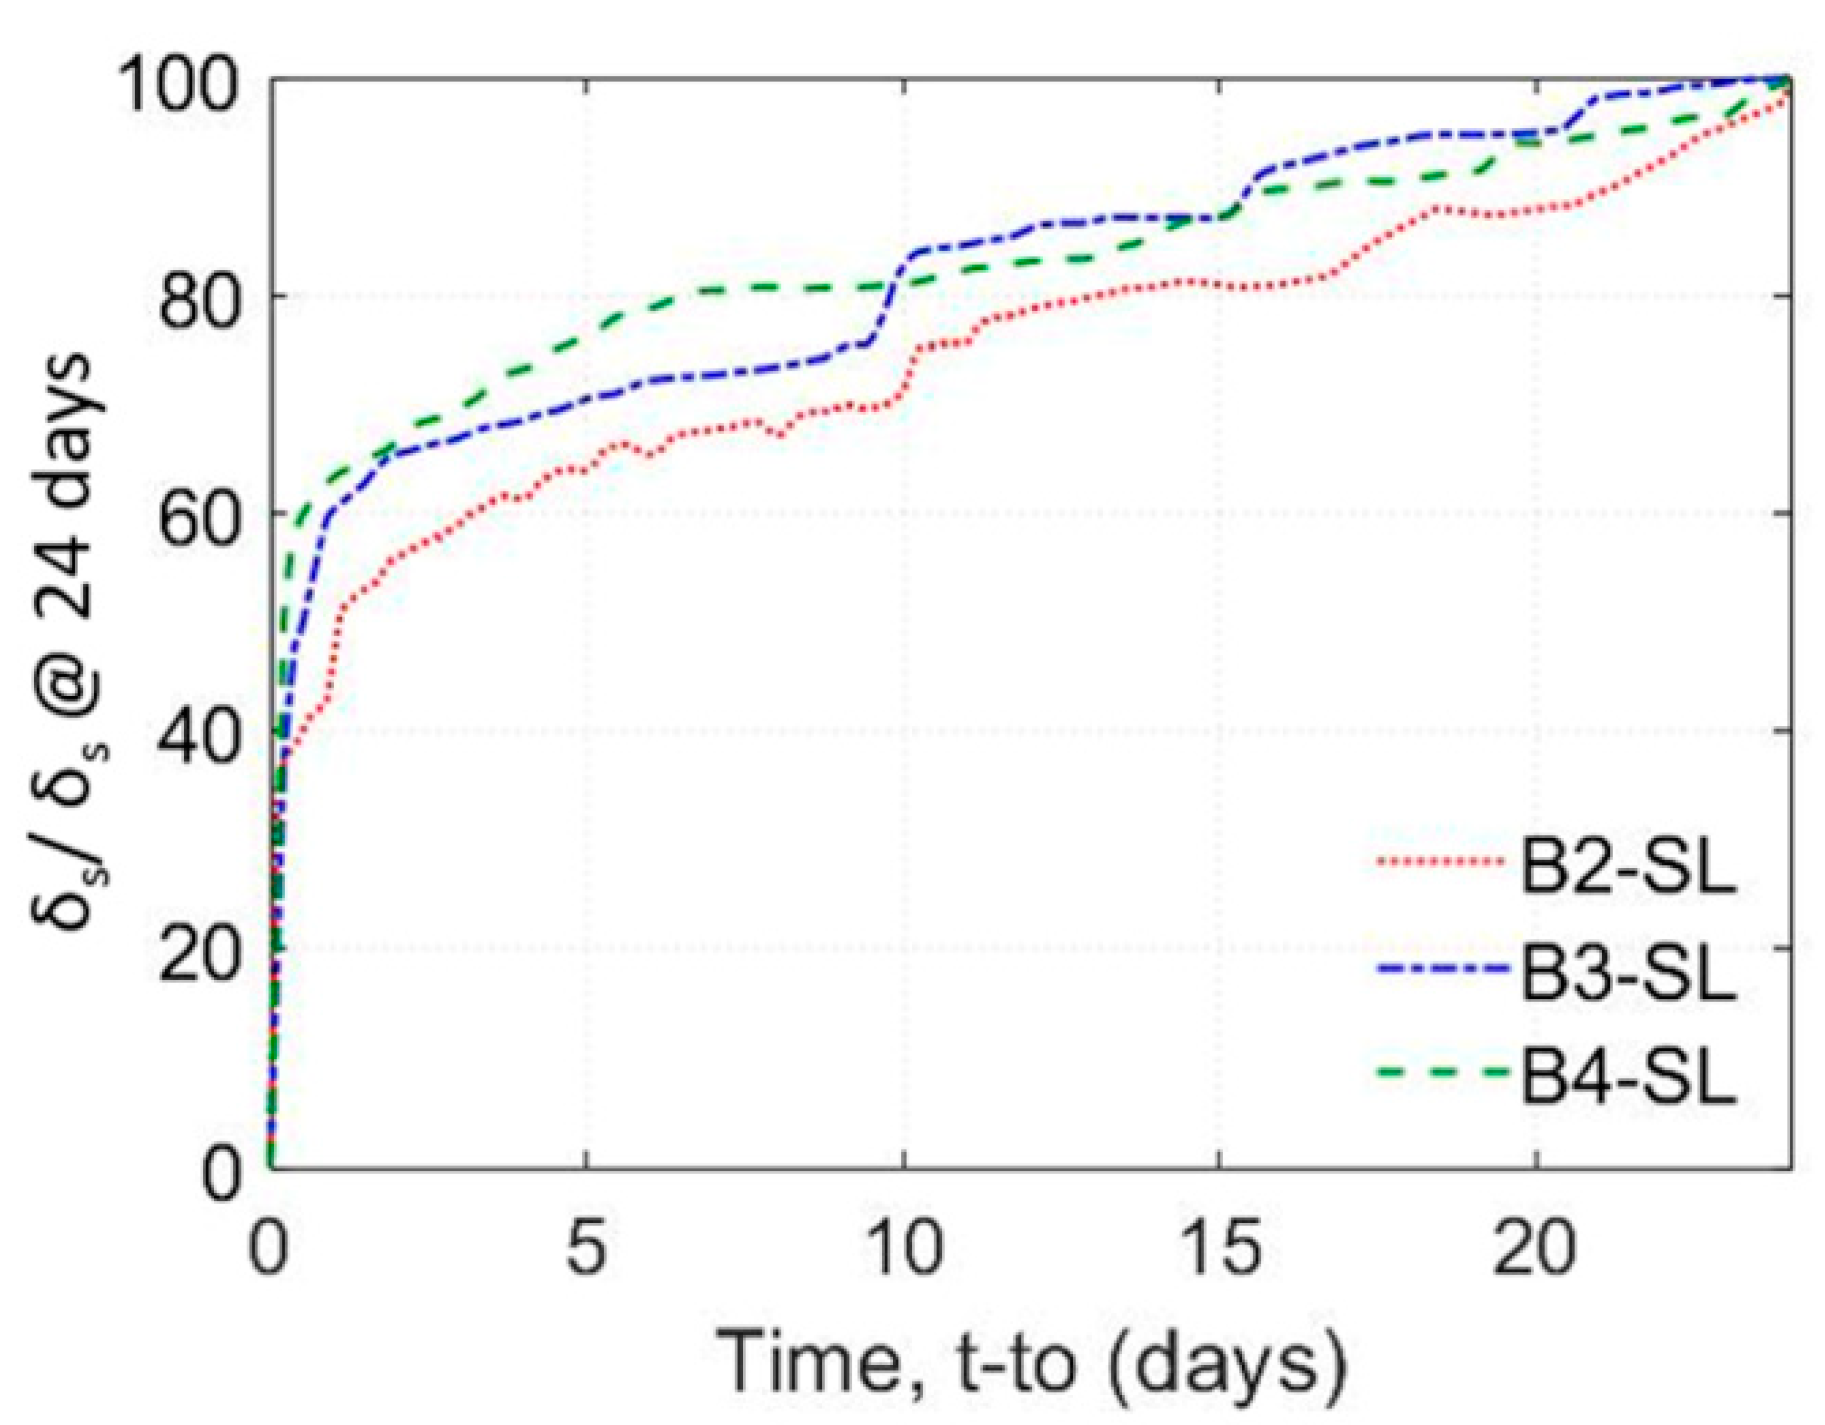
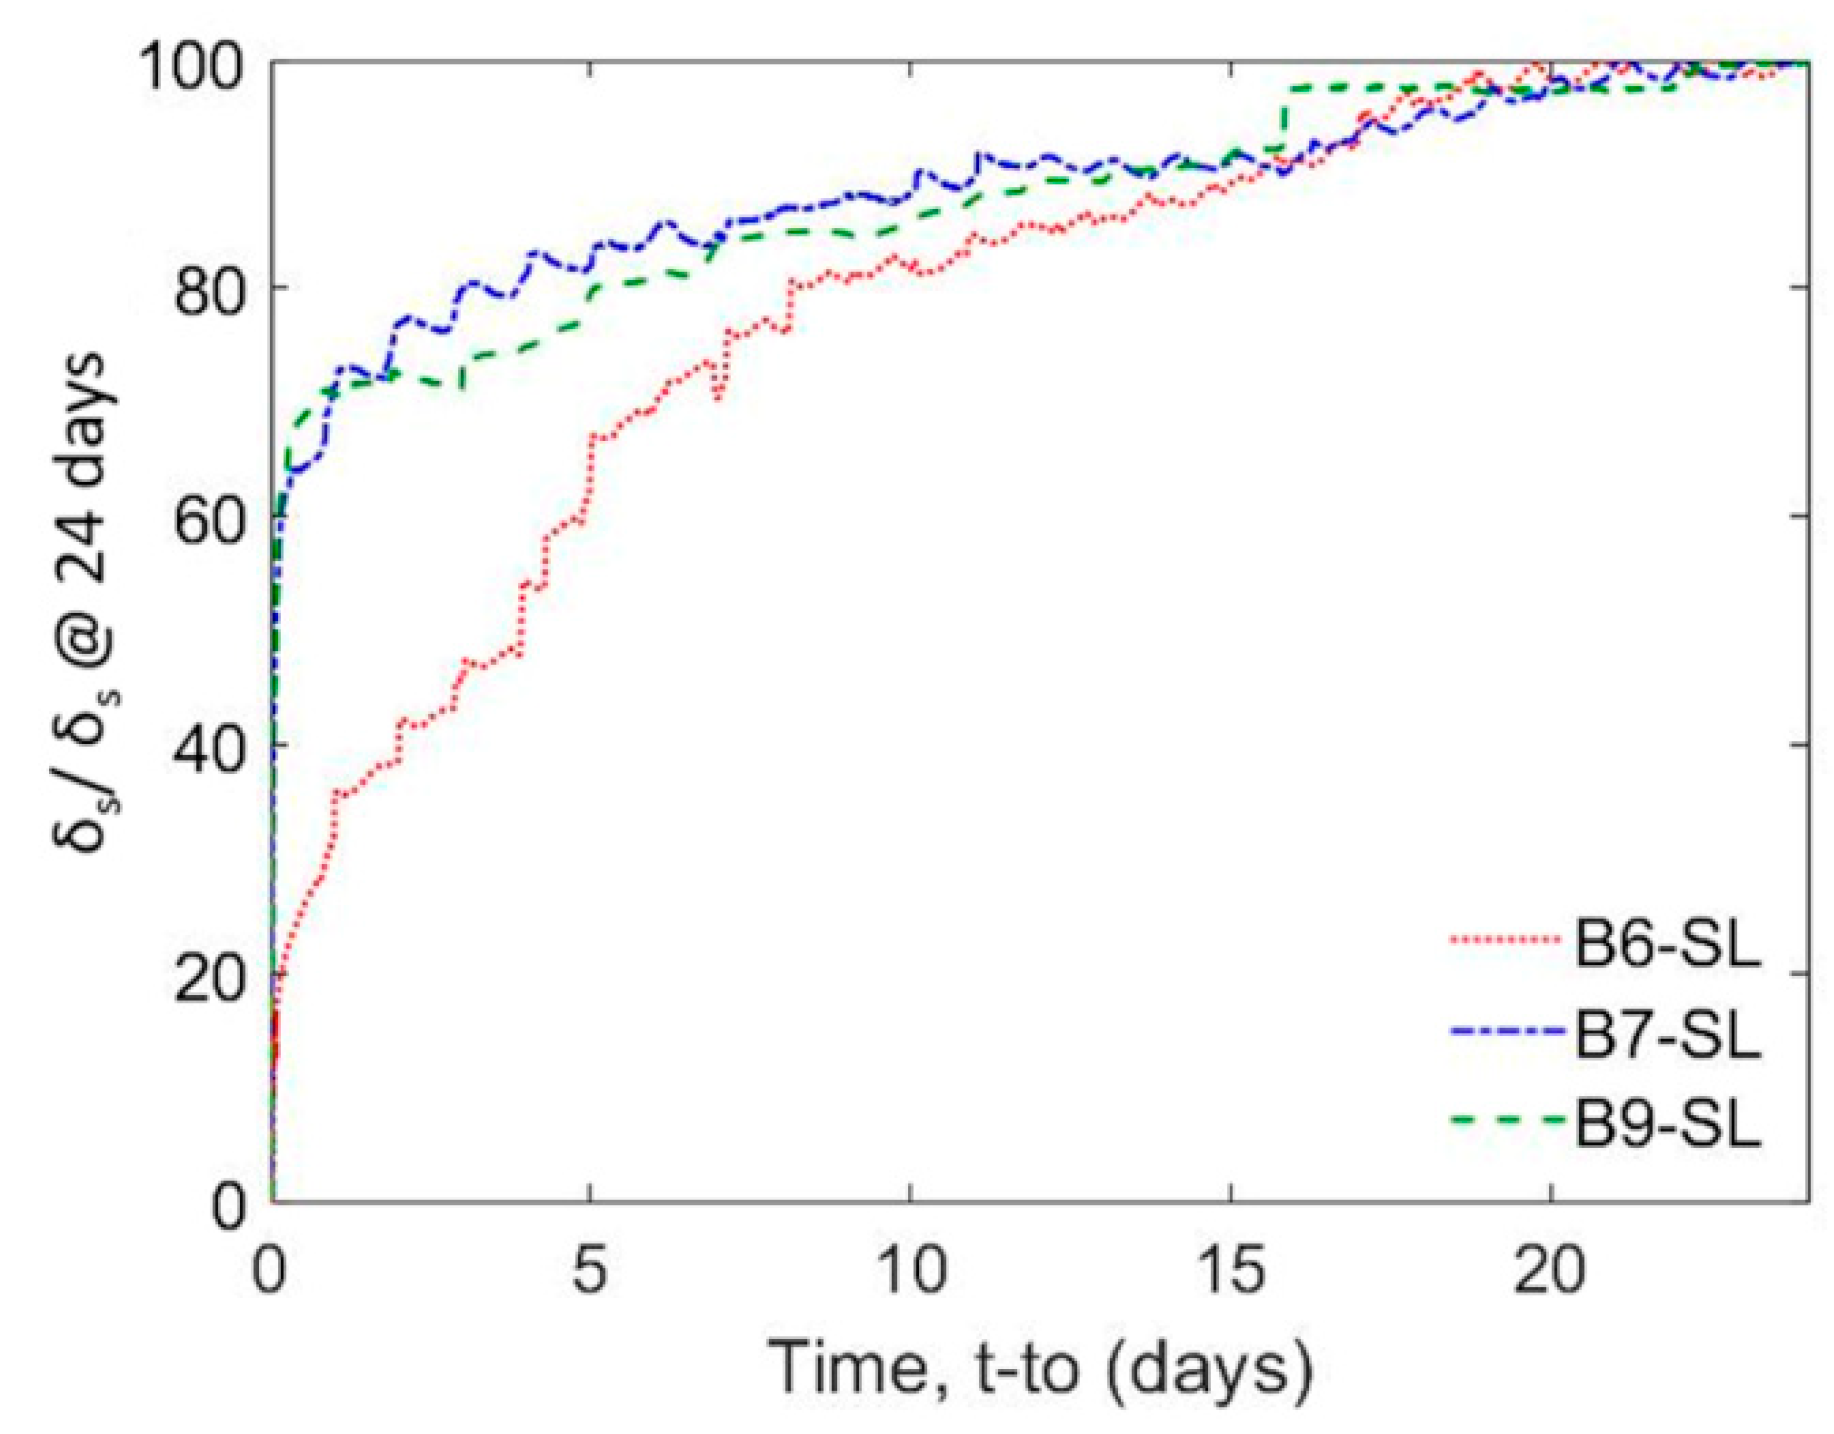
- Deflections increased during sustained loading for all specimens. At 24 days, the increase in deflection was on average 24% of the initial deflection. The increase in deflection was higher for specimens with higher levels of sustained load.
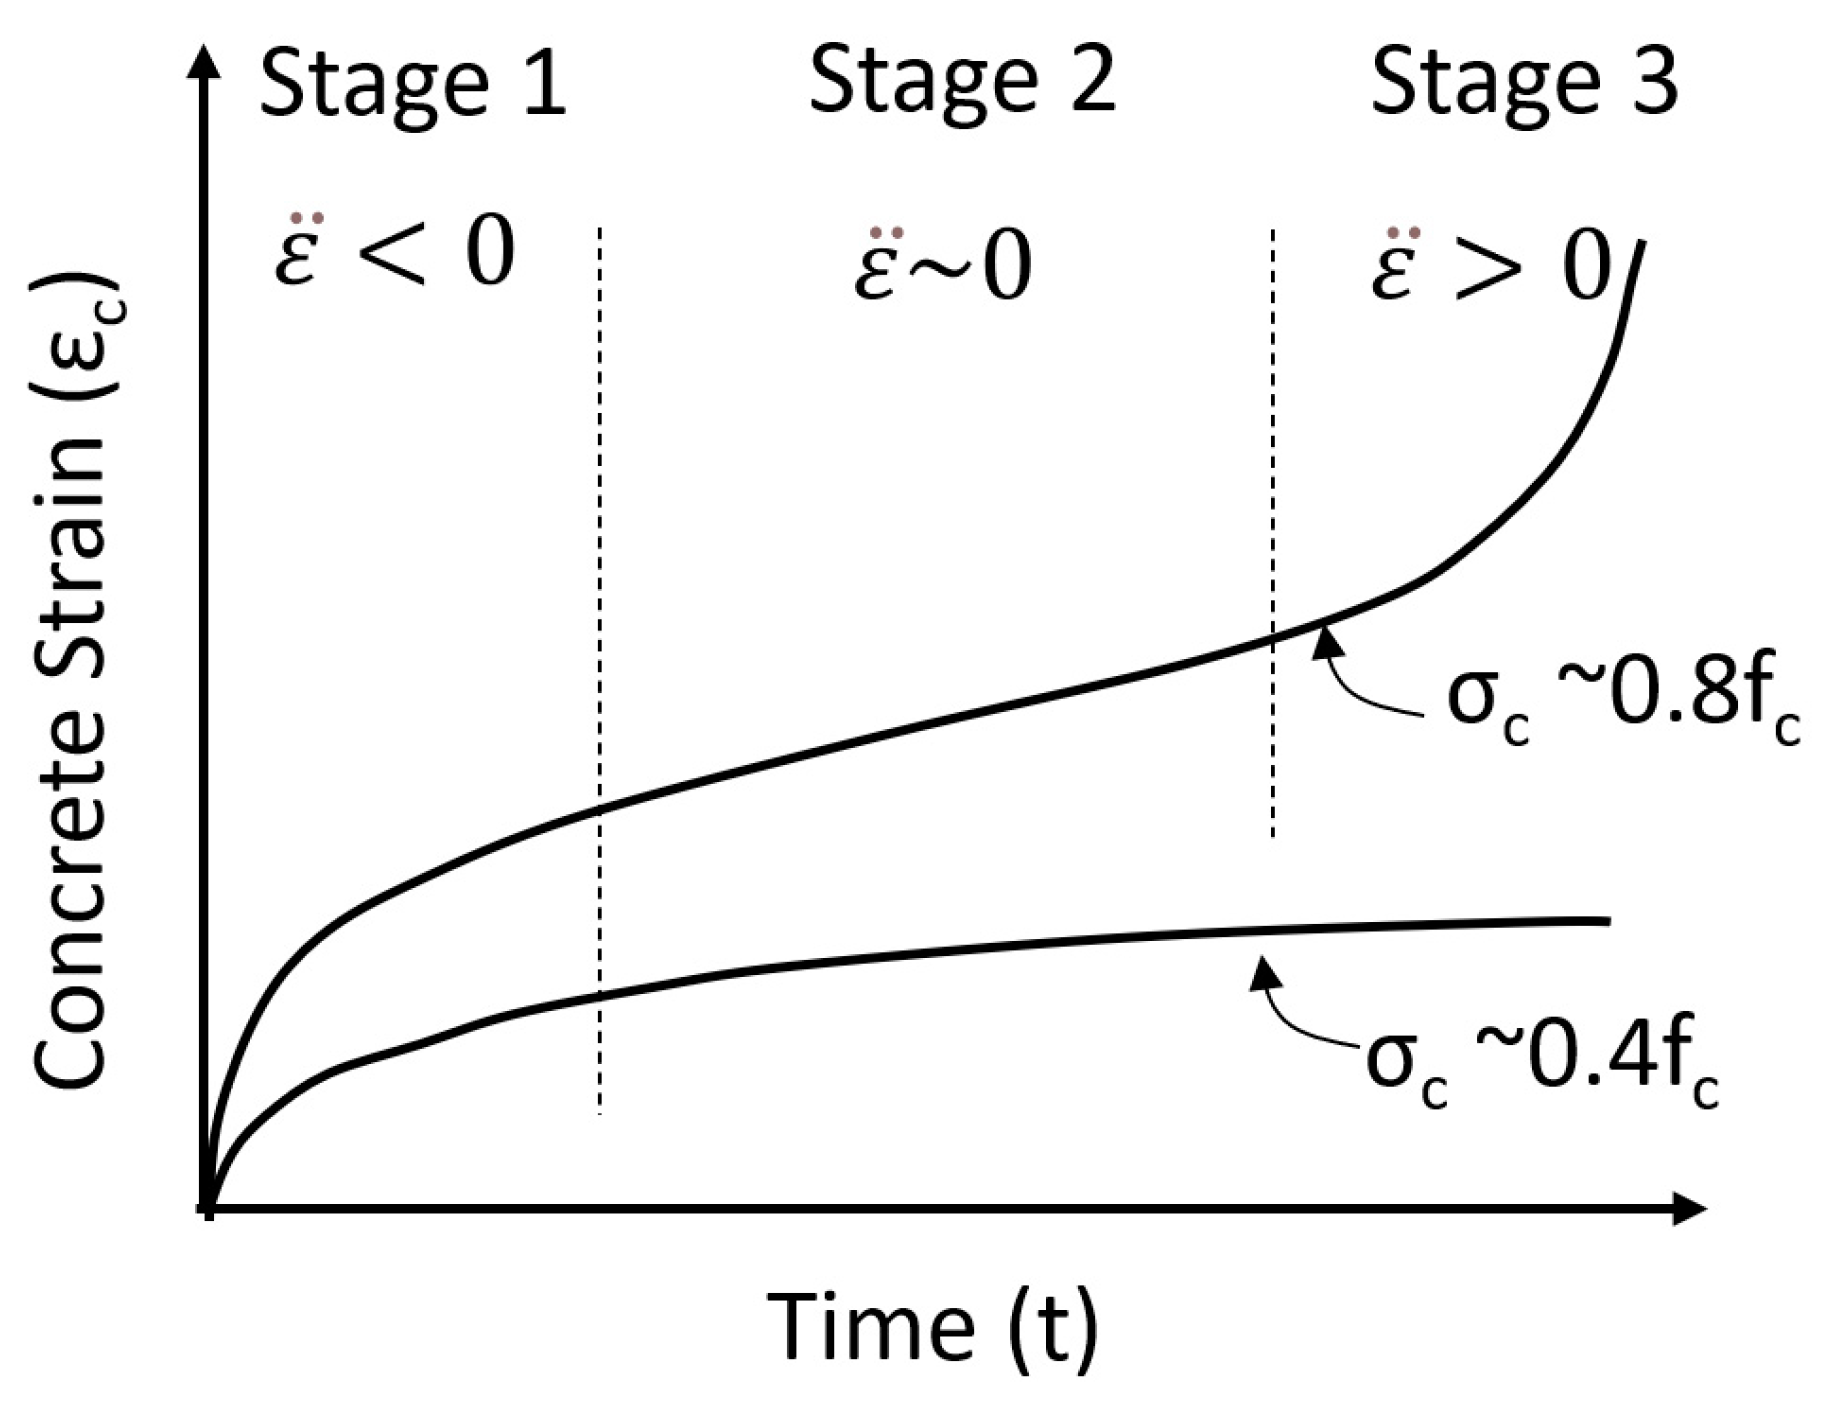
- On average 55% of the increase in deflection under sustained load took place in the first 24 h. The sharper increase in deflection early in the loading coincided with the primary stage of creep deformations and time-dependent bond slip. The secondary stage exhibited nearly a linear increase in deflection with time. Only specimen B10-SL experienced a tertiary stage that showed a sharp increase in deflection with time just 2 min before failure.
- Sustained load increased the deflection at shear failure for all specimens. For beams series I, the increase in deflection at shear failure compared to the control specimen was 230% while for beams series II, the increase in deflection was 150%. The large increase in deflection shows that sustained loading can significantly affect the failure behavior of a beam. This large increase in deflection would allow for load redistribution in redundant systems or provide warning signs of impending failure.
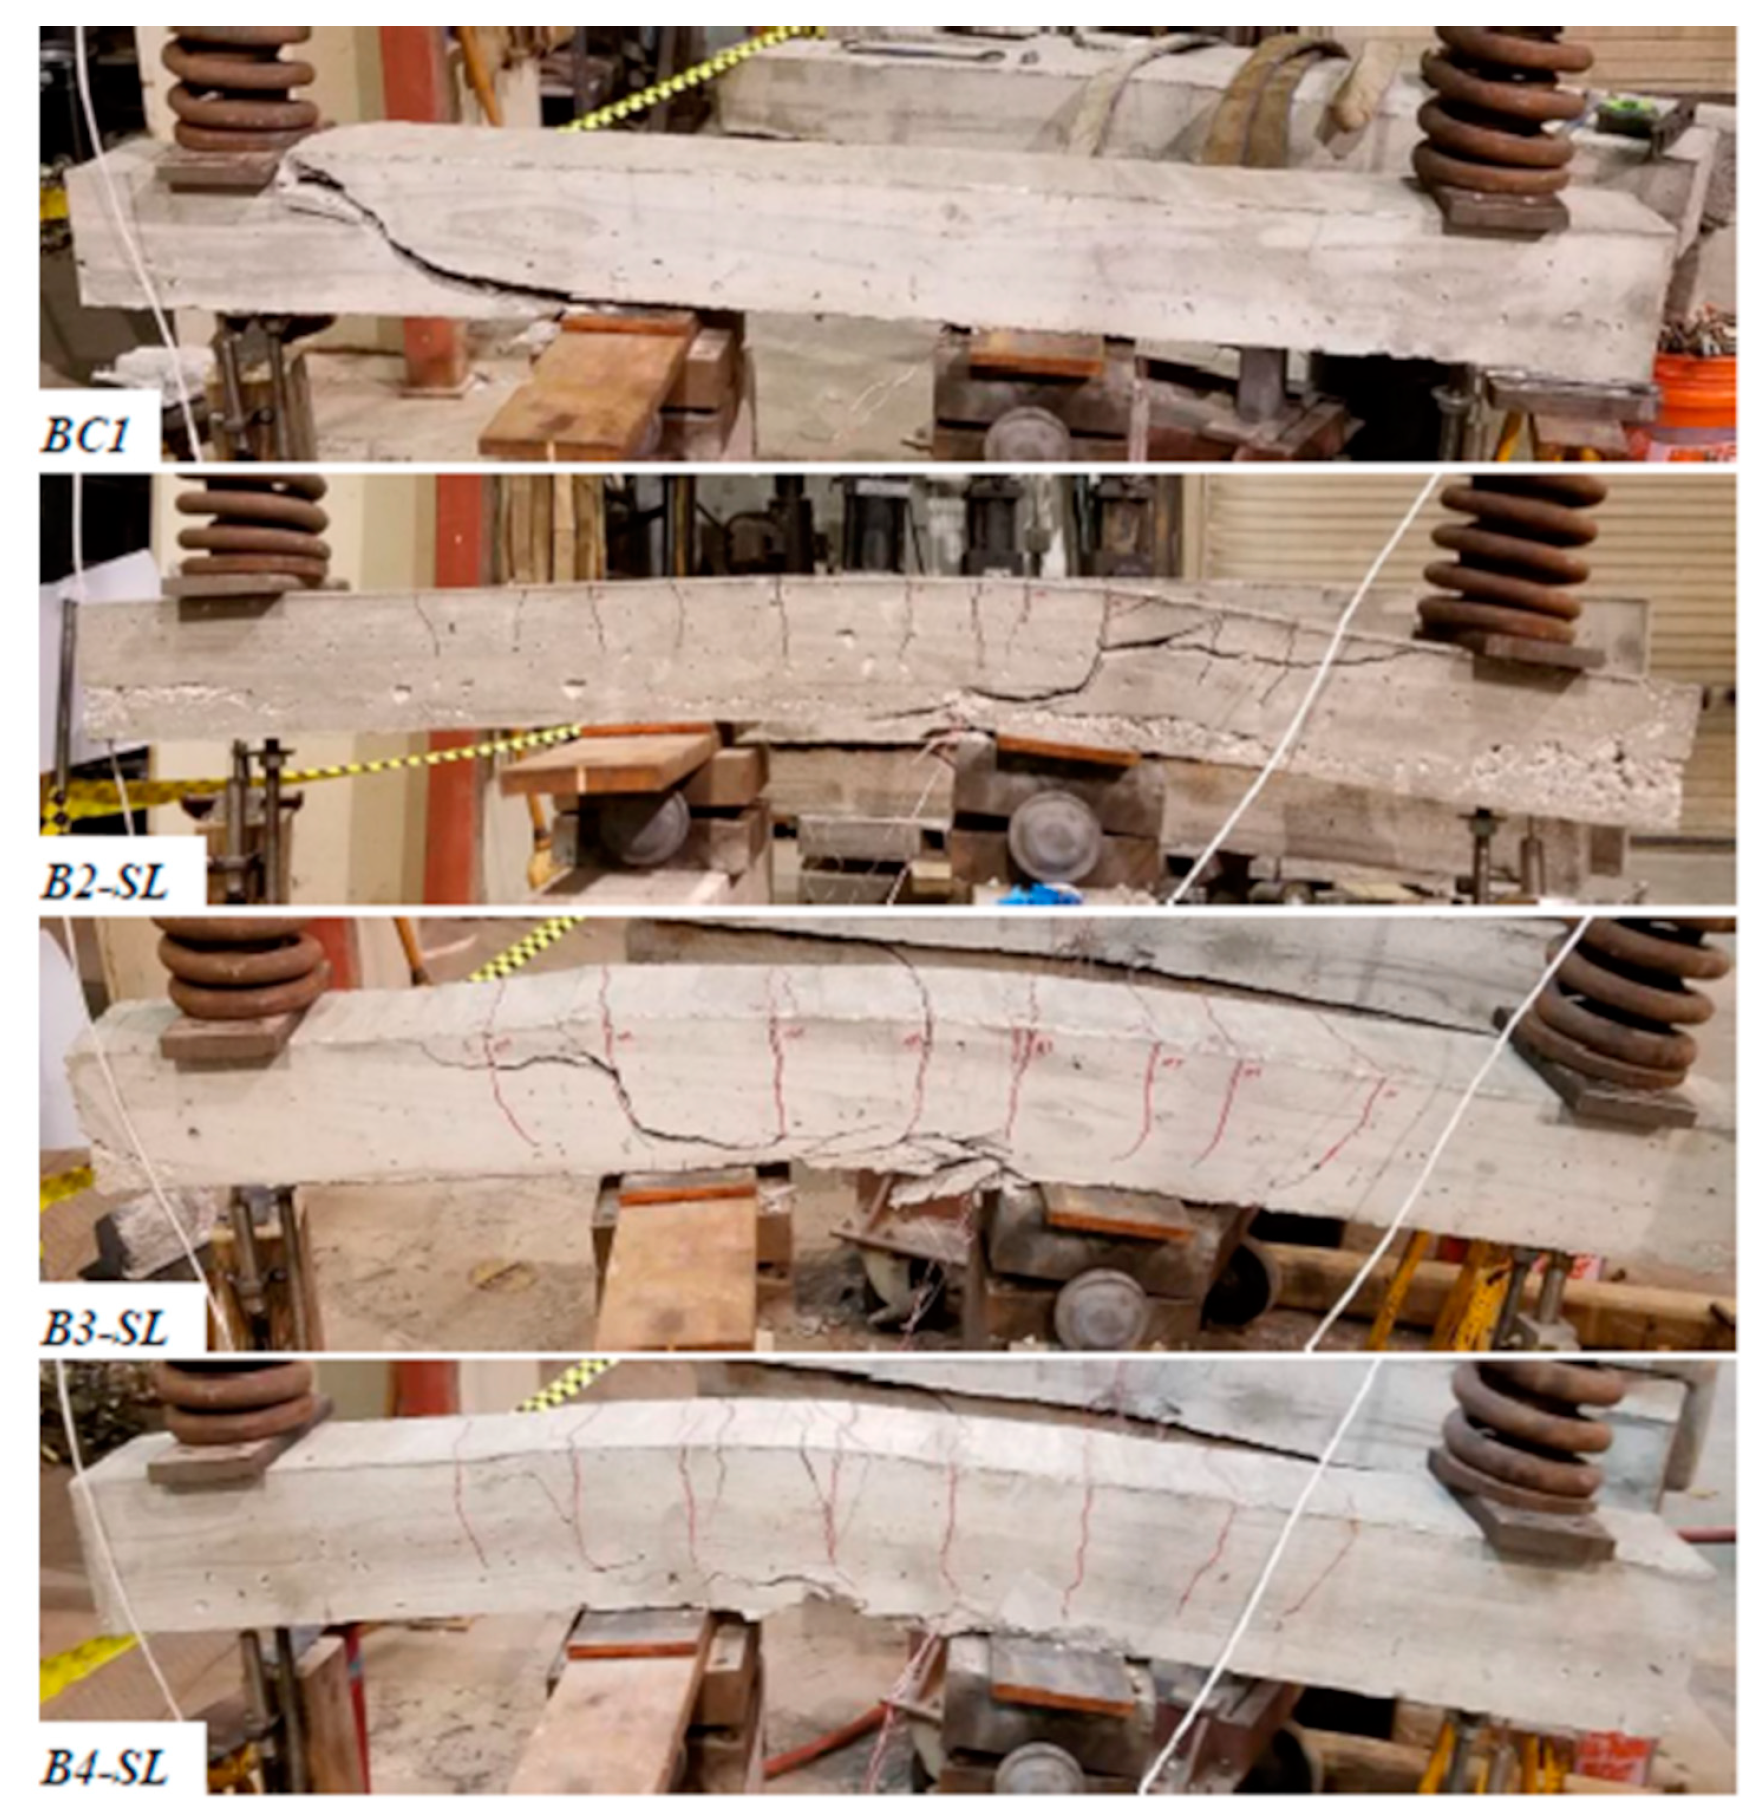
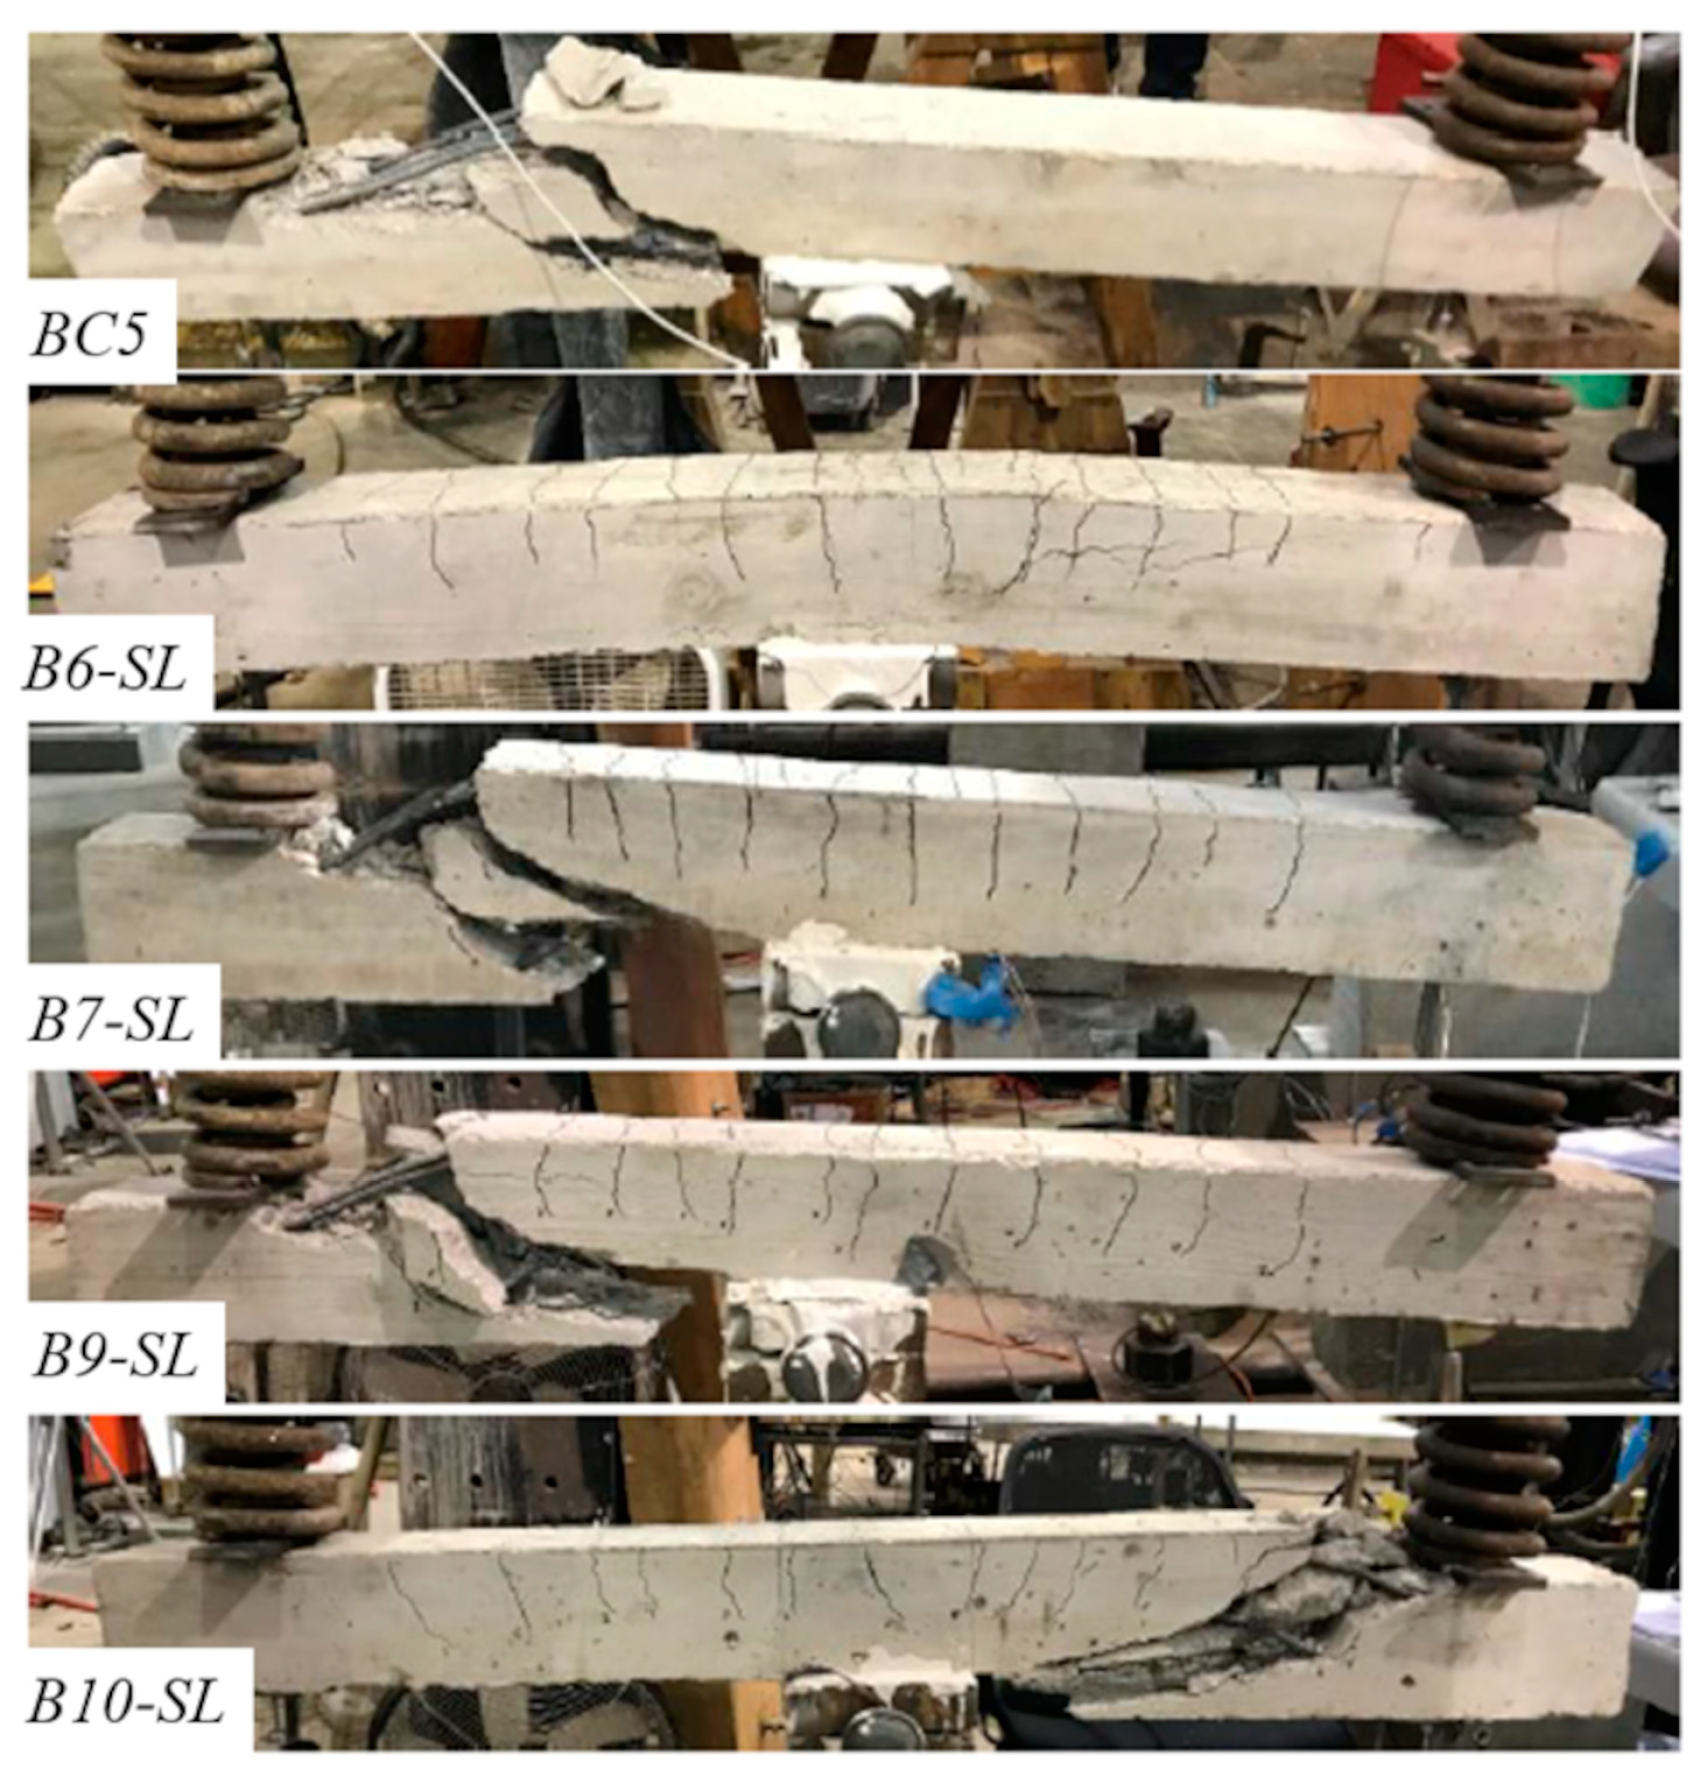
- Shear-controlled beams tested under sustained load showed a different failure behavior from the control specimen that was tested under monotonically increasing load to failure. Unlike the control specimen, which failed brittlely in shear, specimens tested under sustained loads experienced significant increases in deflection and flexural cracking before ultimate shear failure.
- Both the tensile and compressive strains increased under sustained load. The increase in strain shows that the reinforcement took more of the loading as the concrete softened under the sustained load. The increase in the compression strain was higher than in the tension strain.
Author Contributions
Funding
Data Availability Statement
Conflicts of Interest
References
- Rüsch, H. Researches toward a general flexural theory for structural concrete. J. Am. Concr. Inst. 1960, 57, 1–28. [Google Scholar] [CrossRef]
- Wardhana, K.; Hadipriono, F.C. Study of Recent Building Failures in the United States. J. Perform. Constr. Facil. 2003, 17, 151–158. [Google Scholar] [CrossRef]
- Eldukair, Z.A.; Ayyub, B.M. Analysis of Recent U.S. Structural and Construction Failures. J. Perform. Constr. Facil. 1991, 5, 57–73. [Google Scholar] [CrossRef]
- USGS. New Earthquake Hazards Program. 2016. Available online: https://www.usgs.gov/natural-hazards/earthquake-hazards/lists-maps-and-statistics (accessed on 4 April 2020).
- Hadipriono, F.C. Analysis of Events in Recent Structural Failures. J. Struct. Eng. 1985, 111, 1468–1481. [Google Scholar] [CrossRef]
- Gabrielle, L. TWC News, Structural Engineer: Ramp Likely Showed Signs of Deterioration Prior to Collapse, Spectrum News. 2015. Available online: https://spectrumlocalnews.com/nys/binghamton/news/2015/07/17/johnson-city-parking-garage-collapse-friday (accessed on 4 April 2020).
- Hill, B.; Kuykendall, R.; Moore, M. Final Report to Merlin Law Group on 4th Floor Distress of Dolphin Towers WJE No. 2010.3594; Wiss, J., Ed.; Elstner Associates, Inc.: Duluth, GA, USA, 2011. [Google Scholar]
- Baker, M.; Singhvi, A.; Mazzei, P. Engineer Warned of ‘Major Structural Damage’ at Florida Condo Complex. The New York Times. 26 June 2021. Available online: https://www.nytimes.com/2021/06/26/us/miami-building-collapse-investigation.html (accessed on 14 April 2022).
- Morrill, K.B.; Sheffield, C.S.; Kersul, A.M.; Crawford, J.E.; Brewer, T.R.; Lan, S. Calculations of the response of a flat plate structure to a column removal. In Proceedings of the 24th International Symposium on Military Aspects of Blast and Shock, Halifax, NS, Canada, 18–23 September 2016. [Google Scholar]
- Mazzotti, C.; Savoia, M. Nonlinear creep, poisson’s ratio, and creep-damage interaction of concrete in compression. ACI Mater. J. 2002, 99, 450–457. [Google Scholar] [CrossRef]
- Bažant, Z.P. Theory of creep and shrinkage in concrete structures: A précis of recent developments. Mech. Today 1975, 2, 1–93. [Google Scholar] [CrossRef]
- Iravani, S.; MacGregor, J.G. Sustained load strength and short-term strain behavior of high-strength concrete. ACI Mater. J. 1998, 95, 636–647. [Google Scholar] [CrossRef]
- Zhou, F.P. Time-Dependent Crack Growth and Fracture in Concrete (No. LUTVDG/TVBM--1011-1-132-1992); Department of Building Technology, Lund University: Lund, Sweden, 1992. [Google Scholar]
- Berthollet, A.; Georgin, J.R. Fluage tertiaire du béton en Traction, U. 2004, Tertiary creep of concrete in tension. Fr. Civ. Eng. Rev. 2004, 8.2–8.3, 235–260. [Google Scholar]
- Bockhold, J.; Stangenberg, F. Modellierung des nichtlinearen Kriechens von Beton. Beton-Und Stahlbetonbau 2004, 99, 209–216. [Google Scholar] [CrossRef]
- Tasevski, D.; Ruiz, M.F.; Muttoni, A. Compressive Strength and Deformation Capacity of Concrete under Sustained Loading and Low Stress Rates. J. Adv. Concr. Technol. 2018, 16, 396–415. [Google Scholar] [CrossRef]
- Ruiz, M.F.; Muttoni, A.; Gambarova, P.G. Relationship between Nonlinear Creep and Cracking of Concrete under Uniaxial Compression. J. Adv. Concr. Technol. 2007, 5, 383–393. [Google Scholar] [CrossRef]
- El-Kashif, K.F.; Maekawa, K. Time-Dependent Nonlinearity of Compression Softening in Concrete. J. Adv. Concr. Technol. 2004, 2, 233–247. [Google Scholar] [CrossRef]
- Bažant, Z.P.; Jirásek, M. Creep and hygrothermal effects in concrete structures. In Solid Mechanics and Its Applications; Springer: Dordrecht, The Netherlands, 2018. [Google Scholar]
- Shah, S.P.; Chandra, S. Fracture of concrete subjected to cyclic and sustained loading. ACI J. Proc. 1970, 67, 739–758. [Google Scholar]
- Rossi, P.; Tailhan, J.-L.; Le Maou, F. Comparison of concrete creep in tension and in compression: Influence of concrete age at loading and drying conditions. Cem. Concr. Res. 2013, 51, 78–84. [Google Scholar] [CrossRef]
- Tasevski, D.; Muttoni, A.; Ruiz, M.F. Time-Dependent Strength of Concrete in Compression and Shear (No. THESIS); EPFL: Lausanne, Switzerland, 2019. [Google Scholar]
- Smadi, M.M.; Slate, F.O.; Nilson, A.H. High-, medium-, and low-strength concretes subject to sustained overloads—Strains, strengths, and failure mechanisms. ACI J. 1985, 82, 657–664. [Google Scholar]
- Stockl, S. Strength of concrete under uniaxial sustained loading. Spec. Publ. 1972, 34, 313–326. [Google Scholar]
- Awad, M.E.; Hilsdorf, H.K. Strength and Deformation Characteristics of Plain Concrete Subjected to High Repeated and Sustained Loads; University of Illinois: Urbana, IL, USA, 1971. [Google Scholar]
- Paulson, K.A.; Nilson, A.H.; Hover, K.C. Long-term deflection of high-strength concrete beams. ACI Mater. J. 1991, 88, 197–206. [Google Scholar]
- Espion, B.; Halleux, P. Long-term deflections of reinforced concrete beams: Reconsideration of their validity. ACI Struct. J. 1990, 87, 232–236. [Google Scholar]
- Alwis, W.A.M.; Olorunniwo, A.; Ang, K.K. Long-term deflection of RC beams. J. Struct. Eng. 1994, 120, 2220–2226. [Google Scholar]
- Alwis, W.A.M. Long-term deflection of RC beams under constant loads. Eng. Struct. 1999, 21, 168–175. [Google Scholar] [CrossRef]
- Samra, R.M. Renewed assessment of creep and shrinkage effects in reinforced concrete beams. ACI Struct. J. 1997, 94, 745–751. [Google Scholar]
- Bakoss, S.L.; Gilbert, R.I.; Faulkes, K.A.; Pulmano, V.A. Long-term deflections of reinforced concrete beams. Mag. Concr. Res. 1982, 34, 203–212. [Google Scholar] [CrossRef]
- Dekoster, M.; Buyle-Bodin, F.; Maurel, O.; Delmas, Y. Modelling of the flexural behaviour of RC beams subjected to localised and uniform corrosion. Eng. Struct. 2003, 25, 1333–1341. [Google Scholar] [CrossRef]
- Choi, W.-C.; Yun, H.D. Long-term deflection and flexural behavior of reinforced concrete beams with recycled aggregate. Mater. Des. 2013, 51, 742–750. [Google Scholar] [CrossRef]
- Du, Y.; Cullen, M.; Li, C. Structural performance of RC beams under simultaneous loading and reinforcement corrosion. Constr. Build. Mater. 2013, 38, 472–481. [Google Scholar] [CrossRef]
- Yu, L.; Francois, R.; Dang, V.H.; L’Hostis, V.; Gagné, R. Structural performance of RC beams damaged by natural corrosion under sustained loading in a chloride environment. Eng. Struct. 2015, 96, 30–40. [Google Scholar] [CrossRef]
- Liu, Y.; Jiang, N.; Deng, Y.; Ma, Y.; Zhang, H.; Li, M. Flexural experiment and stiffness investigation of reinforced concrete beam under chloride penetration and sustained loading. Constr. Build. Mater. 2016, 117, 302–310. [Google Scholar] [CrossRef]
- Washa, G.W.; Fluck, P.G. Effect of sustained overload on the strength and plastic flow of reinforced concrete beams. ACI J. Proc. 1953, 50, 65–72. [Google Scholar]
- Reybrouck, N.; Criel, P.; Caspeele, R.; Taerwe, L. Modelling of Long-Term Loading Tests on Reinforced Concrete Beams; ASCE: Vienna, Austria, 2015; pp. 745–753. [Google Scholar] [CrossRef]
- Sarkhosh, R.; Walraven, J.; den Uijl, J. Shear-critical reinforced concrete beams under sustained loading Part I: Experiments. Heron 2015, 60, 181–205. [Google Scholar]
- Saifullah, H.A.; Nakarai, K.; Piseth, V.; Chijiwa, N.; Maekawa, K. Shear Creep Failures of Reinforced Concrete Slender Beams without Shear Reinforcement. ACI Struct. J. 2017, 114, 1581–1590. [Google Scholar] [CrossRef]
- Nie, J.; Cai, C.S. Deflection of Cracked RC Beams under Sustained Loading. J. Struct. Eng. 2000, 126, 708–716. [Google Scholar] [CrossRef]
- Tasevski, D.; Ruiz, M.F.; Muttoni, A. Influence of Load Duration on Shear Strength of Reinforced Concrete Members. ACI Struct. J. 2020, 117, 157–170. [Google Scholar] [CrossRef]
- Shang, H.; Ren, G.; Hou, D.; Zhang, P.; Zhao, T. Bond behaviour between steel bar and concrete under sustained load and dry–wet cycles. Mag. Concr. Res. 2019, 71, 700–709. [Google Scholar] [CrossRef]
- ACI Committee 318, Building Code Requirements for Structural Concrete; American Concrete Institute: Farmington Hills, MI, USA, 2014.
- ASTM A370-21; Standard Test Methods and Definitions for Mechanical Testing of Steel Products. ASTM International: West Conshohocken, PA, USA, 2021.
- EN 1992-1-1; Eurocode 2: Design of Concrete Structures—Part 1-1: General Rules and Rules for Buildings. CEB. European Committee for Standardization: Brussels, Belgium, 2011.


| Series | Specimen | Loading Age to (Days) | Duration td | Temperature °C (°F) | Relative Humidity % |
|---|---|---|---|---|---|
| Series I | BC1 | 64 | - | - | - |
| B2-SL | 65 | 25 days | 15.4 ± 3.7 (59.7 ± 6.7) | NA | |
| B3-SL | 91 | 42 days | 13.3 ± 2.7 (56.0 ± 4.9) | NA | |
| B4-SL | 135 | 24 days | 16.5 ± 3.7 (61.7 ± 6.7) | NA | |
| Series II | BC5 | 282 | - | - | - |
| B6-SL | 284 | 32 days | 26.1 ± 2.5 (79.0 ± 4.5) | 73.5 ± 3.6 | |
| B7-SL | 338 | 52 days | 26.4 ± 3.6 (79.5 ± 6.5) | 72 ± 7 | |
| B9-SL | 492 | 34 days | 17.1 ± 5.9 (62.8 ± 10.7) | 28.1 ± 17.1 | |
| B10-SL | 543 | 84.5 min. | 12.6 (54.6) | 22.6 |
| Material | 3/8” Limestone kg (lb) | River Sand kg (lb) | Type I Cement kg (lb) | Air L (oz) | Retarder L (oz) | Water L (gal) |
|---|---|---|---|---|---|---|
| Amount | 1067.64 (2354) | 831.07 (1831) | 333.45 (738) | 0.135 (4.6) | 0.843 (28.5) | 133.68 (35.3) |
| Specimen | BC1 | B2-SL | B3-SL | B4-SL |
|---|---|---|---|---|
| Sustained load kN (lb) | - | 16.01 (3600) | 17.13 (3850) | 18.24 (4100) |
| Sustained load intensity (sustained load/peak load of BC1) | - | 0.82 | 0.87 | 0.93 |
| Actual sustained load intensity (sustained load/measured peak load) | - | 0.79 | 0.86 | 0.88 |
| Peak load kN (lb) | 18.36 (4352) | 20.28 (4559) | 20.01 (4498) | 20.68 (4659) |
| Ratio of the peak load to the peak load of BC1 | 1 | 1.05 | 1.03 | 1.07 |
| Deflection at the peak load mm (in.) | 12.37 (0.487) | 13.88 (0.547) | 20.47 (0.806) | 18.22 (0.717) |
| Deflection at failure mm (in.) | 12.37 (0.487) | 40.39 (1.590) | 44.78 (1.763) | 37.41 (1.473) |
| Initial deflection under short-term loading deflection (δi) mm (in.) | - | 5.31 (0.209) | 9.42 (0.371) | 10.66 (0.420) |
| Deflection increase under sustained load (δs) mm (in.) | - | 1.11 (0.043) | 3.55 (0.140) | 2.18 (0.085) |
| Creep coefficient—Ratio sustained to initial deflection (δs/δi) | - | 0.21 | 0.38 | 0.20 |
| Rotation under sustained load | - | 0.0027 | 0.0087 | 0.0054 |
| Sustained load deflection at 24 days (δs@24 days) mm (in.) | - | 1.11 (0.043) | 3.11 (0.122) | 2.18 (0.085) |
| Rotation at 24 days under sustained load | - | 0.0027 | 0.0075 | 0.0054 |
| Specimen | BC5 | B6-SL | B7-SL | B9-SL | B10-SL |
|---|---|---|---|---|---|
| Sustained load kN (lb) | - | 15.35 (3750) | 16.68 (3450) | 17.48 (3750) | 18.02 (4050) |
| The reinforcement depth mm (in.) | 116 (4.573) | 112 (4.412) | 112 (4.423) | 111 (4.357) | 114 (4.473) |
| Sustained load intensity (sustained load/peak load of BC1) | - | 0.84 | 0.91 | 0.95 | 0.98 |
| Actual sustained load intensity (sustained load/measured peak load) | - | 0.71 | 0.89 | 0.91 | 1.00 |
| Peak load kN (lb) | 18.35 (4216) | 21.75 (4889) | 18.70 (4205) | 19.26 (4330) | 18.02 (4050) |
| Ratio of the peak load to the peak load of BC5 | 1 | 1.18 | 1.02 | 1.05 | 0.98 |
| Deflection at the peak and failure mm (in.) | 5.64 (0.222) | 18.45 (0.727) | 11.76 (0.463) | 12.52 (0.493) | 6.13 (0.241) |
| Initial deflection under short-term loading deflection (δi) mm (in.) | - | 4.98 (0.196) | 6.45 (0.254) | 6.84 (0.269) | 5.87 (0.231) |
| Deflection under sustained load (δs) mm (in.) | - | 0.91 (0.036) | 1.60 (0.063) | 1.95 (0.077) | 0.26 (0.010) |
| Creep coefficient—Ratio sustained to initial deflection (δs/δi) | - | 0.19 | 0.25 | 0.29 | 0.05 |
| Rotation under sustained load | - | 0.0015 | 0.0026 | 0.0032 | 0.00043 |
| Sustained load deflection at 24 days (δs@24 days) mm (in.) | - | 0.90 (0.035) | 1.58 (0.062) | 1.92 (0.076) | - |
| Rotation at 24 days under sustained load | - | 0.0015 | 0.0026 | 0.0032 | - |
Publisher’s Note: MDPI stays neutral with regard to jurisdictional claims in published maps and institutional affiliations. |
© 2022 by the authors. Licensee MDPI, Basel, Switzerland. This article is an open access article distributed under the terms and conditions of the Creative Commons Attribution (CC BY) license (https://creativecommons.org/licenses/by/4.0/).
Share and Cite
Shubaili, M.; Elawadi, A.; Orton, S.; Tian, Y. Time-Dependent Behavior of Reinforced Concrete Beams under High Sustained Loads. Appl. Sci. 2022, 12, 4015. https://doi.org/10.3390/app12084015
Shubaili M, Elawadi A, Orton S, Tian Y. Time-Dependent Behavior of Reinforced Concrete Beams under High Sustained Loads. Applied Sciences. 2022; 12(8):4015. https://doi.org/10.3390/app12084015
Chicago/Turabian StyleShubaili, Mohammed, Ali Elawadi, Sarah Orton, and Ying Tian. 2022. "Time-Dependent Behavior of Reinforced Concrete Beams under High Sustained Loads" Applied Sciences 12, no. 8: 4015. https://doi.org/10.3390/app12084015
APA StyleShubaili, M., Elawadi, A., Orton, S., & Tian, Y. (2022). Time-Dependent Behavior of Reinforced Concrete Beams under High Sustained Loads. Applied Sciences, 12(8), 4015. https://doi.org/10.3390/app12084015