1. Introduction
Procedural content generation (PCG) is a discipline that focuses on generating content algorithmically, mainly practiced in video games. PCG is commonly used for creating game content as levels, maps, quests, characters, or even rules during the run time or as a design tool. It is motivated by the need to personalize the video game content for each player, increase the replayability, or reduce the production costs in the industry [
1]. Nowadays, small independent companies (
indies) can produce and distribute creative applications; however, they usually lack adequate numbers of employees to develop a substantial amount of content manually. These indie companies look at PCG as a viable alternative for producing content at an affordable price.
The high impact of this area has generated a lot of interest in the academic community and has led to a considerable number of books and surveys in the last two decades [
2,
3,
4,
5,
6,
7,
8], each one proposing different kinds of taxonomies for categorizing all of the work in the area. There are three main taxonomies used for classifying the works: the taxonomy of content, the taxonomy of methods, and the taxonomy of roles. The taxonomy of content classifies works by the type of content generated as map-level, narrative, texture, music, faces among others [
2,
6]; the taxonomy of roles segments them by the algorithm role and applications in the design; and the taxonomy of methods divide the works by technology type as machine learning, deep learning, evolutionary algorithms, among others [
5,
6].
PCG utilizes numerous techniques, each one with strengths and weaknesses. Togelius in [
7] proposes a classification of the PCG approaches according to the content generation process in three categories; a search-based algorithm, constructive, and a simple generate and test.
The search-based approach to PCG is generally performed using some search optimization algorithm to look for content with the desired qualities. The main components of the search approach are the optimization algorithm, the content representation, and the evaluation function. The optimization algorithm is the core of the search-based method, mainly a simple evolutionary algorithm [
9,
10,
11,
12,
13,
14], and in some cases, other stochastic algorithms. Recently, reinforcement learning has been explored as an alternative for PCG search-base, describing the generation task as a Markov decision process where a model is trained to select the best action to improve the content quality [
15,
16,
17,
18,
19,
20].
The constructive approach consists of a series of steps to generate content and does not evaluate the output to regenerate it. In this approach, the algorithm uses a set of rules to generate content to warrant a level with the desired qualities. The experience of the designers is used to dictate the rules and are commonly captured using grammar [
21,
22,
23,
24] for structural generation, such as a dungeon, or linguistical generation, such as a quest. Moreover, simple rules that react to local spatial information, such as cellular automata [
25], have been used to generate structures, such as dungeons or caves. However, the difficulty of dictating a set of rules has led to the implementation of machine learning algorithms [
26,
27,
28,
29,
30] for content generation. These algorithms are capable of inferring the rules from data of similar games or previously designed levels.
The generate and test approach generates content using an algorithm that usually does not guarantee a good result and then tests the performance of the generated content according to some criteria. If the content does not accomplish the performance, it is regenerated; this process can iterate as much as is needed. This paradigm is a middle point between the constructive and the search-based approaches, it considers that the constructive method does not warranty playable content. Commonly, this approach uses random [
31,
32] or semi-random algorithms, such as fractals [
33].
To provide a comparison between approaches, it is necessary to understand the criteria by which a procedural generation algorithm is analyzed. In [
8], Togelius proposes a taxonomy to measure the algorithms in three dimensions. The first dimension is the degree of determinism or randomness that the algorithm possesses and is measured by the amount of variations of outcomes in different runs of the same algorithm with the same parameters. The second is the degree of controllability the designer has over the algorithm to influence the generated outcome. The third and final dimension is the level of iterability or number of iterations the algorithm needs to perform to produce content. While these criteria provide insight into the main characteristics of the algorithm, they do not describe the performance of the content generated. In [
34], the creativity of the algorithms are analyzed, and the authors propose two metrics, novelty, and playability, to measure how creative the generated content is. Novelty is defined as the variability from the reference levels and the output ones, measured by the different levels the algorithm produces. Playability is defined as the percentage of the generated content that is useful.
We gathered the algorithm comparisons and taxonomy classifications from different sources [
2,
3,
4,
5,
6,
7,
8,
34]; we present a side-by-side comparison of the numerous techniques used for PCG in
Table 1. In this comparison, we use a scale that considers levels (high, moderate, fair, and low) to describe the performance of each algorithm metric.
In this table, we can observe that different algorithms that share the same generation process behave similarly in each metric, and many approaches have strengths that oppose weaknesses of the others. This would suggest that hybrid approaches could effectively improve performance and minimize weaknesses. The idea of hybridizing PCG algorithms through composition was original proposed in [
40] where they experiment with combining an evolutive algorithm with a constructive method; the evolutive algorithm uses the constructive approach as part of its inner working and tests the idea in a simple dungeon generator. In [
41], a hybrid approach that combines grammar and cellular automata to generate dungeon layouts is presented. This algorithm generates levels with high playability and slightly improves the novelty of the output levels due to the cellular automata.
The hybridization of algorithms has shown a lot of potential. However, there are still many research questions to be addressed in regard to creating a PCG algorithm that is fully controllable, fast, and capable of generating novel and playable content. For this reason, we propose a novel hybrid algorithm that uses a reinforced learning approach to orchestrate a group of semi-random generators. The reinforced learning algorithm has the objective of providing controllability to search for a specific player experience and provide results with high playability. This core algorithm is complemented with a group of semi-random generators to improve the novelty of the generated content.
Our proposal includes the following contributions:
We introduce new metrics for any game level: risk, obstruction, precision, reward, motivation, and distance. The motivation metric considers the potential reward available in an interaction and the precision required.
Through the designed reward function, our hybrid algorithm of PCG generates a diversity of levels that meet any given gaming experience.
2. Problem Statement
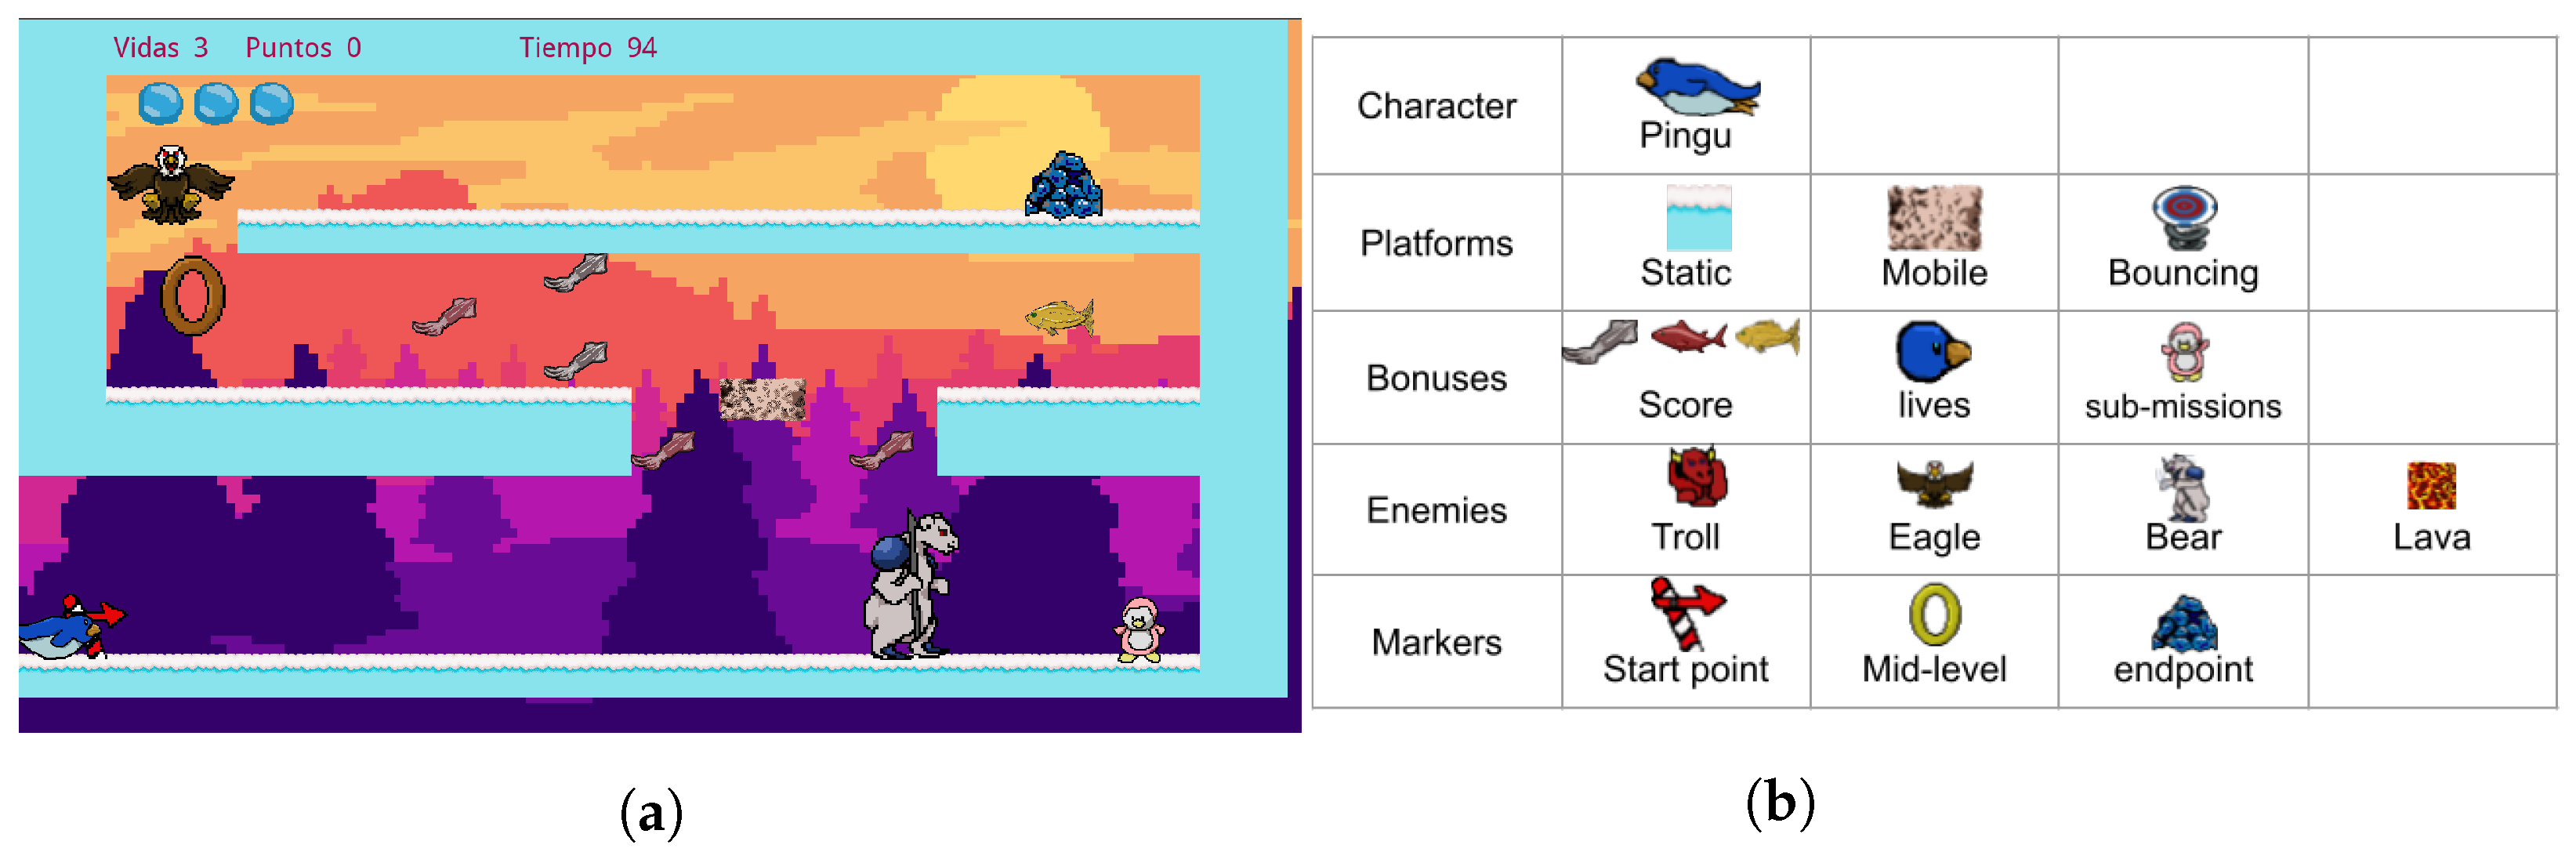
As a case study, we developed a game called “Pingu run”, a game of the platform genre. Pingu run was designed and implemented in Pygame for this purpose and is available in [
42]. This game consists of moving a penguin called Pingu from an initial point to an endpoint by travelling through a series of platforms and avoiding enemies; a video of the gameplay is shown in [
43]. You can collect different rewards, such as extra lives or bonuses, in the final score. This video game is made up of four different types of elements: platforms, bonuses, enemies, and markers. The platforms are those elements in which the player can stand or support to jump. We consider three types of platforms: static, mobile, and bouncing. The bonuses are classified in score, lives, and sub-missions. Four types of enemies are used: a ranged enemy (troll), a flying enemy (eagle), a melee enemy (bear), and a static enemy (lava). Finally, the markers are elements that signal essential points in the game. We have three kinds of markers: start point, mid-level, and endpoint. These elements and their uses in a level are shown in
Figure 1.
When building a level, the designer plans a series of challenges that he/she wants the player to face. With this, the designer seeks to convey emotions and narratives that define a specific game experience. An analytical link between the game features and the player experience has been proposed in [
44] using the concept of affordance. Affordance refers to the opportunities or choices given by the environment to the player. The game design defines its possible uses and makes clear the actions the player may perform. For this reason, we consider it feasible to measure the experience indirectly from the characteristics of the game content.
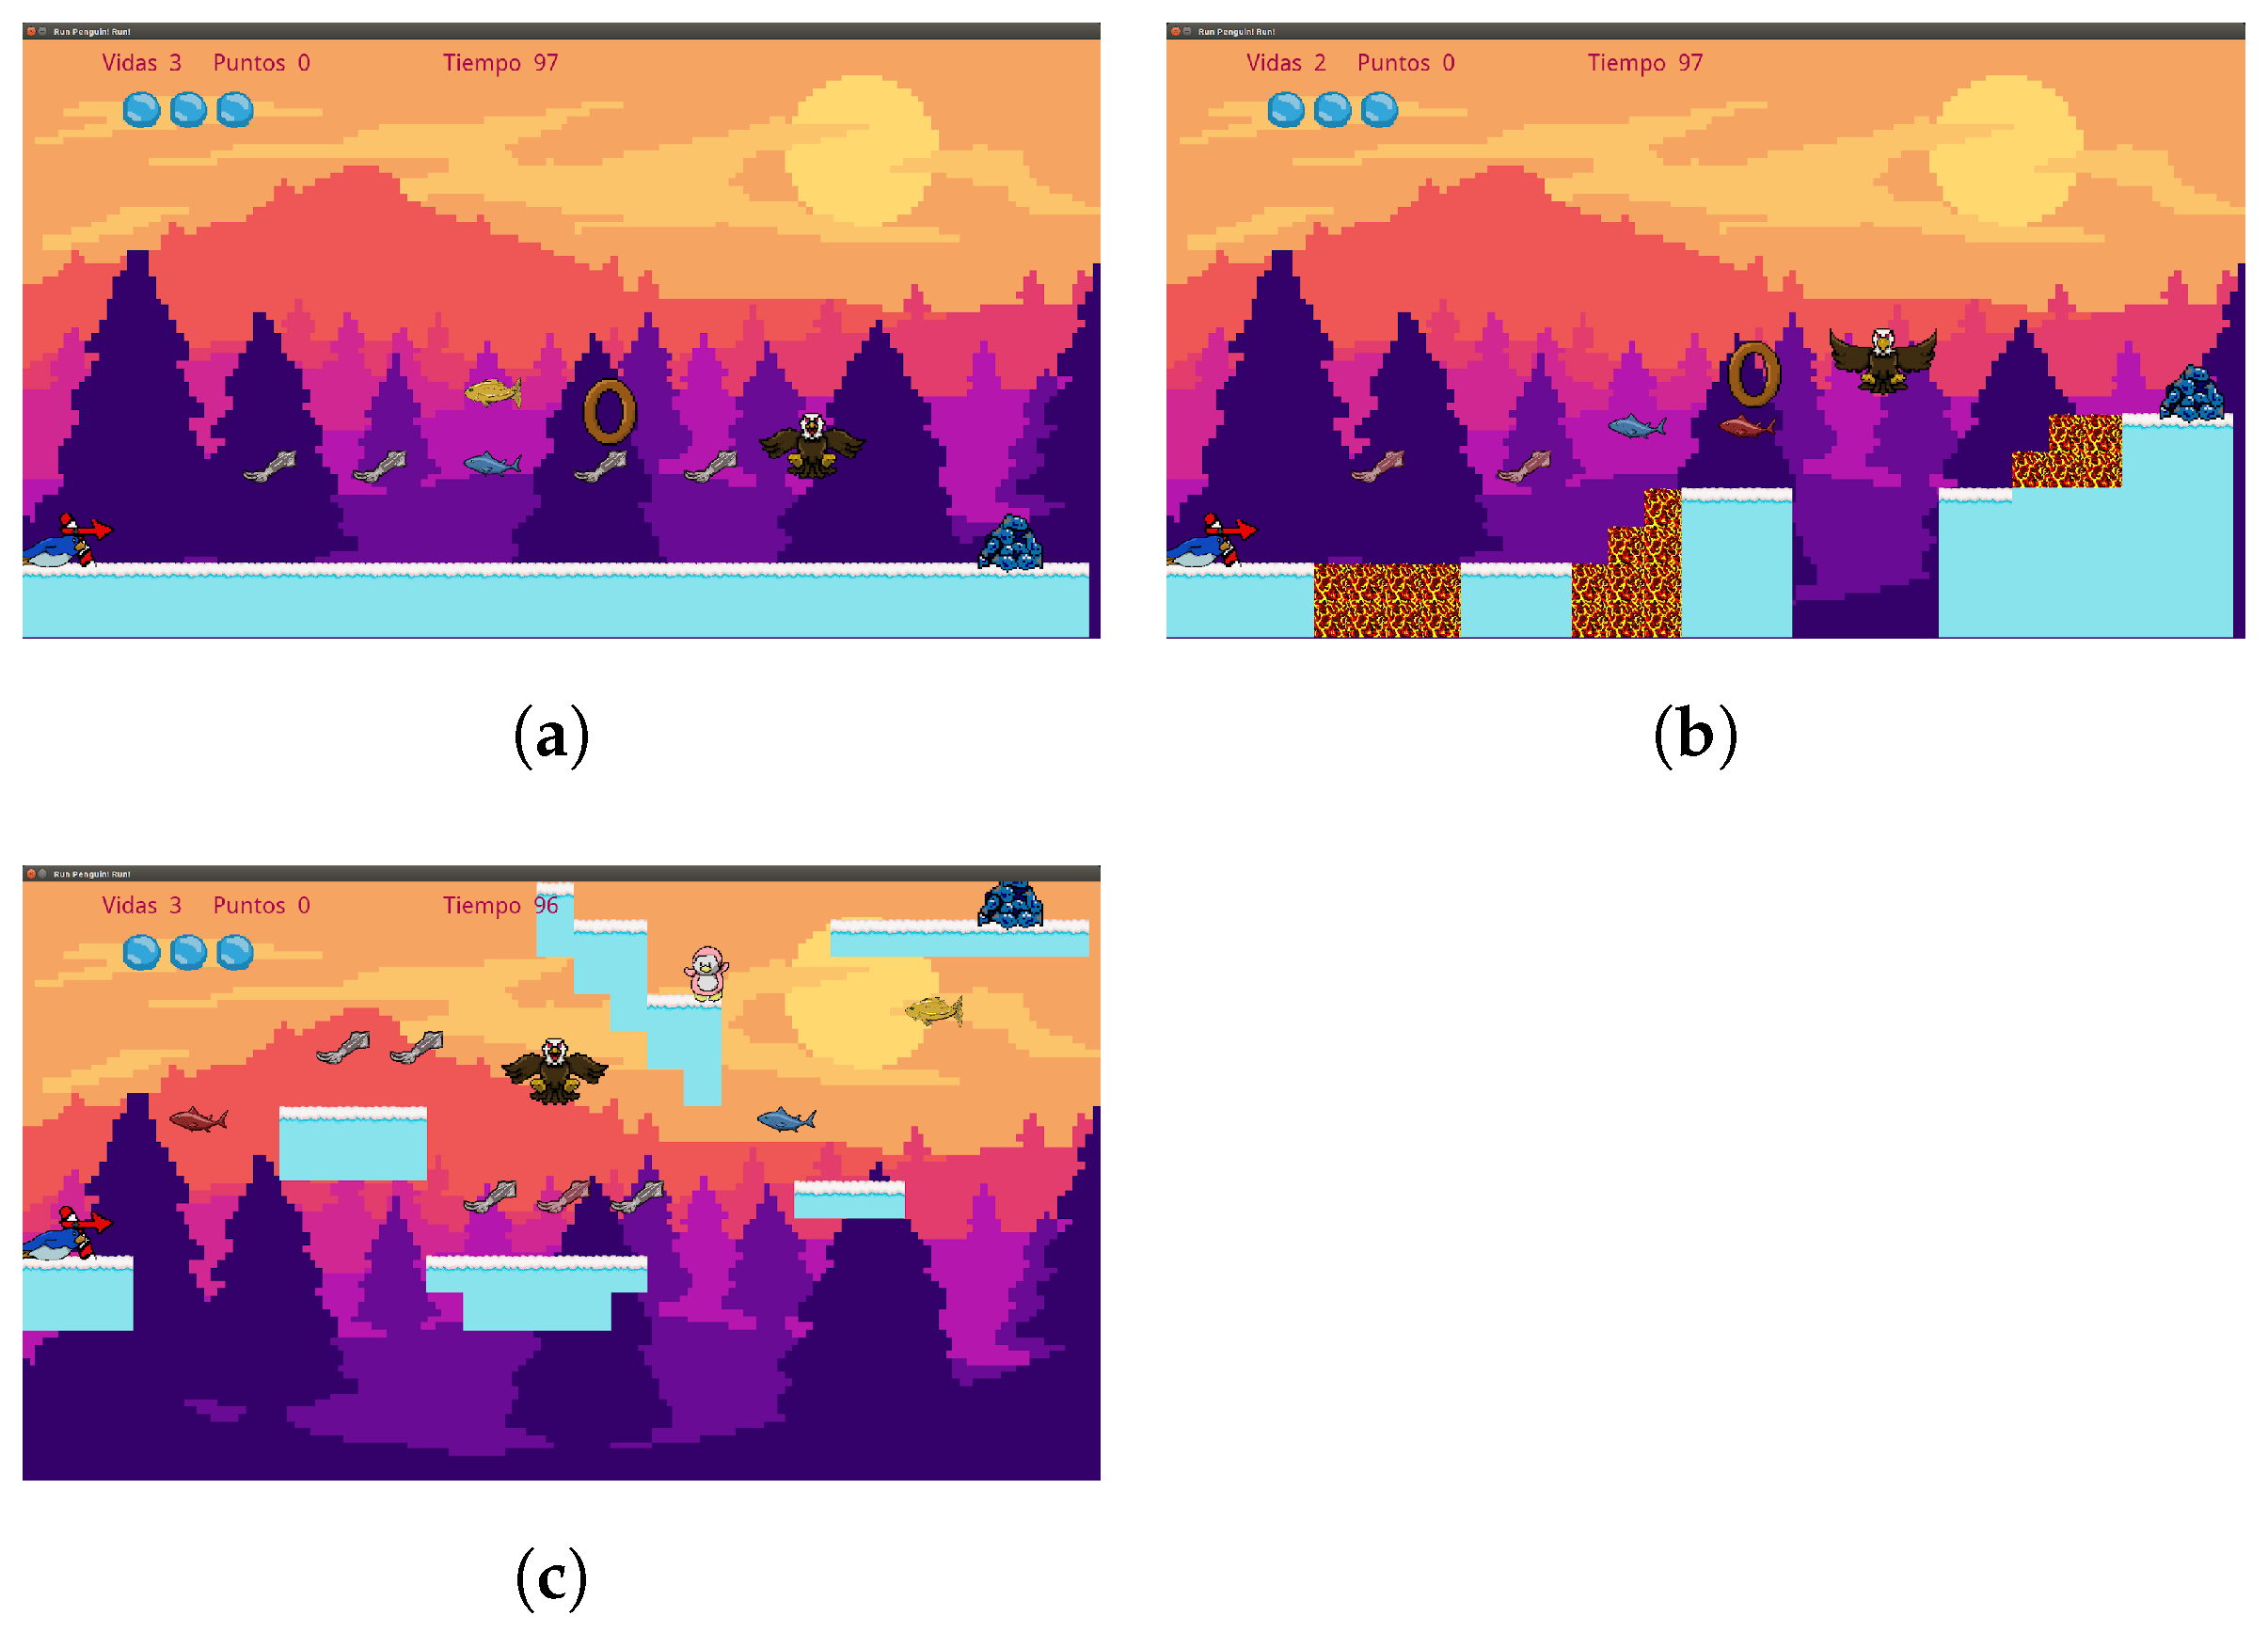
To probe this hypothesis, we analyzed three different experiences denominated: simple, obstacles, and jumps. The simple experience is characterized by flat levels that allow the player to take risks to acquire the greatest amount of rewards without fear of being penalized for some error; they are generally easy to complete and are usually relaxing or restful stages for the player. The obstacle experience conveys to the player the need to dodge multiple enemies to navigate the level generally transmits emotion and requires concentration to complete it successfully, but the player is aware that an error is not definitive and can be corrected. Finally, the jumping experience provides greater emotion and tension in the player since it requires precision to go through the level with the risk that a mistake will penalize him/her with an absolute loss in the game. In
Figure 2, a visual example of each experience is shown.
In the next section, we present our proposed level evaluation process that may serve as the basis of the quantitative measure of the game experience.
3. Proposed Level Evaluation
Content evaluation metrics are necessary to guide the search algorithms and to verify the generated content quality. However, it is difficult to define metrics that capture subjective factors, such as the player’s experience or aesthetics. In [
45], the authors propose to measure the reactions of the players through cameras during gameplay. Despite the acceptable results, this approach is impractical for content generation. In this work, we propose to measure the content characteristics and then search for affordance and its relation to the player experience. A graph-based description has proven useful to describe the game construction at a conceptual level, capturing the interactions between elements [
22,
46,
47]. The proposed methodology splits the game elements into functional objects considering each platform, bonus, enemy, and marker as objects, and analyzes the interactions between them. In the first step, we selected the platform objects as the node-set (
V), and each node was analyzed considering the risk (
) and reward (
). The risk represents the level of threat that may harm a player when standing in a node [
48]. The reward is a measure of the level of bonification a player may have while standing in a node [
49]. The second step consists of determining all possible transitions (
E) between nodes using a reachability metric [
50,
51]. Each transition is described within six measures: risk (
), reward (
), obstruction (
o), precision (
p), motivation (
m), and distance (
d). While risk and reward are the same measures, with one difference they are computed for the threats and rewards a player may have or suffer during the transition. The obstruction measures the degree a platform may interfere during a transition [
52], and the precision measures how exact a jump between platforms needs to be performed [
50,
51].
The reward metric is divided into two types, the
level reward (lrw) which measures the points obtained for reaching the marker rings and completing the level, and the
bonus reward (brw) that measures points earned for defeating enemies and for reaching bonus items (bonuses). This division is made in order to have a better description of the type of reward that the player can obtain on a platform or during a transition. Motivation is the measure of reward attenuated by accuracy, it represents the degree of interest the players will have in transitioning, given the points they can earn and the degree of skill such a transition would entail. Being a measure derived from the reward, it is also divided into
level motivation (lm) and
bonus motivation (bm). Distance is a measure of the length of a line or path between two points. For the purposes of this project, the Euclidean distance was used, which measures the length of the shortest line connecting the two points. Each level is represented by a set of nodes V, Equation (
1), and a set of transitions, Equation (
2). We describe each node
using its object identification number
, the risk and reward of the node (Equation (
3)), and each transition
using the nodes it connects in order
, its risk, reward, obstruction, precision, motivation, and distance (Equation (
4)).
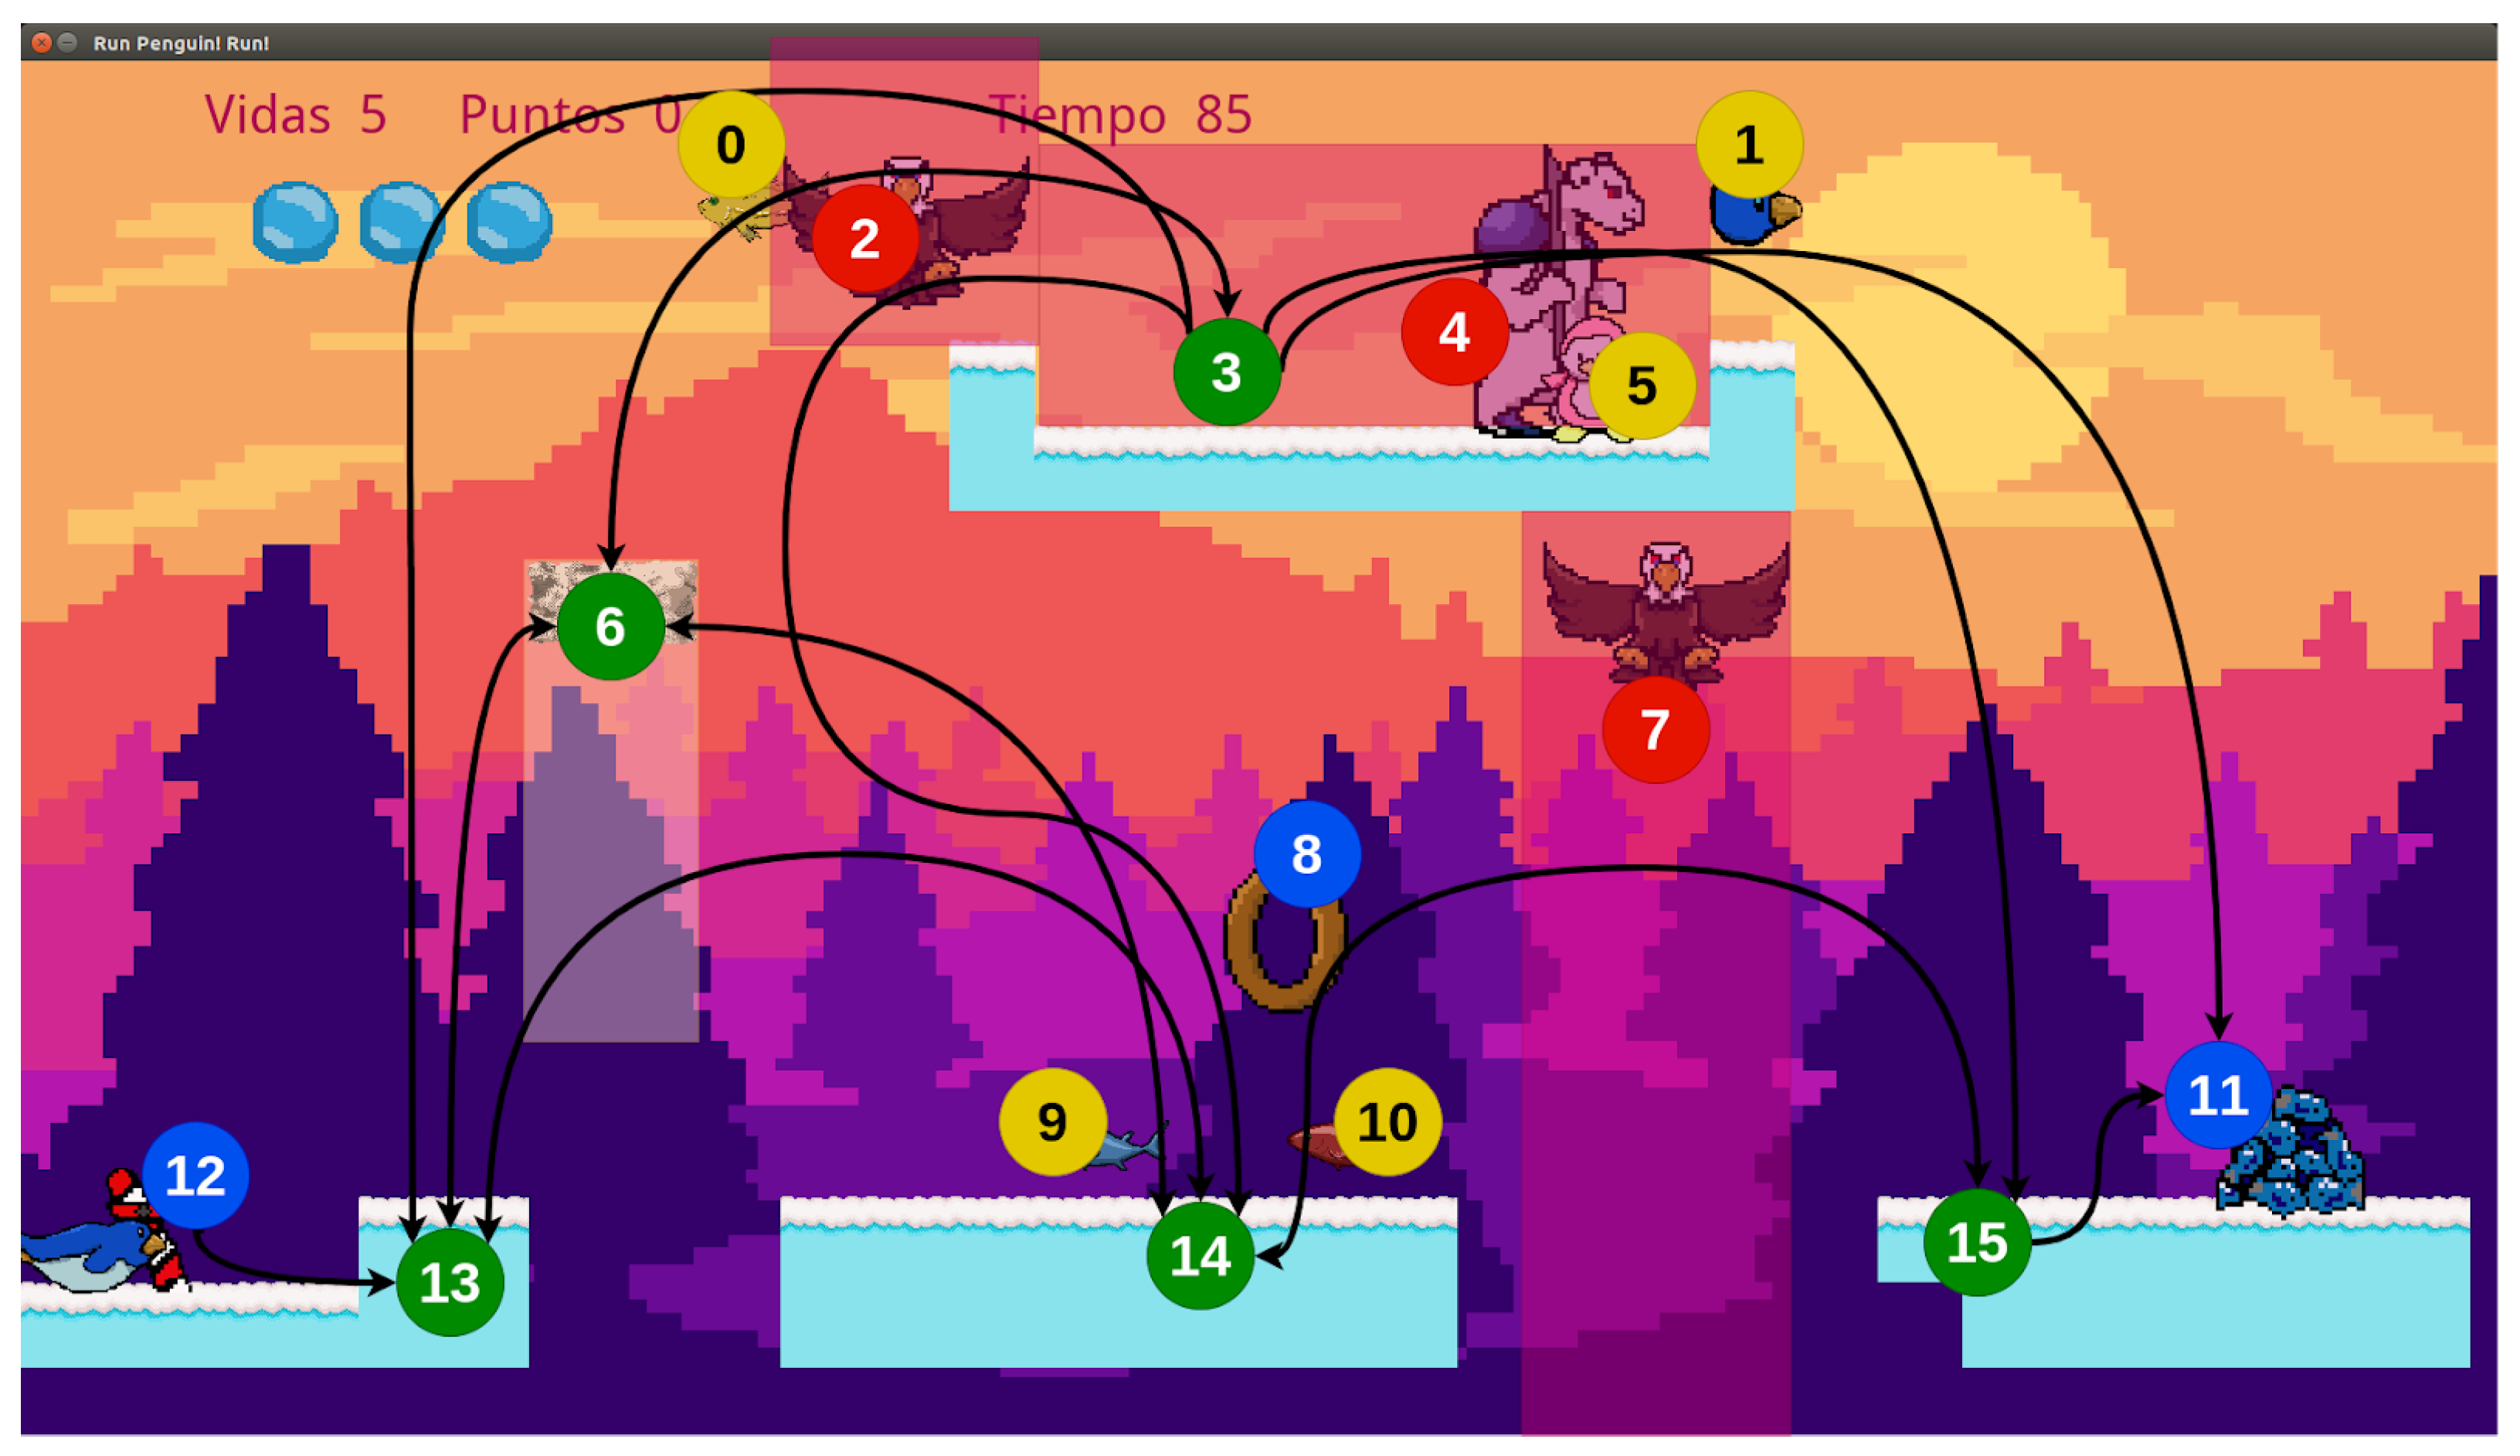
The evaluation process of a game is exemplified in
Figure 3. In it, the nodes or platforms are shown in green, the markers in blue, and with black lines, the transitions that allow the player to go through the level from the starting point to the final point are illustrated. The red circles mark the enemies that are used for risk calculation and the yellow circles mark the bonus used in the reward metrics.
The main objective of the metrics was to characterize the experience of the player while traveling in the game, which motivated us to analyze the route that the player would travel. However, a set of different routes that allow the player to travel from the start point to the endpoint can be found in the graph that describes a level. Each route is defined by a set of nodes and transitions and can represent a different experience for the player. Some routes may be more interesting for the players than others, and some routes may be more useful for the analysis. To decide which routes and metrics are more important for describing the player experience, we analyze all critical routes and weigh their importance. We define a critical route as an optimal route that shows the maximum or minimum values for one of the eight proposed measures (risk, level reward, bonus reward, obstruction, precision, level motivation, bonus motivation, and distance). To find the critical routes, we used the Dijkstra algorithm [
53].
The implemented node selection method (relaxation function) in Dijkstra’s algorithm is strictly “<” to find the paths of minimum sum, and “>” to find the paths of the maximum sum; therefore, to discern between two nodes that can form a critical path, the algorithm always keeps the first one it found.
When executing Dijkstra’s algorithm, all possible critical paths in the level graph can be calculated; that is, those that have a maximum sum and a minimum sum in the measured characteristic, for example, one of these paths would be the “maximum risk” path, the one whose sum of risk, from the initial node to the end of the level, is the highest possible. However, it is necessary to select the route or routes that allow the game experiences to be identified. For our case study, the player must always travel interacting with all level markers (doors (rings) and goal); therefore, the route of interest is the one in which these markers are always present. Therefore, the “maximum level reward” route was selected, as it is the route in which the maximum sum—due to the points received for reaching the markers—is accumulated, i.e., they are always present in it.
4. Feature Selection
Once the critical path is established, it is necessary to define which measurements will be taken from each characteristic and which will be useful to identify the gaming experiences. For this purpose, a set of three example levels was created for each of the predefined game experiences, resulting in nine example levels. These levels were evaluated against the eight metrics and the path of interest (maximum level reward) was calculated. For each metric, three types of data were stored: the maximum value, the minimum value, and the rhythm (the latter is a measure of the number of peaks and valleys of the curve drawn by the measured values of said characteristics along the evaluated route), giving a total of 24 measures on the critical path, from each level. Then, a file containing the measurements (pace, maximum, and minimum value) taken from each level was formed, adding a class label, corresponding to the type of game experience to which each level belonged. Based on this dataset, the extra-trees classifier algorithm was used as a dimension reduction method, which in this case serves to determine the most convenient measurements of the 24 taken, to be used to identify game experiences. The extra-trees classifier is a classification algorithm that generates a set of decision trees, where each tree is built from the analysis of a random sample of the original dataset. Each tree calculates the Gini index of each characteristic to determine how much of a relationship they have with the class label; the lower the value of this index, the greater its relationship with the class label. The algorithm averages and normalizes the Gini indices of each generated tree, giving, as a result, the Gini importances, for which, the higher its value, the more relationship a characteristic has with the class label; the sum of all the importances is equal to 1. This measure is used in the extra-trees classifier algorithm as the decision-making mechanism.
To identify the measures of interest, this algorithm was run to learn how to classify the levels of the aforementioned file, the one that contains the measures of the critical path. For our case, the classification task was not relevant, but the importance of each characteristic, which were stored in a new file.
Finally, the top five values of importance were chosen to identify the gaming experiences, which are: rhythm of level reward, rhythm of level motivation, rhythm of risk, maximum value of bonus motivation, and rhythm of level reward. Additionally, it was decided to add the measure of “maximum distance value” since it is considered to be related to the visual harmony of the elements of the level, although its calculated importance was not high.
5. The IORand Algorithm
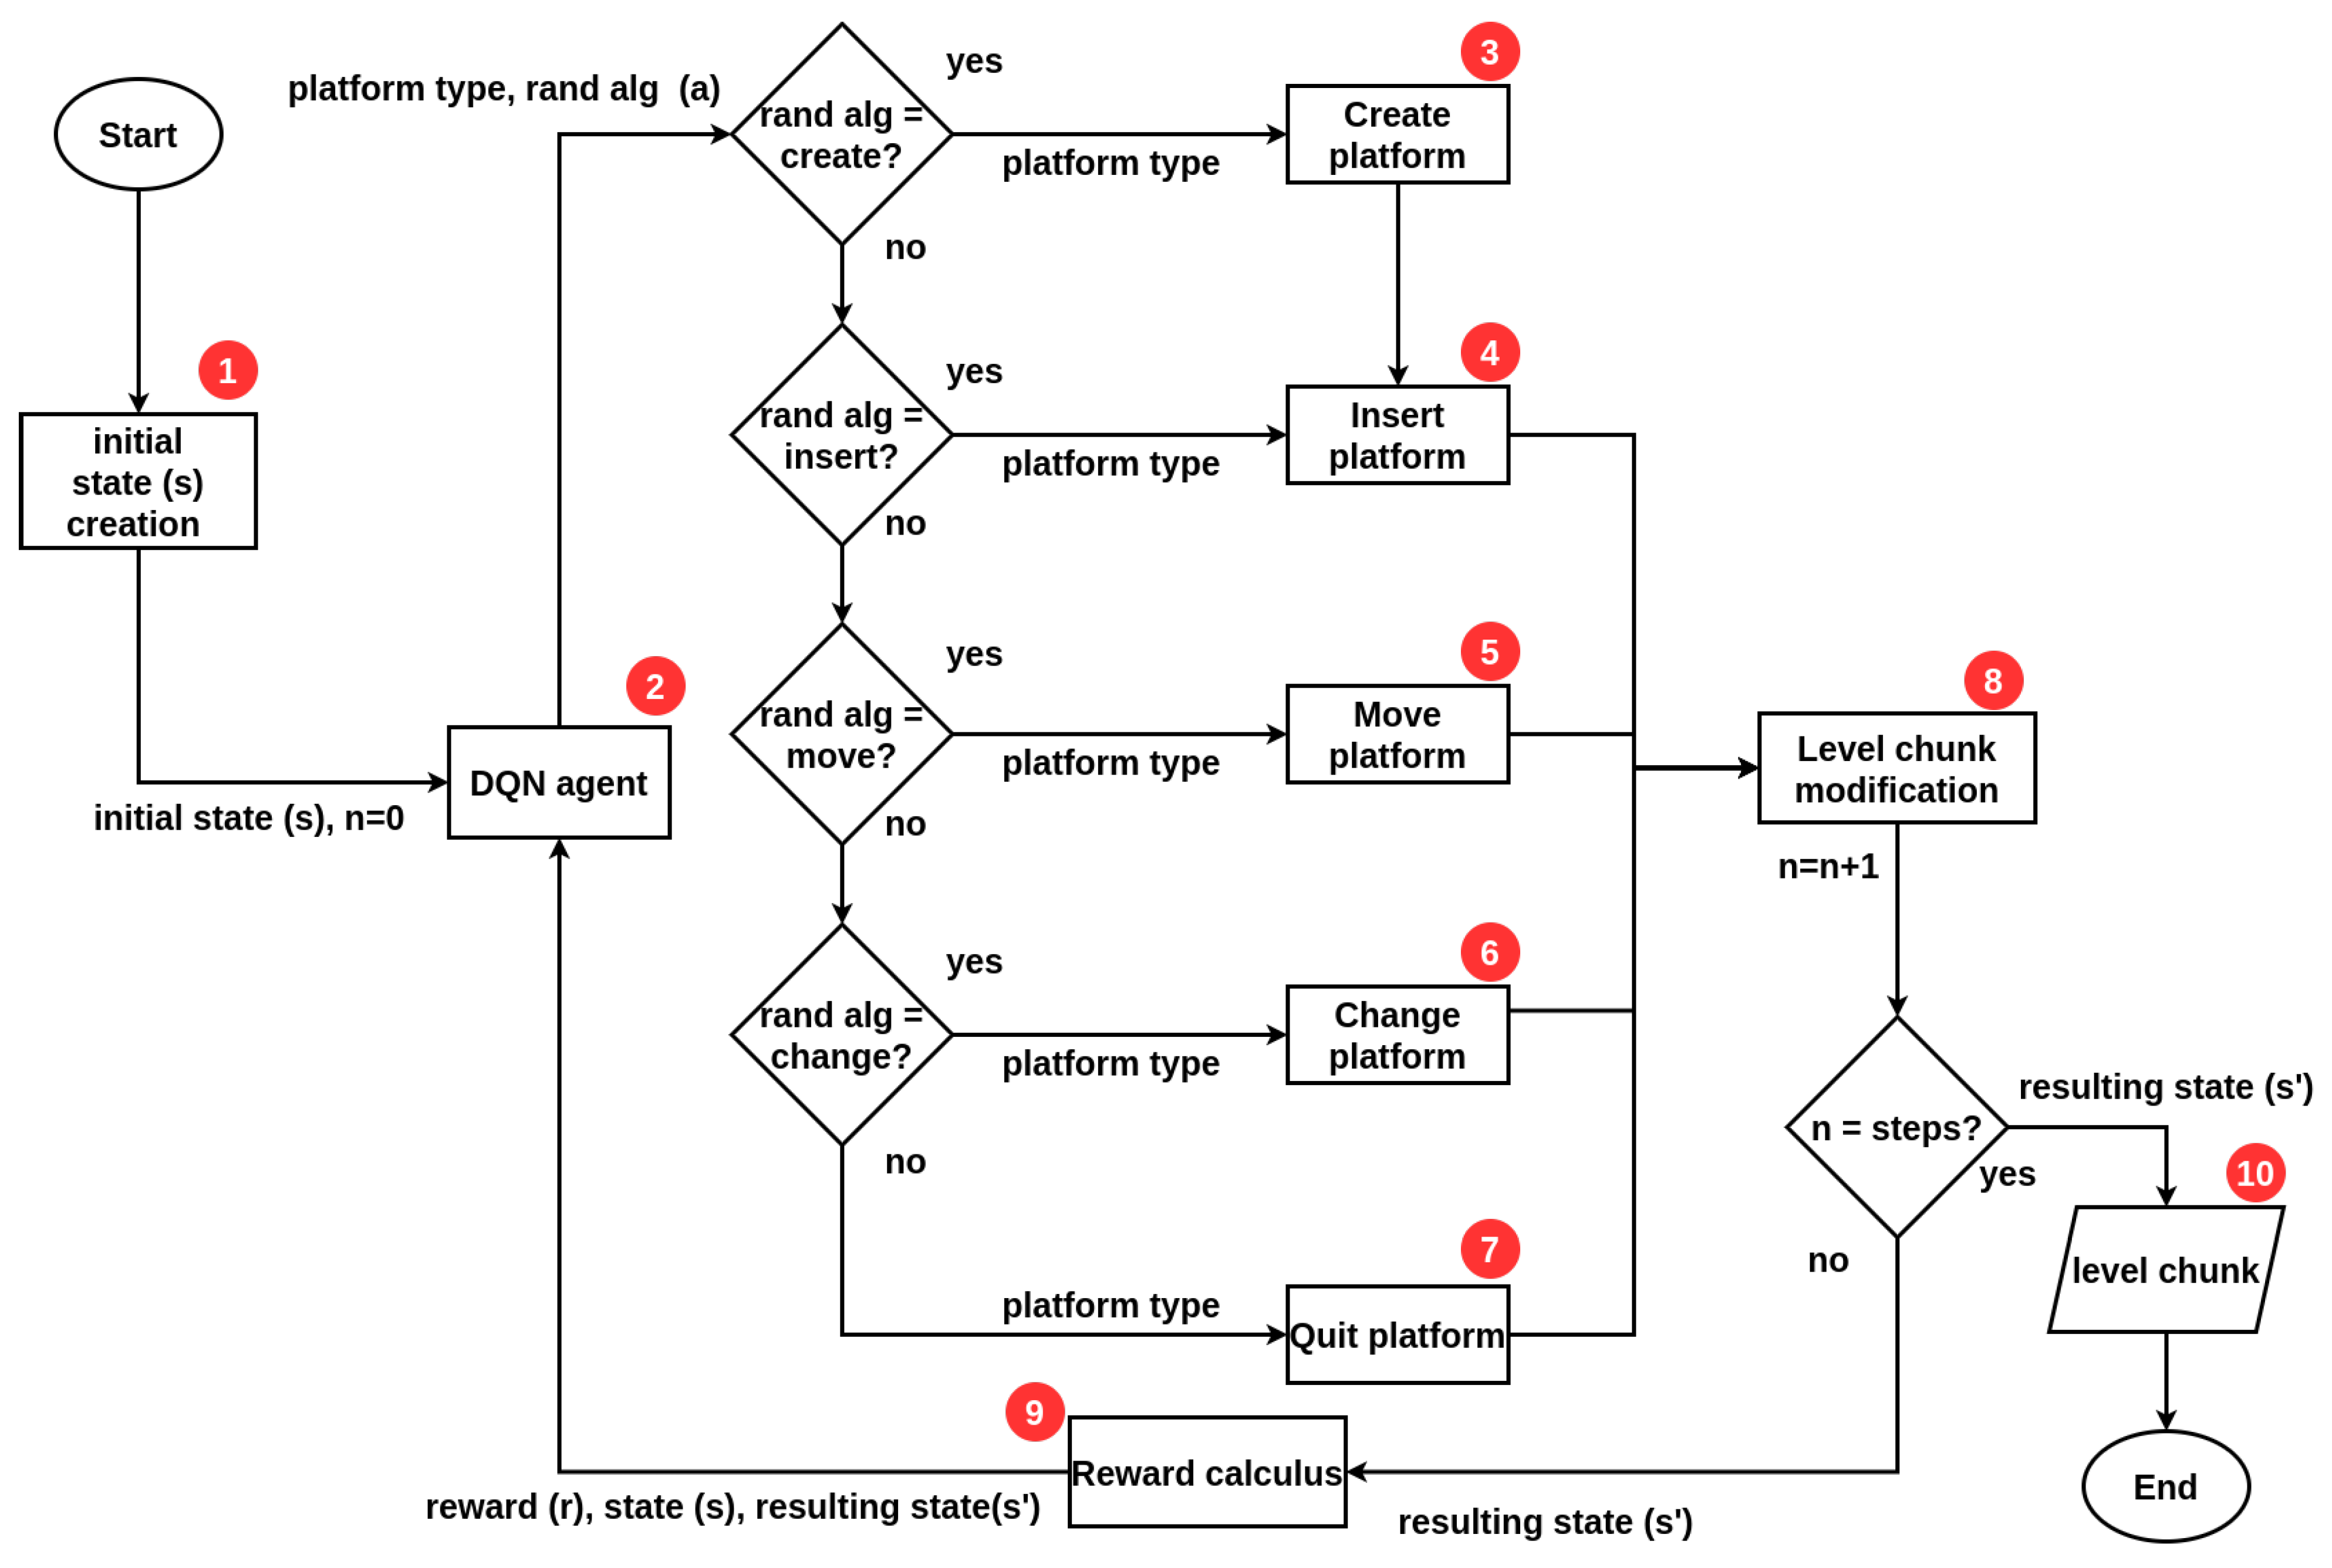
The PCG algorithm proposed in this work is based on the combination of two different approaches, first, the search-based approach, with the use of the deep Q-network (DQN) reinforcement learning (RL) algorithm, and second, by the random generators approach, with the semi-random content generation algorithm. The flow of the IORand algorithm is shown in
Figure 4.
Our algorithm starts at block 1 by initializing the step counter (n) and generating an initial state (s), i.e., a slot to create a “Pingu run” level. This level is sent to the agent in block 2, as the current state of the environment in its first step. The agent decides which semi-random generator will be executed and with what type of platform (one of those defined in
Figure 1b). This pair, type of platform, and generator, make up the action (a) of the agent. Depending on the semi-random generator that was chosen, one of the blocks from 3 to 7 is executed, with the type of platform specified. Each one of these blocks (3–7) is a semi-random content generation algorithm, which changes the environment according to an action that a human designer would do (create, insert, move, change, or remove platforms). After the selected generator calculates its effect on the environment, it is implemented in the level slice at block 8. At this point, one step of the algorithm is complete, so the counter is incremented. If “n” steps have been executed, where “n” is defined by the user, then the algorithm terminates and the resulting level slice (s) from performing the agent action is stored on a file (in JSON format) in block 10, otherwise this state is sent to block 9, where a calculation of the reward is made, to indicate to the agent how good his/her action was to achieve the desired gaming experience. Block 9 sends the reward (r) and the current state of the environment (s), which is also the resulting state (s’) of its previous action. Both the reward (r) and the resulting state (s’) are used only during the training phase; once the agent is trained, it is only necessary to send the current state of the environment (s).
The idea of this hybrid algorithm is that the part based on reinforcement learning guides the content generation, such as an orchestrator, which seeks to maximize the value of an objective function, which in this case should reflect that the generated content provides a certain gaming experience to the player. Meanwhile, the part based on random generation provides a mechanism to increase the diversity of the results generated thanks to the RL algorithm.
Every RL algorithm is mainly made up of three parts—the agent, the environment, and the reward. The agent is the “intelligent” part of the algorithm; it is capable of interacting with the environment, modifying it depending on the actions it decides to execute. The goal of the agent is to learn a certain behavior in its environment. To do this, the environment feeds it back with information on task completion and the state of the environment itself. This information must be processed by the agent to adjust its decision-making process (policy), so that this adjustment serves to the decisions one makes, to help one accomplish the objective task. The environment is linked to the specific problem or task that the agent is expected to learn to solve; in our case, the environment is a space where “Pingu run” level slices can be built. The reward is a number that represents how well the agent performs in solving the specific task; this reward is calculated by analyzing the fulfillment of the objective task derived from the change in the environment due to the agent’s actions in it. In our case, the reward should serve to indicate that a certain gaming experience is provided in the level slice of the environment.
Next, each part of the proposed algorithm is explained in greater depth. First, the design of the environment is presented. Next, the reward function used during training to identify gaming experiences is explained. Finally, the agent is introduced, explaining each of the DQN components in our implementation.
5.1. Environment
The environment is that in which the agent interacts and that contains the problem or task to be solved in its structure. The agent modifies the environment through actions, causing a change in the state of the environment. To make its decisions, the agent receives an observation of the current state of the environment, which can be a complete or partial representation of the said state, depending on the type of training or learning that is sought in the agent.
Defining the environment for our case study means defining its states and observations. Since the problem to be solved is the generation of a space in two dimensions (level slice), the state and the observations are a matrix representation of the said space, in which each square of the matrix corresponds to an element of the game used to build the level. For the purposes of this project, these matrices have 16 rows and 29 columns, which are equivalent to the number of elements that can be seen on the screen.
These arrays can contain only the alphanumeric representations of the game elements to build the “Pingu run” levels.
For practical purposes, the initial state is one of these arrays built under the following conditions: the initial and final points are predefined and cannot be modified by the agent. A predefined number of floor platforms are placed in the space between the start and end platforms.
5.2. Reward
Definition of the reward. The reward function is the indicator of how close the agent is to meeting the goal, which is defined from an evaluation of the state to which the agent brings the environment due to its actions. Usually, the higher the reward, the better the agent’s performance.
For our case study, the reward must evaluate the performance of the agent to generate a level that makes the player feel a specific gaming experience.
To achieve this, we propose the identification of game experiences based on the type of interaction that the player will have with the level along the critical path. For this, it is proposed to evaluate the characteristics of the level, measured from the use of the designed metrics, evaluating these measurements along the critical path of interest. The idea of this evaluation is to ensure that the rhythm and the range of values (maximum and minimum value) of the characteristics are close to those of a prototype level of a gaming experience. In other words, our evaluation of compliance with the gaming experience is based on the comparison of the measured/evaluated level with an ideal/prototype level, where the comparison is made through the rhythm and the range of values of the characteristics of interest.
Therefore, our reward function is divided into two parts, the “pacing accuracy” and the “value range accuracy”; they are defined as “accuracy” because the closer the measured values are to the target values. The greater the certainty, the evaluated level will provide the desired gaming experience. For practical purposes, we set the reward values in the range of [0, 1], where ’0’ is the worst performance and ’1’ is the ideal performance.
Rhythm accuracy. For this part of the reward, a bell-shaped function was used, whose value was calculated based on Equation (
5). For this function, ‘
’ is the rhythm of the
i-th feature, ‘
’ is the desired variance of the rhythm, which serves to widen or reduce the width of the bell, making the evaluation of the rhythm more relaxed (wider) or tighter (smaller), ‘
’ is the target beat, indicating that the bell will have its center and, therefore, maximum value, at this point.
This function is normalized to fit its values to the range [0, 1]. Therefore, the first accuracy function for the reward is shown in Equation (
6).
Value range accuracy. For this portion of the reward, the goal is to assess how close the range of measured values is to the range of target values. For this purpose, two different comparisons between the ranges are proposed. To define how equal two ranges are, it is proposed to compare the amplitude of the range and its center, the closer two ranges are in terms of their centers and their amplitudes, the more similar they are. Let
be the maximum measured value,
be the minimum measured value,
be the maximum target value,
be the minimum target value; then the first of these comparisons is shown in Equation (
7), the amplitude similarity (
), which is given by 1 minus the normalized distance between the amplitudes.
The second comparison is shown in Equation (
8), the similarity of centers (
), which is given by 1 minus the normalized distance between centers.
These equations are valid if and only if
, otherwise the Equations (
9) and (
10) should be used
Finally, the range of value accuracies is shown in Equation (
11)
In addition to these two accuracies, a penalty factor
p was added to the reward function, which acquires a value of 0.5 when the generated level is not playable (that is, the end point cannot be reached from the starting point), and a value of 1 when it is. Then, the reward function
R for a feature is a weighted sum of both accuracies
and
, attenuated by the penalty factor
p, as shown in Equation (
12), where
. The weight values
and
allow one to define which accuracy is more important—that of the rhythm or that of the range of values.
Given a game experience, a reward must be calculated according to Equation (
12) for each characteristic of interest and finally make a weighted sum of each of them. The reward of a gaming experience is defined in Equation (
13), where
is the weight of the
i-th feature and
is the reward function of that same feature, where
.
Prototype levels. To calculate the reward value of each of the defined game experiences (simple, jumps, obstacles), it is necessary to set their target values (
,
,
,
,
,
and
w). The goal is that, when adjusting the reward, Equation (
13), using the target values of a specific gaming experience, and this equation is used to evaluate a level of that same gaming experience, a value close to 1 is obtained, indicating that the said level meets the desired gaming experience, and also that when evaluating a level that provides another gaming experience, the calculated value is close to 0, indicating that the level does not meet the desired gaming experience. Therefore, it is necessary to find an adequate combination of target values for each game experience, in order to maximize the reward at the levels of that same experience and minimize the reward at the levels of the rest of the experiences.
To determine the target values for each game experience, we used our three example levels for each game experience defined (simple, obstacle, jump). We then applied our evaluation process on each of them, obtaining the graphs for each example level (see example in
Figure 3). From those graphs, we analyzed the rhythm and value range through the route of interest (maximum level reward), of the selected important features (level reward, level motivation, risk, bonus motivation, bonus reward, and distance). After proposing various sets of target values, those shown in
Table 2 were found. In general, the values of rhythm (
), variation of rhythm (
), maximum value (
), and minimum value (
) were defined based on the most frequent value or in the average of the measurements observed in the example levels. On the other hand, the weightings of the rhythm accuracy (
), value range (
), and weight (
w) were proposed when considering the Gini importance of each measure. If one measure has a greater Gini importance than another, then its weight (
w) should be greater in the reward function. To do so, we summed the Gini importances of each selected feature and calculated its proportion in that sum to obtain its weight (
w). If the rhythm of a feature has a greater Gini importance than its maximum or minimum value, then the rhythm accuracy (
) must be greater than the value range accuracy weight (
), and vice versa. For this purpose, we experimented with various (
) and (
) values, considering the Gini importances and looking for a better reward evaluation for the example levels.
It should be clarified that, during the search for these reward functions, it was identified that the bonus motivation, in the case of the simple game experience, caused a misidentification of the game experiences, reducing the reward of the level corresponding to the desired experience; therefore, for that experience, the “bonus motivation” feature was removed from the reward function.
Based on these target values for the reward functions, the crafted levels obtained the evaluations shown in
Table 3, which shows that each level receives a reward close to 1 when evaluated with the reward function corresponding to the game experience and an evaluation close to 0 for the functions corresponding to the other experiences, thus fulfilling the objective set for the reward function and the respective objective values for each game experience.
5.3. Agent
The agent is the part of the RL algorithm that is responsible for solving the problem. To implement this module, there are a variety of algorithms that can be used; in this project, the deep Q-network (DQN) algorithm was chosen. In short, this algorithm uses an artificial neural network to regress the expected reward; that is, this ANN estimates how convenient it is to execute each possible action in a given state.
The DQN algorithm works as follows:
The agent receives an observation of the environment. In our implementation, this translates to a 16 × 29 matrix with symbols representing game items or empty spaces in the level.
If necessary, the observation is preprocessed to be propagated by the ANN; in our implementation, the symbols of the matrix are already in numerical format, so no preprocessing was necessary.
This numerical matrix is propagated through the ANN and a vector whose components have values between 0 and 1, each associated with a possible action, is obtained as a network output. The closer this value is to 1, the greater the reward that the ANN has estimated for said action.
The -greedy policy is applied, in which the agent chooses an action at random with probability and with the complementary probability, 1-, chooses the most convenient action according to the ANN estimation.
The chosen action (a) is executed on the observed state of the environment (s), causing a transition to the resulting state (s’) and the calculation of a reward (r).
The agent receives, from the environment, the observation of the resulting state and the reward of its previous action.
The agent stores the data of the previous transition, the observed state (s), the chosen action (a), the resulting state (s’), and the reward obtained (r).
To adjust the weights and bias of the neural network, it is necessary to:
- –
Store transitions (agent experience) in a replay memory.
- –
Once there is a certain amount of data in memory, the transitions stored in it are randomly queried to train the agent’s neural network. The adjustments of the weights and bias are made only in the neurons associated with the chosen action in each transition.
With each training step, the value of is reduced by a percentage of its current value (our implementation multiplies it by 0.996).
To better understand the behavior of the agent, it is necessary to delve into the design of the neural network and the repetition memory used for its training, in addition to clearly defining the action space.
Replay memory. The replay memory acts as a training set for the agent’s neural network based on the DQN algorithm. In our implementation, this memory was set to store 150,000 transitions. These transitions are stored in the form of a row, in which, if an additional element arrives that overflows the row, then the first stored element is eliminated and the new one is stored; preserving the most recent experience. This memory is randomly queried to see if the inputs to the neural network are uncorrelated.
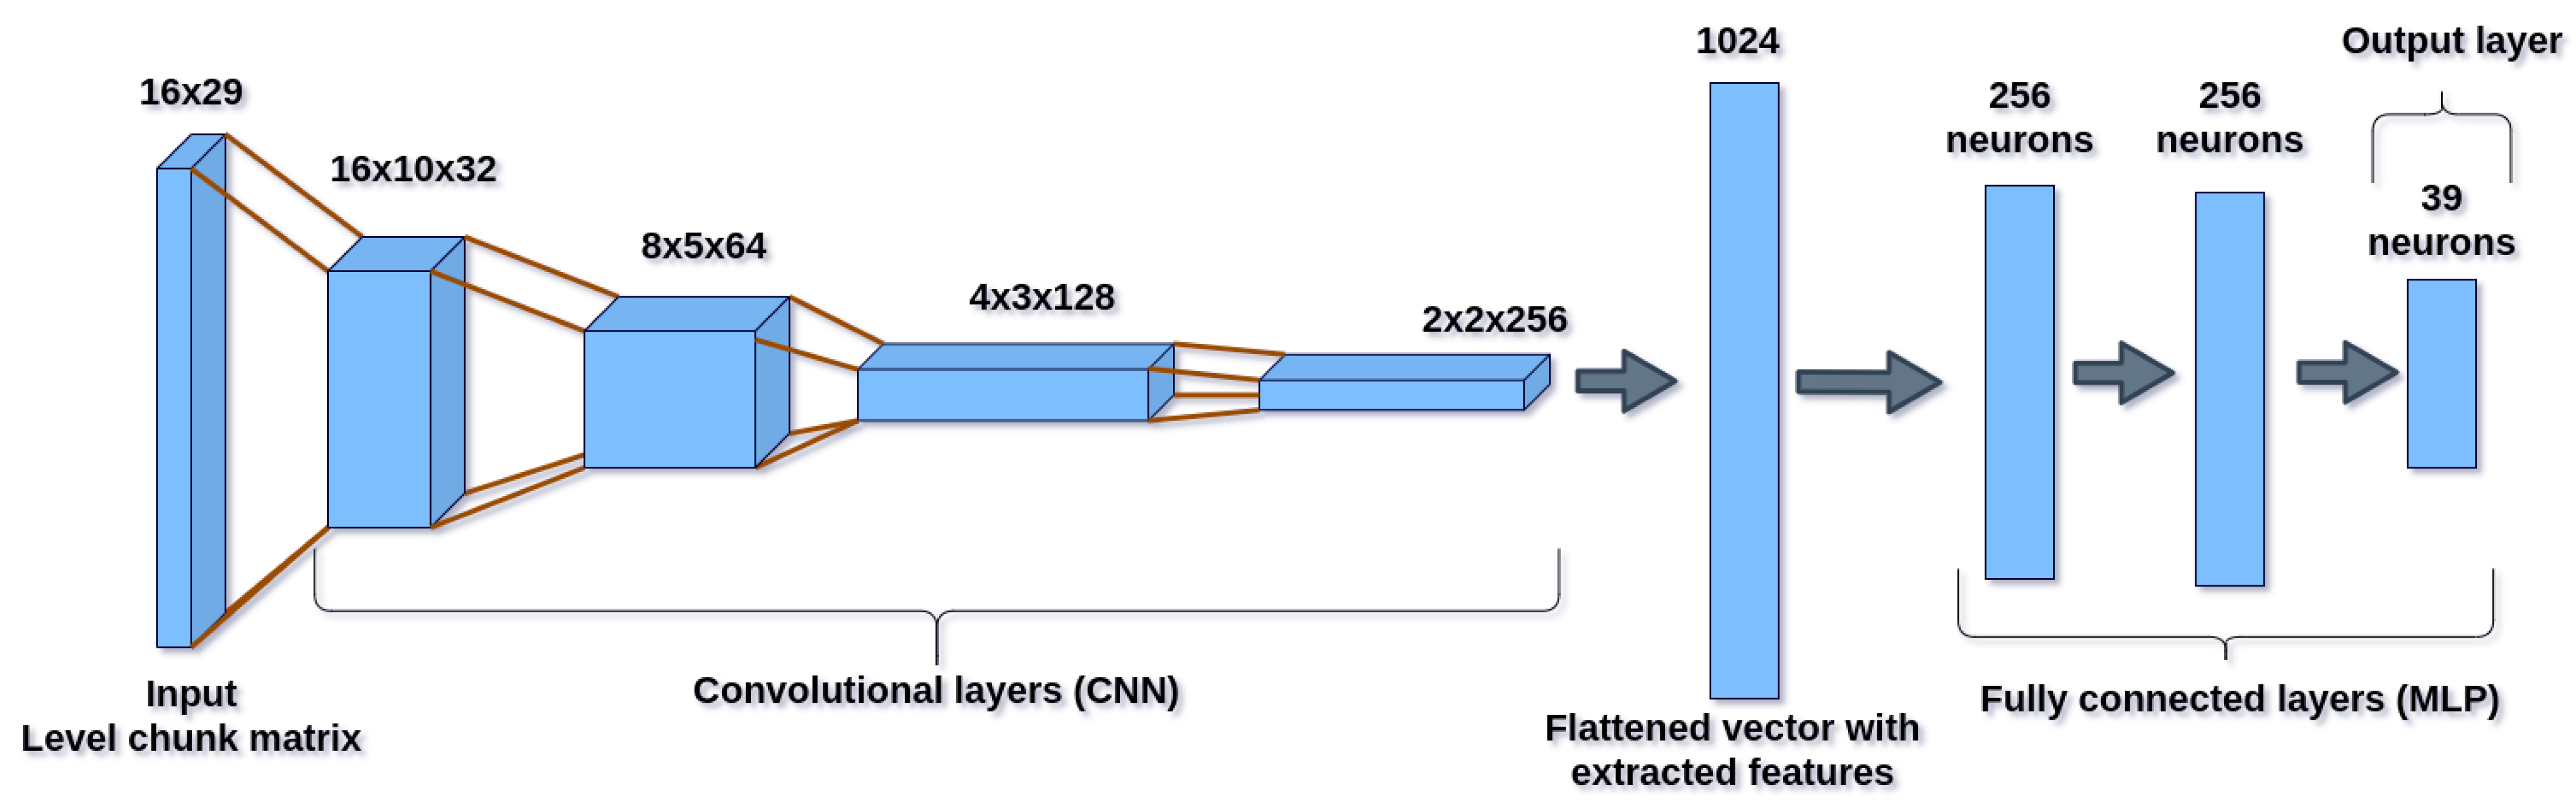
Implemented artificial neural network architecture. For our implementation, a convolutional neural network (CNN) was used in conjunction with a vanilla network. The CNN fulfills the function of processing the level matrix, detecting spatial relationships in it and extracting features from the input data. The vanilla network fulfills the function of the regressor, processing the features extracted through the CNN and calculating from them, the expected reward for executing each of the actions on the observed state (network input). The architecture of the presented network is shown in
Figure 5.
A CNN was used because it was considered the best deep architecture option given the nature of the states of our environment, which contained a representation of the content displayed on the screen and, therefore, considered a type of a reduced image of the level. Therefore, a CNN was chosen, given its proven image processing capabilities. The output layer has 39 neurons, one for each possible action that the agent can perform. Next, it will be explained why the action space has that dimension.
Action space. The action space is everything that the agent can choose to do. The actions alter the environment causing a transition of states in it.
In our case, the agent can choose to run a semi-random content generator using a specific block type. In this way, the agent only chooses what modification will be made and on what type of content; however, it is not the agent who directly makes the modification.
The semi-random algorithms used seek to simulate actions that a human designer can perform on a level, for which the generators are proposed to: create and insert a block, insert a block, move a block, remove a block, change the type of a block, and change the address of a block.
In
Table 4, the relationship between the type of point block and the generator algorithm that can be executed on it, is shown. This relationship between elements and generators to execute on them arise from an analysis of the actions that each generator implies. For example, the generator that “changes direction” modifies the label of the game element to indicate that its movement will be another; this action only makes sense for elements that can move in the game. By counting the number of ’X’s in the table, the 39 possible actions are obtained, the product indicating—to each of the six semi-random generators—which of the 11 types of element it will use at a given moment.
5.4. Semi-Random Content Generators
Each of the generators performs a specific action in the environment. Below is an explanation of the effect each generator produces.
Move. The agent detects platforms from the map array, then creates a list of platforms of the selected type. From this list, the generator randomly chooses an element and moves all of its blocks to an adjacent position. This action is only executed if there are enough empty spaces to place the selected element in the adjacent position.
Remove. The agent detects platforms from the map array, then creates a list of platforms of the selected type. From this list, the generator chooses an element at random and changes all of the blocks that compose it to empty spaces.
Change (type or address). The agent detects platforms from the map matrix, then creates a list of platforms of the selected type. Of these platforms, the generating algorithm chooses one at random. Depending on the type of platform, there is a list of possible values that it can take. The algorithm selects a new type at random, making sure it is different from the old one.
Insert. The algorithm determines the space required to place the selected platform on the level slice, so to place the platform, it picks random coordinates in the space between the starting and ending platforms, until it finds one that is surrounded by as much empty space as required; space was determined, inserting the label(s) that make up the platform.
Create and insert. In order to create platforms, the generator must be told the dimensions of the platform to be created, as well as the number of blocks that must be used to build it. This information is provided by the user before executing the PCG algorithm. To create the platforms, the algorithm creates an array with empty spaces of the specified dimensions and selects a random coordinate within that array. In this coordinate, the generating algorithm inserts the label corresponding to the type of platform selected. Then, in positions adjacent to the platform being created, adds the label again. This process is repeated until adding as many labels as the number of blocks defined or until the matrix is filled. Once the platform is created, the previously defined “insert” method is executed.
All generators are subject to a maximum number of platform restrictions. This limit is set by the user before running the algorithm.
6. Metrics to Evaluate PCG Algorithm Performance
To evaluate the performance of the proposed algorithm, the following metrics are used for three of the criteria mentioned in
Table 1, playability, novelty, and iterativity, which will allow us to compare our proposal with the state-of-the-art, and add a measure of game experience and one of effort. Although the rest of the criteria (generation process, determinism, controllability) must also be evaluated, they acquire a value according to the design of the algorithm itself. The criteria of this evaluation and the way to measure them are as follows:
Playability. This measure indicates if the generated level is playable or not; that is, if the player will be able to finish the game. In this case, it means that a level is playable if the player can obtain the penguin from the start point to the end point of the level. It is a binary metric; this characteristic is fulfilled or not, so the possible values are {0, 1}.
Game experience. It refers to the fulfillment of the objective task; that is, the levels provide the desired gaming experiences. To measure this feature, we use the reward evaluation obtained at each generated level. Our reward returns values in the range [0, 1].
Novelty. This measurement requires the calculation of the degree of difference between two slices A and B, which is obtained by calculating the number of operations necessary to transform slice A into slice B. This degree of difference is normalized with respect to the maximum number of operations to transform one string into another; therefore, their values are in the range [0, 1]. The novelty of a slice is the average degree of difference between it and the rest of the slices produced by the algorithm in one run.
Effort. For this measure, the degree of difference is also used. The effort of a slice is given by the degree of difference between it and the initial slice from which it was produced, indicating the degree of changes necessary to reach the final level from the initial point of content generation.
Iterativity. It relates to the number of iterations needed by the algorithm to produce content.
To measure iterativeness, we establish four ranges given a different number of actions that an agent can perform to produce a level. For the experiments, the iterativity ranges were established, associated with the number of actions according to the following relationship:
To adjust the rest of the measurements to these four ranges, the values associated with each of them are shown in
Table 5. With the exception of gaming experience, the rest of the measures are equally distributed (in two, 0 and 1, or four ranges of the same density, between 0 and 1). An exception is made for that particular metric because the reward value equal to 0.72 was defined as the target gaming experience fulfillment threshold, taking into consideration the minimum reward values earned by the crafted levels in the set example data in
Table 3.
7. Experiments and Results
Each agent was trained for 2000 epochs, with 300 steps per epoch. After every five steps, the agent executes a learning step, adjusting its ANN, taking 64 random transition examples from its replay memory. As input, each agent received their target values, as shown in
Table 2, for the reward calculation. On every training epoch, each agent started with its own initial state of the environment, and it was the same through the 2000 epochs. Once the three agents (one for each game experience) were trained, experiments were carried out with each agent for each of the iterative ranges presented. In each experiment, the agents generated 50 level slices and each was evaluated with the metrics of gaming experience, playability, novelty, and effort.
For this article, the best experimental results are presented, which were obtained with high iteration, i.e., with 500 actions. Compared to those presented, the rest of the experiments did not show any relevant improvement or data of interest.
In
Table 6, the performance of each agent in the experiment of 500 actions is presented. This table shows the percentage of level slices whose evaluations fall into each of the ranges presented by metric. From this table, it stands out that the three agents produce a higher percentage of playable levels than non-playable ones. Moreover, regarding the achievement of the target gaming experience, most of the slices produced are in the moderate and low ranges, between 60% and 70% of the levels are in those ranges. For the novelty value, the agents maintained the highest percentages of the levels in a moderate range. In addition, it should be noted that the ’obstacle’ agent had an outstanding performance since 100% of the slices it generated were in the range. moderate novelty. Finally, we can see that effort seems to be related to novelty, as their results are quite similar to the naked eye, suggesting that a slice with high novelty also requires high effort to produce.
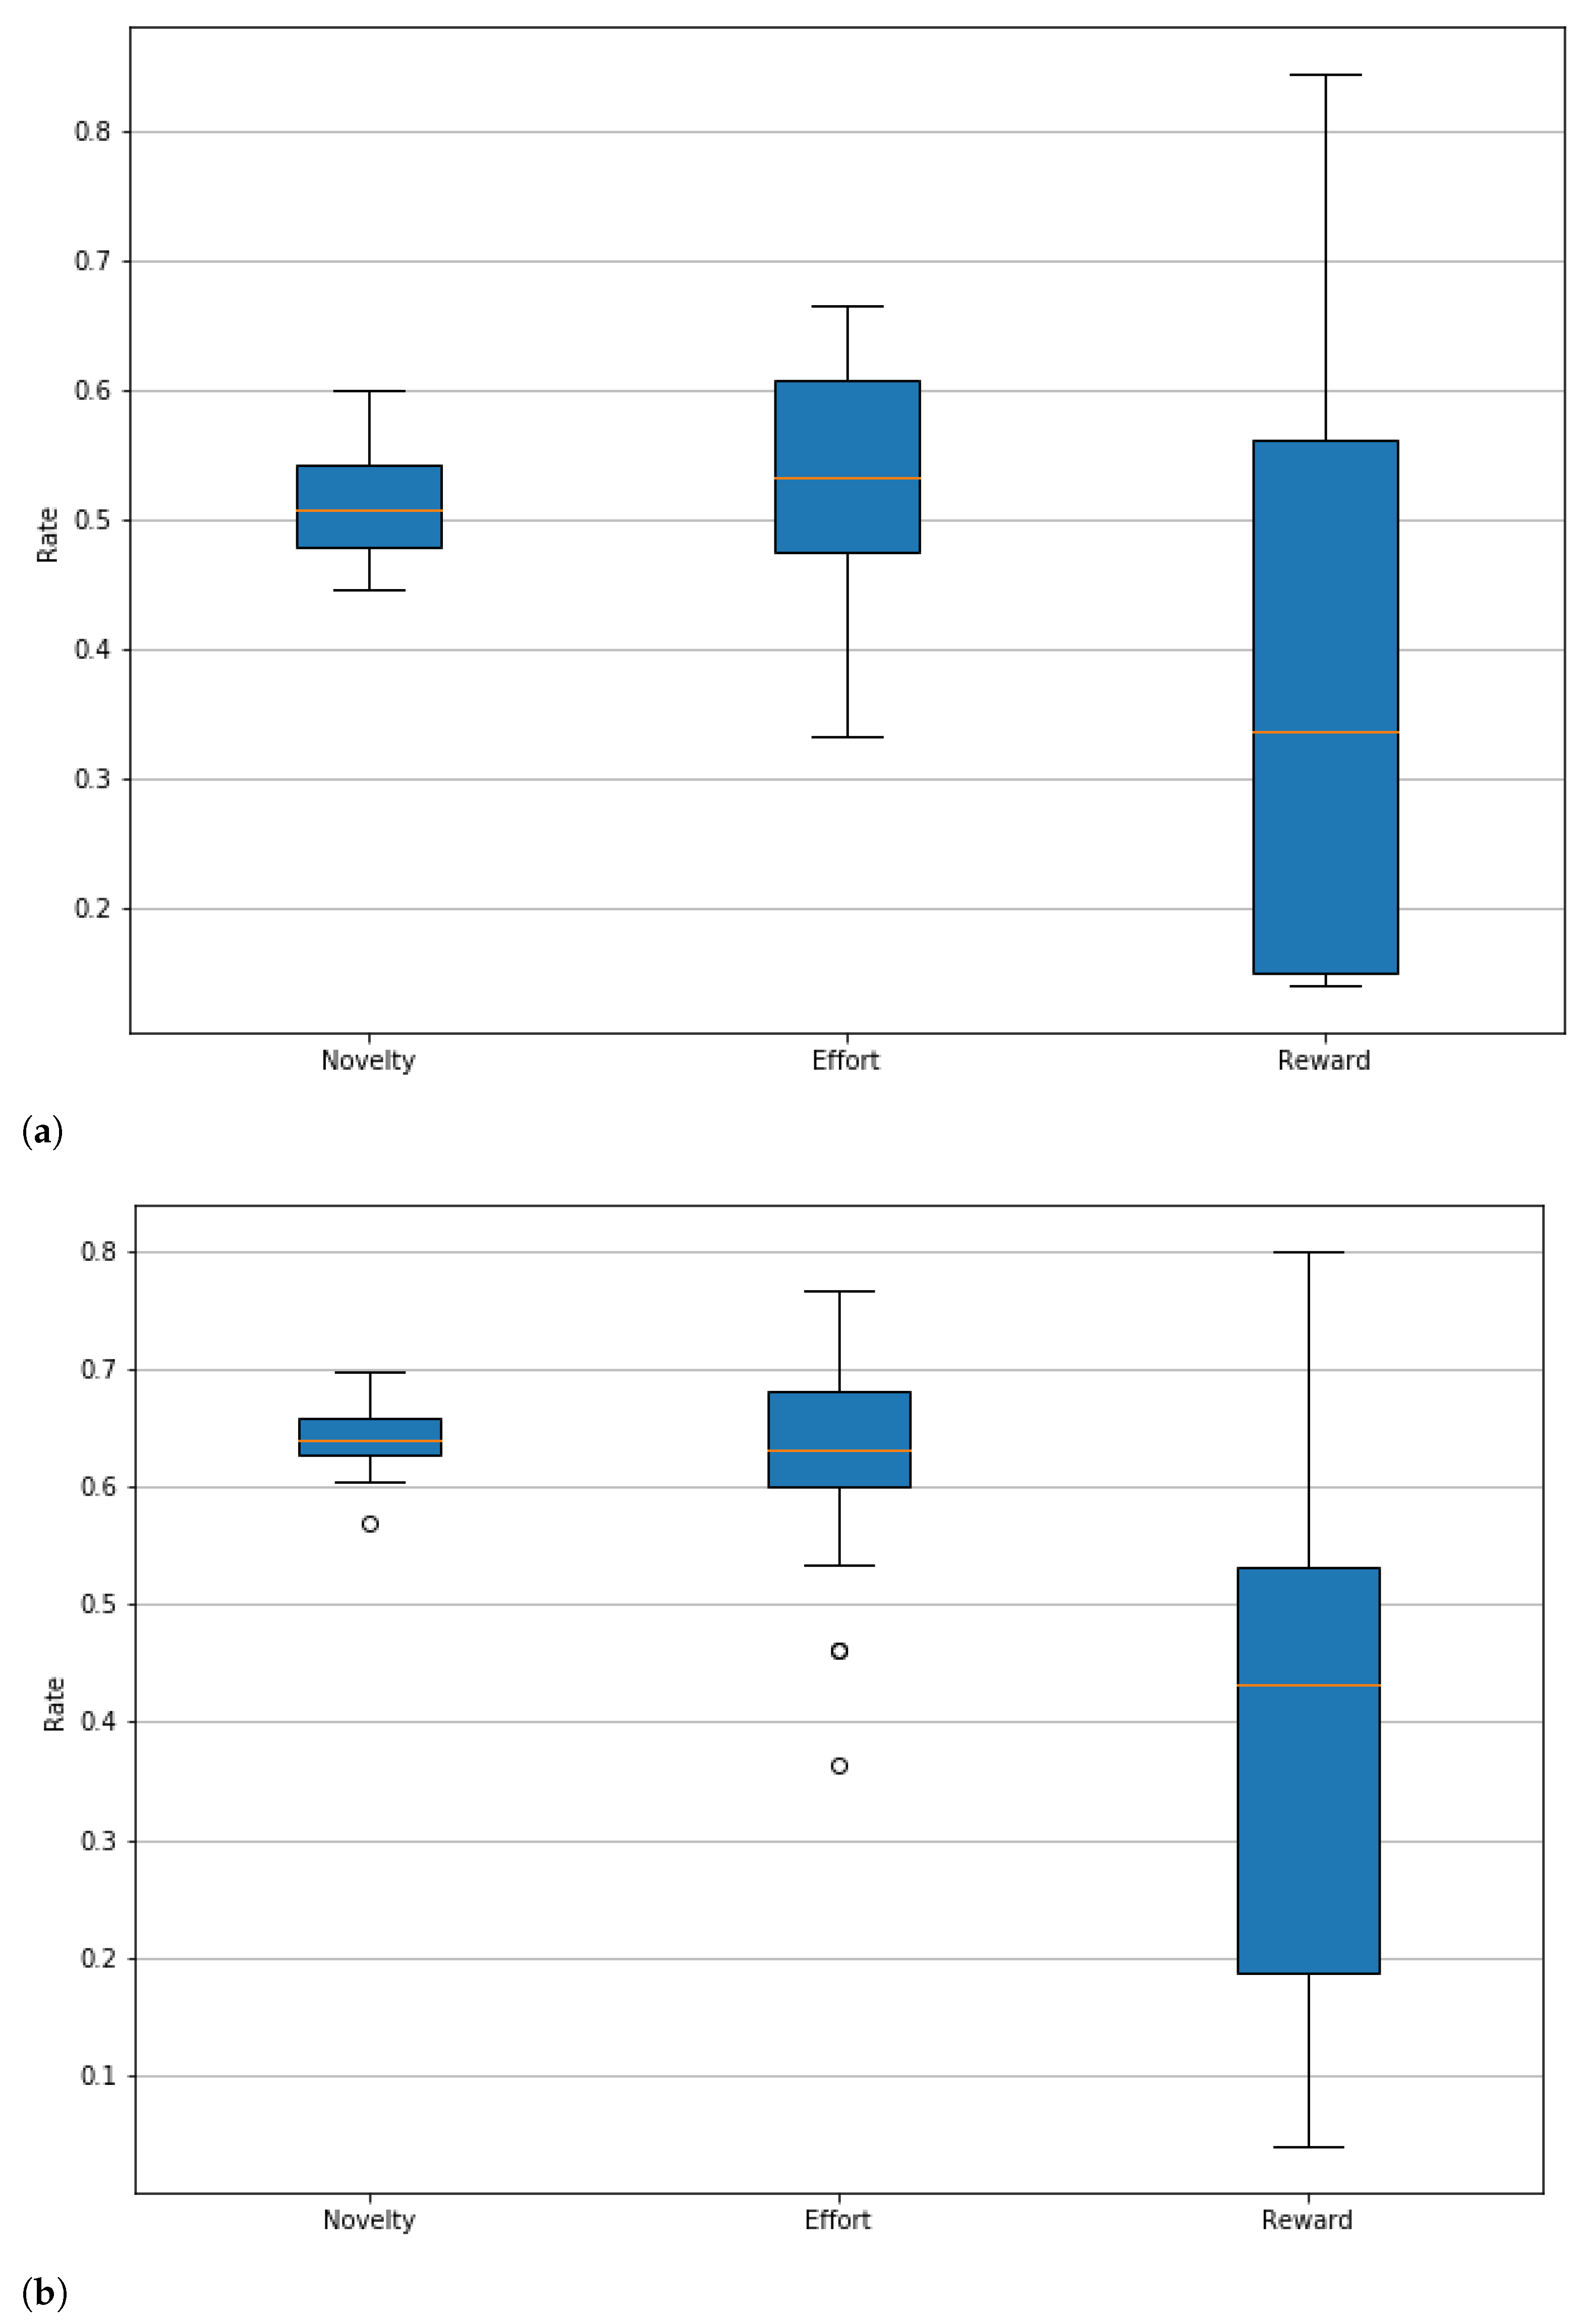
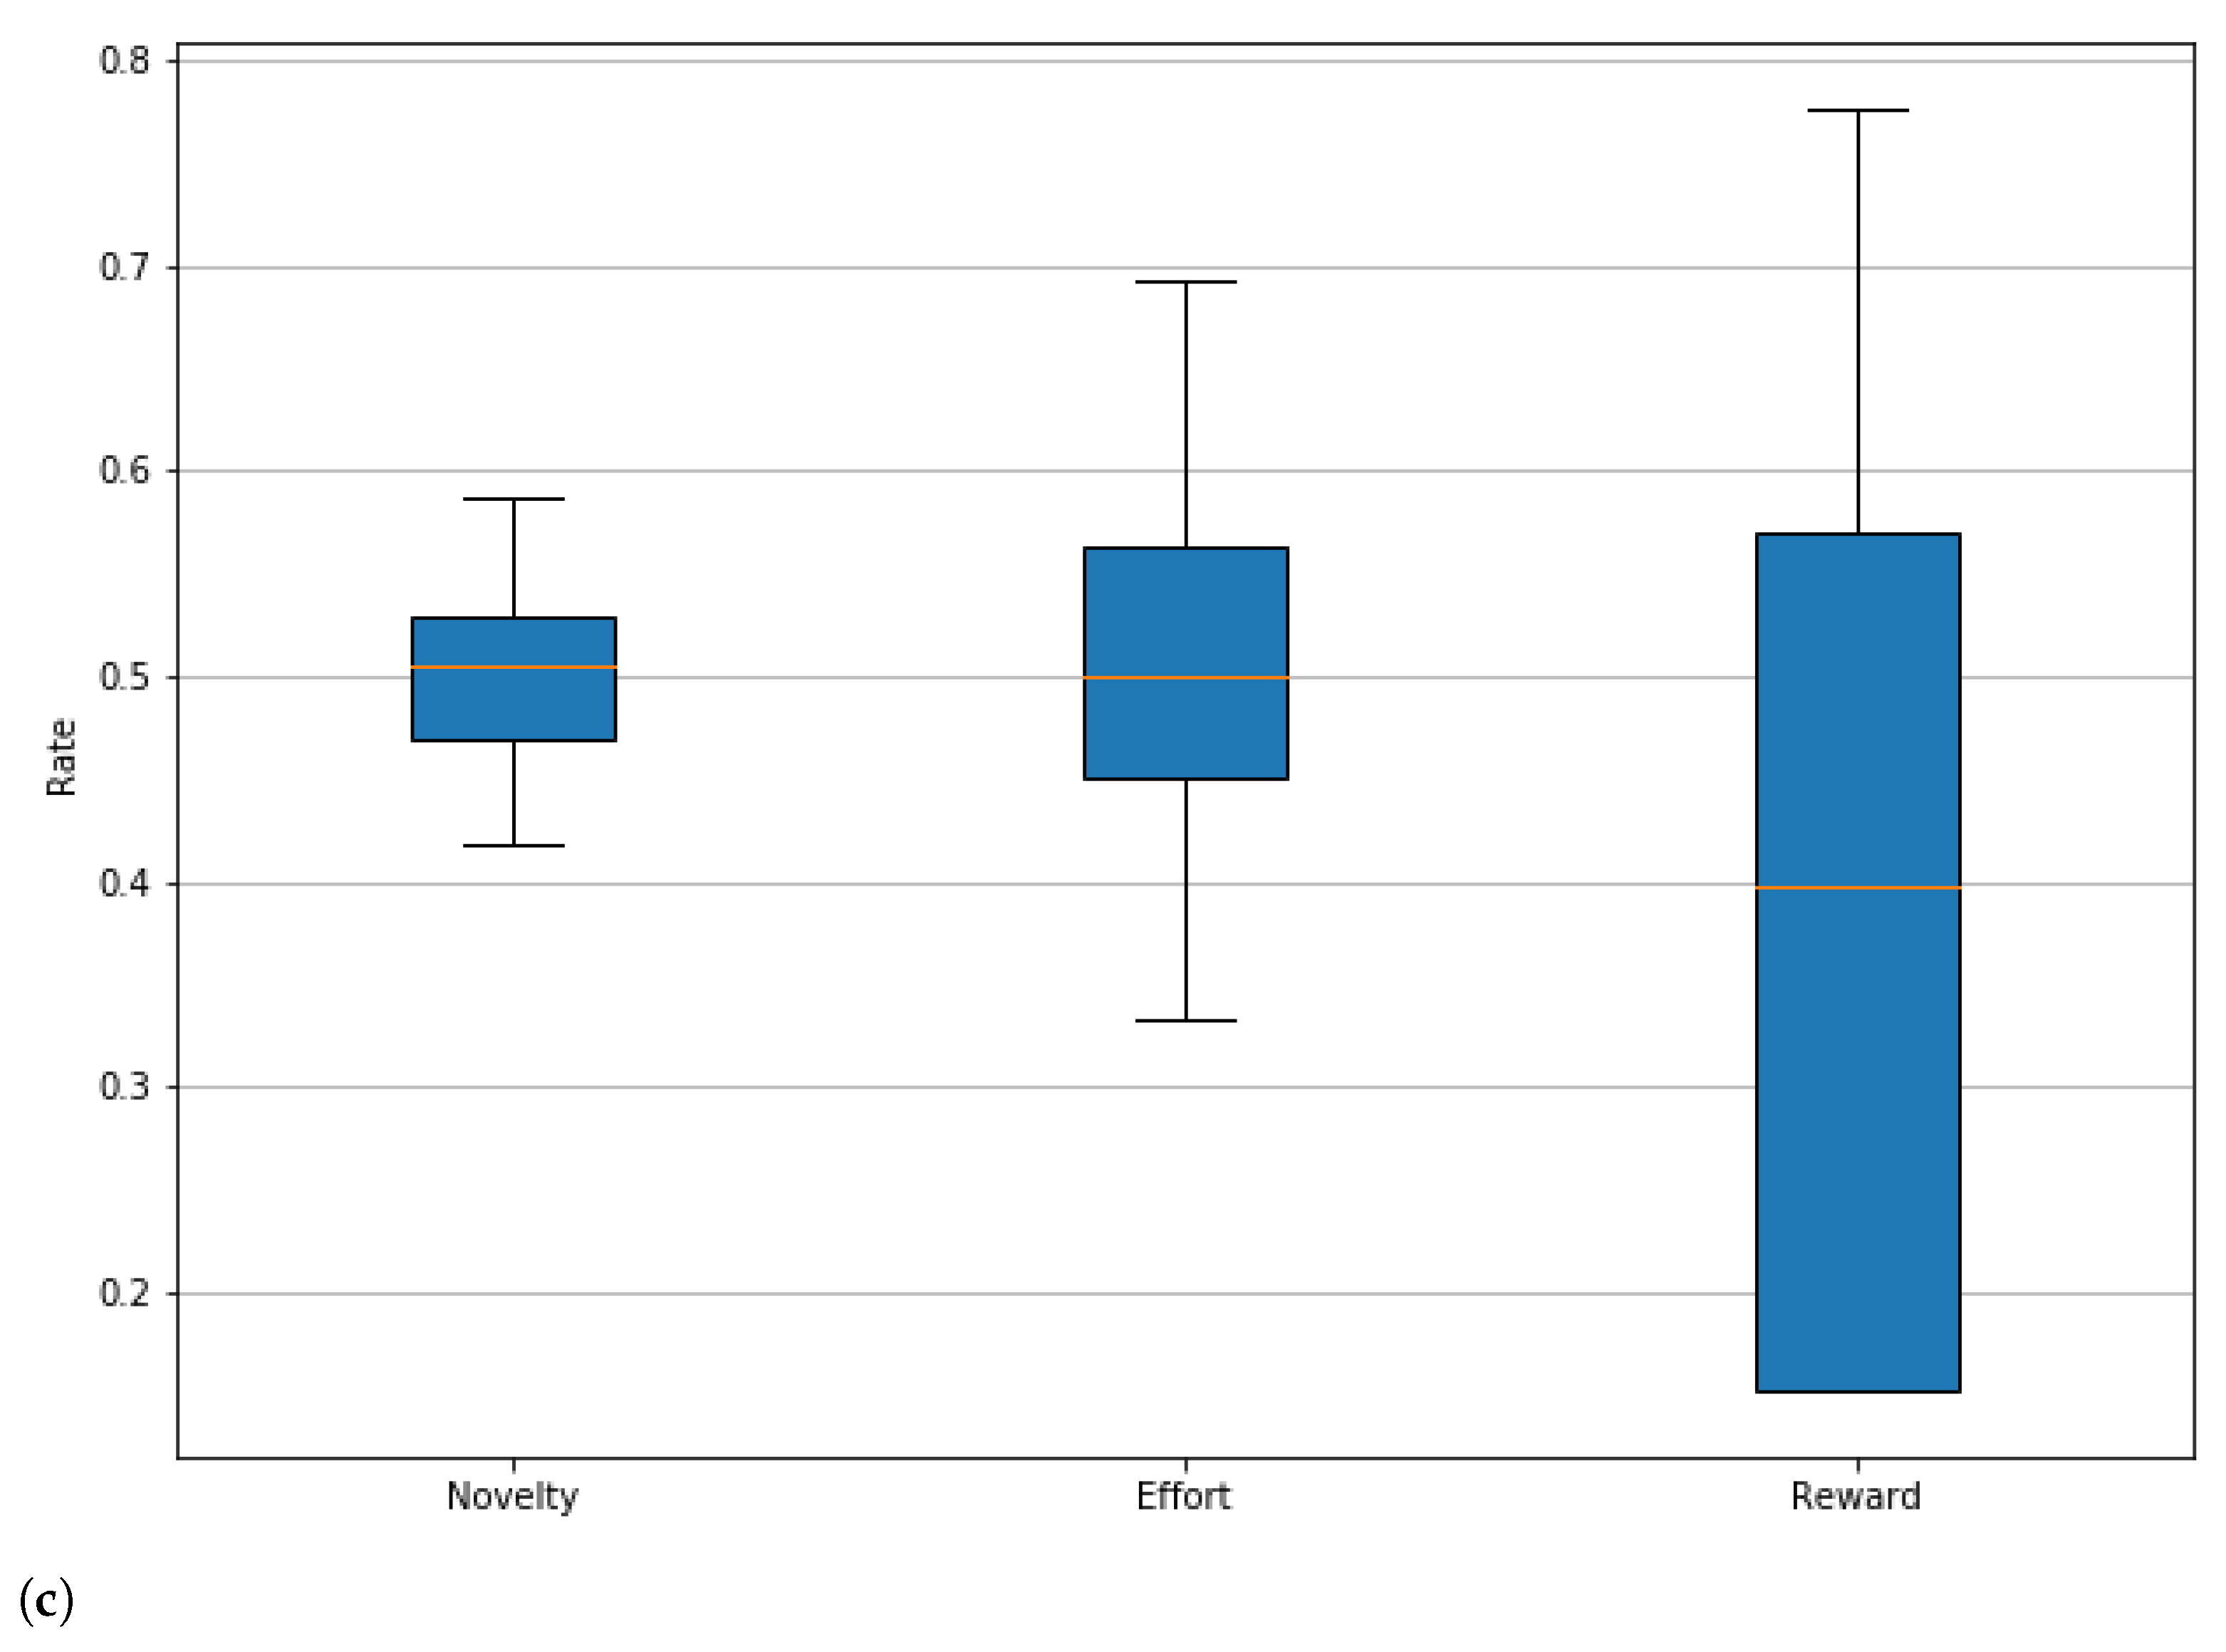
In addition to the table, we present some graphs that allow us to evaluate in greater depth the performance of the agents. First, the graphs of the degree of performance by the PCG metric for each of the agents are presented. These plots are presented in
Figure 6, which allows us to visually assess the distribution of novelty, effort, and gaming experience ratings. These graphs show that the agent who manages to obtain higher reward values is the ’jump’ agent (in
Figure 6a), and, in general, this is the agent that presents better behavior for this experiment, since, even when it does not reach the novelty values of the ’obstacle’ agent, in
Figure 6b, the reward values obtained by this agent exceed those obtained by the other two, in addition to maintaining the minimum values in this same metric above the ’simple’ and ’obstacle’ agents. Of these three agents, the least outstanding is the ’simple’, from
Figure 6b, since both the agent ’jump’ and ’obstacle’ obtain better results in both novelty and reward.
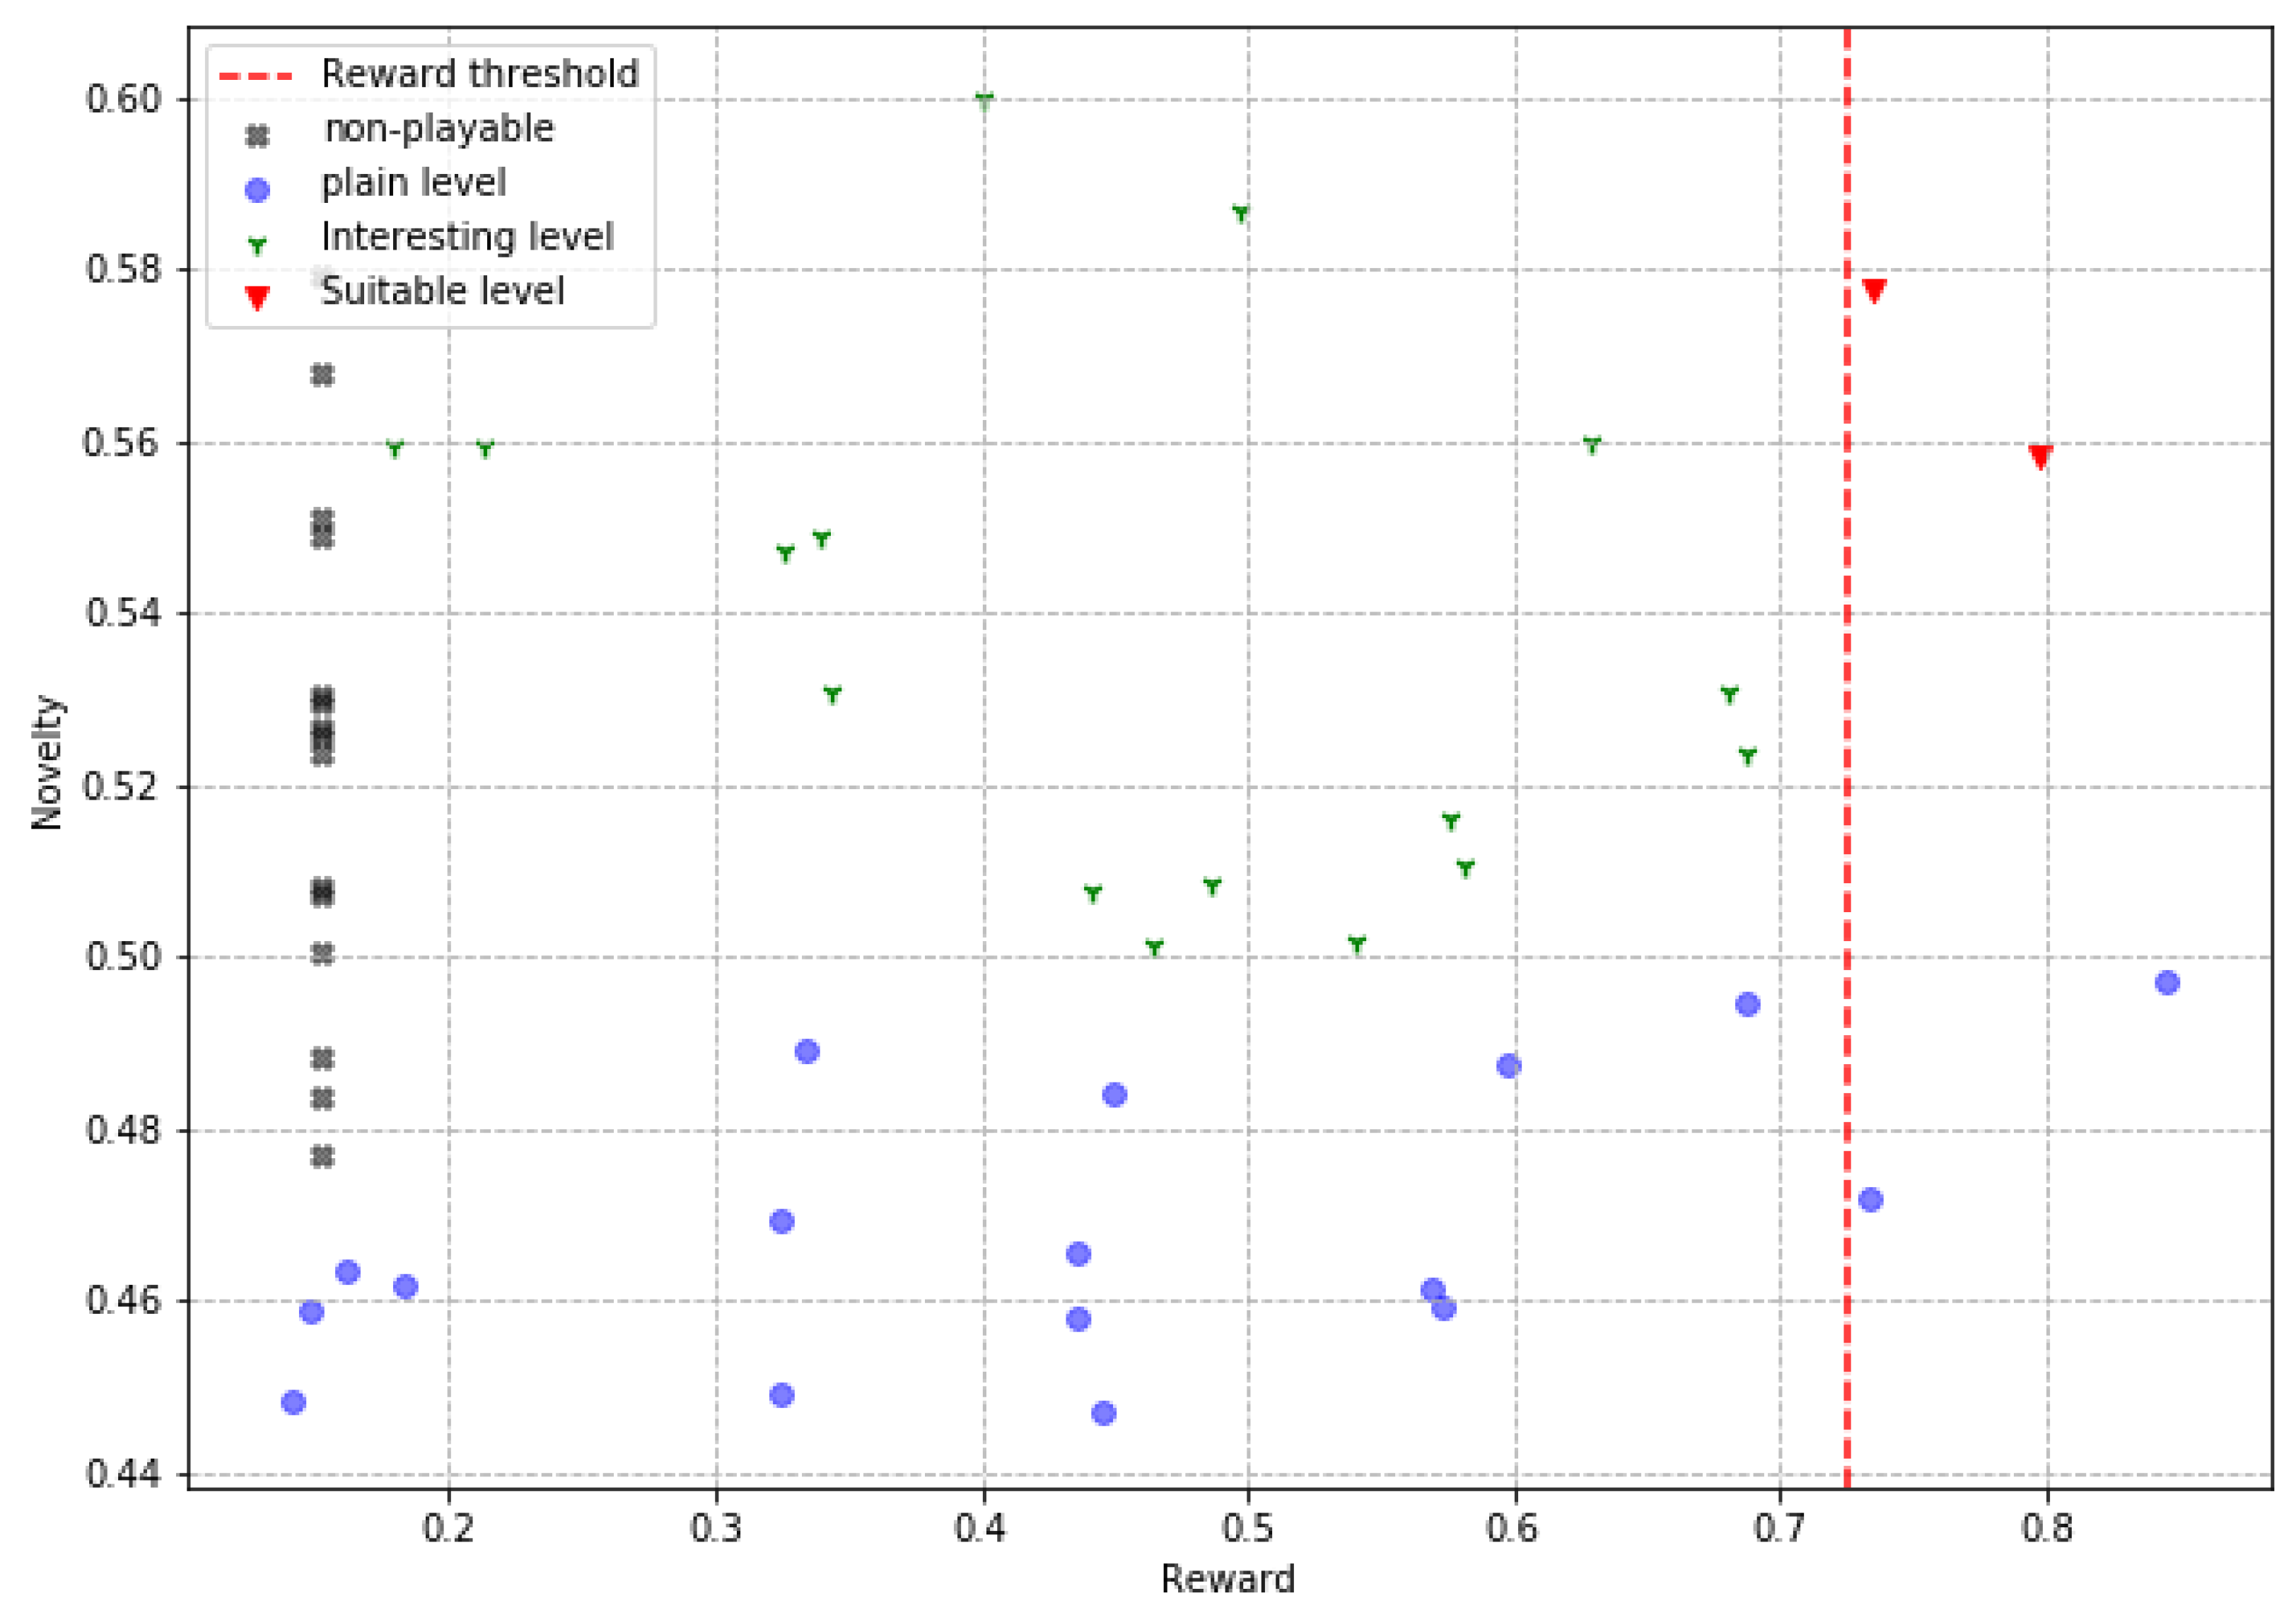
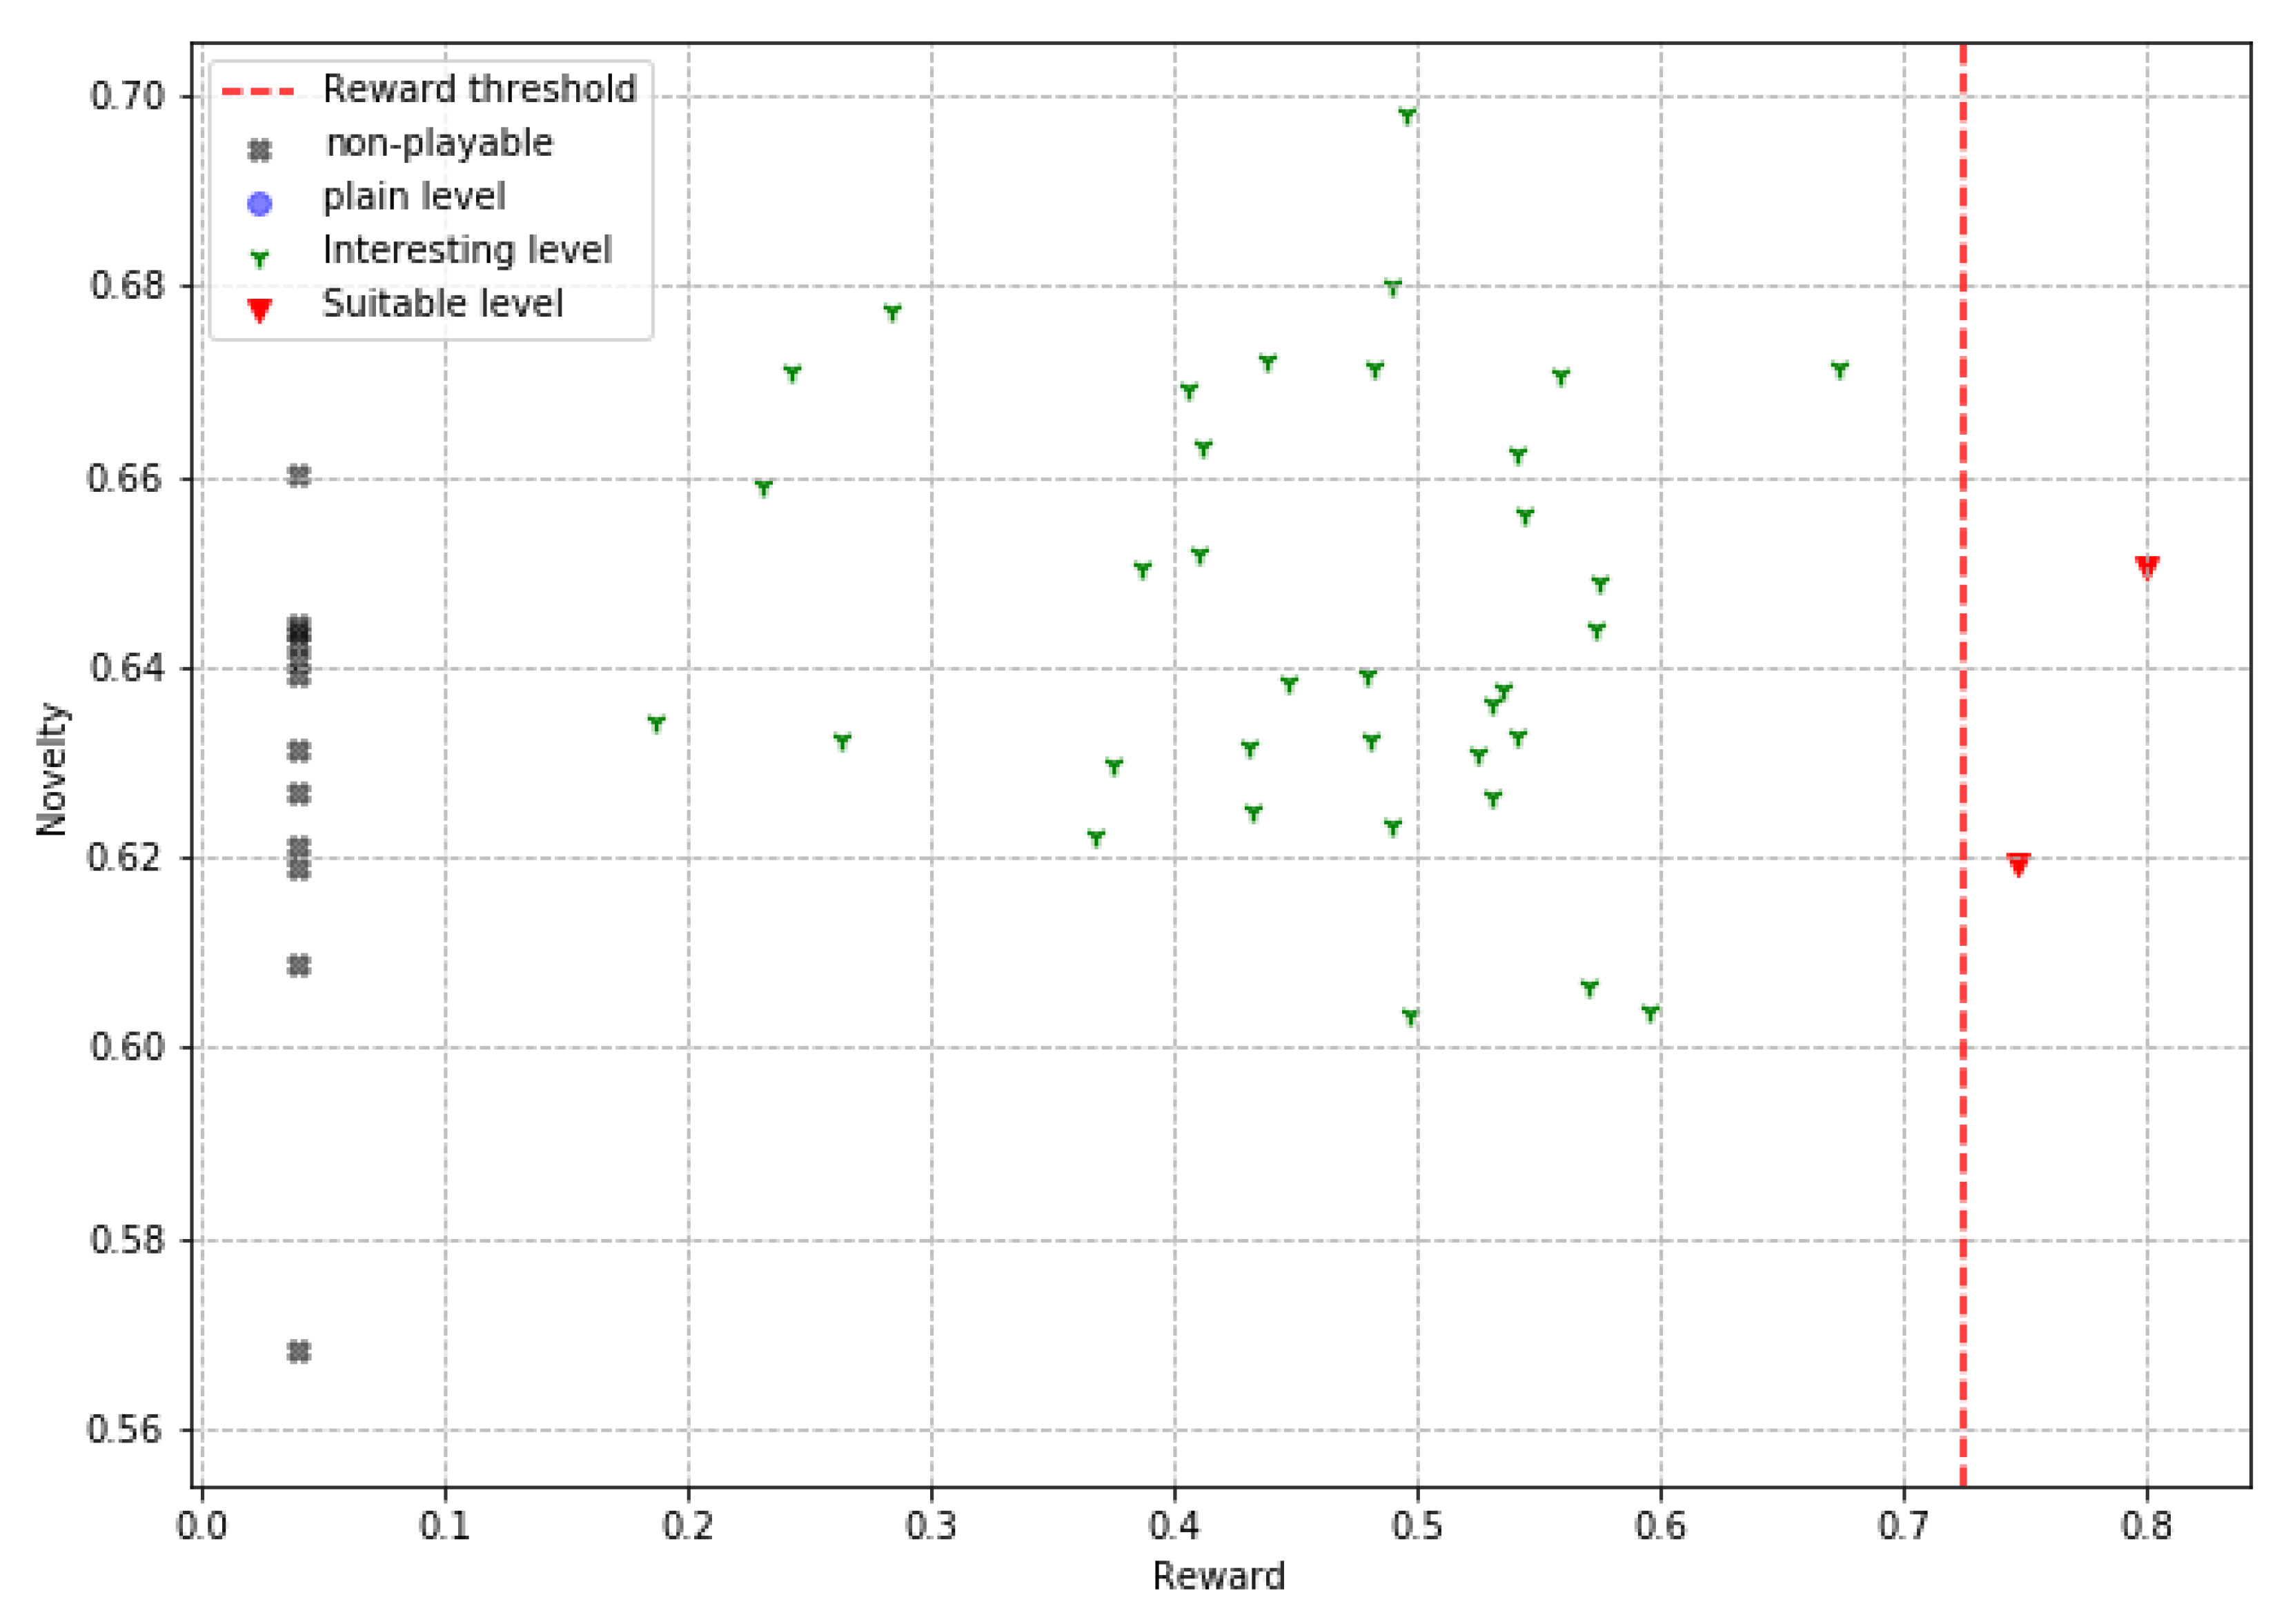
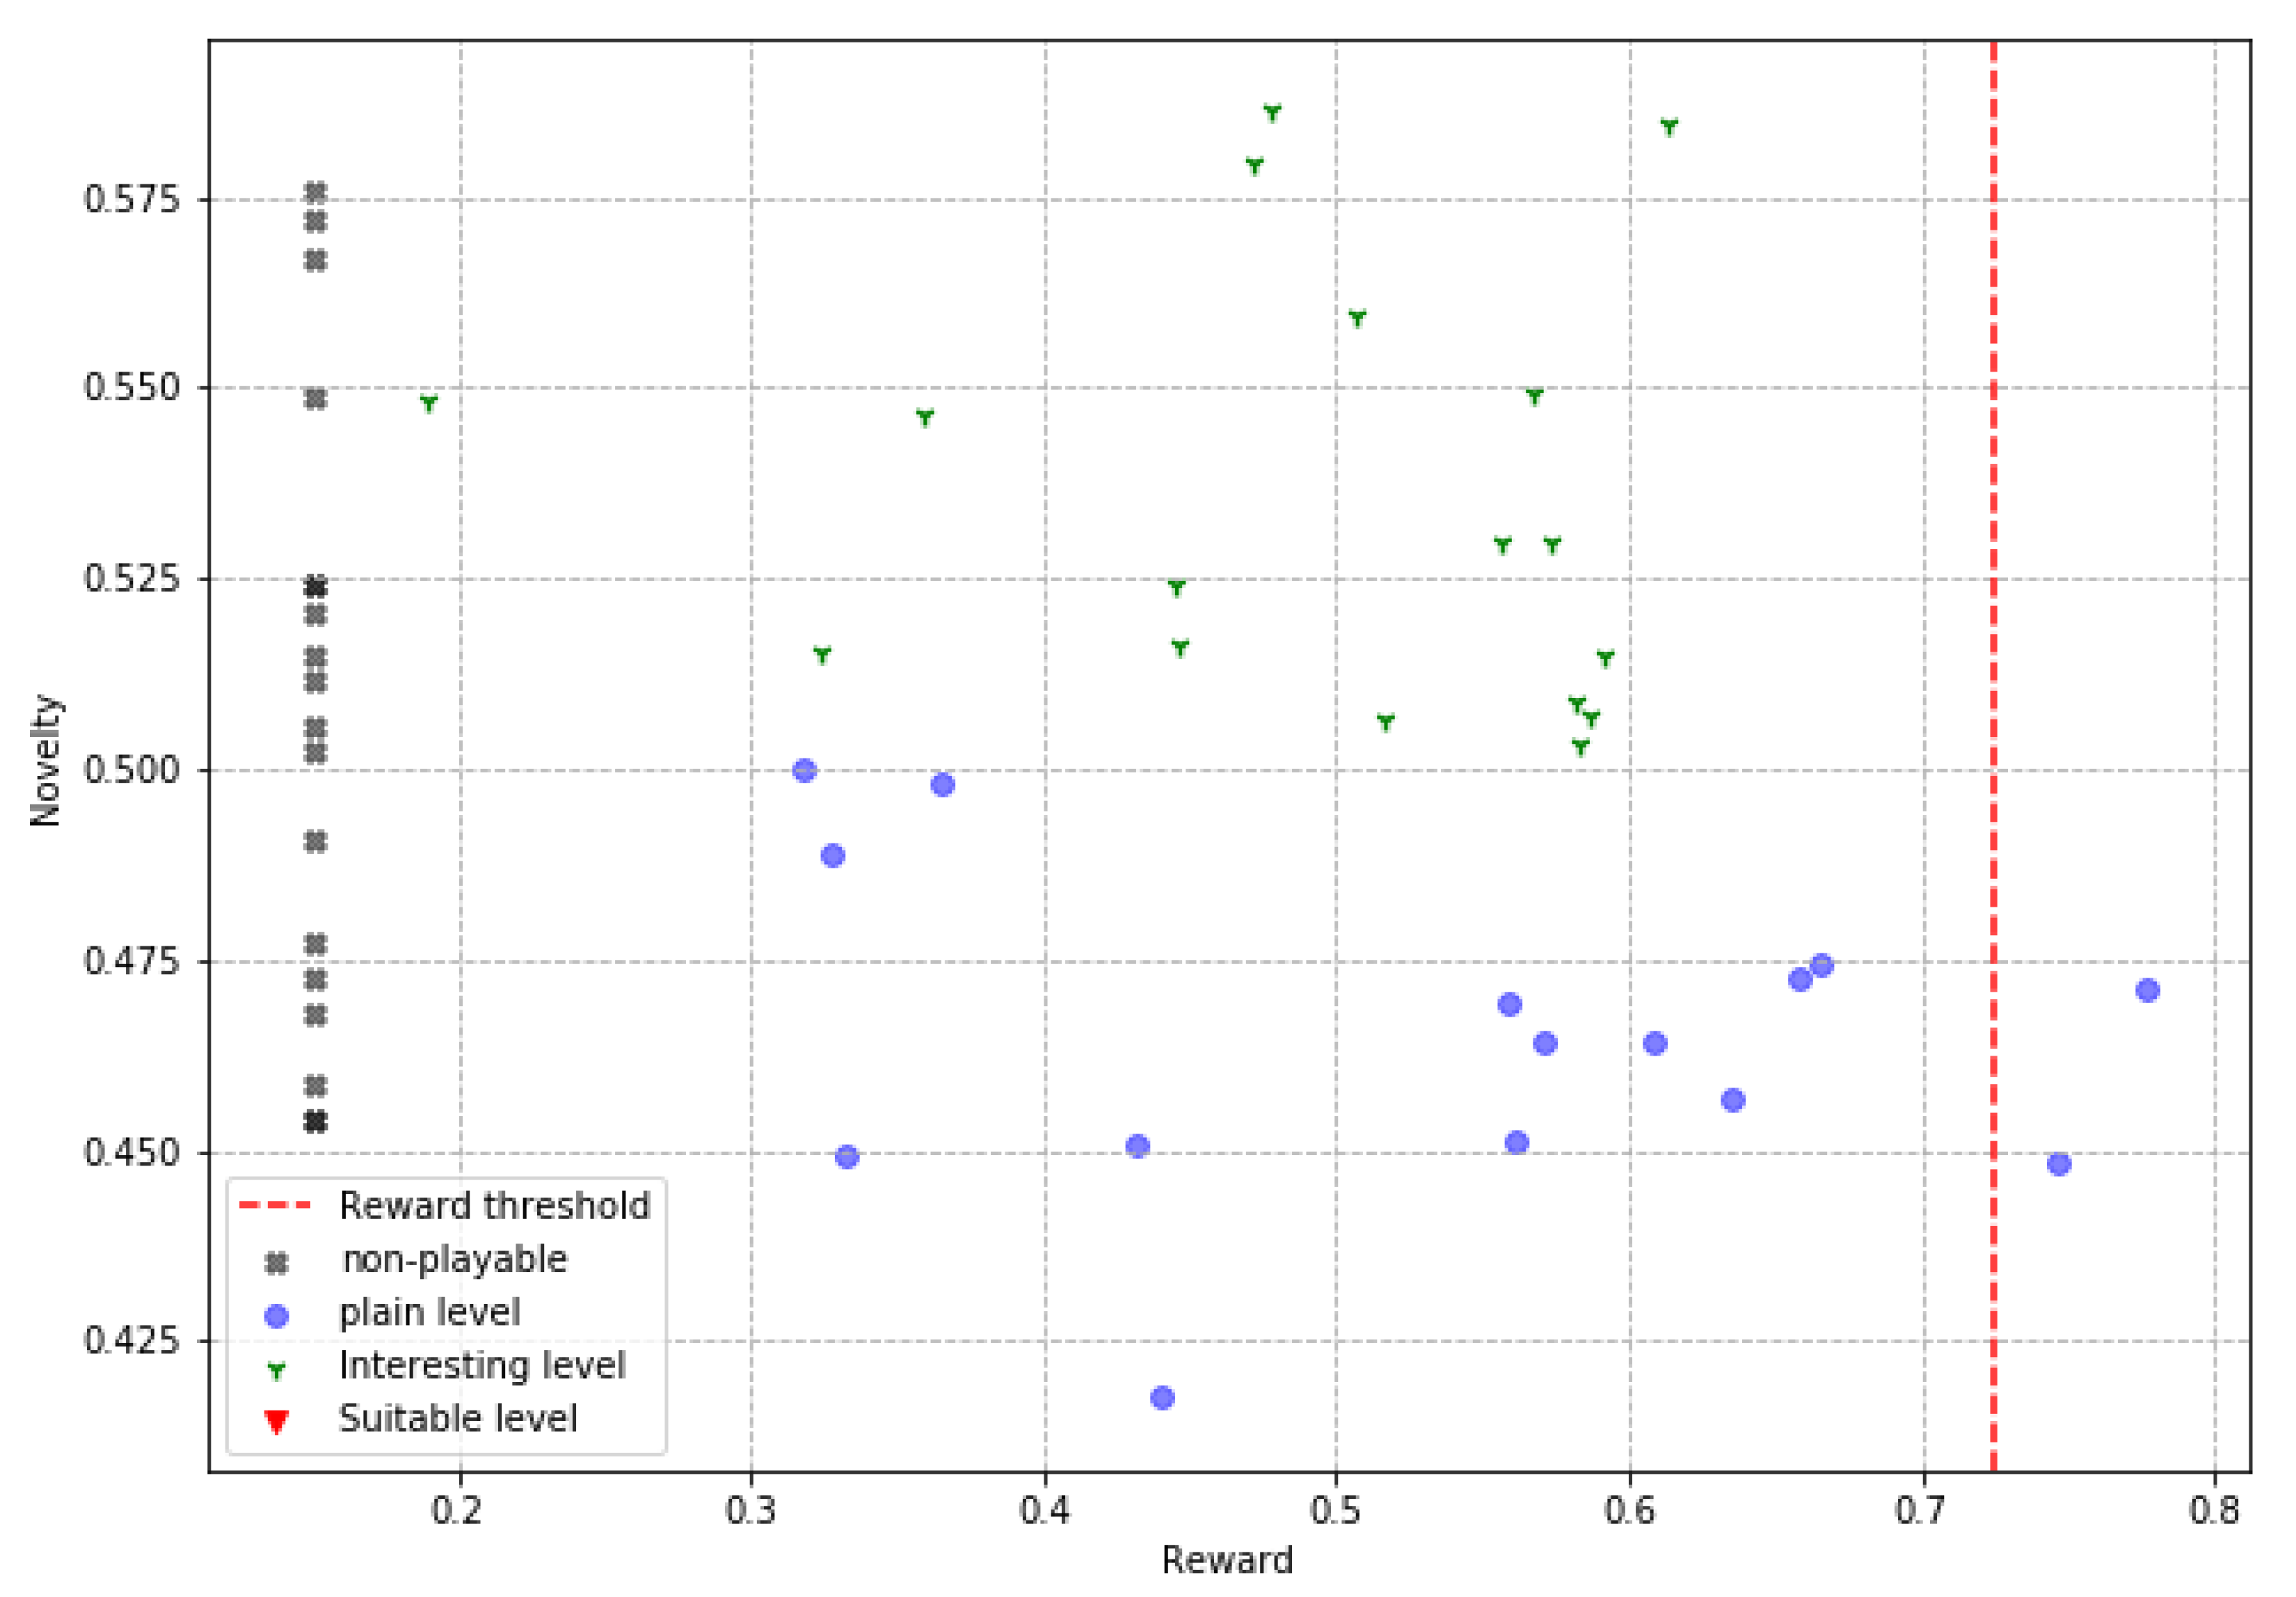
In the plotted scatter graphics, each point represents a level slice produced by an agent in a reward vs. novelty space, allowing us to analyze the relationship between these two characteristics in the results of the proposed PCG algorithm. Four types of level slices are presented in these graphs. The first are the ’suitable levels’ (adequate levels), which are slices with high evaluations in gaming experience, moderate novelty, and are playable; these levels are the ideal solutions of the PCG algorithm by successfully solving the target tasks (high reward and playable) and also doing it creatively (moderate novelty). The second ones are the interesting levels, which are playable slices with moderate novelty, although their rewards are not this in any particular range, these slices are interesting because they offer a real and applicable solution to the problem of procedural generation of video game levels, by producing creative slices that are indeed playable, even though they do not make it feel like the desired gaming experience. The third are the plain levels, slices that are playable, but do not meet any other attribute of interest; these slices represent good solutions for the objective problem; however, their low novelty and non-compliance with the gaming experience make them much less relevant. Finally, the non-playable levels, are those slices in which the player cannot reach the finish point; these are completely undesirable slices and cannot be used in real applications. In addition, the reward threshold is shown in these graphs with a dotted line (0.72) to facilitate the identification of the levels that obtain high rewards.
These plots are presented in
Figure 7,
Figure 8 and
Figure 9. These graphic reports allow interpreting the results from another perspective. The first interesting aspect is the absence of flat levels in the ‘obstacle’ agent in
Figure 8, which, although it does produce ‘non-playable levels’, these are less compared to the two other agents. Taking a look at the ‘jump’ agent in
Figure 7, we see a higher number of slices approaching or crossing the reward threshold, suggesting that this is the best agent to produce levels that deliver the desired game experience. Of the agents ‘simple’, in
Figure 9, and ‘jump’ it can be stated that a moderate degree of novelty is not related to a high degree of reward, since ‘interesting’ levels are shown both at the upper and lower limits of the reward range. In contrast, a high reward always implies gameplay and, at least half the time, a moderate degree of novelty. The data and code necessary to reply these results are available at [
54].
8. Discussion
To compare our algorithm with the rest of the proposals of the state-of-the-art,
Table 7 is presented. In it, the generation process of our algorithm is first reported, which is a hybrid based on the combination of the search-based and generate and test approaches. The degree of determinism of the algorithm is also mentioned, a characteristic that is inversely proportional to the degree of novelty, which, given the experimental results, acquires a value of “moderate”; therefore, the degree of determinism, being its opposite, acquires a value of “fair”. On the other hand, the iterativity is obtained from the range in which the reported experiments are found; that is, our algorithm obtains a “high” value in iterativity, since it is the range in which its behavior is adequate. Regarding gameplay, our algorithm is in the “high” range since a higher percentage of levels produced are playable. That means that in contrast to the search based proposals, IORand generates content with a higher novelty measure (moderate instead of fair) but keeps the controllability in a moderate range as the rest of those same proposals. In comparison with the generate and test proposals, IORand manages to generate content with a high playability measure. Moreover, in contrast with the constructive proposals, IORand keeps a good relationship between the controllability, novelty, and playability, as there are no other algorithms that maintain moderate controllability, moderate novelty, and high playability. As a whole, this makes IORand a solution for the experience-driven PCG problem whose behavior is definitely different from the state-of-the-art proposals.
The experimental results give us enough evidence to conclude that our PCG algorithm, together with the metrics and the designed reward function, are able to solve the generation of level slices that provide a desired gaming experience. This is affirmed since, once the agents have been trained, they are capable of generating novel, playable levels that provide specific gaming experiences. The usefulness of the proposed metrics, the reward function, and the hybrid algorithm to solve the game experience-oriented level generation problem have been shown, representing a contribution in the PCG area. Finally, IORand is a PCG algorithm that can be used in many kinds of problems and games. As it works by using building blocks guided by a reward function that indicates how good or bad its results are, it needs a new reward and new building blocks given any new problem. IORand is the result of studying experience-driven PCG solutions, but it can be seen as a generative design tool, more than just a PCG one. This algorithm creates content based on an optimization problem; it maximizes the similarity to our description of game experience. However, it could solve different problems given a specification on the available blocks to build a solution and a quantitative measure of its performance or objective as reward.
9. Conclusions
In this work, we presented a new hybrid PCG algorithm capable of solving the problem of a procedural generation of video game levels, focused on providing desired gaming experiences. In turn, an evaluation method based on a critical path analysis is presented in a graph (annotated with the designed metrics), to identify game experiences based on expected interactions with the game elements present in said paths.
By combining the hybrid algorithm of PCG with the evaluation method, we obtained agents capable of consistently solving the task of generating level slices that provide a certain gaming experience, while the slices are playable, and, additionally, it was possible to improve the degree of novelty for PCG algorithms based on RL reported in the state-of-the-art, obtaining results in a moderate range, while the state-of-the-art is reported with an acceptable range.
These results demonstrate that the hybridization of PCG algorithms is a feasible solution to find more and better answers to the unanswered questions in this area.
In future works of this proposal, there are other challenges that we will deal with. Here we list some of them; generalization capability of our agent; how much to change for other games or game experiences? Is there any test or fact to prove it? Finally, concerning the proposed similarity measure for game experiences, how do we use it for other games? Could it be parametrized correctly with other game metrics?


