Article

Influences of CO2 Absorption under Ultrasonic Vibration and Water-Reducer Addition on the Rheological Properties of Cement Paste

1
School of Mechanical and Electrical Engineering, Xuzhou University of Technology, Xuzhou 221000, China
2
Jiangsu Key Laboratory Environmental Impact and Structural Safety in Engineering, China University of Mining and Technology, Xuzhou 221116, China
*
Author to whom correspondence should be addressed.
Appl. Sci. 2022, 12(8), 3739; https://doi.org/10.3390/app12083739
Submission received: 8 March 2022 / Revised: 3 April 2022 / Accepted: 6 April 2022 / Published: 7 April 2022

Abstract

:
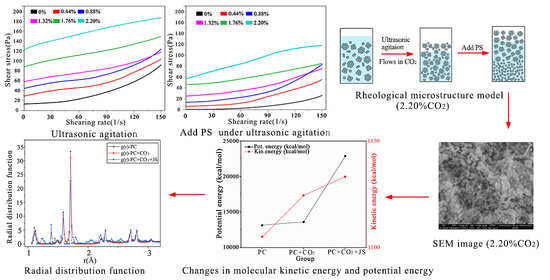
Research shows that ultrasonic vibratory stirring can effectively increase CO2 absorption by cement slurry. However, with the increase in CO2 absorption, the fluidity of slurry begins to decrease. Adding water reducer to fresh cement paste can improve its fluidity. In order to reveal the influences of ultrasonic vibration and water-reducer addition on the rheological properties of cement pastes after absorbing various amounts of CO2, changes in the rheological properties of yield stress and plastic viscosity (PV) were analysed. The results show that ultrasonic vibration can effectively increase the shear stress and PV of cement paste. Moreover, shear stress and PV are positively related to the CO2 absorption amount. Meanwhile, a new rheological model of cement paste carbonated under ultrasonic vibration was established based on the basic principles of rheology. Microstructural changes in cement paste before and after water-reducer addition were observed by scanning electron microscopy (SEM). A microrheological model of cement paste carbonated under ultrasonic vibration and with water reducer added was constructed. It describes the influencing mechanisms of ultrasonic vibration and water-reducer addition on the rheological properties of carbonated cement paste. Next, a molecular model was constructed in which CO2 was added into a C-S-H gel. Changes in intermolecular repulsion in the CO2+ C-S-H gel structure and in the CO2− water-reducer molecular structure were analysed. Finally, the rheological mechanism was further analysed in terms of the dispersion effect of the C-S-H gel. The results will play a major role in improving the fluidity of cement paste.

Graphical Abstract

1. Introduction

The greenhouse effect is caused by excessive CO2 emissions and poses many environmental hazards. Global warming has become one of the world’s top 10 global environmental problems [1,2]. Nowadays, many methods exist to decrease global CO2 emissions, such as changing energy structures, chemical absorption and blocked curing [3]. However, all of these methods have certain technological defects. They all incur relatively high costs and cannot solve carbon-emission problems within a short period of time [4,5]. Some studies have pointed out that the cement in concrete can produce a significant amount of Ca(OH)2 during the hydration process (20–30% of the total hardened cement paste), which largely exists in the pores of hardened cement pastes in crystal form [6,7,8]. In solution, Ca(OH)2 can react with CO2 extremely easily to produce CaCO3. As a result, concrete has considerable potential for use as a CO2 absorbent [9,10,11].
At present, research on the absorption of CO2 by freshly mixed slurry has achieved some progress. Our research group has developed mechanical and ultrasonic vibratory-stirring devices to increase CO2 absorption by cement slurry [12,13,14]. The research shows that ultrasonic vibratory stirring can effectively increase CO2 absorption by cement slurry under the condition of mechanical stirring (at a certain stirring rate and water–cement ratio) [12,15]. Furthermore, the mechanical properties of the cement slurry are improved after absorbing CO2. However, the fluidity of the fresh cement paste is negatively related to the amount of CO2 absorption (CO2 AA). Although ultrasonic vibration can improve the fluidity of fresh cement paste, the paste solidifies as the CO2 AA increases and the paste eventually loses its working performance [16,17,18]. Adding a water reducer to fresh cement paste can improve its fluidity, thus regaining its working performance [19,20,21]. However, the nature of the fluidity change after adding water reducer under ultrasonic vibration remains unclear.
Therefore, this paper analyses the rheological principles and internal microstructural changes of fresh slurry with an added water-reducing agent. Further, it establishes molecular models and conducts dynamic analysis to deeply explore the mechanisms and effects of ultrasonic vibration.

2. Basic Theory of Rheology

The rheological models most commonly used to describe the fluidity of fresh cement paste are the Bingham and Herschel–Bulkley (H-B) models. In this investigation, the steady-state rheological parameters of fresh cement paste were obtained according to an RS-SST rheometer (Brookfield Company), then the values of these parameters were fitted based on Bingham, modified Bingham (M-B) and H-B models to analyse the rheological properties of fresh cement paste after CO2 absorption. The corresponding basic rheological models are briefly introduced as follows.
(1) Bingham model:
The Bingham model (Expression (1)) is a relatively common rheological model used to describe the fluidity of fresh cement-based materials. If the external forces that the fluid bears are less than the yield stress, the fluid is characterised by plastic flow; otherwise, the fluid is characterised by viscous flow.
τ = τ 0 + η γ
(2) Modified Bingham (MB) model:
The Bingham model is an ideal model, while the MB model can more accurately characterise the rheology of cement-based materials. Its expression is
τ = τ 0 + η γ + c γ 2
(3) Herschel–Bulkley (H-B) model
The H-B model is often used to describe the fluidity of fresh concrete, cement pastes and particle-containing suspensions. Compared with the Bingham model, the H-B model is more accurate. According to the H-B model, the plastic viscosity (PV) of fluid is mainly influenced by shear stress, which is mainly modelled by variations in a power exponent, usually denoted as n. When n < 1, the shear stress decreases with increases in PV, thus leading to shear thinning. When n = 1, the fluid is characterised as a Bingham fluid. When n > 1, lower viscosity is obtained with higher shear stress at a lower shear rate, which results in shear thinning; and higher viscosity is obtained with higher shear stress at a higher shear rate, which results in shear thickening. The H-B model is expressed as follows:
τ = τ 0 + K γ n
Rheological curves of the three rheological models are shown in Figure 1.

3. Test Materials and Methods

3.1. Raw Materials

The cement used in this study was P·O 42.5 cement produced by the Xuzhou Zhonglian Cement Group. The mean grain size, density, standard-consistency water requirement, fineness (0.08 mm square-hole sieve) and specific surface area were 14.813% Xav (μm), 3.14 g/cm3, 28.1%, 1.02% and 3300 cm2/g, respectively. The specific chemical composition and mineral composition are listed in Table 1 and Table 2. The admixture is polycarboxylate superplasticiser (PS) in Table 3. The CO2 was high-purity (≥99.5%) CO2 produced by a special gas plant in Xuzhou. Tap water was also used.

3.2. Test Equipment

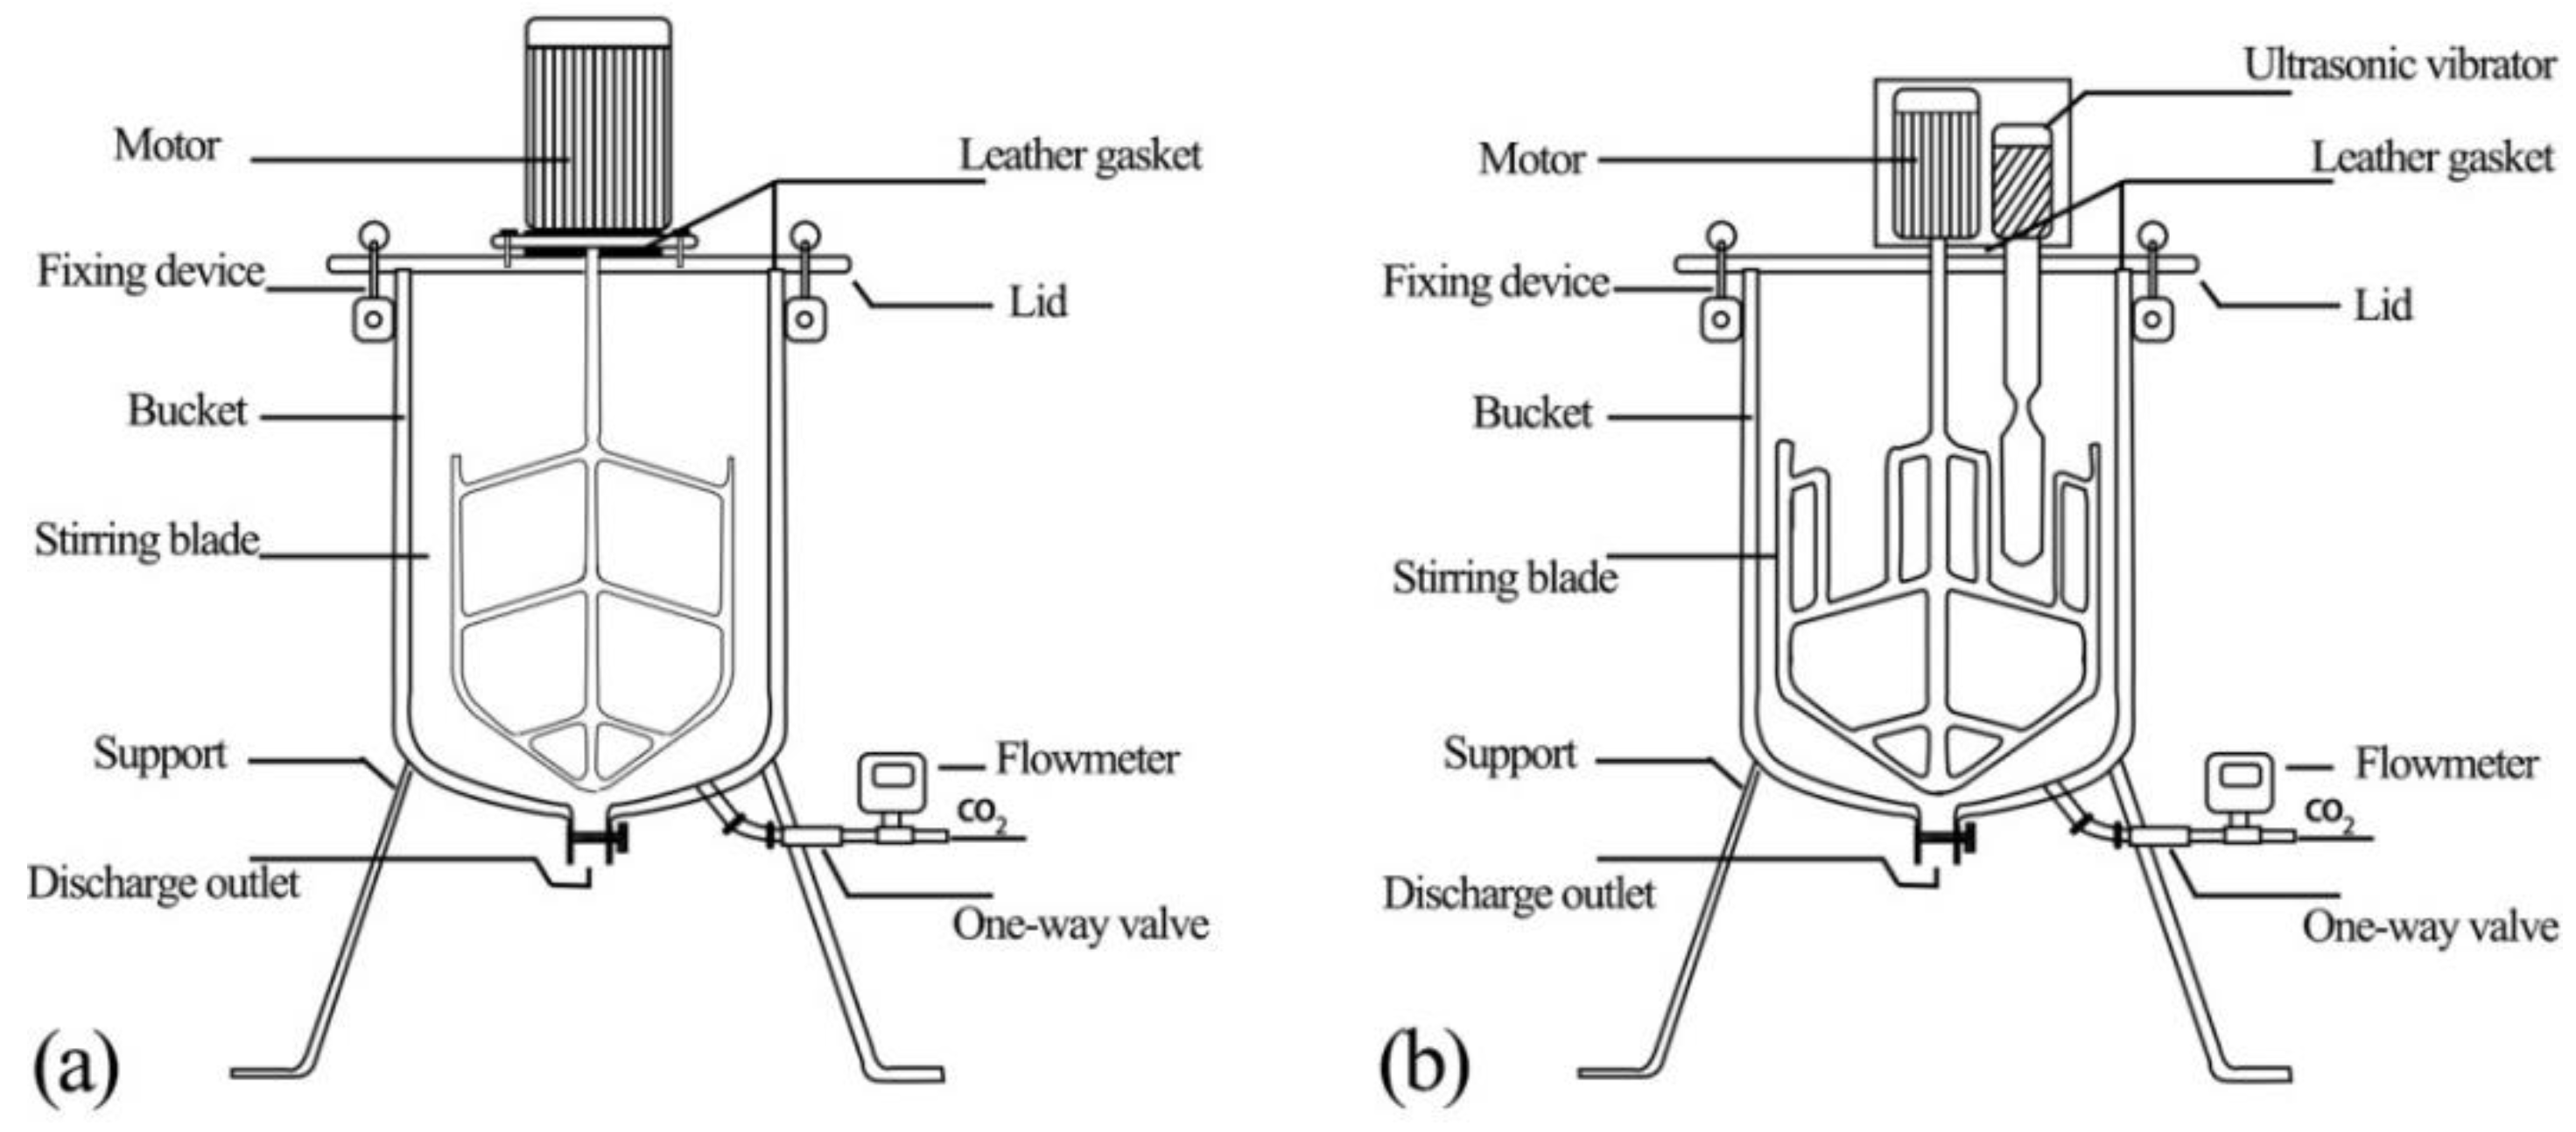
Two CO2-absorption devices were manufactured to investigate the influences of ultrasonic-vibration agitation and PS addition on the rheological properties of CO2 AA of fresh cement paste. One was a mechanical agitation device (Figure 2a) and the other was an ultrasonic-vibration agitation tank. The manufacturing process is introduced as follows. Firstly, the ultrasonic-vibration agitation tester with variable frequencies was connected to the original CO2-absorption device. Next, a transducer, ultrasonic power supply and qualified amplitude transformer were selected according to vibration amplitude and frequency requirements of the vibration system. Finally, the ultrasonic power supply, transducer, amplitude transformer and agitation tank were connected (Figure 2b).
A rotational rheometer (RS-SST, Brookfield) was used to test the rheological properties of the cement pastes. The propeller rotor was a model VT-60-30. We used an ISO-standard consistency and setting-time tester for cement paste produced by Cangzhou Kexing Instrument Co. Ltd. The maximum sliding stroke of the testing cone was 70 mm. The diameter of the dispatching rod was 10 ± 0.05 mm and the diameter of the needle was 1.13 ± 0.05 mm.

3.3. Preparation of Net Cement-Paste Samples

The water–cement ratio of the net cement-paste samples was 0.6. The cement content was 800 g and the water content was 400 g. The cement and water mixture was poured into the agitation vessel and the valve of the CO2 tank was opened to inject the corresponding mass of CO2. After the CO2 was completely absorbed by the cement paste, it was stirred slowly for 2 min. The stirring was stopped for 15 s and then the mixture was quickly stirred again for 1 min 45 s.

3.4. Rheological Property Test of the Net Cement Paste

The shear stress and apparent viscosity of cement pastes with different CO2 AA were tested by changing the shearing rate of the rheometer. The detailed test process is shown in Figure 3. In the pre-shear stage (0–30 s), the shear rate increased linearly from 0 to 50 s−1. Later, the shear rate was constant (30–90 s). At 90–120 s, the shear rate decreased linearly to 0 and the pre-shear stage finished. Subsequently, the cement paste was left to stand for 60 s (120–180 s). In the first half of the test stage (180–360 s), the shear rate increased linearly from 0 to a maximum of 200 s−1. In the second half of the test stage, the shear rate decreased sharply from 200 s−1 to 0. Data were recorded every 1 s throughout the test process.
Since the steady state of non-Newtonian fluid stress is relatively short when the shear rate decreases, the tested shear-stress curve is more stable. This also implies that the test results can reflect the rheological properties of cement paste better. On this basis, variations in the descending parts of the shear-rate curves were chosen for analysis. In this study, data were analysed using Origin software, which also provided the rheological equation and corresponding rheological parameters.

4. Test Contents and Methods

4.1. Influences of Ultrasonic Vibration on the Rheological Properties of Cement Paste after CO2 Absorption

After CO2 absorption, the cement pastes were tested under mechanical agitation (Group A) or ultrasonic agitation (Group B). The stirring rate was set to 210 ± 5 r/min. The ultrasonic frequency was 20 kHz and the corresponding CO2 AAs were 0%, 0.44%, 0.88%, 1.32%, 1.76% and 2.20% of the cement mass. Cement-paste samples with a water–cement ratio (W:C) of 0.5 were used in the tests. The volumes of cement and water consumed were 800 g and 400 g, respectively. Weighed amounts of cement and water were added to an agitator and stirred. Meanwhile, a corresponding mass of CO2 was supplied to the agitator. The agitator was turned off after the CO2 was completely absorbed by the cement paste. The agitation program comprised 4 min agitation, slow stirring for 2 min, a 15 s pause, then fast stirring for 105 s. In this process, the CO2 AA was increased at a rate of 0.44% and pastes were collected in a 500 mL beaker before each increase. All beakers were installed with appropriate rotors to test the rheological properties of the fresh cement pastes. Based on these tests, the influences of ultrasonic vibration on the rheological properties of cement pastes after CO2 absorption were analysed.

4.2. Influences of Water Reducer on the Rheological Properties of Cement Paste after CO2 Absorption

The test was divided into two groups (C and D). Group C used cement paste without PS under ultrasonic agitation, while Group D used cement paste with 0.25% PS under ultrasonic agitation. The stirring rate was set to 210 ± 5 r/min and the ultrasonication frequency was 20 kHz. In the tests, the influences of PS addition on the rheological properties of cement paste under ultrasonic agitation were investigated [22].

4.3. Morphological Features of Products Precipitated from Cement Paste with Water Reducer Added after CO2 Absorption

The test was divided into two groups (E and F). Group E used fresh cement paste with a 2.20% CO2 AA (of the cement mass) under ultrasonic agitation. The W:C was 0.5 and the ultrasonic frequency was 20 kHz. Group F used fresh cement paste with 0.25% PS (of the cement mass) under ultrasonic agitation. These two fresh cement pastes were poured into 40 mm cubic moulds and compacted by vibration; then, the samples were cured under standard conditions for 12 h to prepare cement-paste samples. At this time, the strength of the cement-paste samples was initially established, which was conducive to sample preparation. At this time, the hydration reaction in the cement had only just begun and its internal structure was relatively loose. This made it a good time to observe the products of the reaction of cement-hydration products with CO2.
The cement-paste samples were made into 1 mm-thick pieces, which were then immersed in absolute ethanol for 48 h to stop the hydration of the cement. The pieces were dried in a constant-temperature blast oven at 65 °C for 24 h, and then placed in an ion-sputtering apparatus for surface gold spraying. SEM and energy spectrum analysis were then performed.

5. Test Materials and Equipment

5.1. Effects of CO2 Absorption on the Rheological Properties of Cement Paste

(1) Rheological curves of cement paste after CO2 absorption
(a) Mechanical vibration
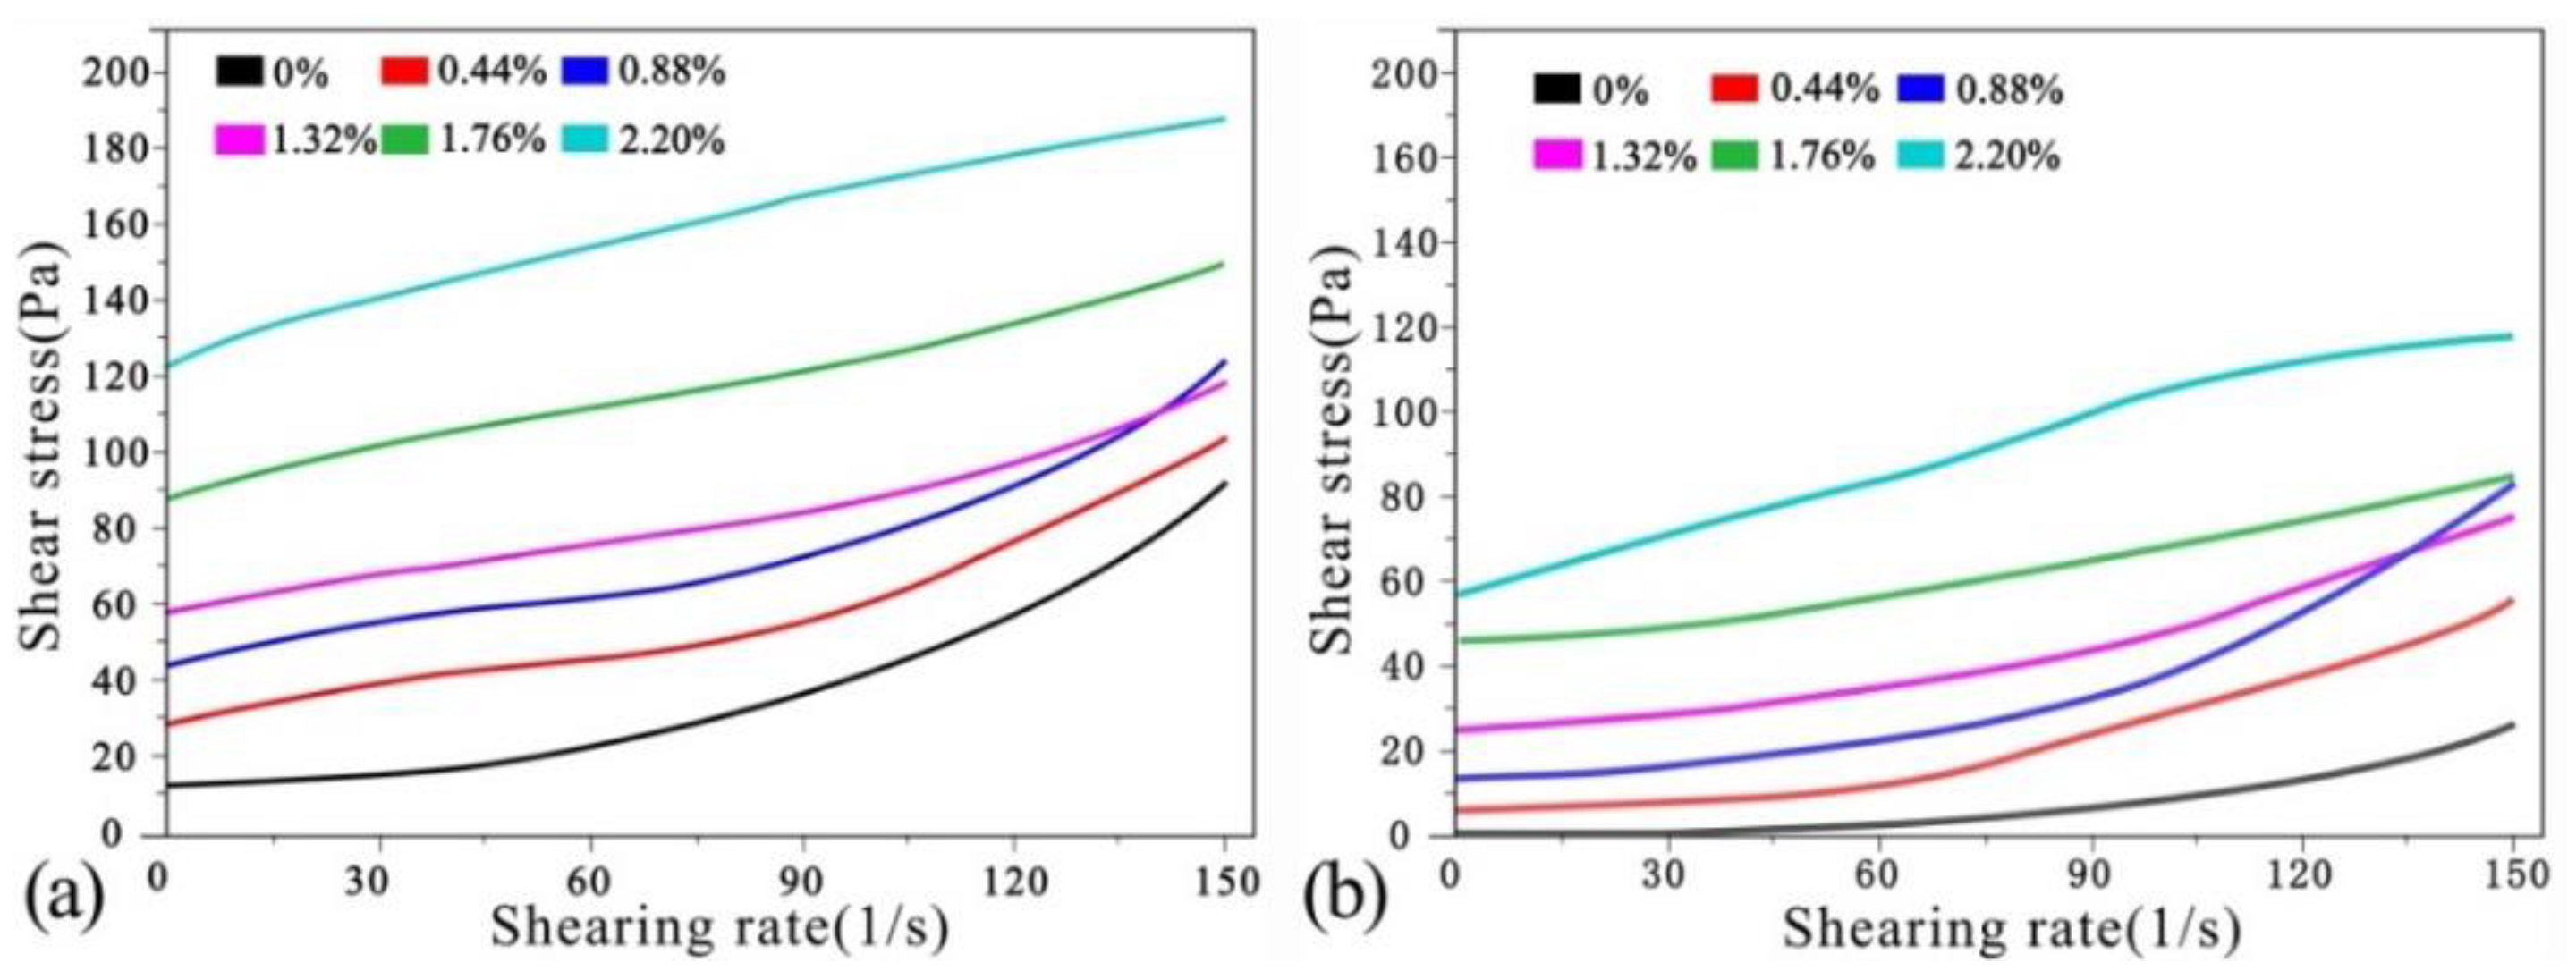
The rheological curves of the cement pastes after absorbing CO2 under mechanical vibration are shown in Figure 4a. The shear stresses of the net cement pastes in different groups are summarised in Table 4. It can be seen from Figure 4a and Table 4 that the initial shear stress of the net cement paste under mechanical vibration is 7.56 Pa. At shear rates <120 L/s, the shear stress increases slowly with the shear rate. At shear rates >120 L/s, the shear thickening increases quickly and the shear stress increases in a straight line. At CO2 AA = 0.44%, the paste-thickening phenomenon occurs and the initial shear stress increases to 17.5 Pa. With increases in shear rate, the shear stress increases slowly and the rate of increase declines to some extent. At CO2 AA = 0.88%, the initial shear stress increases further to 25.1 Pa and the trend is very similar to that at 0.44%. At CO2 AA = 1.32%, the shearing resistance continues to increase, while the initial shear stress increases to 29.6 Pa. Under this circumstance, the rheological curve rises at a slow rate. At CO2 AA = 1.76%, the thickening phenomenon is more obvious. The trend when the initial shear stress is increased to 46.5 Pa is similar to that at 1.32%. Shear thickening becomes more obvious at CO2 AA = 2.20%. The initial shear stress reaches 77.6 Pa and the rheological curve has a parabolic shape.
(b) Ultrasonic vibration stirring
The rheological curves of cement pastes after CO2 absorption under ultrasonic vibration are shown in Figure 4b. The shear stresses of the net cement pastes of all groups are summarised in Table 5. It can be seen from Figure 4b and Table 5 that in the initial stage of the shear rate of net cement pastes under ultrasonic vibration, the shear stress is 12.8 Pa. At shear rates of 0–90 L/s, the shear stress increases slowly. At shear rates >90 L/s, shear thickening increases in a straight manner. At CO2 AA = 0.44%, the initial shear stress increases to 40.2 Pa and the paste thickening increases obviously. At shear rates of 0–120 L/s, the shear stress increases slowly. The thickening accelerates at shear rates >120 L/s, resulting in a linear increase in shear stress. At CO2 AA = 0.88%, the initial shear stress increases to 55.1 Pa and the curve is similar to that at 0.44%. When the CO2 AA is increased to 1.32%, the initial shear stress increases to 69.1 Pa. Under this circumstance, the rheological curves increase at a steady rate without obvious growth. At CO2 AA = 1.76%, the thickening phenomenon is more significant and the initial shear rate increases to 105 Pa. At CO2 AA = 2.20%, shear thickening continues to increase and the rheological curves also increase slowly. (Note: N = 10, mean ± S.D. N presents number of samples).
(c) Analysis of shear stress in cement pastes after CO2 absorption
Firstly, the shear stresses of cement pastes before and after CO2 absorption under mechanical vibration were compared. At CO2 AA = 0.44%, shear thickening was obvious at shear rates of 30 L/s, 60 L/s, 90 L/s, 120 L/s and 150 L/s. The shear stresses of cement paste were 131.5%, 82.9%, 61.7%, 40.6% and 23.6% higher before CO2 absorption than afterwards. Moreover, the shear thickening of cement paste became more obvious with increases in CO2 AA and was accompanied by continuous increases in shear stress.
Second, compared with mechanical agitation, the shear stresses of the cement slurries without CO2 input under ultrasonic agitation were 69%, 83%, 87%, 66% and 53% higher at shear rates of 30 L/s, 60 L/s, 90 L/s, 120 L/s and 150 L/s, respectively. At CO2 AA = 0.44%, the shear stresses of the cement slurry were 128.6%, 105.3%, 69%, 59.2% and 39.5% higher, respectively. At CO2 AA = 0.88%, the shear stresses of the cement pastes under ultrasonic agitation were 120%, 108.3%, 94.7%, 68.2% and 60.6% higher compared to those under mechanical agitation. At CO2 AA = 1.32%, the shear stresses of cement pastes under ultrasonic agitation were increased by 133.4%, 120.6%, 88.9%, 70.2% and 61.2%, respectively. At CO2 AA = 1.76%, the shear stresses of cement pastes under ultrasonic agitation were increased by 125.8%, 108%, 103.5%, 98.2% and 87.5%, respectively. At CO2 AA = 2.20%, the shear stresses of cement pastes under ultrasonic agitation were increased by 80.9%, 64.2%, 55.8%, 51.1% and 66.9%, respectively.
Based on the above comparison, the shear stress of cement paste was significantly increased by CO2 absorption under mechanical stirring. Meanwhile, the shear stress was higher after ultrasonic vibration than mechanical vibration, indicating that ultrasonic vibration can more effectively increase the shear stress of carbonised cement paste. Comparison of the rheological curves in Figure 4 and Figure 5 shows that after CO2 absorption under both types of vibration, the cement pastes generally showed positive relationships of shear stress with CO2 AA and shear rate. All curves increase at low rates and some present linear trends after reaching a certain shear rate. Although there are similarities between the curves, they change differently.

5.2. Rheological Models of Cement Paste after CO2 Absorption

An accurate rheological model is the premise for evaluating the rheological characteristics of cement paste. A rheological model of cement paste after CO2 absorption was derived from a comparative analysis of the rheological curves (Figure 4) and the rheological models of several fluids (Figure 1) [23,24,25].
(1) Rheological models of cement paste under mechanical vibration
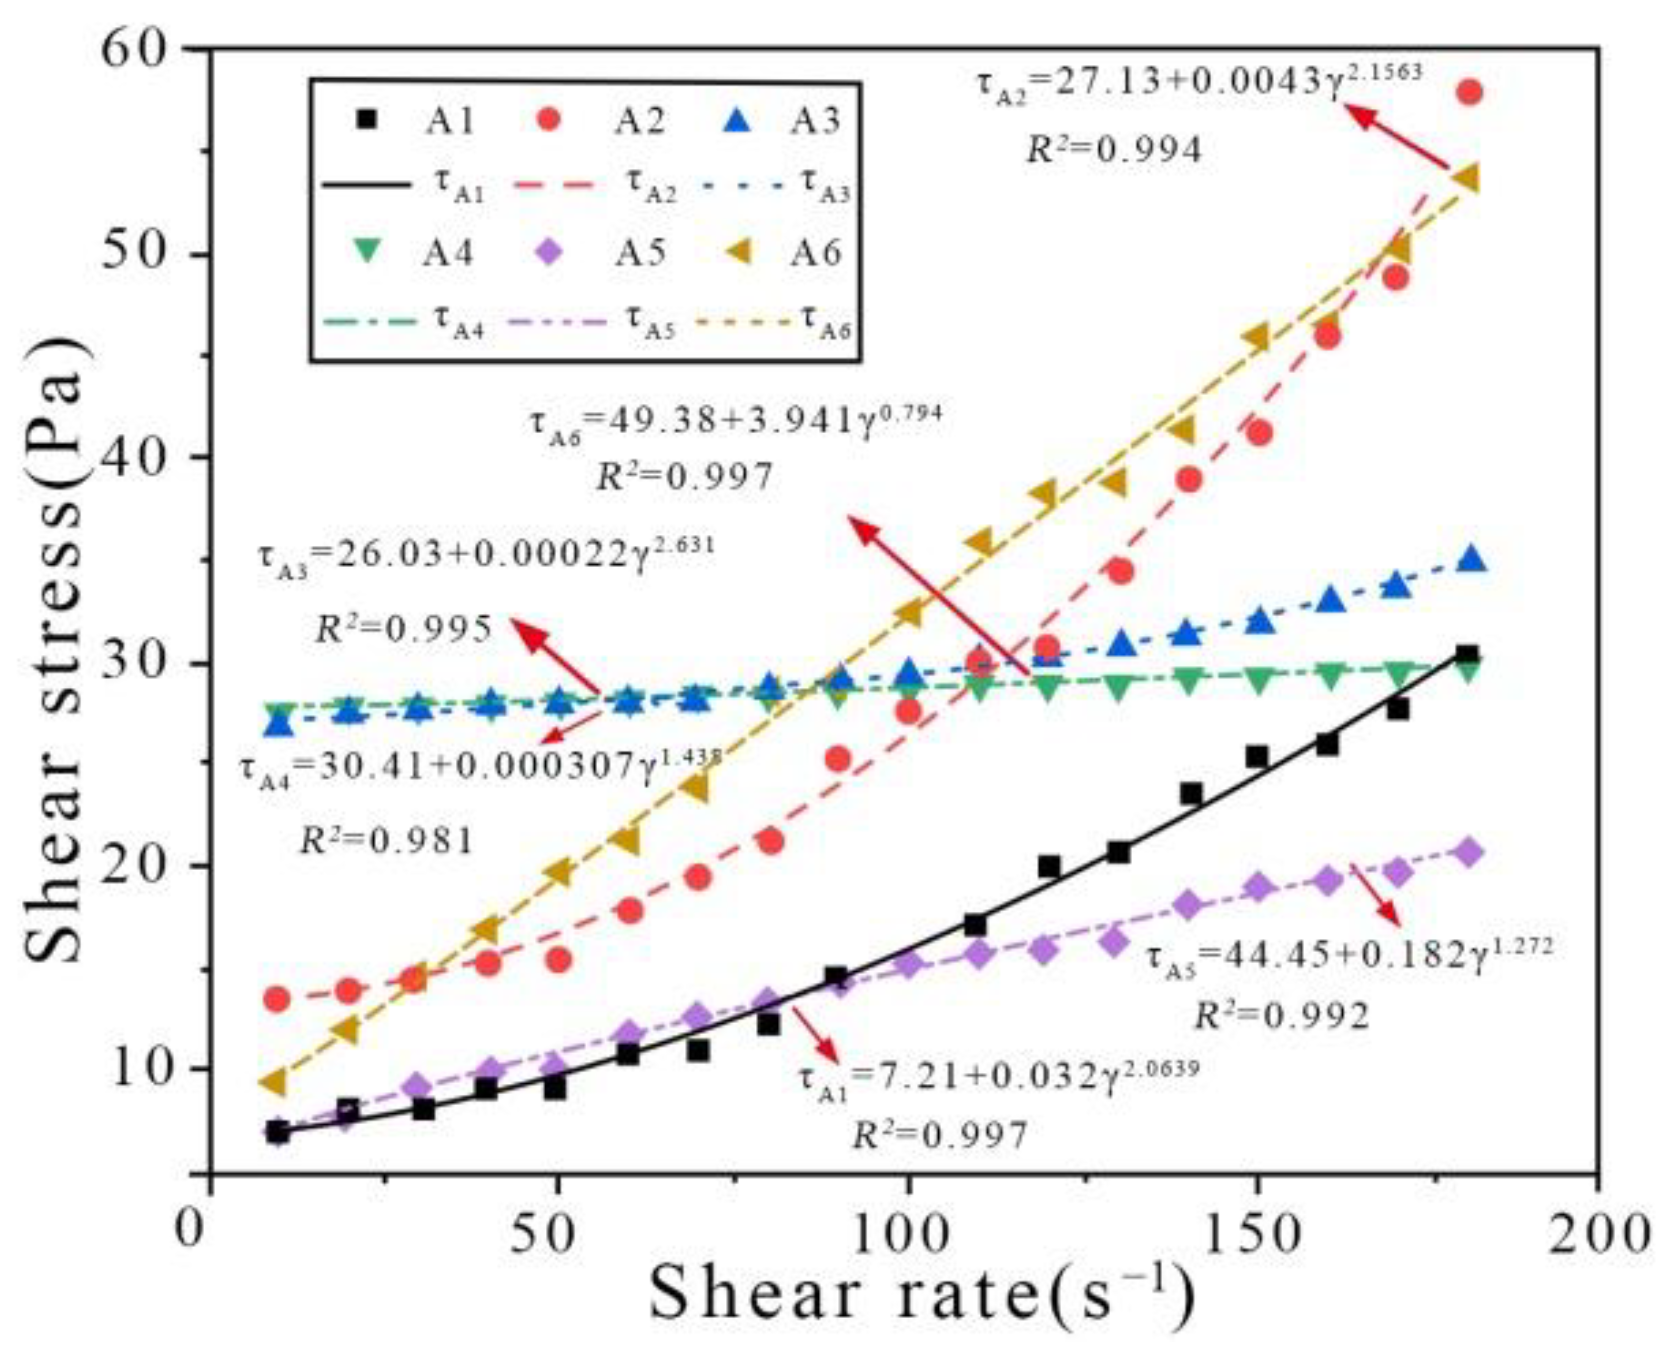
It can be seen from Figure 4a that under mechanical vibration, shear stress is positively related to shear rate, and the rheological curve shows three stages of increase. The rheological curve of cement paste carbonated under mechanical vibration (Figure 1) has a similar shape as the H-B model; hence, this model was selected for fitting to the observed data.
The rheological parameters of cement pastes carbonated under mechanical vibration were fitted using the H-B rheological model. The fitted-model parameters of cement pastes carbonated under mechanical vibration are shown in Figure 5. It can be clearly seen from the fitting data that the power exponent (n) in the parameters in Table 6 meets the H-B rheological model, n ≤ 1 and n > 1. It approaches to the H-B model (n > 1) at CO2 AA = 0.44% and 0.88%. It approaches to the H-B model (n = 1) at CO2 AA = 1.32% and 1.76%. However, it conforms to the H-B model (n < 1) at CO2 AA = 2.20%. Specifically, the R2 coefficient is close to 1 in all cases, indicating accurate modelling. In short, the rheology of cement pastes carbonated under mechanical vibration conforms to the H-B rheological model.
(2) Rheological models of cement paste carbonated under ultrasonic vibration
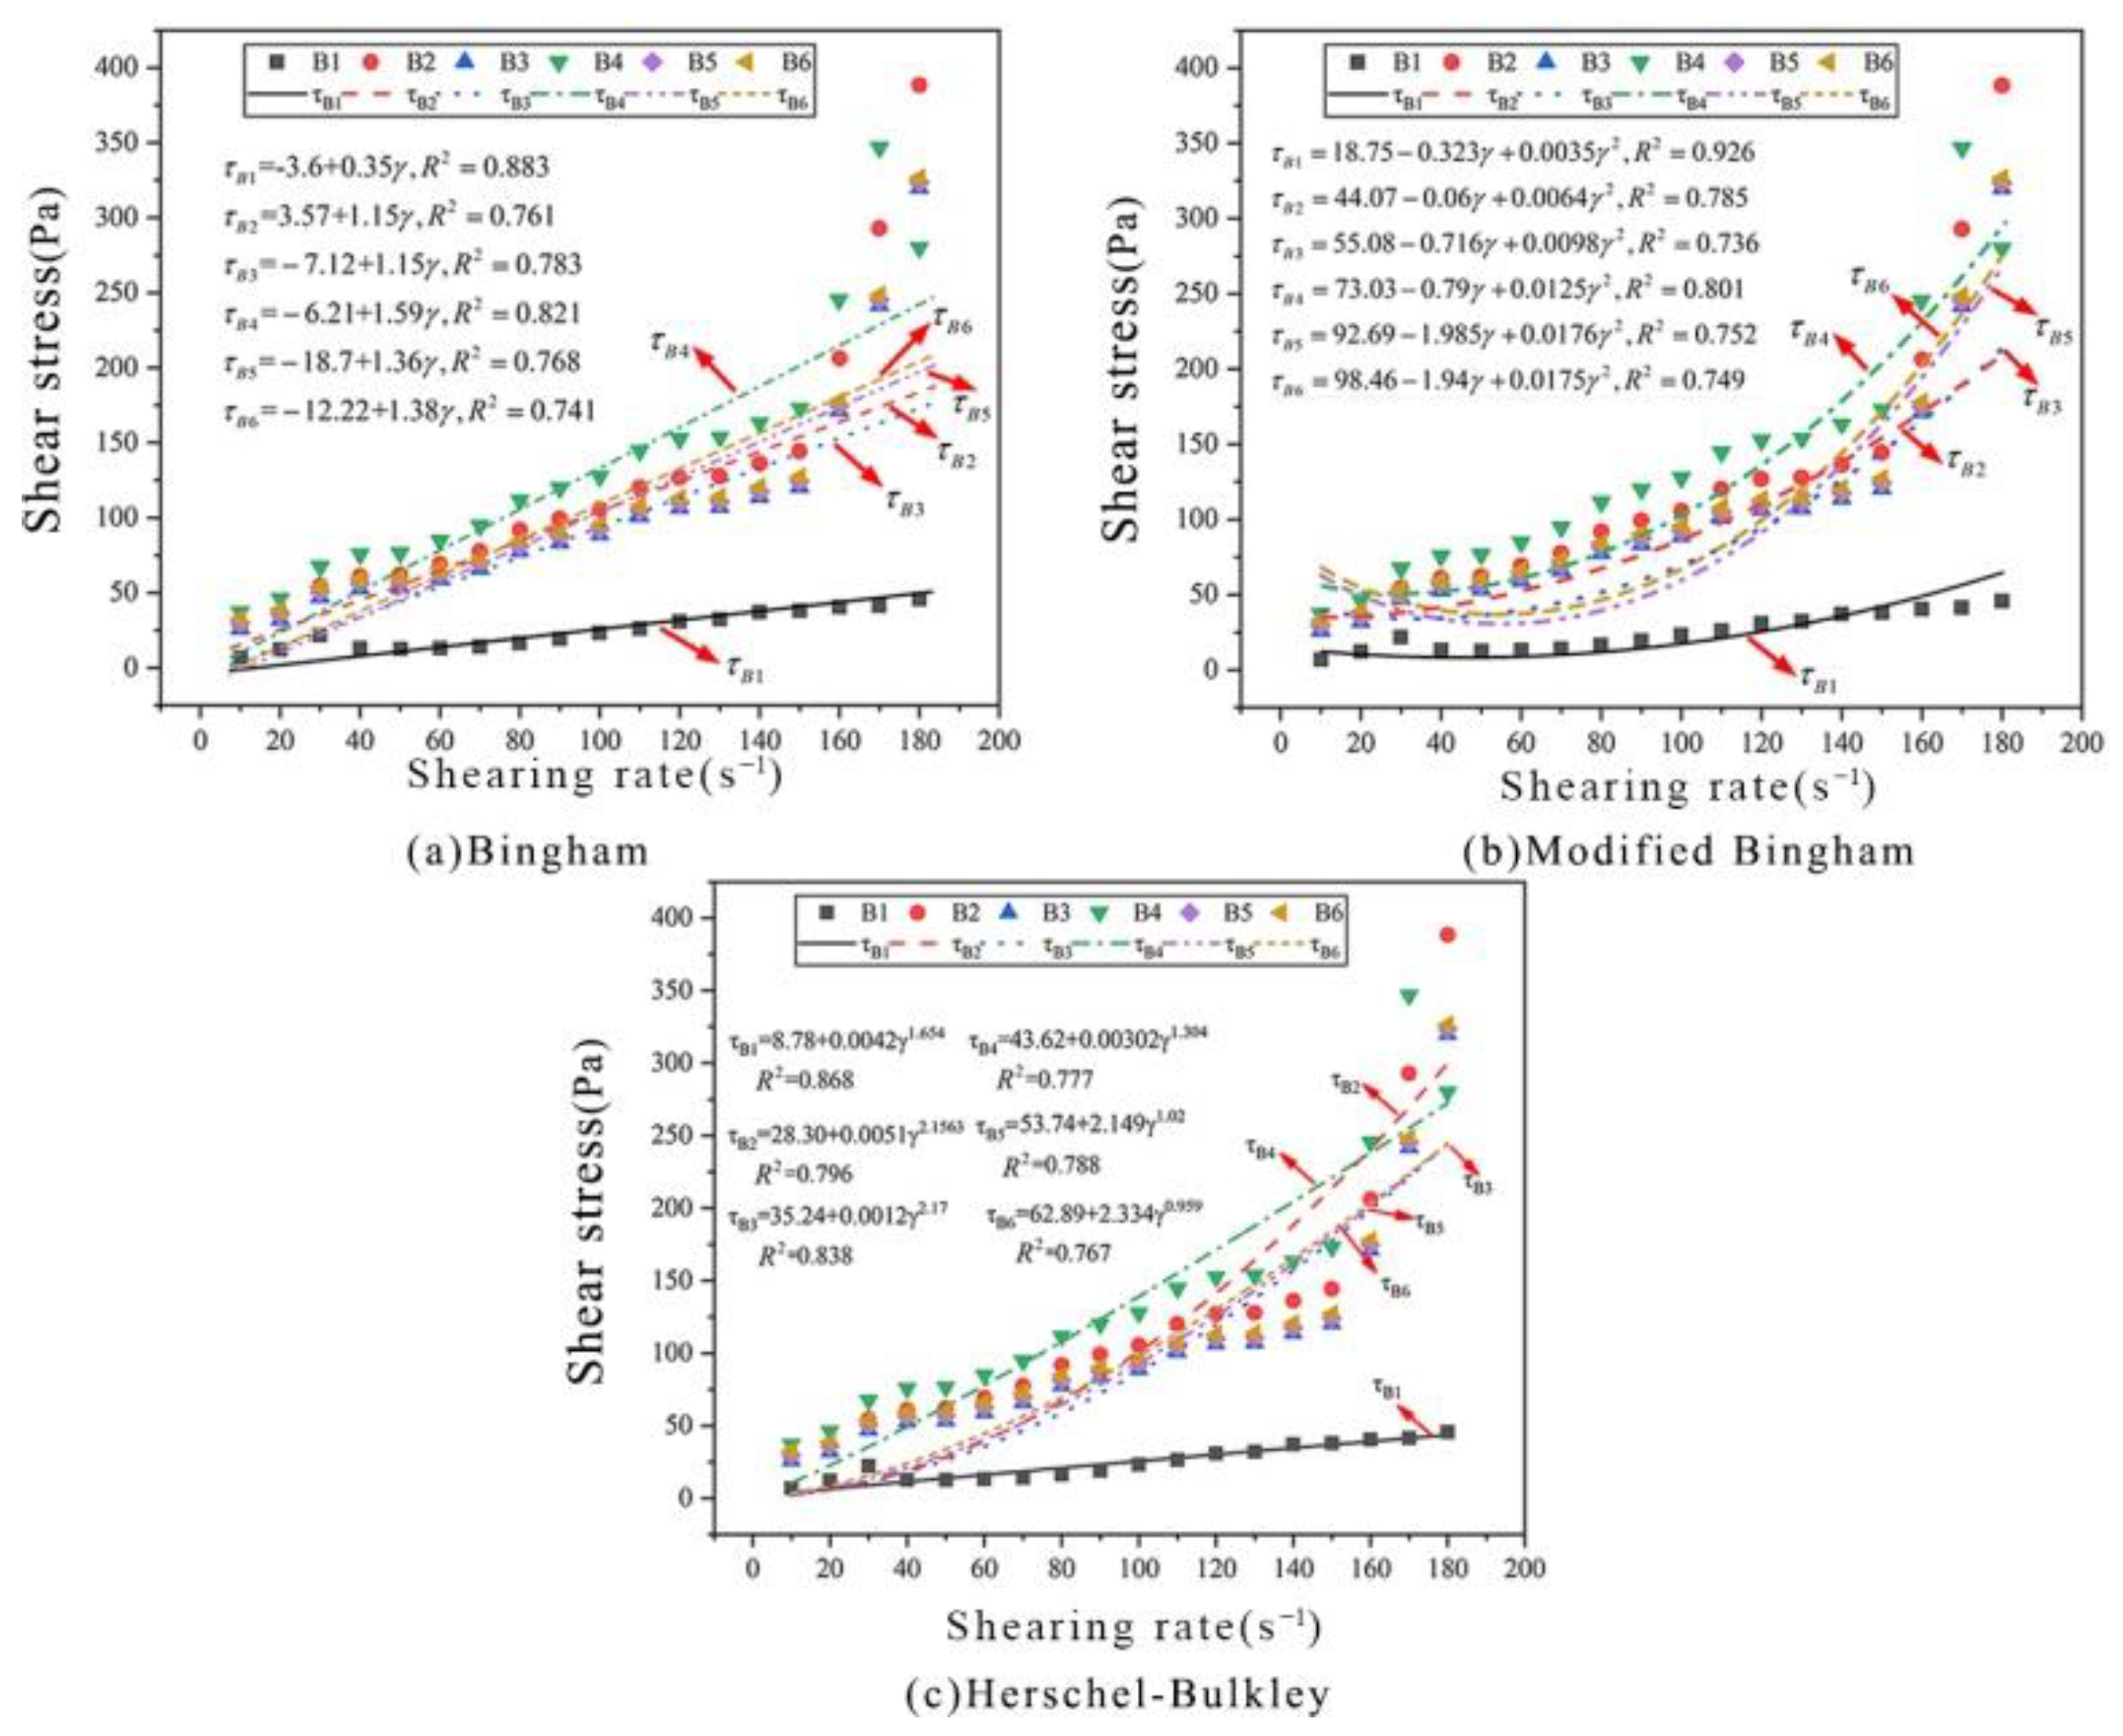
In this study, the rheological characteristics of cement paste carbonated under ultrasonic vibration were modelled based on the Bingham, M-B and H-B models (Figure 6). It can be seen from Figure 6 and Table 7 that all three models have low accuracy with R2 coefficients < 0.8. Therefore, none of these three models can accurately characterise the rheological characteristics.

5.3. Construction of Rheological Models of Cement Paste Carbonated under Ultrasonication

(1) Rheological models of cement paste carbonated under ultrasonication
Based on the above analysis, the rheological curves of cement pastes carbonated under ultrasonication do not all conform to the traditional Bingham, M-B and H-B models as well as those carbonated under mechanical vibration. However, it can be concluded from the R2 values although the fitted curves have low accuracy, they do have some of the characteristics of the rheological models [26,27,28]. This is because the above models are ideal and cannot characterise the actual ultrasonication characteristics. On this basis, a practical rheological model that is applicable to cement-based materials carbonated under ultrasonic vibration is proposed by combining characteristics and advantages of the above three models:
τ = τ 0 + ε γ + η γ 2 + ξ γ 3 + ς γ 4
where τ is the shear stress; τ 0 is the yield stress; γ is the shear rate; and ε , η , ξ and ς are constants.
(2) Applications of rheological models of cement paste carbonated by ultrasonication
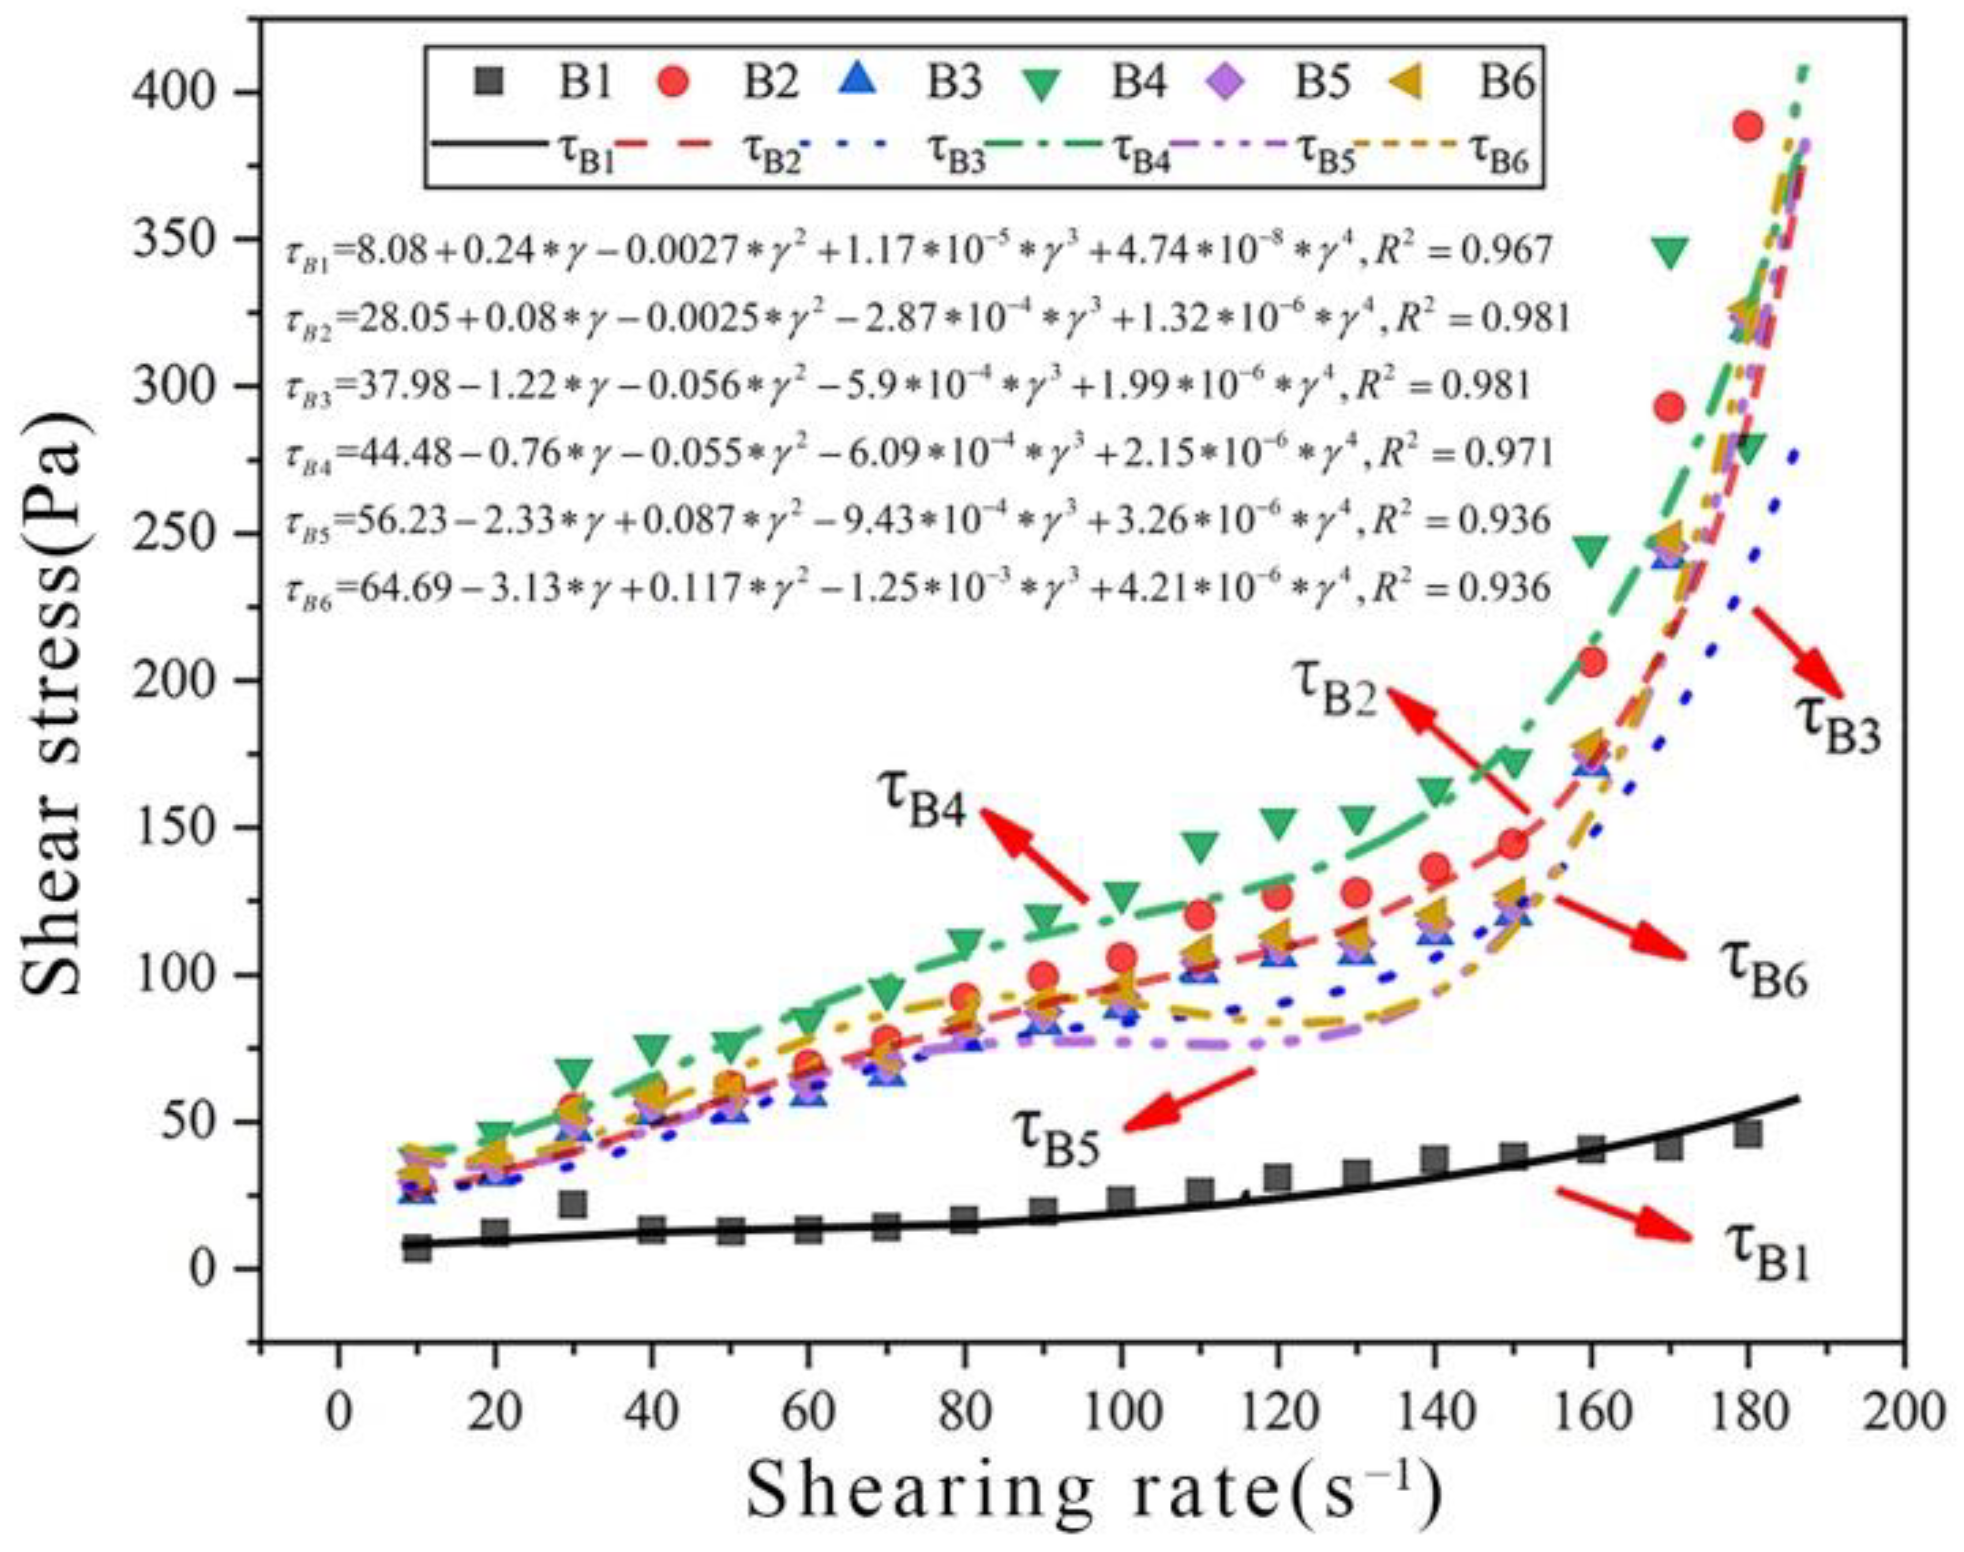
To judge whether the rheological model of carbonated cement paste is applicable to the actual rheological model of cement-based materials carbonated under ultrasonic vibration, rheological data under different CO2 AA values were modelled again. The results are shown in Figure 7 and Table 8. Clearly, the R2-values are >0.9 for all rheological curves of cement pastes with different CO2 AA values, indicating that these curves meet the fitting requirements well. This proves that the rheological model of carbonated cement paste is appropriate for the actual rheological characteristics of cement-based materials carbonated under ultrasonic vibration.

5.4. Comparative Analysis of the Rheological Properties of Carbonated Cement Paste

(1) Comparative analysis of viscosity
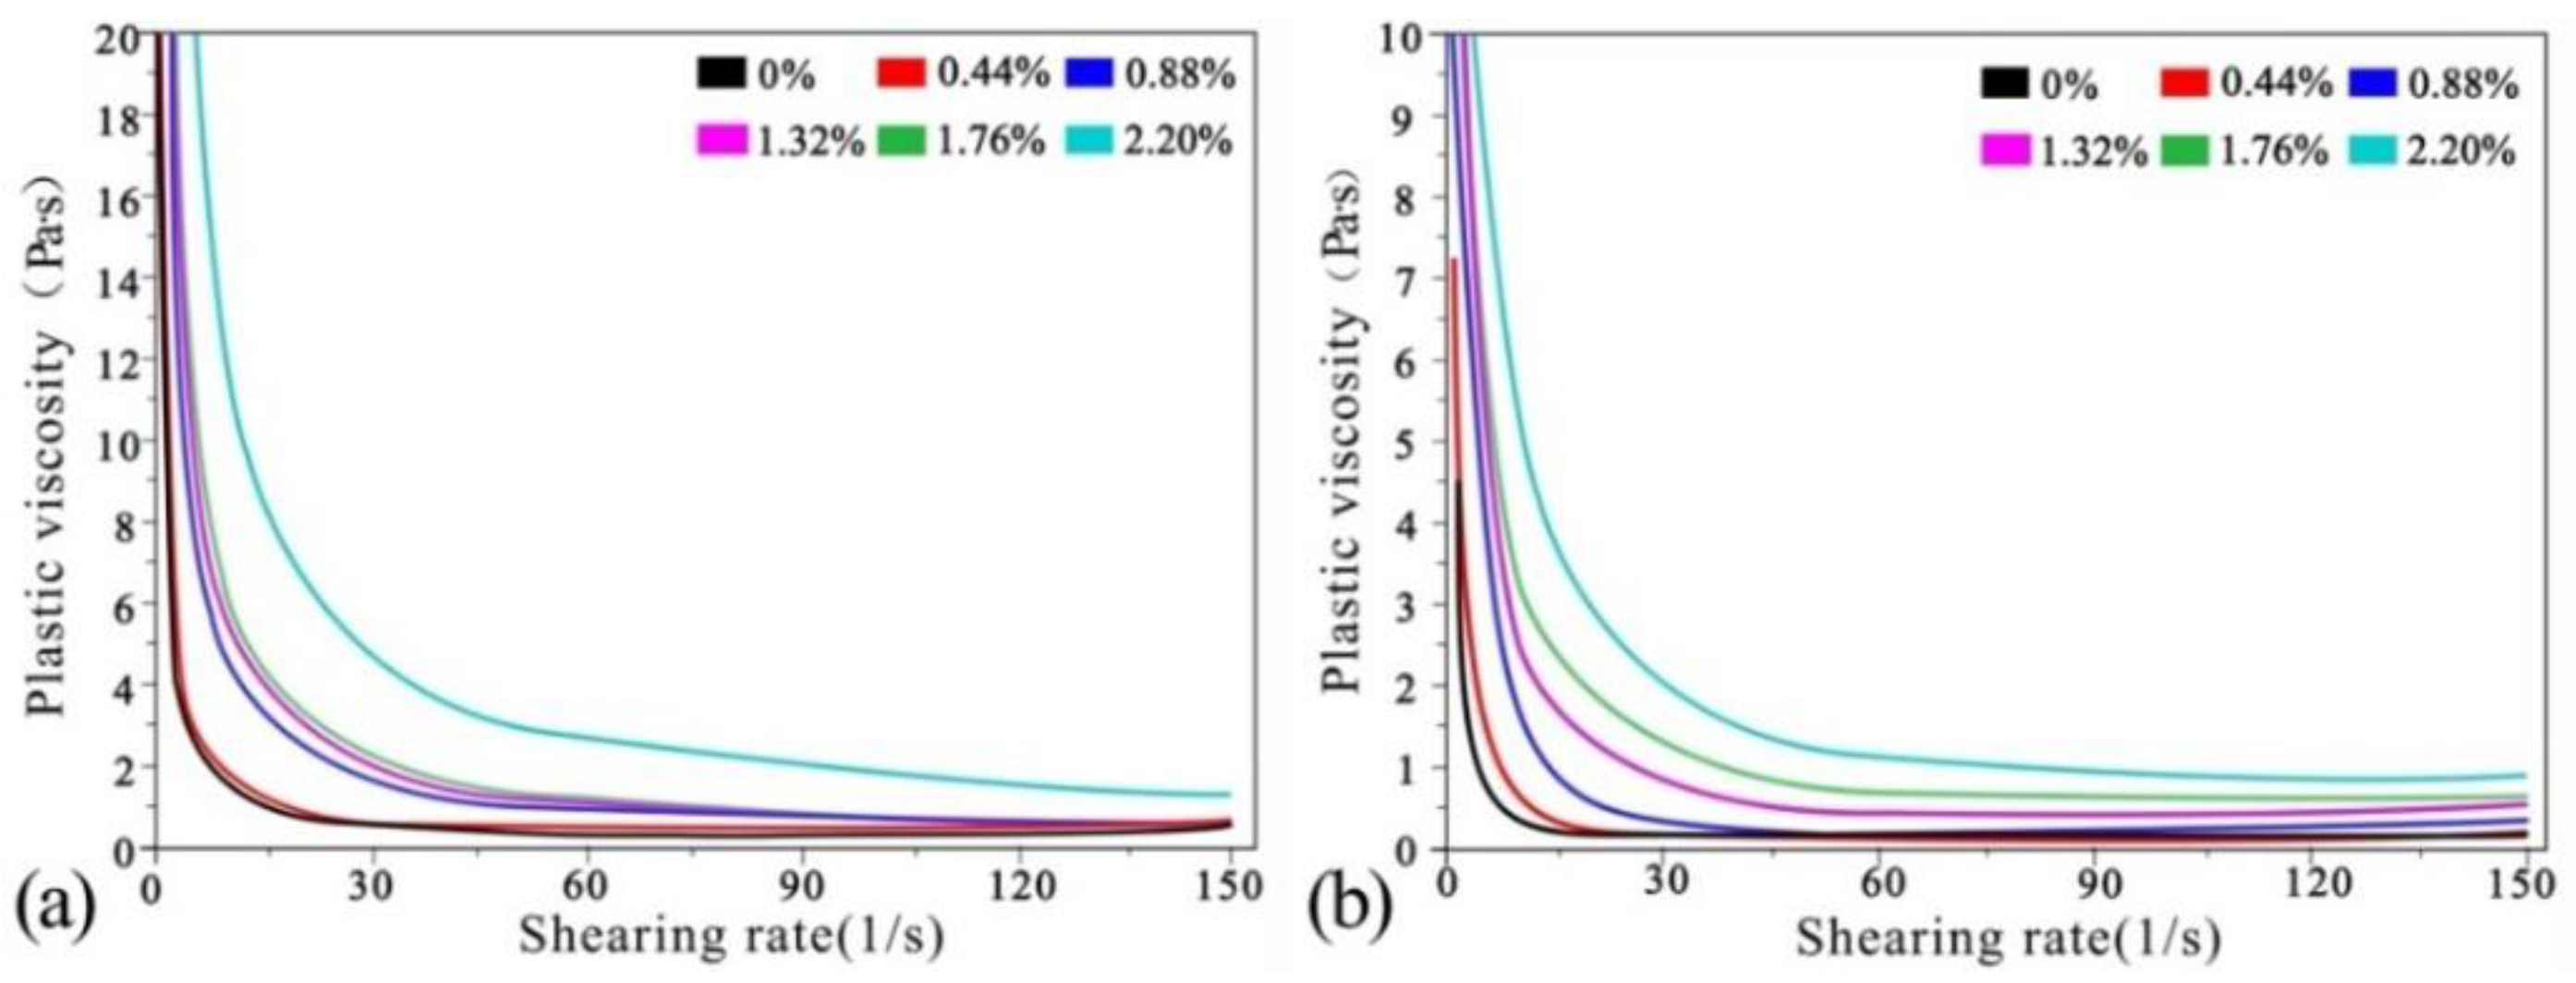
Viscosity curves of net cement pastes after carbonation under mechanical and ultrasonic vibration are shown in Figure 8a,b. Table 9 and Table 10 show the viscosity values more clearly. The viscosity values were estimated for cement-paste shear rates of 30 L/s, 60 L/s, 90 L/s, 120 L/s and 150 L/s and CO2 AA values of 0%, 0.44%, 0.88%, 1.32%, 1.76% and 2.20%, respectively.
It can be seen from Table 9 and Table 10 that viscosity of cement paste before carbonation at shear rates of 30 L/s, 60 L/s, 90 L/s, 120 L/s and 150 L/s were 96.7%, 80%, 28.1%, 16.7% and 41.5% higher than those carbonated under mechanical vibration. At CO2 AA = 0.44%, the viscosities under ultrasonic vibration were 19.6%, 52.6%, 28.6%, 32.6% and 67.3% higher than under mechanical vibration. At CO2 AA = 0.88%, the viscosities under ultrasonic vibration were 103.8%, 96.2%, 58.8%, 19.2% and 15.4% higher than under mechanical vibration. At CO2 AA = 1.32%, the viscosities under ultrasonic vibration were 83.3%, 83.3%, 5.3%, 19.4% and 0% higher than under mechanical vibration. At CO2 AA = 1.76%, the viscosities under ultrasonic vibration were 48%, 26.3%, 16.9%, 98.2% and 87.5%. At CO2 AA = 2.20%, the viscosities under ultrasonic vibration were 80.9%, 64.2%, 55.8%, 141.5% and 136.5% higher.
Comparison of the two vibration modes shows that the viscosity after ultrasonic vibration is higher than that under mechanical vibration, indicating that ultrasonic vibration can effectively increase the viscosity of fresh cement paste. Moreover, the viscosity of cement paste increases gradually with increases in CO2 AA under both vibration modes. At CO2 AA = 0.44%, the viscosity changes the least with increases in shear rate. At CO2 AA = 0.88%, 1.32% and 1.76%, the viscosity presents similar variations but increases to some extent. At CO2 AA = 2.20%, the viscosity value changes the most.
(2) Comparative analysis of yielding stress
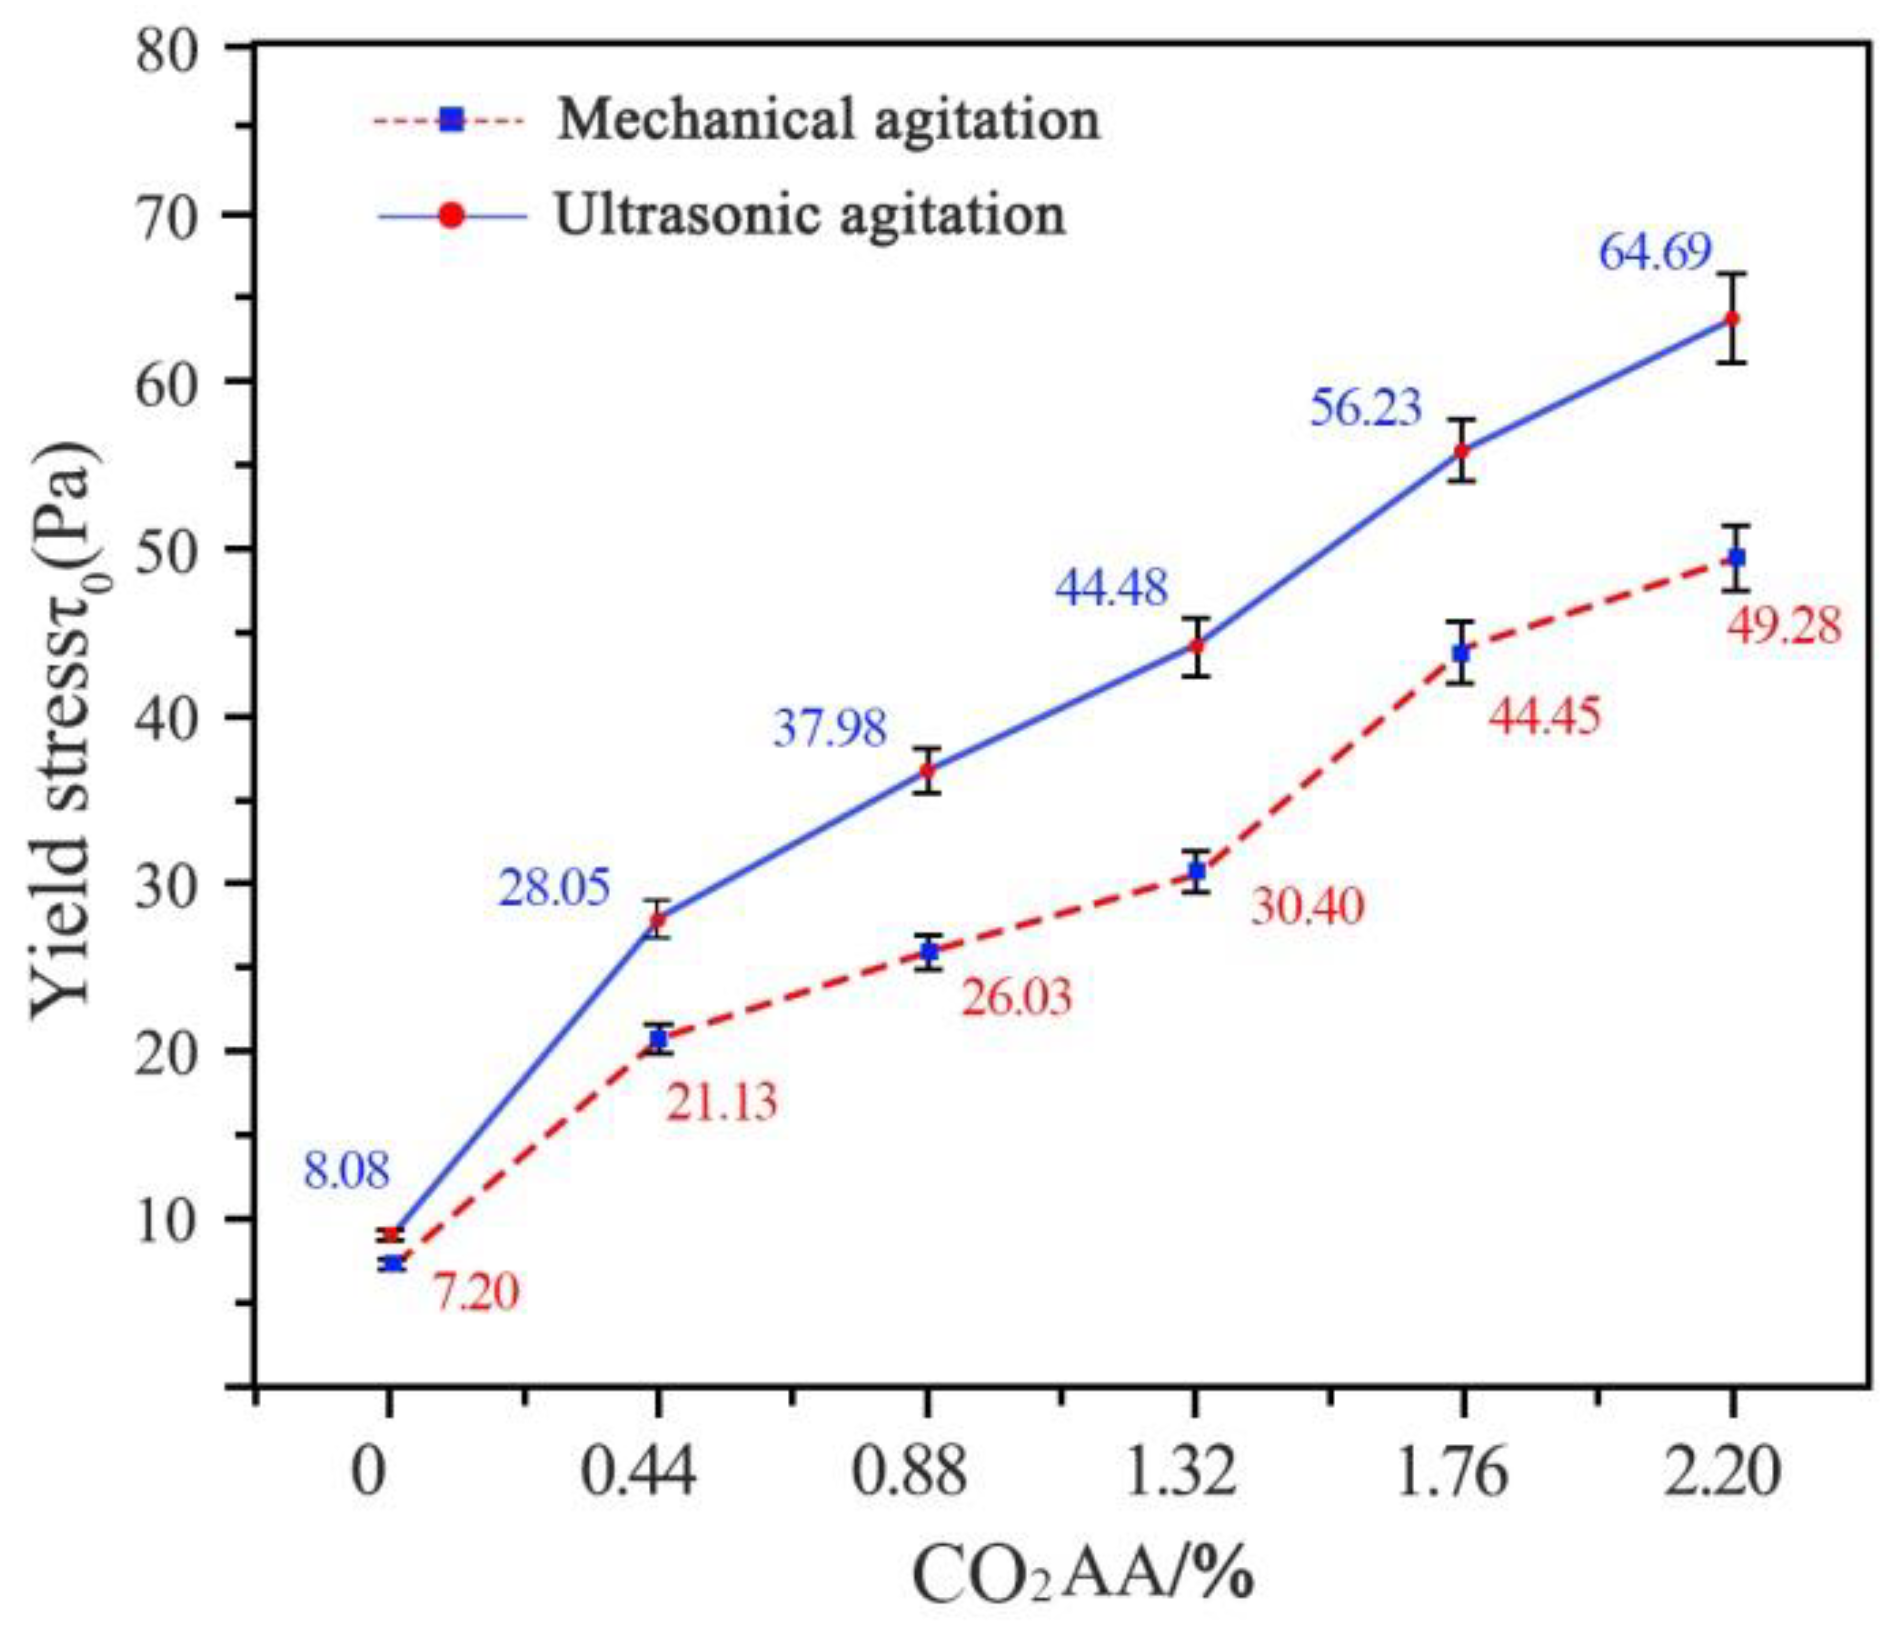
The yield stress of cement paste carbonated under ultrasonic vibration, which was derived from the ultrasonic rheological model, is shown in Figure 9. Mechanical vibration was used as the control group. The yield stress under mechanical vibration was derived from the H-B model. It can be seen from Figure 9 that CO2 AA = 0%, 0.44%, 0.88%, 1.32%, 1.76% and 2.20%. At these values, the yield stresses of cement paste under ultrasonic vibration were 12.2%, 32.7%, 45.1%, 46.3%, 26.5% and 31.3%, respectively, which were higher than those under mechanical vibration. Under ultrasonic vibration, the yield stresses were 247%, 35.4.%, 17.1%, 26.4% and 31.3% higher, respectively. According to the measured data, ultrasonic vibration can effectively improve the yield stress of carbonated cement paste. The yield stress of carbonated cement paste is positively related to CO2 AA.

5.5. Effects of PS on the Rheological Properties of Cement Paste Carbonated under Ultrasonic Vibration

(1) Analysis of shear stress variation
Rheological curves of fresh carbonated cement pastes before and after PS addition are shown in Figure 10. The curves of shear stress after carbonation under ultrasonic vibration are shown in Figure 10a. The curves of shear stress after CO2 carbonation and PS addition are shown in Figure 10b. Table 11 was plotted according to the rheological curves in Figure 10b. The variations in shear stress before adding PS can refer to the comparative analysis in Table 5.
The shear stresses of fresh cement pastes before and after adding water reducer are compared next. At shear rates of 30 L/s, 60 L/s, 90 L/s, 120 L/s and 150 L/s and before carbonation, the shear stresses of fresh cement pastes with added water reducer were 92.2%, 86.2%, 81.9%, 76.4% and 71.5% lower than those without water reducer. At CO2 AA = 0.44%, the shear stresses of cement pastes were 79.8%, 73.6%, 55.6%, 50.6% and 83.3% lower, respectively. At CO2 AA = 0.88%, the shear stresses of cement pastes were 70.5%, 67.2%, 53.6%, 41.5% and 32.6% lower, respectively. At CO2 AA = 1.32%, the shear stresses were 61.2%, 54.3%, 47.9%, 39.1% and 36.9% lower, respectively. At CO2 AA = 1.76%, the shear stresses were 52.5%, 47.9%, 46.6%, 44.4% and 42.4% lower. At CO2 AA = 2.20%, the shear stresses were 48.6%, 45.6%, 40.3%, 37.6% and 37% lower, respectively.
Based on the above comparison, the shear stress of carbonated fresh cement paste declines significantly after adding water reducer. Even in fresh cement pastes with the same amount of CO2, the shear stresses of cement pastes with and without water reducer decline sharply.
(2) Analysis of viscosity-curve variation
Viscosity curves of fresh carbonated cement pastes before and after PS addition are shown in Figure 11. The curves for pastes carbonated under ultrasonic vibration are shown in Figure 11a. The viscosity curves for carbonated pastes after PS addition are shown in Figure 12b. Table 12 is plotted according to the viscosity curves after adding water reducer (Figure 11b). The variation in viscosity before PS addition can be compared in Table 10.
The viscosities of fresh cement pastes before and after PS addition are compared in this section. Without a supply of CO2 and at shear rates of 30 L/s, 60 L/s, 90 L/s, 120 L/s and 150 L/s, the viscosities of cement pastes decreased by 74.6%, 55.6%, 58.5%, 61.9% and 67.2%, respectively, after PS addition. At CO2 AA = 0.44%, the viscosities decreased by 77.9%, 80.4%, 67.9%, 51.6% and 36.7%. At CO2 AA = 0.88%, the viscosities decreased by 77.9%, 80.4%, 67.9%, 51.6% and 36.7%. As CO2 AA continued to increase to 1.32%, the viscosities decreased by 61.4%, 64.4%, 52.7%, 33.8% and 11.3%. When CO2 AA = 1.76%, the viscosities decreased by 86%, 43.3%, 26.5%, 61.8% and 59.1%. At CO2 AA = 2.20%, the viscosities decreased by 55.2%, 57.3%, 50.7%, 43.2% and 34.8%, respectively.
Through the above comparison, adding water reducer can decrease the viscosity of carbonated cement paste effectively. The viscosity of fresh cement paste increased to some extent with increases in CO2 AA. Hence, it is concluded that adding water reducer can effectively improve the liquidity of cement paste after carbonation. However, such liquidity weakens with increases in CO2 AA.

6. Microstructural Analysis of Cement Paste with Water Reducer

6.1. Microstructural Characterisation of Cement Paste with Water Reducer

Scanning electron microscope (SEM) images of hydrated cement paste are shown in Figure 12. SEM images of hydrated cement pastes (CO2 AA is 1.76%) before and after water reducer addition are shown in Figure 12a,b (the enlargement factor is 500×). It can be seen from Figure 12a that before adding water reducer, flocculants of cement paste show relatively complicated distributions and the diameter-size distribution differs greatly (diameter = 10–50 μm).
It can be seen from Figure 12b that for cement paste with water reducer, the flocculant distribution is relatively uniform and the particle size also decreases. The flocculant particles become tighter. Finally, it can be seen from Figure 12a,b that porosity decreases significantly after adding water reducer.
SEM images at 5000× magnification before and after adding water reducer are shown in Figure 12c,d. Smaller-sized hydration structures can be clearly observed. It can be seen from Figure 12c that cement-particle sizes are uneven before adding water reducer and flocculants look like the shape of the cotton, accompanied by high porosity. There are needle-like AFt crystals produced by the hydration of C3A, as well as CaCO3 crystals formed by carbonation of the cement paste.
Additionally, it can be seen from Figure 12d that the cement-particle distribution with water reducer is more uniform and the pores are smaller. The main sizes in the system change. Except for some large cement particles, particles 2–4 µm in diameter dominate. The particle size decreases and the structure is relatively loose. The results demonstrate that after adding water reducer, flocculation particles are dispersed effectively and the liquidity of the cement paste increases accordingly.

6.2. Rheological Microstructural Model of Cement Paste with Water Reducer after Carbonation

(1) Construction of the rheological microstructure model
The rheological microstructural model of cement paste with water reducer after carbonation is shown in Figure 13. Adding water reducer to fresh cement paste not only prolongs the chemical reaction of the cement effectively but also changes the volume and space distributions of the products, thus decelerating coagulation after hydration of the cement. Moreover, water-reducer molecules adhering to particle surfaces may induce changes in electrical properties. Influenced by “steric hindrance”, flocculates disperse and flocculation water is released, thus increasing free water [29,30]. According to the mechanism of the water reducer and combined with the above rheological analysis, a rheological microstructural model of paste with water reducer can be derived.
Since water reducer can delay the hydration of cement, it not only decelerates the coagulation of cement to some extent but also changes the volumetric and spatial distribution of hydration products and hinders the flocculation of cement particles. As a result, the liquidity of cement can be maintained to some extent in the early stage. According to the mechanism of the water reducer and with considerations of the above rheological analysis, the rheological microstructural model of paste with water reducer can be gained [31].
(2) Rheological model analysis of cement paste with water reducer after carbonation
Figure 13a shows that flocculants in cement paste without CO2 disperse uniformly under ultrasonic vibration. After water reducer is added, flocculation water in flocculants is released and flocculants are dispersed into several small cement particles. Cement pastes supplied with 0.44%, 0.88%, 1.32%, 1.76% and 2.20% CO2 are shown in Figure 14b–f. Clearly, CO2 and cement hydrates react to produce CaCO3 crystals, which adhere to surrounding flocculants. With increases in CO2 AA in fresh cement paste, CaCO3 crystals adhering to surrounding flocculants also increase continuously, thus restricting the effective release of free water from the fresh cement paste. Moreover, free-water release decreases with increases in CO2 AA, thus making the liquidity of the cement paste decline gradually.
Moreover, flocculants in fresh cement pastes are dispersed effectively under ultrasonic vibration after water reducer is added, thus enabling the release of water wrapped in the flocculants. Hence, the free water in fresh cement paste increases and the liquidity is improved. It can be seen from Figure 13b–f that with increases in CO2 AA, the number of flocculating structures that are separated effectively decreases, thus resulting in a relatively small amount of released free water. The liquidity of cement paste declines continuously.
(3) Summary of the rheological model of carbonated cement paste with water reducer
The liquidity of cement paste with water reducer deteriorates after CO2 absorption. This is mainly because with increases in CO2 AA, the CaCO3 crystals on the surfaces of flocculants and cement particles increase, including AFt crystals produced by the hydration of cement [32]. After water reducer is added, water-reducer molecules enter organic mineral phases. Since excessive CaCO3 crystals and AFt are wrapped on the surfaces of flocculants and cement particles, water-reducer molecules cannot develop the role well. During vibration, only some flocculants are dispersed, thus preventing flocculant water from being released well. Accordingly, free-water growth declines. As a result, the liquidity of cement paste worsens after CO2 absorption. In a word, the liquidity of cement paste is negatively related to its CO2 AA.

7. Molecular Analysis of the C-S-H Gel Structure of Absorption CO2 Cement Slurry

A COMPASS force field was applied to the C-S-H gel structure using the Amorphous Cell module in Materials Studio. The selected molecules were input to the model through the constructed PC model to analyse the kinetic energies and pressures in the molecules as well as the radial distribution function [33].

7.1. Construction of the Molecular Model

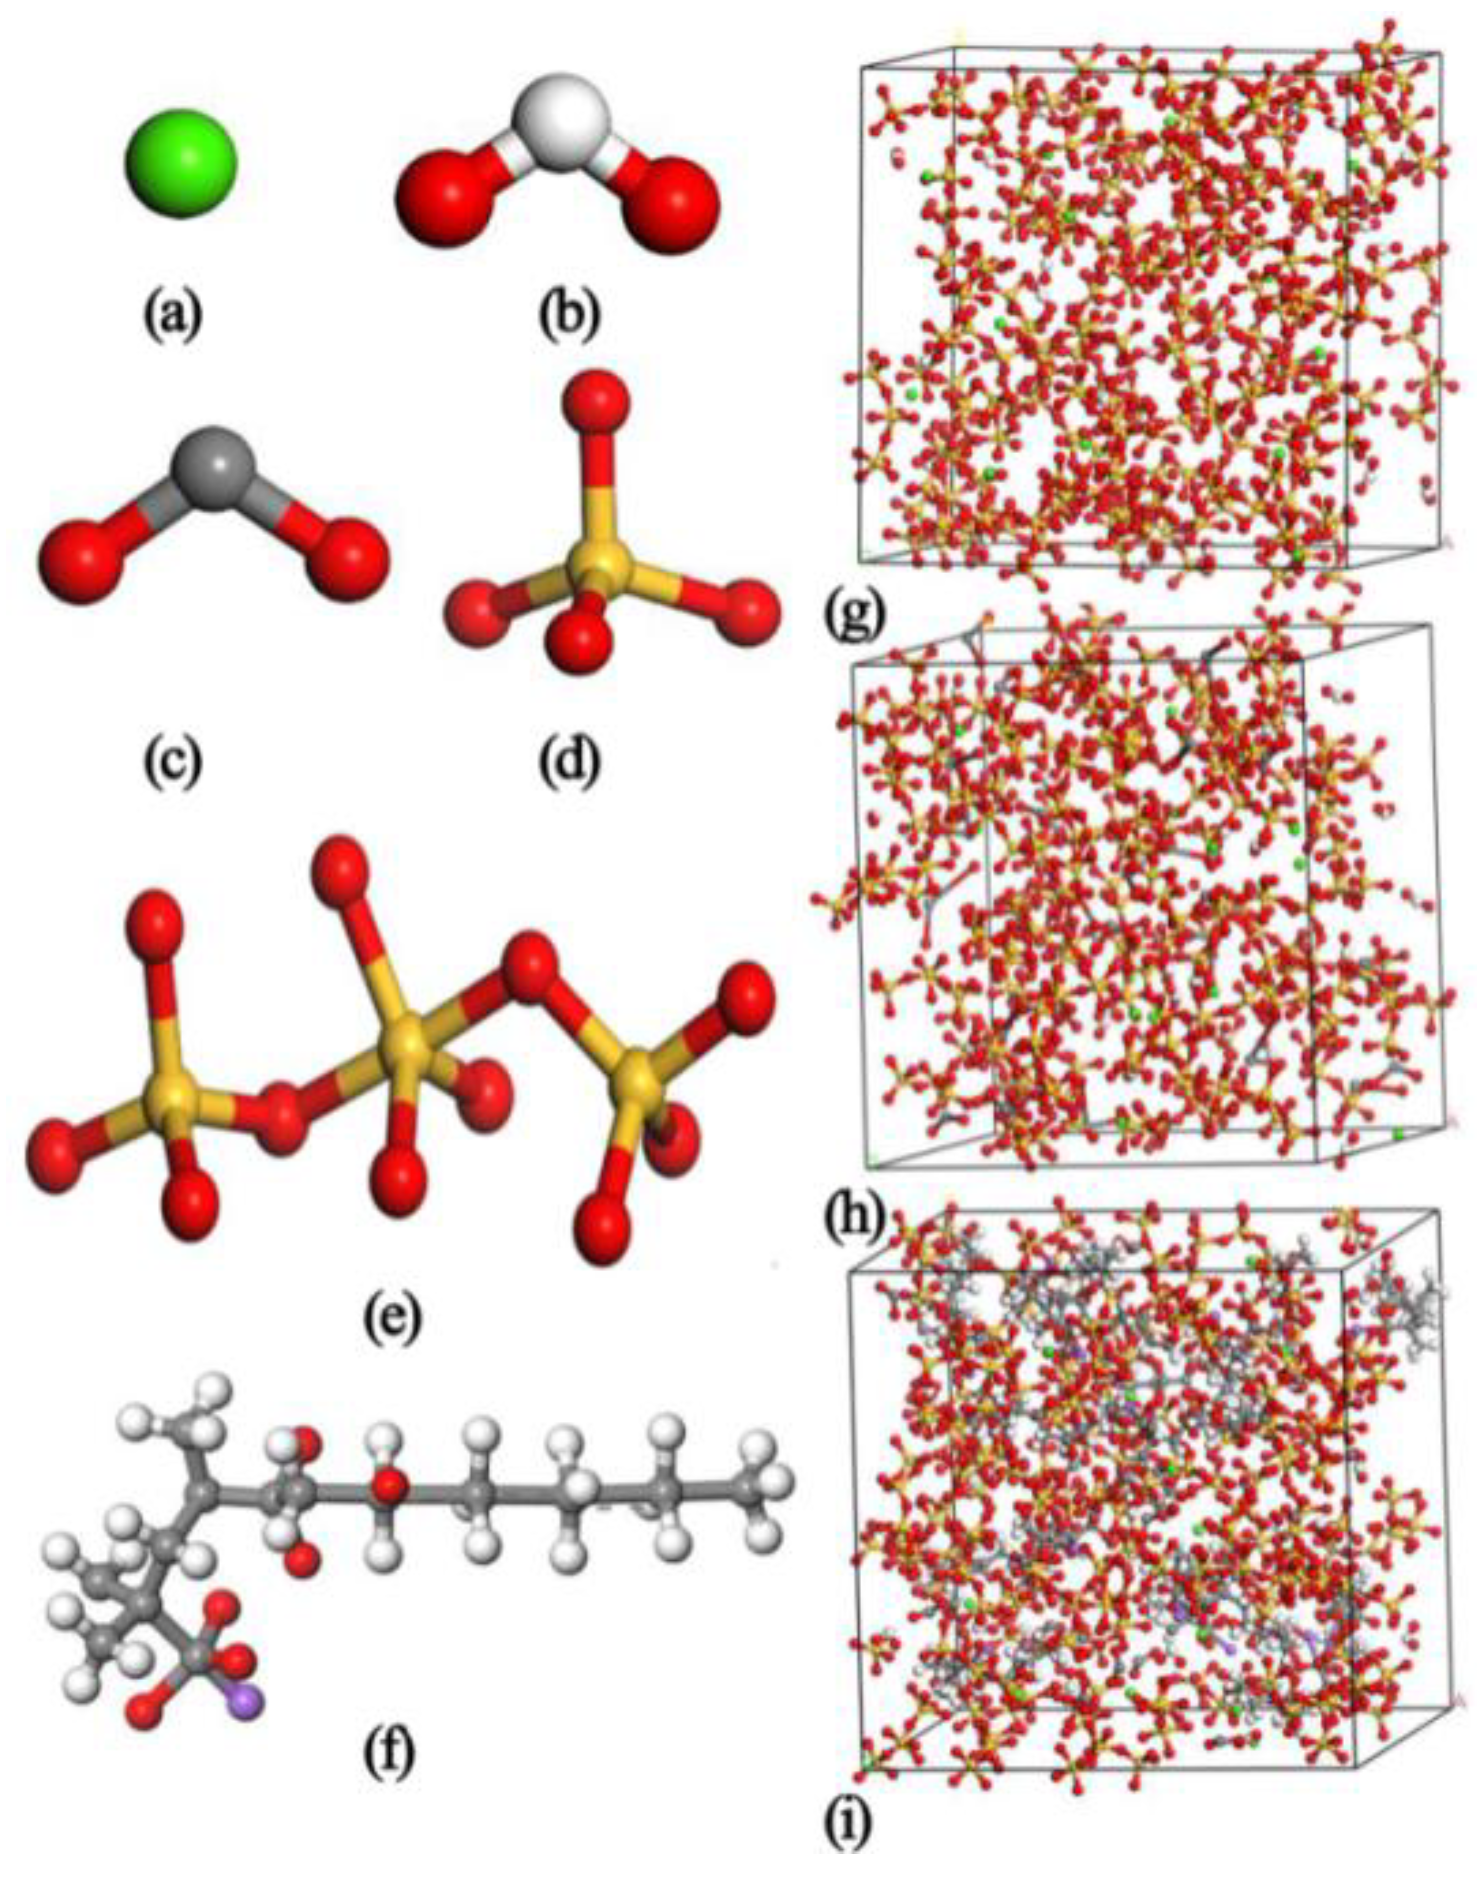
Ca, H2O, CO2, C-S-H-Q1, C-S-H-Q2 and PS were chosen as the basic units (Figure 14a–f). According to the molecular proportions of the proposed C-S-H gel, 100 Poly (sialate-siloxo) molecules were chosen randomly. A total of 50 Na+ and 20 H2O molecules were distributed into the simulation box, thus establishing an initial structural model of C-S-H gel (PC, Figure 14g). Next, 40 CO2 molecules were put into the constructed PC model to establish a model in which CO2 was supplied to the C-S-H gel (PC + CO2, Figure 14h). In the PC + CO2 model, 20 water-reducer molecules were added to establish a PC + CO2 + water-reducer model (PC + CO2 + JS, Figure 14i).

7.2. Kinetic-Energy and Potential-Energy Variations in Molecules

The influences of molecular kinetic energy and potential energy are shown in Figure 15. Clearly, the potential and kinetic energies of the molecular structures of PC, pure cement with CO2 (PC + CO2) and pure cement with CO2 and water reducer (PC + CO2 + JS) are positive. This indicates that interactive intermolecular forces in the NASH gel structure create positive work and the forces among molecules are repulsive. The molecular potential energies of the C-S-H gel, C-S-H gel + CO2 and C-S-H gel + CO2 + water reducer are 13,113.809 kJ/mole, 13,570.697 kJ/mole and 22,864.47 kJ/mole, respectively. This indicates that the intermolecular repulsion forces in the C-S-H gel + CO2 and C-S-H gel + CO2 + water reducer are larger than the attractive forces. The interaction forces among molecules make negative work and the molecular potential energy increases. The CO2 and water reducer can increase repulsion among particles in the molecular structure, thus improving the dispersion effect of C-S-H gels.
The molecular kinetic energies of the C-S-H gel, C-S-H gel + CO2 and C-S-H gel + CO2 + water reducer are 1104.896 kJ/mole, 1124.326 kJ/mole and 1133.174 kJ/mole, respectively. This indicates that adding CO2 and CO2 + CSH into a CSH gel can intensify the vibration amplitude of the molecular particles in the structure and thereby decrease the intermolecular forces. CO2 and water reducer can increase the driving forces among the particles in the molecular structures, thus improving the dispersion effect of the CSH gel.

7.3. Internal Pressure in Molecules

The influences of CO2 and water reducer on intermolecular pressures in the C-S-H gel structure are shown in Figure 16. Adding CO2 and water reducer to the C-S-H gel can transform the intermolecular pressure from positive to negative, indicating that the C-S-H gel is generally transformed from compression to tension. The internal pressures in the PC, PC + CO2 and PC + CO2 + JS are 0.173 GPa, −0.054 GPa and −0.031 GPa, respectively. To sum up, adding CO2 or CO2 + water reducer can decrease the intermolecular constraining force and increase movement among molecules.

7.4. Radial Distribution Function

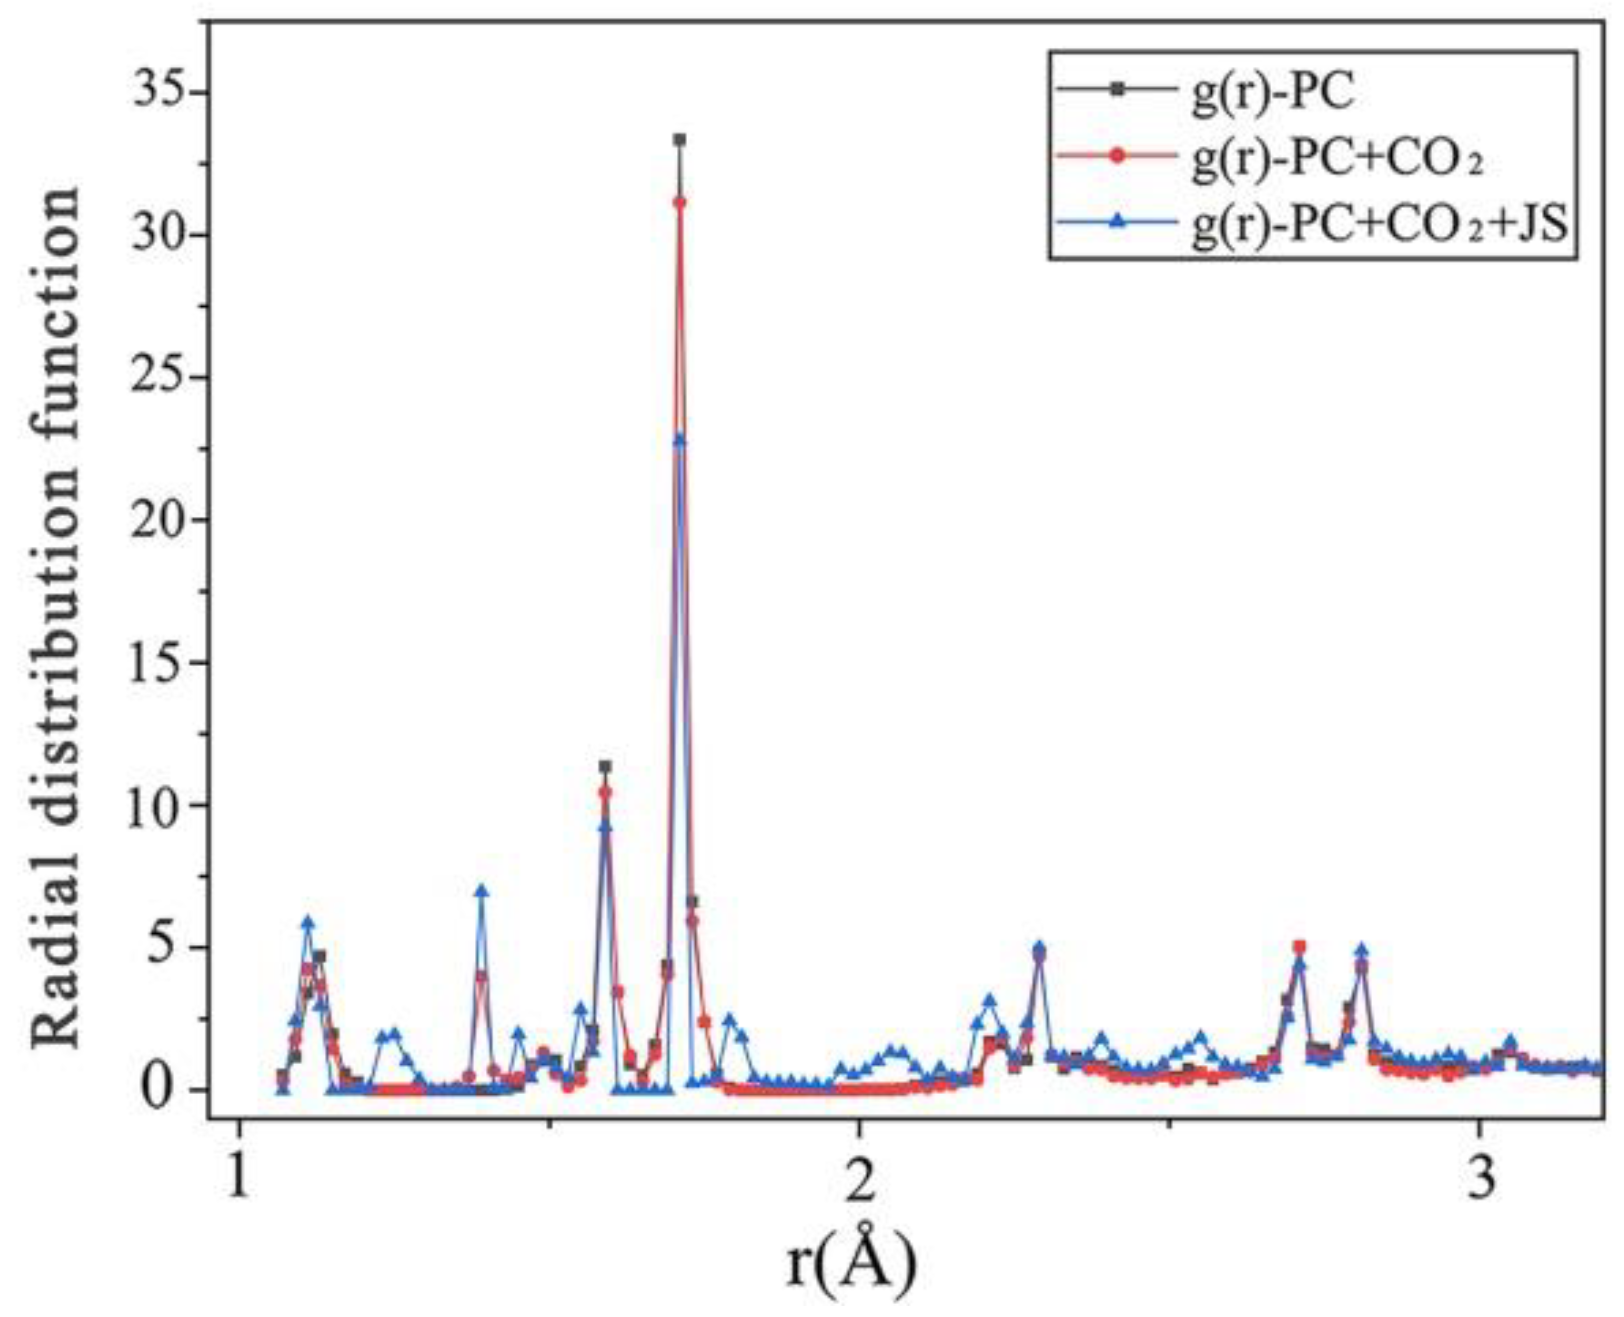
The radial distribution functions (RDFs) for PC, PC + CO2 and PC + CO2 + JS are shown in Figure 17. When the relative distance among particles is r > 3.0 Å, the numerical value of RDF approaches 1. When r < 1.07 Å, RDF = 0. This indicates that the nearest distance among the molecules in the calculated NASH system will be at least 1.07 Å, and the longest distance is at least 3.0 Å. The radii (arrived at 1.71 Å) of the maximum peaks in PC, PC + CO2 and PC + CO2 + JS are 33.3512 Å2, 31.1548 Å2 and 22.7978 Å2, respectively.
In the range of RDF peaks, the probability of having other molecules is the highest and the local density is the highest. With increases in regional density, the atomic shells will deform due to the existence of a force field. Once the lattice structure of the new solid phase begins to expand and grow, the additional peak in the RDF will reflect the atomic effect [34]. This proves that the C-S-H gel structure is decomposed into movable nanoclusters to obtain high cohesive energies and maintain structural stability. Once CO2 and water reducer are added, the gel groups cause shifts of the peaks through the dispersion effect.
Results analysis. According to the analysis of the variation in intramolecular pressure, the constraining forces among molecules are decreased by adding water reducer, which increases the movement among molecules. This can further decrease the constraining forces among molecules. The intramolecular repulsion in the C-S-H gel + CO2 is greater than the attractive force. The interaction forces among molecules make negative charges and the molecular potential energy increases. The CO2 and water reducer can increase repulsion among the different particles in the molecular structures. In other words, the CO2 and water reducer can increase the driving forces among the particles in the molecular structures, which can better improve the dispersion effect of the C-S-H gel. Furthermore, it is concluded from the RDF analysis that the C-S-H gel structure is decomposed into movable nanoclusters to obtain high cohesive energy and maintain high structural stability. Once the CO2 and water reducer are added, the gel groups can cause shifts of the peaks due to the dispersion effect. This shows that the gel groups are effectively distributed, thus improving various aspects of the performance of the cement pastes.

8. Conclusions

Our previous research on the CO2 absorption performance of fresh cement slurry demonstrated that ultrasonic vibration could more effectively improve CO2 absorption than mechanical mixing. Moreover, the fluidity of the slurry decreased with the increase in CO2 absorption. In addition, ultrasonic vibration can effectively improve the fluidity of cement slurry followed by CO2 absorption [21]. If a water-reducing agent is added to the slurry, it not only increases its fluidity but also restores the working performance that has lost fluidity [12]. Therefore, this paper focused on the dynamic analysis through the principle of rheology and establishing the molecular model while observing the change in internal microstructure.
Under ultrasonic vibration, the fluidity of fresh paste decreases with the increase in CO2 absorption and with the addition of a superplasticiser, the fluidity of the decreased slurry could be restored, which indicates an unclear principle of change. Therefore, in this paper, the rheological principle was analysed. Moreover, the internal microstructural change was observed, followed by the establishment of the rheological structure model. Through the development of a molecular model and dynamic analysis, the internal workability-change mechanism of fresh slurry along with superplasticiser was intensively explored while subjected to ultrasonic vibration. The results indicated that ultrasonic vibration can increase the shear stress and plastic viscosity of cement paste more effectively than the cement paste subjected to only CO2 absorption via mechanical stirring. In addition, the shear stress and viscosity of cement paste could increase with the increase in CO2 absorption. At the same time, the addition of polycarboxylic-acid superplasticiser to the cement paste along with CO2 absorption can more effectively reduce the shear stress and plastic viscosity of the fresh paste while restoring and improving its fluidity. In addition, the rheological model of cement paste subjected to CO2 absorption by mechanical stirring fitted well with the H-B rheological model, while the rheological model under ultrasonic vibration was within the range of the traditional rheological model. However, it does not completely accord with the actual rheological characteristics. Therefore, an ultrasonic rheological model was proposed for the cement-based materials which could suitably absorb CO2 under ultrasonic vibration. In addition, both CO2 and superplasticiser could reduce the intermolecular binding force and increase the driving force between the intermolecular particles. As a result, the dispersion effect of C-S-H gel could enhance, if the gel groups are effectively distributed. Finally, the rheological properties of the slurry could improve.
Due to the lack of research on the absorption of CO2 by cement slurry and the limitations of experimental equipment, at present, we are only able to report the CO2 absorption improvement process and its impact on fluidity. The next step will be investigating the effect of CO2 absorption on the carbonation resistance of concrete and its corresponding mechanism.

Author Contributions

Study design, Y.J.; conduct of the study, L.L. (Lili Liu); conceptualisation, J.Z.; data collection, L.L. (Longhai Li); methodology, L.L. (Lili Liu); writing—original draft preparation, L.L. (Lili Liu) and Y.J. All authors have read and agreed to the published version of the manuscript.

Funding

This word was funded by the National Natural Science Foundation of China (51972337) and Science and Technology Innovation Project of Xuzhou (Grant No. KC21014).

Institutional Review Board Statement

Not applicable.

Informed Consent Statement

Not applicable.

Data Availability Statement

Not applicable.

Acknowledgments

The authors would like to thank the technical staff of the Jiangsu Key Laboratory Environmental Impact and Structural Safety in Engineering for their technical support.

Conflicts of Interest

The authors declare no conflict of interest.

References

  1. Chandrasekharam, D.; Pathegama, G.R. CO2 emissions from renewables: Solar pv, hydrothermal and EGS sources. Géoméch. Geophys. Geo-Energy Geo-Resour. 2019, 6, 13. [Google Scholar] [CrossRef]
  2. Miller, S.; John, V.M.; Pacca, S.; Horvath, A. Carbon dioxide reduction potential in the global cement industry by 2050. Cem. Concr. Res. 2018, 114, 115–124. [Google Scholar] [CrossRef]
  3. Shi, C.J.; Andrew, R.M. Global CO2 emissions from cement production. Earth Syst. Sci. Data 2018, 10, 1–52. [Google Scholar]
  4. Barcelo, L.; Kline, J.; Walenta, G.; Gartner, E. Cement and carbon emissions. Mater. Struct. 2013, 47, 1055–1065. [Google Scholar] [CrossRef]
  5. Kolster, C.; Masnadi, M.S.; Krevor, S.; Dowell, N.M.; Brandt, A.R. CO2 enhanced oil recovery: A catalyst for gigatonne-scale carbon capture and storage deployment? Energy Environ. Sci. 2017, 10, 2594–2608. [Google Scholar] [CrossRef] [Green Version]
  6. Yang, Y.; Wang, L.M.; Cao, Z.; Mou, C.; Shen, L.; Zhao, J.; Fang, Y. CO2 emissions from cement industry in China: A bottom-up estimation from factory to regional and national levels. J. Geogr. Sci. 2017, 27, 711–730. [Google Scholar] [CrossRef] [Green Version]
  7. Wan, T.; Mu, Z. The use of numerical simulation to investigate the enhanced Eagle Ford shale gas condensate well recovery using cyclic CO2 injection method with nano-pore effect. Fuel 2018, 233, 123–132. [Google Scholar] [CrossRef]
  8. Ampomah, W.; Balch, R.; Grigg, R.B.; Cather, M.; Gragg, E.; Will, R.A.; White, M.; Moodie, N.; Dai, Z. Performance assessment of CO2-enhanced oil recovery and storage in the Morrow reservoir. Géoméch. Geophys. Geo-Energy Geo-Resour. 2017, 3, 245–263. [Google Scholar] [CrossRef]
  9. Yue, L.; Yan, Z.; Christopher, W.K. Recycling drinking water treatment sludge into eco-concrete blocks with CO2 curing: Durability and leachability. Sci. Total Environ. 2020, 746, 141182. [Google Scholar] [CrossRef]
  10. Alireza, R.; Vagelis, G.P.; Hamid, N. Rate of carbonation in cement modified base course material. Constr. Build. Mater. 2017, 150, 646–652. [Google Scholar]
  11. Monkman, S.; MacDonald, M. On carbon dioxide utilization as a means to improve the sustainability of ready-mixed concrete. J. Clean. Prod. 2017, 167, 365–375. [Google Scholar] [CrossRef]
  12. Liu, L.; Ji, Y.; Ma, Z.; Gao, F.; Xu, Z. Study on the Effects of Ultrasonic Agitation on CO2 Adsorption Efficiency Improvement of Cement Paste. Appl. Sci. 2021, 11, 6877. [Google Scholar] [CrossRef]
  13. Chuang, H.-C.; Yang, H.-M.; Wu, G.-L.; Sánchez, J.; Shyu, J.-H. The effects of ultrasonic agitation on supercritical CO2 copper electroplating. Ultrason. Sonochemistry 2018, 40, 147–156. [Google Scholar] [CrossRef] [PubMed]
  14. Izadifar, Z.; Babyn, P.; Chapman, D. Mechanical and Biological Effects of Ultrasound: A Review of Present Knowledge. Ultrasound Med. Biol. 2017, 43, 1085–1104. [Google Scholar] [CrossRef] [Green Version]
  15. Vaitkevičius, V.; Šerelis, E.; Kerševičius, V. Effect of ultra-sonic activation on early hydration process in 3D concrete printing technology. Constr. Build. Mater. 2018, 169, 354–363. [Google Scholar] [CrossRef]
  16. Hemalatha, T.; Ram, S.K.; Ramachandra, M.A. Influence of mixing protocol on fresh andhardened properties of self-compacting concrete. Constr. Build. Mater. 2015, 98, 119–127. [Google Scholar] [CrossRef]
  17. Ye, Y.; Yue, S.P.; Power, L. Ultrasound and Its Applications: A State-of-the-art Review. Ultrason. Sonochemistry 2020, 62, 104722. [Google Scholar] [CrossRef]
  18. Yang, Y.; Feng, Y.; Li, K.; Ajmal, S.; Cheng, H.; Gong, K.; Zhang, L. Ultrasound-boosted selectivity of CO in CO2 electrochemical reduction. Ultrason. Sonochemistry 2021, 76, 105623. [Google Scholar] [CrossRef]
  19. Vaitkevicius, V.; Serelis, E.; KerSevicius, V. Effect of ultra-sonic activation on early hydration process in 3Dconcrete printing technology. Constr. Build. Mater. 2014, 66, 422–428. [Google Scholar]
  20. Kong, X.M.; Lu, Z.C.; Zhang, C.Y. Recent Development on Understanding Cement Hydration Mechanism and Effects of Chemical Admixtures on Cement Hydration. J. Chin. Ceram. Soc. 2017, 45, 275–281. [Google Scholar]
  21. Liu, L.; Ji, Y.; Gao, F.; Zhang, L.; Zhang, Z.; Liu, X. Study on high-efficiency CO2 absorption by fresh cement paste. Constr. Build. Mater. 2021, 270, 121364. [Google Scholar] [CrossRef]
  22. Nazário, S.F.; Raquel, G.; Bombard, A. Rheological study of cement paste with metakaolin and/or limestone filler using mixture design of experiments. Constr. Build. Mater. 2017, 143, 92–103. [Google Scholar] [CrossRef]
  23. Kim, B.-G.; Jiang, S.; Jolicoeur, C.; Aïtcin, P.-C. The adsorption behavior of PNS superplasticizer and its relation to fluidity of cement paste. Cem. Concr. Res. 2000, 30, 887–893. [Google Scholar] [CrossRef]
  24. Jiao, D.; Shi, C.; Yuan, Q. Time-dependent rheological behavior of cementitious paste under continuous shear mixing. Constr. Build. Mater. 2019, 226, 591–600. [Google Scholar] [CrossRef]
  25. Xiao, J.; Wang, D.F.; He, Y.Q.; Guo, M.L. Effects of Ground Limestone Fineness on the Rheological Property of Cement Pastes. J. build. Mater. 2017, 4, 501–505. [Google Scholar]
  26. Zhang, D.K. Correlativity test of cement paste fluidity and concrete rheologic. Cement 2006, 1, 12–15. [Google Scholar]
  27. Xie, Y.J.; Chen, X.B.; Ma, K.L.; Feng, J.; Long, G.C. Rheological characteristic and its mechanism of cement-fly ash paste. Acta Silic. Sin. 2017, 3, 465–472. [Google Scholar]
  28. Kuznetsova, Y.L.; Skul’Skiy, O.I. Influence of shear banding of polymeric fluids on the shape of rheological curves. Comput. Contin. Mech. 2018, 11, 429–437. [Google Scholar] [CrossRef]
  29. Wu, C.-D.; Shao, Y.-Z.; Li, G.-L.; Fang, Y.-H. Study on the Determination Method of the Adsorption of Water Reducer on Cement Surface Based on Total Organic Carbon Analyzer. J. Phys. Conf. Ser. 2020, 1635, 012026. [Google Scholar] [CrossRef]
  30. Cao, M.L.; Xu, L.; Zhang, C. Influence of Calcium Carbonate Whisker on Rheology of Cement Mortar with Different Water-Cement Ratios and Sand-Cement Ratios. J. Chin. Ceram. Soc. 2016, 44, 246–252. [Google Scholar]
  31. Souto-Martinez, A.; Delesky, E.A.; Foster, K.E.; Srubar, W.V. A mathematical model for predicting the carbon sequestration potential of ordinary portland cement (OPC) concrete. Constr. Build. Mater. 2017, 147, 417–427. [Google Scholar] [CrossRef]
  32. Peng, Y.; Ma, K.; Long, G.; Xie, Y. Influence of Nano-SiO2, Nano-CaCO3 and Nano-Al2O3 on Rheological Properties of Cement–Fly Ash Paste. Materials 2019, 12, 2598. [Google Scholar] [CrossRef] [PubMed] [Green Version]
  33. Yang, L.L.; Chen, Y.P.; Zhang, C.B. Molecular dynamics simulation of self-diffusion coefficient of confined Lennard-Jones fluid. J. Southeast Univ. 2011, 41, 317–320. [Google Scholar]
  34. Carchini, G.; Marri, M.A.; Hussein, I.A.; Aparicio, S. Ab Initio Molecular Dynamics Investigation of CH4/CO2 Adsorption on Calcite: Improving the Enhanced Gas Recovery Process. ACS Omega 2020, 5, 30226–30236. [Google Scholar] [CrossRef]
Figure 1. Existing rheological models of fluids. Three H-B models are shown with different values of n.
Applsci 12 03739 g001
Figure 2. Schematic diagrams of agitation devices (Reprinted with permission from Ref. [21]. 2021, Constr. Build. Mater, Elsevier.): (a) Mechanical agitation device; (b) ultrasonic agitation devices.
Applsci 12 03739 g002
Figure 3. Rheological test data.
Applsci 12 03739 g003
Figure 4. Rheological curves of cement pastes after CO2 absorption under (a) mechanical and (b) ultrasonic agitation.
Applsci 12 03739 g004
Figure 5. Rheological models of cement slurry carbonated under mechanical agitation. Note: A1–A6 represent the models at CO2 AA = 0%, 0.44%, 0.88%, 1.32%, 1.76% and 2.20%, respectively.
Applsci 12 03739 g005
Figure 6. Rheological models of cement slurry carbonated by ultrasonic vibration. Note: B1–B6 represents rheology at CO2 AA = 0%, 0.44%, 0.88%, 1.32%, 1.76% and 2.20%, respectively.
Applsci 12 03739 g006
Figure 7. New rheological curve-fitting parameters of cement slurry carbonated under ultrasonic agitation.
Applsci 12 03739 g007
Figure 8. Viscosity curves of cement paste carbonated by (a) mechanical and (b) ultrasonic vibration.
Applsci 12 03739 g008
Figure 9. Yield stress of cement paste carbonated under ultrasonic vibration.
Applsci 12 03739 g009
Figure 10. Rheological curves of carbonated fresh cement paste (a) before and (b) after adding water reducer.
Applsci 12 03739 g010
Figure 11. Viscosity curves of fresh carbonated cement pastes (a) before and (b) after adding water reducer.
Applsci 12 03739 g011
Figure 12. SEM images of cement pastes before and after adding water reducer: (a) before (500×); (b) after (500×) (c) before (5000×); (d) after (5000×).
Applsci 12 03739 g012
Figure 13. Rheological model of cement pastes with water reducer at (a) 0% CO2; (b) 0.44% CO2; (c) 0.88% CO2; (d) 1.32% CO2; (e) 1.76% CO2; (f) 2.20% CO2.
Applsci 12 03739 g013
Figure 14. Model basic unit and build initial model: (a) Ca; (b) H20; (c) CO2; (d) C-S-H-Q1; (e) C-S-H-Q2; (f) PS; (g) Molecular structure of PC; (h) Molecular structure of PC + CO2; (i) Molecular structure of PC + CO2.
Applsci 12 03739 g014
Figure 15. Changes in molecular kinetic energy and potential energy.
Applsci 12 03739 g015
Figure 16. Variation in intermolecular pressure.
Applsci 12 03739 g016
Figure 17. Radial distribution function.
Applsci 12 03739 g017
Table 1. Chemical composition of the P·O 42.5 cement.
Chemical CompositionSiO2A12O3Fe2O3CaOMgOf-CaOLoss
Content (%)22.15.343.4465.332.110.390.13
Table 2. Mineral composition of the P·O 42.5 cement.
CompositionC3SC2SC3AC4AF
Content (%)54.0422.848.3910.42
Table 3. Properties of PS.
AppearanceSolid Content (%)Density (g/mL)pHChloride Ion Content (%)Alkali Content (%)Water Reduction Rate (%)
Light brown liquid25 ± 21.07 ± 0.026~88.39 ≤ 0.02≤0.225~45
Table 4. Shear stresses of cement paste after CO2 absorption under mechanical agitation (Pa).
CO2 AA/%30 L/s60 L/s90 L/s120 L/s150 L/s
07.56 ± 1.3512.3 ± 3.4520.1 ± 5.9634.5 ± 4.5360.1 ± 6.75
0.4417.5 ± 3.5422.5 ± 4.8932.5 ± 7.3248.5 ± 4.1474 ± 7.03
0.8825 ± 4.7930 ± 6.2438 ± 6.4655 ± 6.2977.5 ± 8.21
1.3229.6 ± 5.2135 ± 6.3545 ± 8.2357 ± 6.3174.2 ± 8.13
1.7646.5 ± 8.1853.6 ± 8.260 ± 8.8668.2 ± 8.9280 ± 8.88
2.2077.6 ± 8.0694.1 ± 8.12107.5 ± 10.11117.5 ± 10.36112.3 ± 10.23
Table 5. Shear stresses of cement pastes after CO2 absorption under ultrasonic agitation (Pa).
CO2 AA/%30 L/s60 L/s90 L/s120 L/s150 L/s
012.8 ± 3.422.5 ± 3.137.5 ± 6.457.2 ± 6.891.8 ± 7.2
0.4440 ± 5.746.2 ± 4.055 ± 7.277.2 ± 7.2103.2 ± 8.2
0.8855 ± 5.262.5 ± 7.674 ± 8.292.5 ± 8.1124.5 ± 8.1
1.3269.1 ± 6.077.2 ± 8.385 ± 8.197.4 ± 8.3119.6 ± 9.2
1.76105 ± 9.8111.5 ± 9.2122.1 ± 9.1135.2 ± 10.1150. ± 10.2
2.20140.4 ± 12.6154.5 ± 11.4167.5 ± 12.9177.5 ± 12.1187.4 ± 13.8
Table 6. Rheological curve-fitting parameters of cement slurry carbonated under mechanical vibration.
No.CO2 AAτ0 (Pa)KnR2
A10%7.210.00322.0639 (n > 1)0.997
A20.44%21.130.00432.1563 (n > 1)0.994
A30.88%26.030.000222.631 (n > 1)0.995
A41.32%30.410.003071.438 (n ≈ 1)0.981
A51.76%44.450.1821.272 (n ≈ 1)0.992
A62.20%49.383.9410.794 (n < 1)0.997
Table 7. Rheological-model parameters of cement slurry carbonated under ultrasonic vibration.
SampleBingham ModelR2MB ModelR2H-B ModelR2
B1 τ B 1 = 3.6 + 0.35 γ 0.883 τ B 1 = 18.75 0.323 γ + 0 . 0035 γ 2 0.926 τ B 1 = 8.78 + 0 . 0042 γ 1.654 0.868
B2 τ B 2 = 3.57 + 1.15 γ 0.761 τ B 2 = 44.07 0.06 γ + 0 . 0064 γ 2 0.785 τ B 2 = 28.30 + 0 . 0051 γ 2.1563 0.796
B3 τ B 3 = 7.12 + 1.15 γ 0.783 τ B 3 = 55.08 0.716 γ + 0 . 0098 γ 2 0.736 τ B 3 = 35.24 + 0 . 0012 γ 2.17 0.838
B4 τ B 4 = 6.21 + 1.59 γ 0.812 τ B 4 = 73.03 0.79 γ + 0 . 0125 γ 2 0.801 τ B 4 = 43.62 + 0 . 00302 γ 1.304 0.777
B5 τ B 5 = 18.7 + 1.36 γ 0.768 τ B 5 = 92.69 1.985 γ + 0 . 0176 γ 2 0.752 τ B 5 = 53.74 + 2 . 149 γ 1.02 0.788
B6 τ B 6 = 12.22 + 1.38 γ 0.741 τ B 6 = 98.46 1.94 γ + 0 . 0175 γ 2 0.749 τ B 6 = 62.89 + 2 . 334 γ 0.959 0.767
Table 8. Rheological-model parameters of cement slurry carbonated under ultrasonic vibration.
No.CO2 AAτ0 (Pa)εηξR2
B10%8.080.24−0.00271.17 × 10−54.74 × 10−80.967
B20.44%28.050.08−0.0025−2.87 × 10−41.32 × 10−60.981
B30.88%37.98−1.22−0.0560−5.9 × 10−41.99 × 10−60.981
B41.32%44.48−0.76−0.0550−6.09 × 10−42.15 × 10−60.971
B51.76%56.23−2.330.087−9.43 × 10−43.26 × 10−60.936
B62.20%64.69−3.130.117−1.25 × 10−34.21 × 10−60.936
Table 9. Viscosity values of net cement pastes carbonated under mechanical vibration (Pa·s).
CO2 AA/%30 L/s60 L/s90 L/s120 L/s150 L/s
00.3 ± 0.110.2 ± 0.080.32 ± 0.130.36 ± 0.050.41 ± 0.06
0.440.51 ± 0.120.38 ± 0.110.42 ± 0.080.43 ± 0.060.55 ± 0.08
0.880.8 ± 0.130.52 ± 0.120.51 ± 0.070.52 ± 0.120.52 ± 0.09
1.321.2 ± 0.350.72 ± 0.230.64 ± 0.130.62 ± 0.130.62 ± 0.13
1.761.5 ± 0.450.95 ± 0.340.71 ± 0.070.65 ± 0.150.63 ± 0.15
2.202.72 ± 0.581.51 ± 0.561.15 ± 0.350.95 ± 0.340.83 ± 0.16
Table 10. Viscosity values of net cement pastes carbonated under ultrasonic vibration (Pa·s).
CO2 AA/%30 L/s60 L/s90 L/s120 L/s150 L/s
00.59 ± 0.150.36 ± 0.110.41 ± 0.150.42 ± 0.180.58 ± 0.12
0.440.61 ± 0.160.58 ± 0.120.54 ± 0.120.57 ± 0.120.92 ± 0.34
0.881.63 ± 0.471.02 ± 0.350.81 ± 0.230.62 ± 0.120.6 ± 0.22
1.322.2 ± 0.511.32 ± 0.350.93 ± 0.340.74 ± 0.230.62 ± 0.22
1.762.22 ± 0.521.2 ± 0.550.83 ± 0.331.57 ± 0.661.49 ± 0.66
2.204.71 ± 0.822.62 ± 0.822.15 ± 0.811.55 ± 0.561.38 ± 0.56
Table 11. Shear stress of fresh carbonated cement paste after adding PS (Pa).
CO2 AA%30 L/s60 L/s90 L/s120 L/s150 L/s
01 ± 0.0453.1 ± 0.146.8 ± 0.3113.5 ± 0.5926.2 ± 1.15
0.448.1 ± 0.4512.2 ± 0.5824.4 ± 1.1938.1 ± 1.7456.3 ± 2.26
0.8816.2 ± 0.8120.5 ± 0.9534.3 ± 1.6351.4 ± 2.3383.9 ± 4.02
1.3227.2 ± 1.2435.5 ± 1.6644.3 ± 2.1859.3 ± 2.4675.5 ± 3.49
1.7649.9 ± 2.0958.1 ± 2.7265.2 ± 3.1575.2 ± 3.1586.4 ± 4.18
2.2072.2 ± 3.1584.1 ± 4.07100 ± 4.45110.8 ± 5.01118.1 ± 5.11
Table 12. Viscosity values of fresh carbonated cement pastes before and after PS addition (Pa·s).
CO2 AA/%30 L/s60 L/s90 L/s120 L/s150 L/s
00.15 ± 0.050.16 ± 0.040.17 ± 0.060.16 ± 0.080.19 ± 0.08
0.440.19 ± 0.070.12 ± 0.050.13 ± 0.050.14 ± 0.060.2 ± 0.09
0.880.36 ± 0.160.2 ± 0.090.26 ± 0.060.3 ± 0.170.38 ± 0.11
1.320.85 ± 0.030.47 ± 0.120.44 ± 0.080.49 ± 0.120.55 ± 0.12
1.761.31 ± 0.070.68 ± 0.130.63 ± 0.120.6 ± 0.2290.61 ± 0.13
2.202.11 ± 0.091.12 ± 0.051.06 ± 0.350.88 ± 0.230.90 ± 0.26
Publisher’s Note: MDPI stays neutral with regard to jurisdictional claims in published maps and institutional affiliations.