5.1. Effects of CO2 Absorption on the Rheological Properties of Cement Paste
(1) Rheological curves of cement paste after CO2 absorption
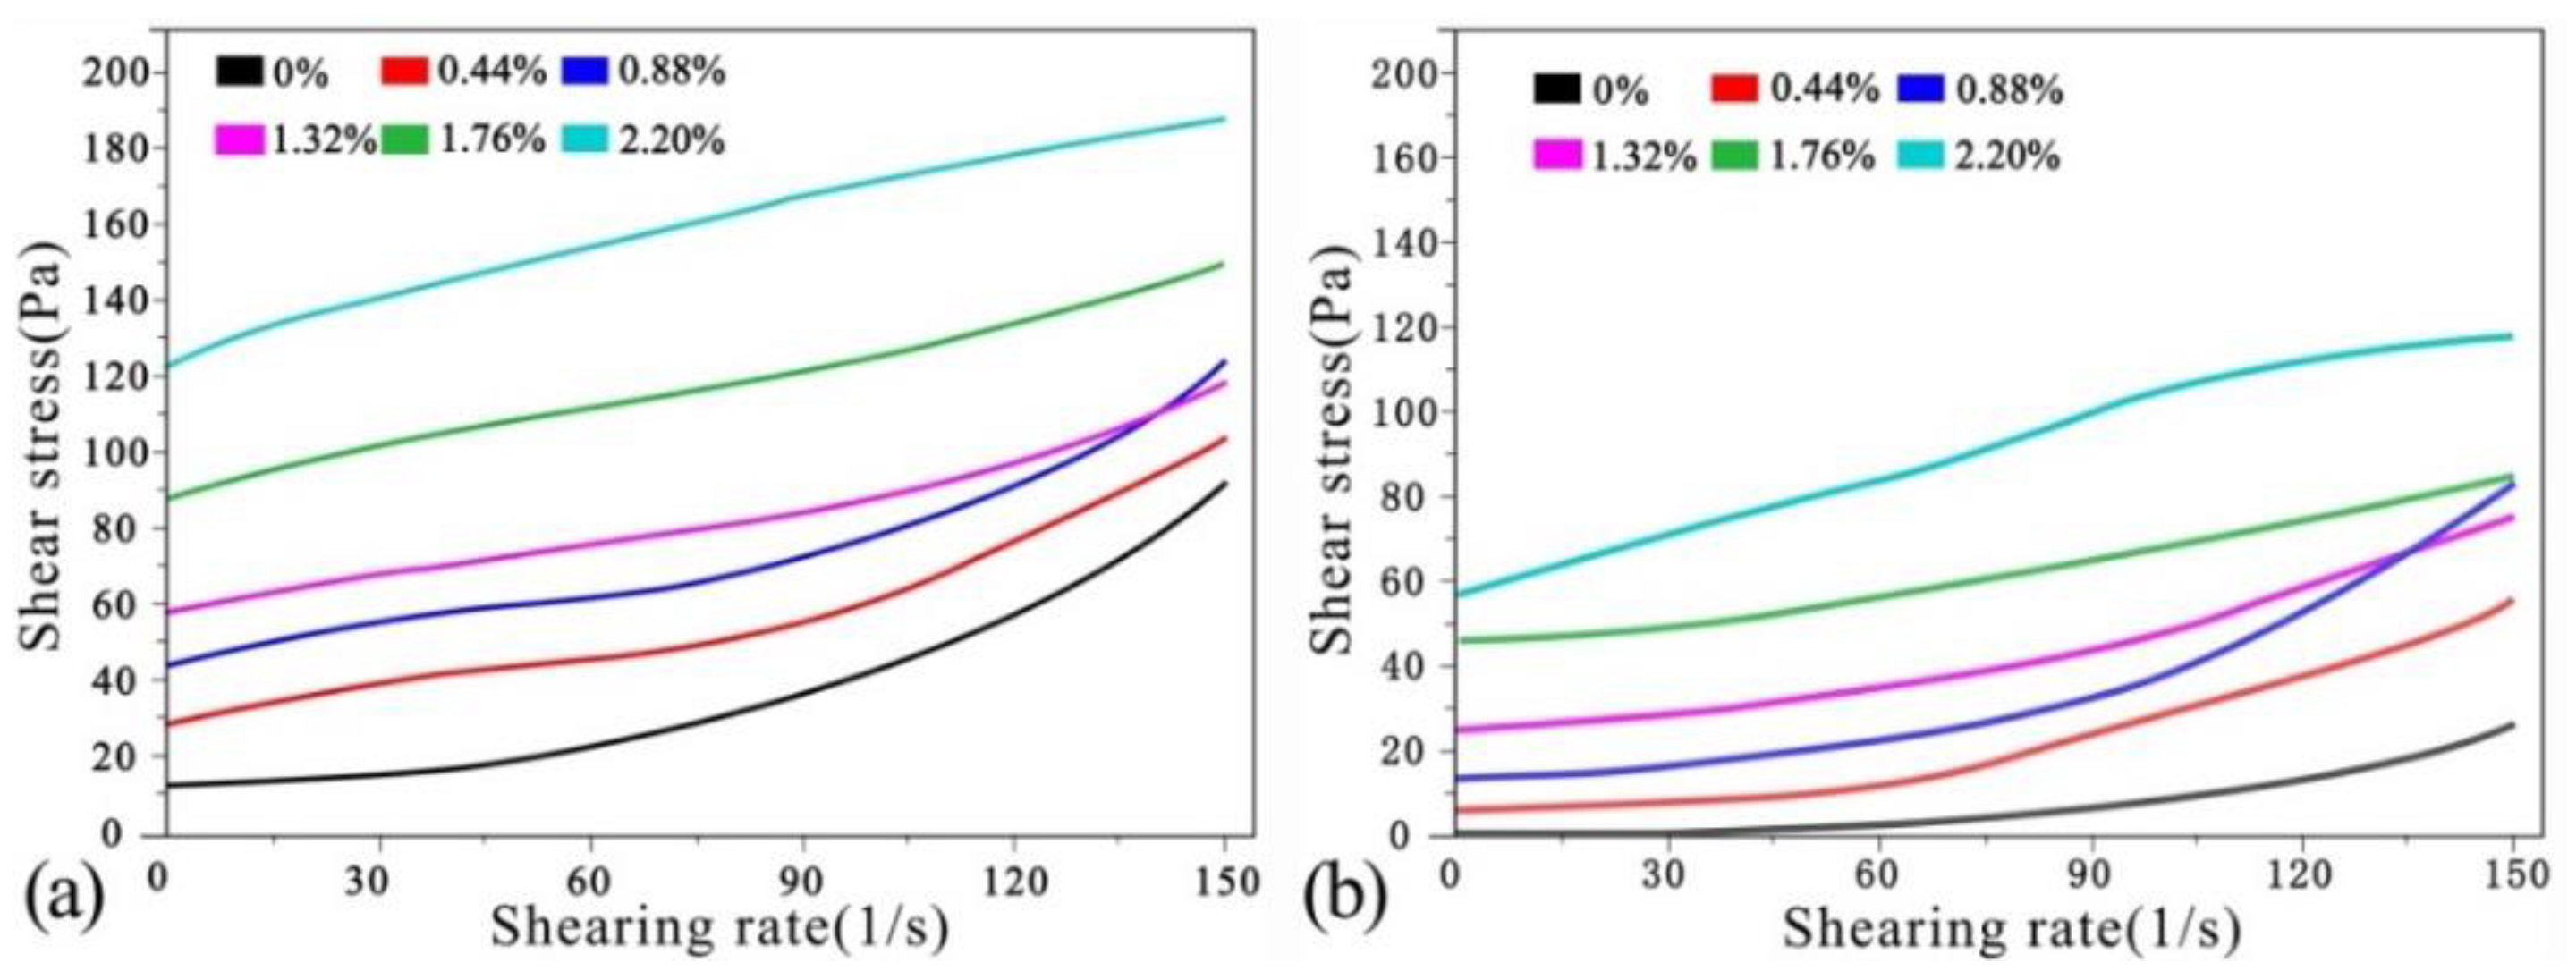
(a) Mechanical vibration
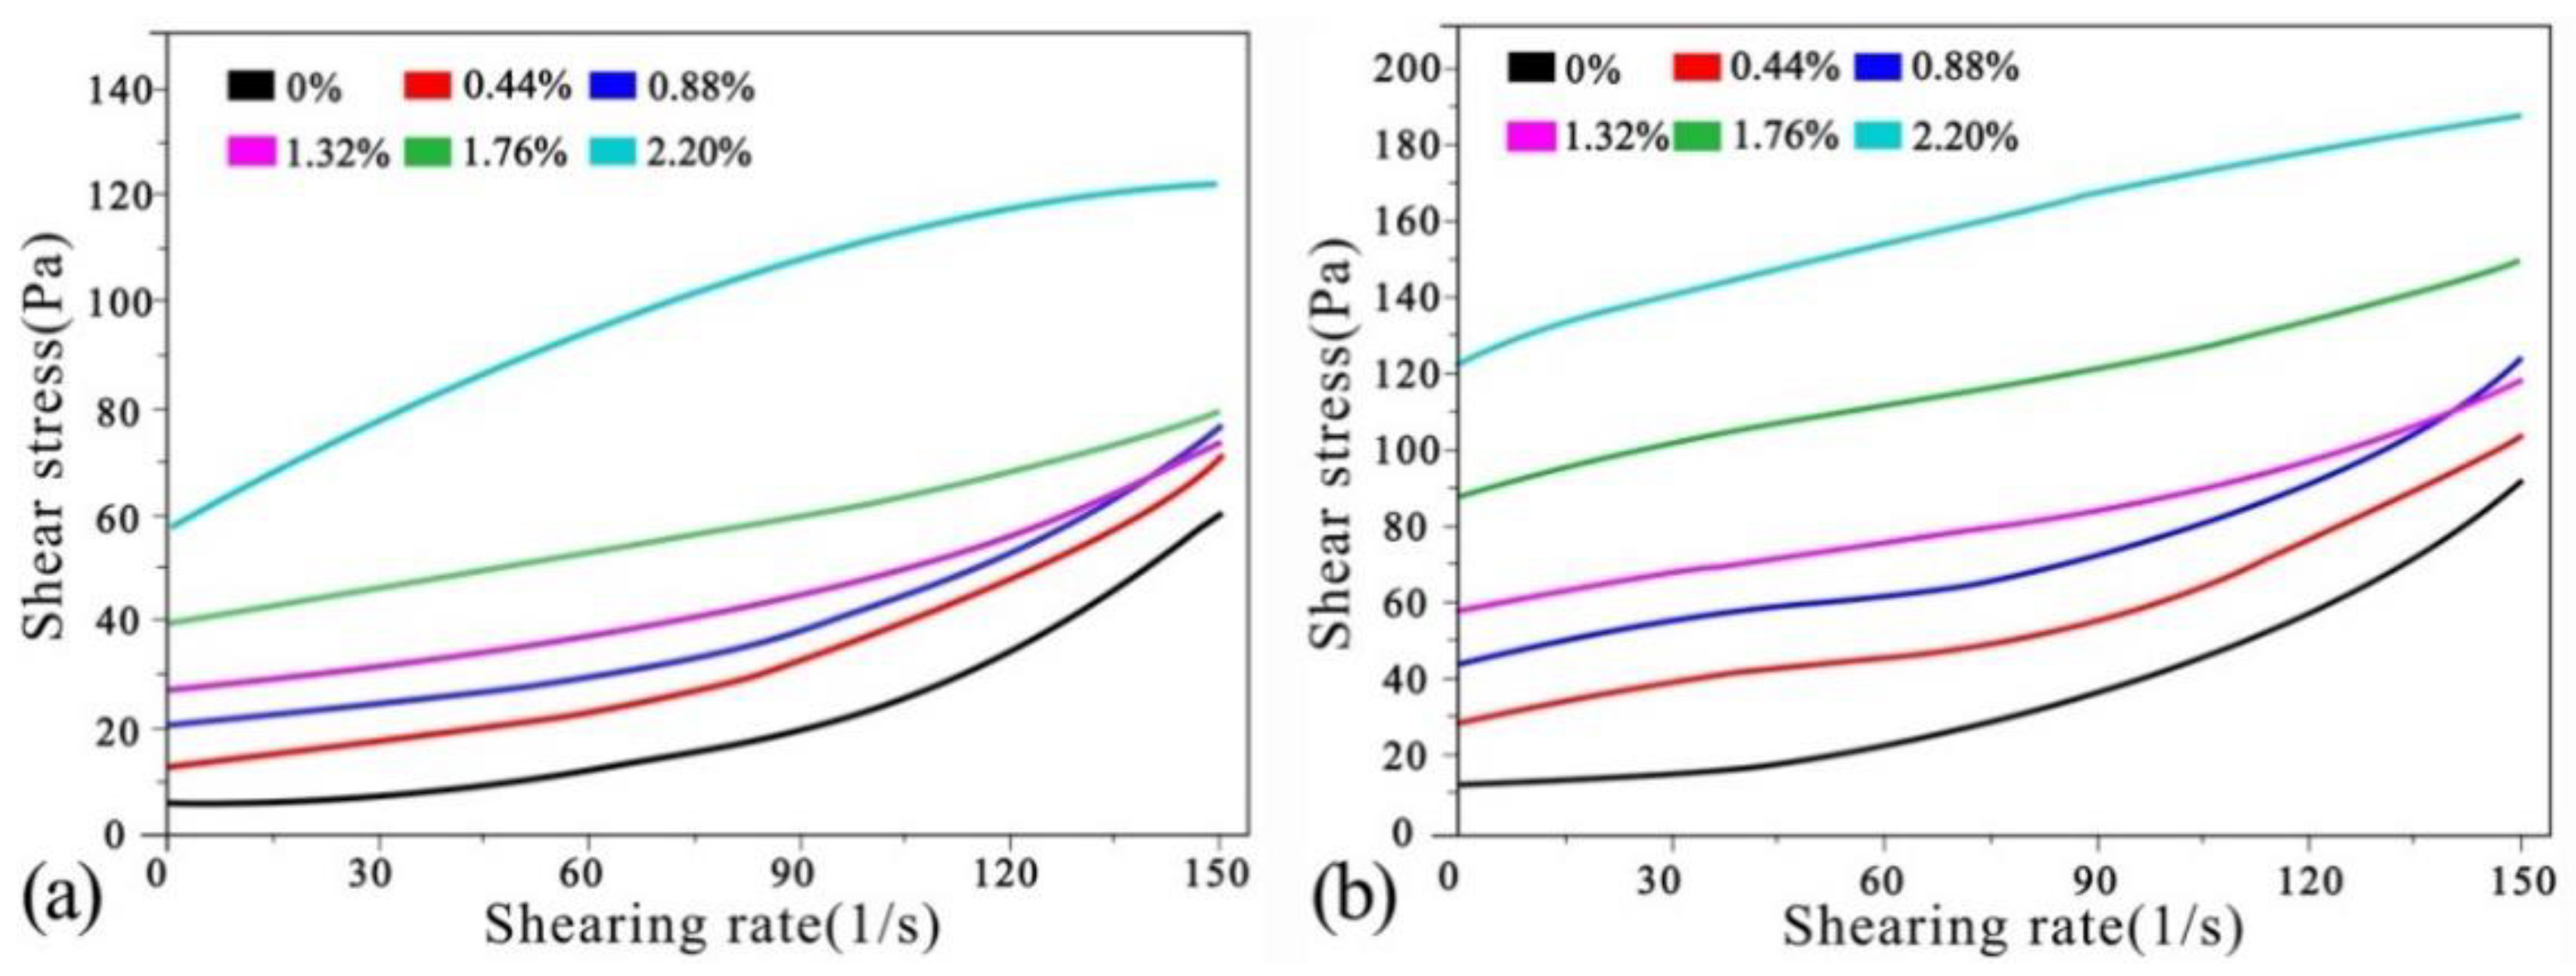
The rheological curves of the cement pastes after absorbing CO
2 under mechanical vibration are shown in
Figure 4a. The shear stresses of the net cement pastes in different groups are summarised in
Table 4. It can be seen from
Figure 4a and
Table 4 that the initial shear stress of the net cement paste under mechanical vibration is 7.56 Pa. At shear rates <120 L/s, the shear stress increases slowly with the shear rate. At shear rates >120 L/s, the shear thickening increases quickly and the shear stress increases in a straight line. At CO
2 AA = 0.44%, the paste-thickening phenomenon occurs and the initial shear stress increases to 17.5 Pa. With increases in shear rate, the shear stress increases slowly and the rate of increase declines to some extent. At CO
2 AA = 0.88%, the initial shear stress increases further to 25.1 Pa and the trend is very similar to that at 0.44%. At CO
2 AA = 1.32%, the shearing resistance continues to increase, while the initial shear stress increases to 29.6 Pa. Under this circumstance, the rheological curve rises at a slow rate. At CO
2 AA = 1.76%, the thickening phenomenon is more obvious. The trend when the initial shear stress is increased to 46.5 Pa is similar to that at 1.32%. Shear thickening becomes more obvious at CO
2 AA = 2.20%. The initial shear stress reaches 77.6 Pa and the rheological curve has a parabolic shape.
(b) Ultrasonic vibration stirring
The rheological curves of cement pastes after CO
2 absorption under ultrasonic vibration are shown in
Figure 4b. The shear stresses of the net cement pastes of all groups are summarised in
Table 5. It can be seen from
Figure 4b and
Table 5 that in the initial stage of the shear rate of net cement pastes under ultrasonic vibration, the shear stress is 12.8 Pa. At shear rates of 0–90 L/s, the shear stress increases slowly. At shear rates >90 L/s, shear thickening increases in a straight manner. At CO
2 AA = 0.44%, the initial shear stress increases to 40.2 Pa and the paste thickening increases obviously. At shear rates of 0–120 L/s, the shear stress increases slowly. The thickening accelerates at shear rates >120 L/s, resulting in a linear increase in shear stress. At CO
2 AA = 0.88%, the initial shear stress increases to 55.1 Pa and the curve is similar to that at 0.44%. When the CO
2 AA is increased to 1.32%, the initial shear stress increases to 69.1 Pa. Under this circumstance, the rheological curves increase at a steady rate without obvious growth. At CO
2 AA = 1.76%, the thickening phenomenon is more significant and the initial shear rate increases to 105 Pa. At CO
2 AA = 2.20%, shear thickening continues to increase and the rheological curves also increase slowly. (Note: N = 10, mean ± S.D. N presents number of samples).
(c) Analysis of shear stress in cement pastes after CO2 absorption
Firstly, the shear stresses of cement pastes before and after CO2 absorption under mechanical vibration were compared. At CO2 AA = 0.44%, shear thickening was obvious at shear rates of 30 L/s, 60 L/s, 90 L/s, 120 L/s and 150 L/s. The shear stresses of cement paste were 131.5%, 82.9%, 61.7%, 40.6% and 23.6% higher before CO2 absorption than afterwards. Moreover, the shear thickening of cement paste became more obvious with increases in CO2 AA and was accompanied by continuous increases in shear stress.
Second, compared with mechanical agitation, the shear stresses of the cement slurries without CO2 input under ultrasonic agitation were 69%, 83%, 87%, 66% and 53% higher at shear rates of 30 L/s, 60 L/s, 90 L/s, 120 L/s and 150 L/s, respectively. At CO2 AA = 0.44%, the shear stresses of the cement slurry were 128.6%, 105.3%, 69%, 59.2% and 39.5% higher, respectively. At CO2 AA = 0.88%, the shear stresses of the cement pastes under ultrasonic agitation were 120%, 108.3%, 94.7%, 68.2% and 60.6% higher compared to those under mechanical agitation. At CO2 AA = 1.32%, the shear stresses of cement pastes under ultrasonic agitation were increased by 133.4%, 120.6%, 88.9%, 70.2% and 61.2%, respectively. At CO2 AA = 1.76%, the shear stresses of cement pastes under ultrasonic agitation were increased by 125.8%, 108%, 103.5%, 98.2% and 87.5%, respectively. At CO2 AA = 2.20%, the shear stresses of cement pastes under ultrasonic agitation were increased by 80.9%, 64.2%, 55.8%, 51.1% and 66.9%, respectively.
Based on the above comparison, the shear stress of cement paste was significantly increased by CO
2 absorption under mechanical stirring. Meanwhile, the shear stress was higher after ultrasonic vibration than mechanical vibration, indicating that ultrasonic vibration can more effectively increase the shear stress of carbonised cement paste. Comparison of the rheological curves in
Figure 4 and
Figure 5 shows that after CO
2 absorption under both types of vibration, the cement pastes generally showed positive relationships of shear stress with CO
2 AA and shear rate. All curves increase at low rates and some present linear trends after reaching a certain shear rate. Although there are similarities between the curves, they change differently.
5.2. Rheological Models of Cement Paste after CO2 Absorption
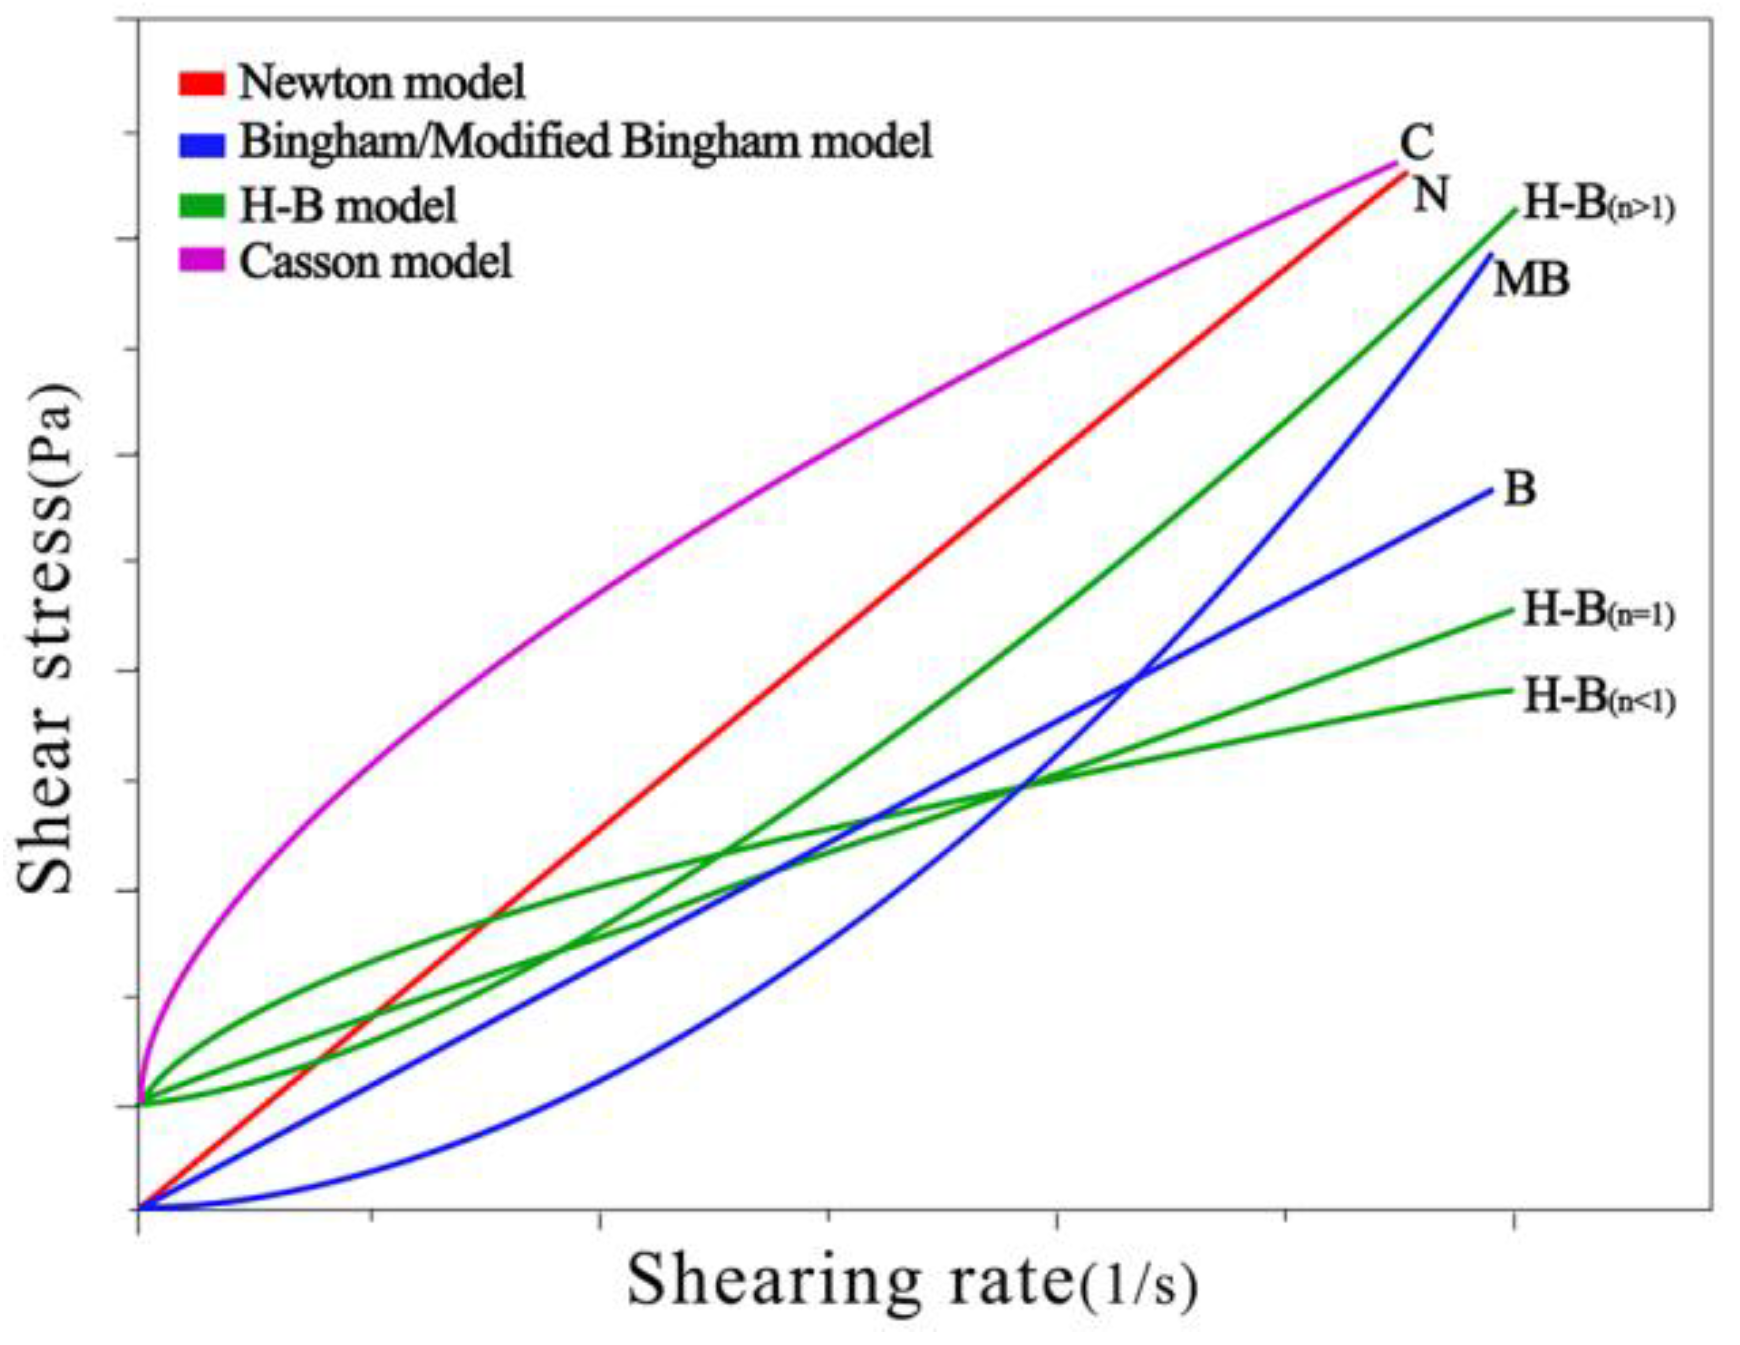
An accurate rheological model is the premise for evaluating the rheological characteristics of cement paste. A rheological model of cement paste after CO
2 absorption was derived from a comparative analysis of the rheological curves (
Figure 4) and the rheological models of several fluids (
Figure 1) [
23,
24,
25].
(1) Rheological models of cement paste under mechanical vibration
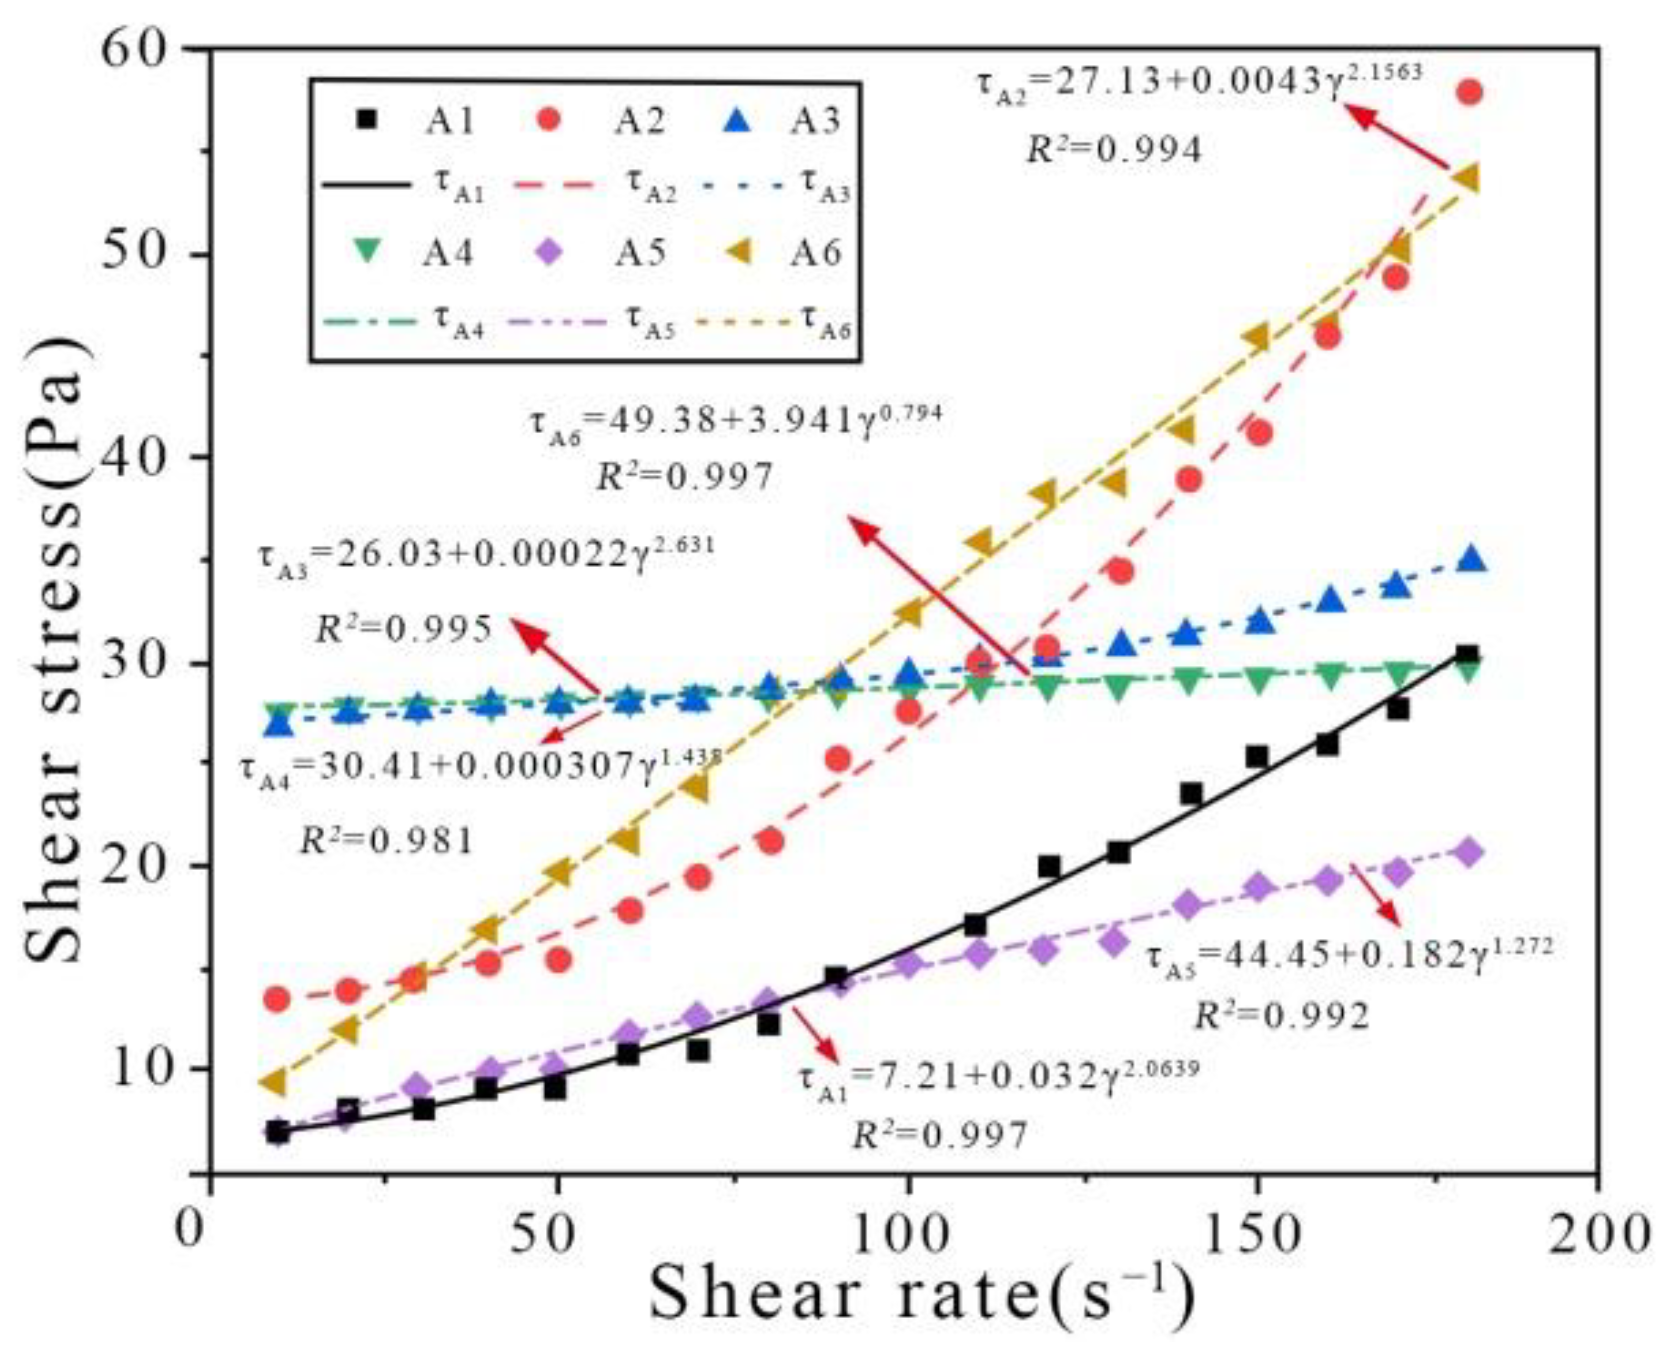
It can be seen from
Figure 4a that under mechanical vibration, shear stress is positively related to shear rate, and the rheological curve shows three stages of increase. The rheological curve of cement paste carbonated under mechanical vibration (
Figure 1) has a similar shape as the H-B model; hence, this model was selected for fitting to the observed data.
The rheological parameters of cement pastes carbonated under mechanical vibration were fitted using the H-B rheological model. The fitted-model parameters of cement pastes carbonated under mechanical vibration are shown in
Figure 5. It can be clearly seen from the fitting data that the power exponent (
n) in the parameters in
Table 6 meets the H-B rheological model,
n ≤ 1 and
n > 1. It approaches to the H-B model (
n > 1) at CO
2 AA = 0.44% and 0.88%. It approaches to the H-B model (
n = 1) at CO
2 AA = 1.32% and 1.76%. However, it conforms to the H-B model (
n < 1) at CO
2 AA = 2.20%. Specifically, the R2 coefficient is close to 1 in all cases, indicating accurate modelling. In short, the rheology of cement pastes carbonated under mechanical vibration conforms to the H-B rheological model.
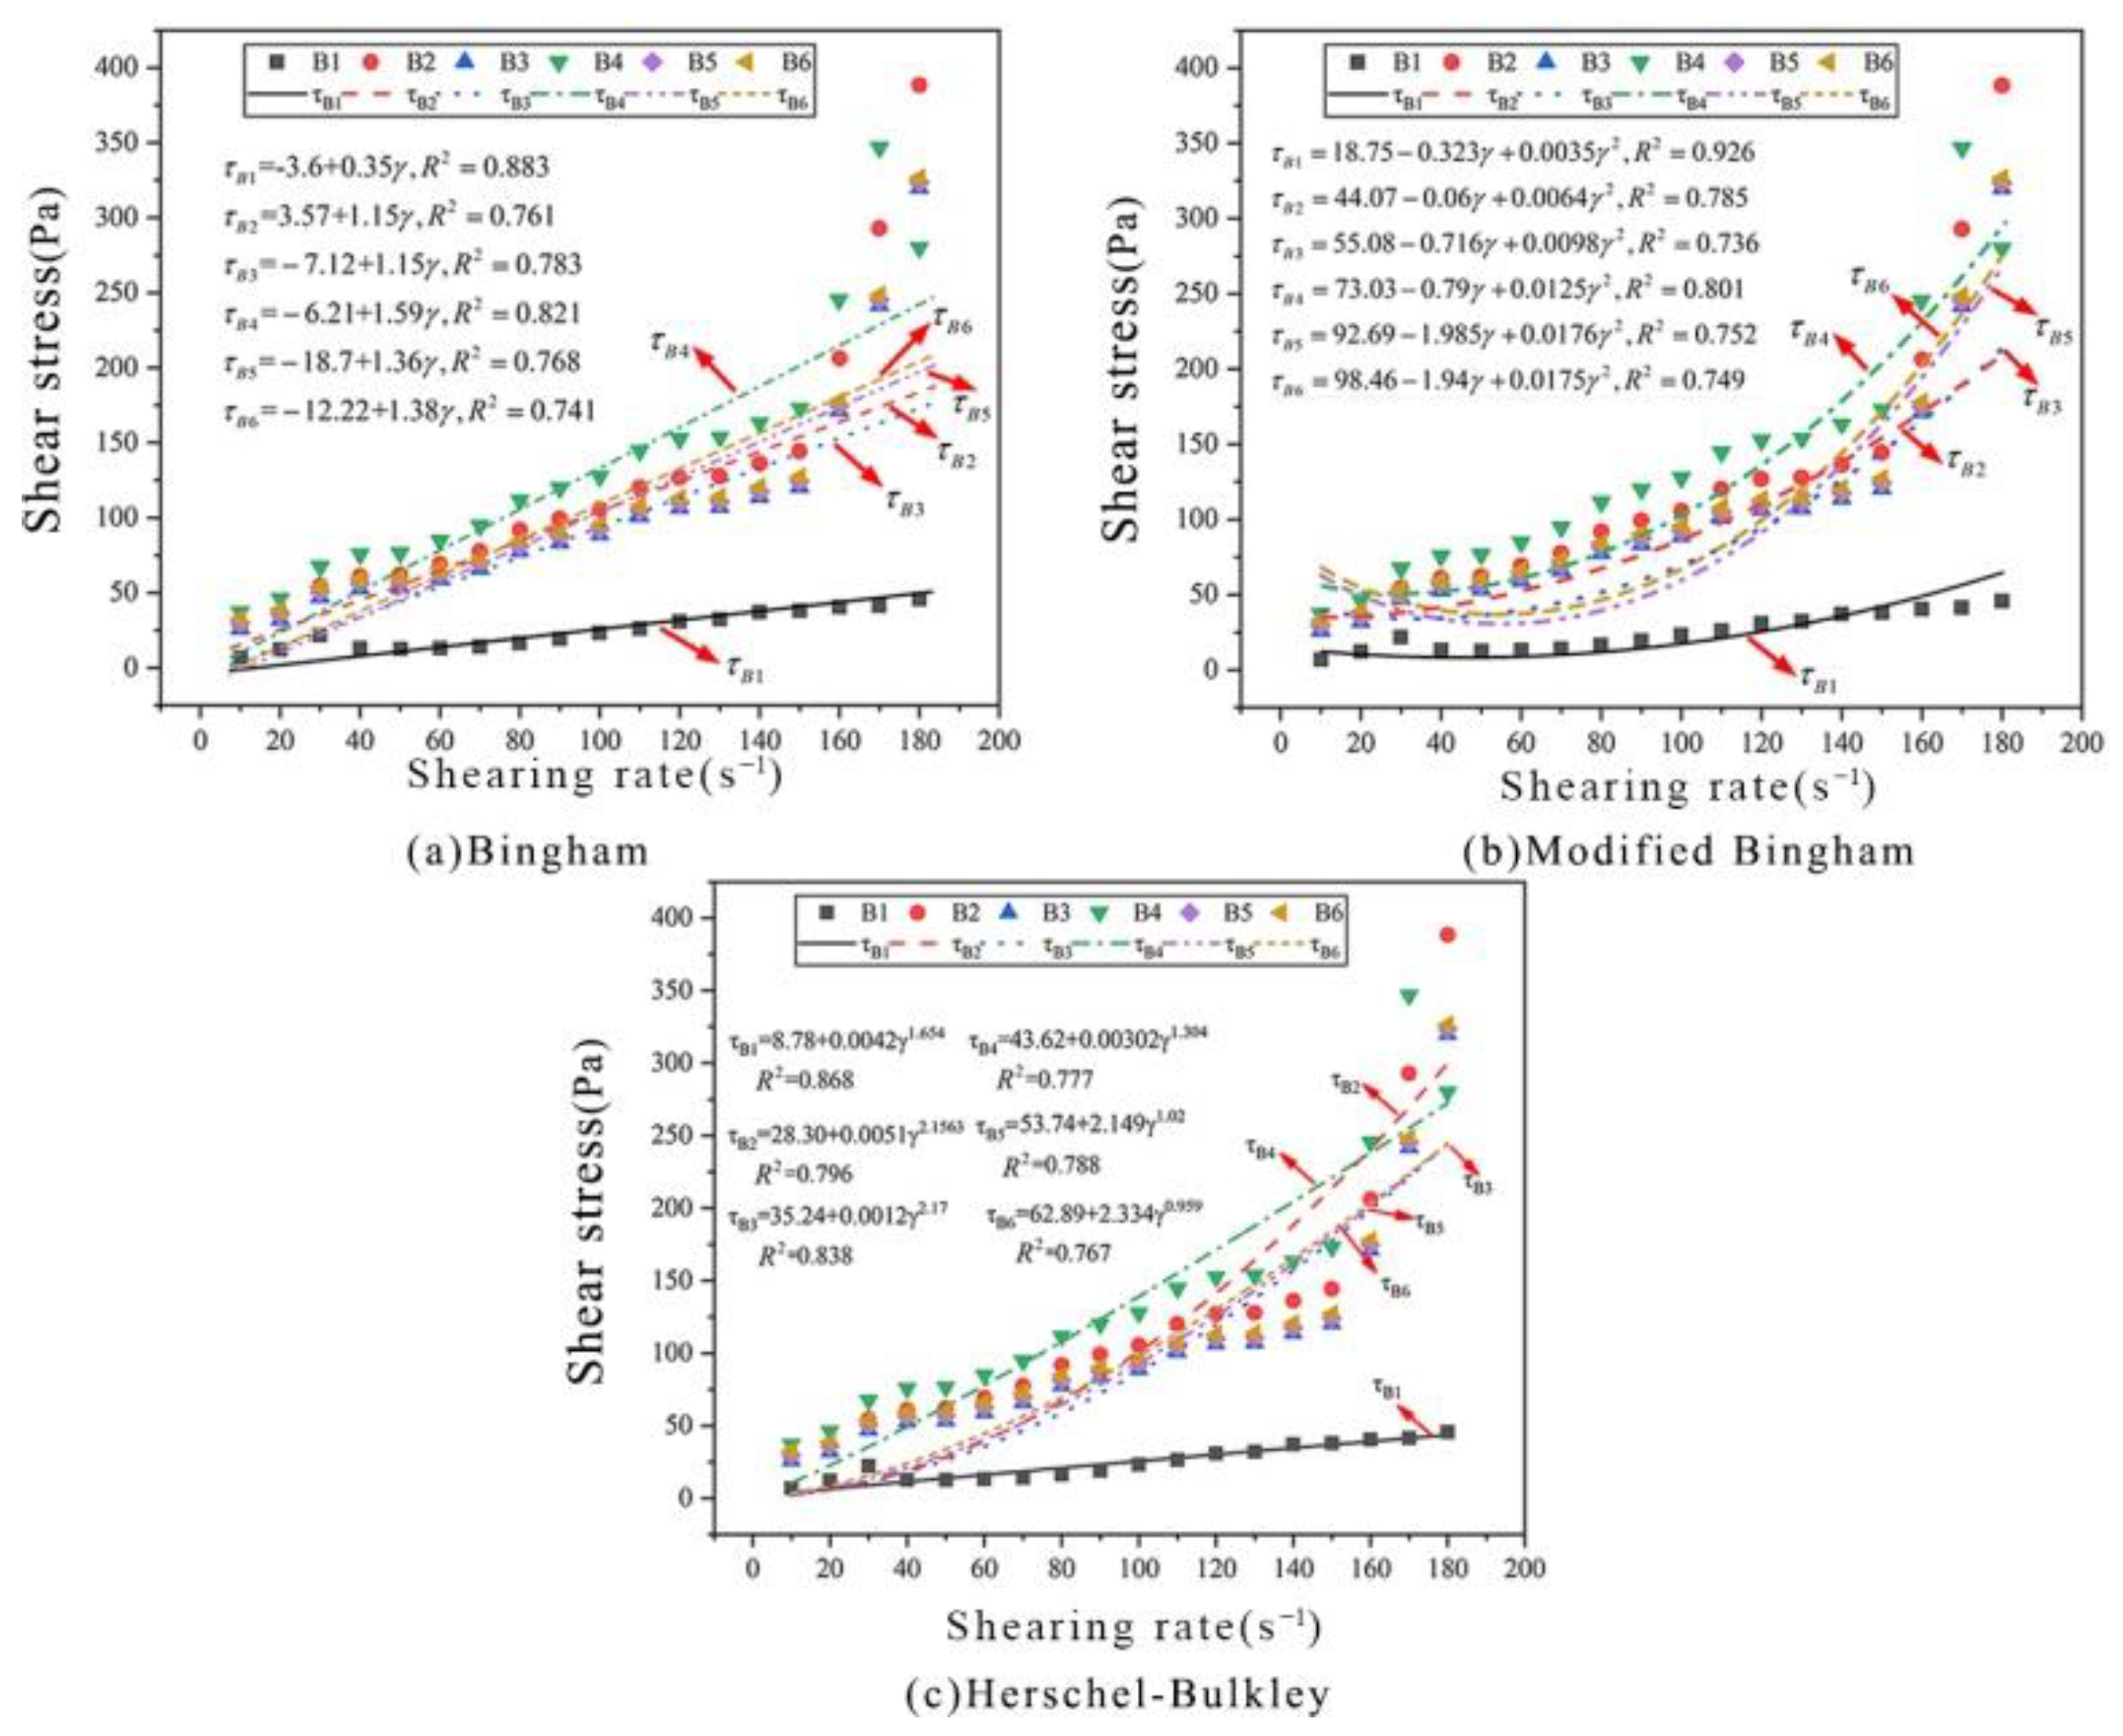
(2) Rheological models of cement paste carbonated under ultrasonic vibration
In this study, the rheological characteristics of cement paste carbonated under ultrasonic vibration were modelled based on the Bingham, M-B and H-B models (
Figure 6). It can be seen from
Figure 6 and
Table 7 that all three models have low accuracy with
R2 coefficients < 0.8. Therefore, none of these three models can accurately characterise the rheological characteristics.
5.3. Construction of Rheological Models of Cement Paste Carbonated under Ultrasonication
(1) Rheological models of cement paste carbonated under ultrasonication
Based on the above analysis, the rheological curves of cement pastes carbonated under ultrasonication do not all conform to the traditional Bingham, M-B and H-B models as well as those carbonated under mechanical vibration. However, it can be concluded from the
R2 values although the fitted curves have low accuracy, they do have some of the characteristics of the rheological models [
26,
27,
28]. This is because the above models are ideal and cannot characterise the actual ultrasonication characteristics. On this basis, a practical rheological model that is applicable to cement-based materials carbonated under ultrasonic vibration is proposed by combining characteristics and advantages of the above three models:
where
is the shear stress;
is the yield stress;
is the shear rate; and
,
,
and
are constants.
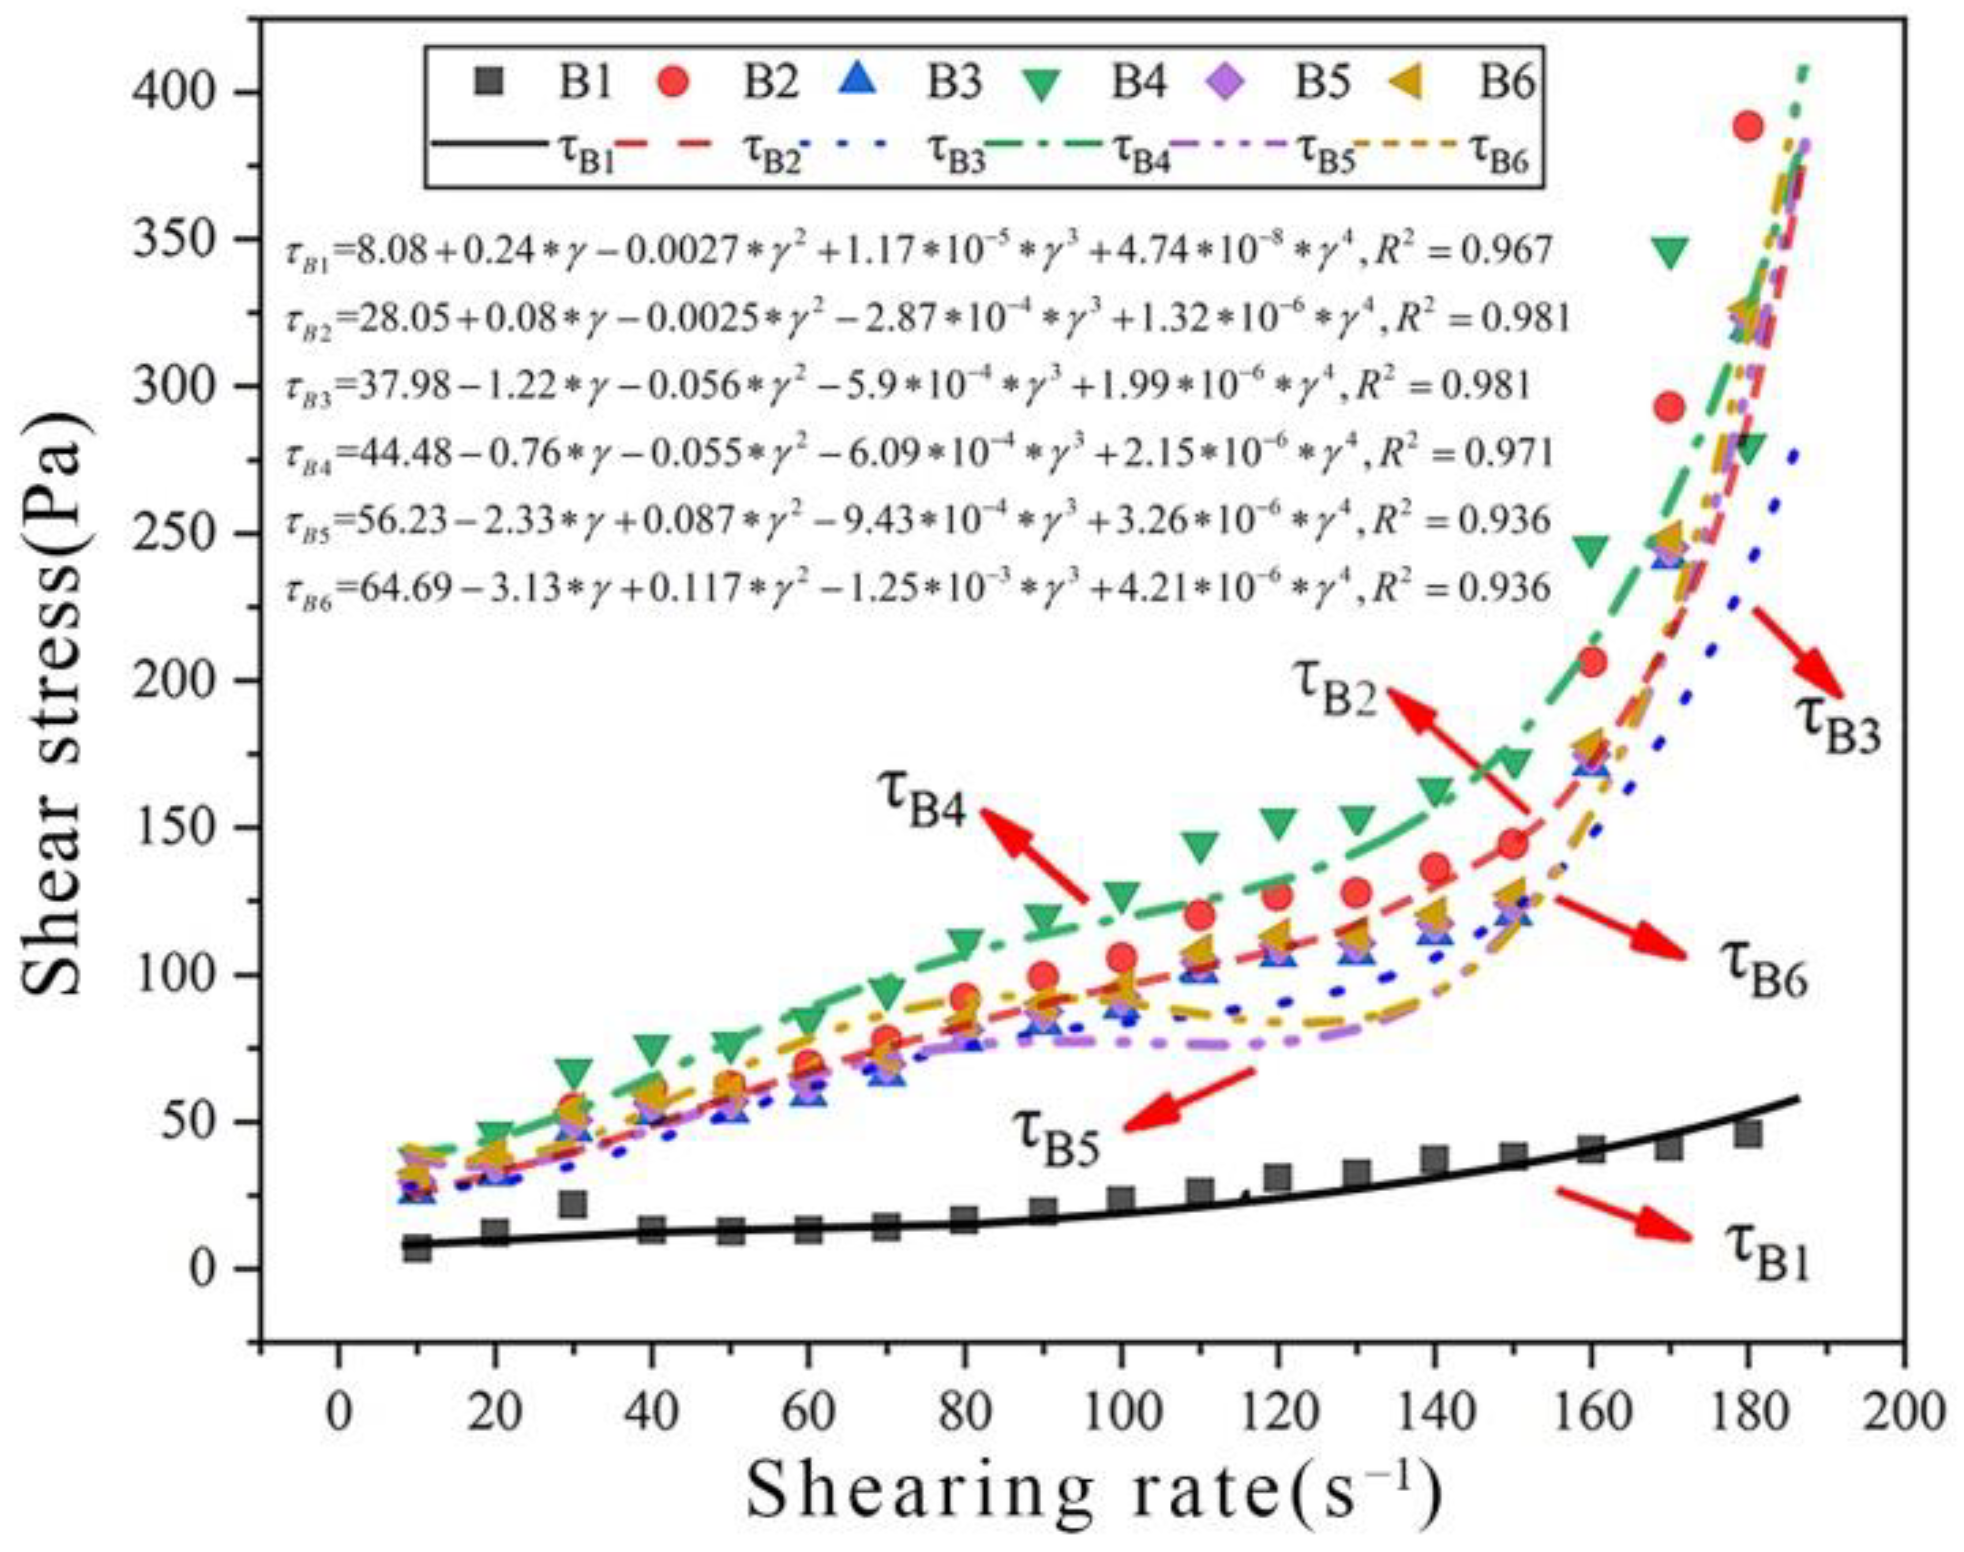
(2) Applications of rheological models of cement paste carbonated by ultrasonication
To judge whether the rheological model of carbonated cement paste is applicable to the actual rheological model of cement-based materials carbonated under ultrasonic vibration, rheological data under different CO
2 AA values were modelled again. The results are shown in
Figure 7 and
Table 8. Clearly, the
R2-values are >0.9 for all rheological curves of cement pastes with different CO
2 AA values, indicating that these curves meet the fitting requirements well. This proves that the rheological model of carbonated cement paste is appropriate for the actual rheological characteristics of cement-based materials carbonated under ultrasonic vibration.
5.4. Comparative Analysis of the Rheological Properties of Carbonated Cement Paste
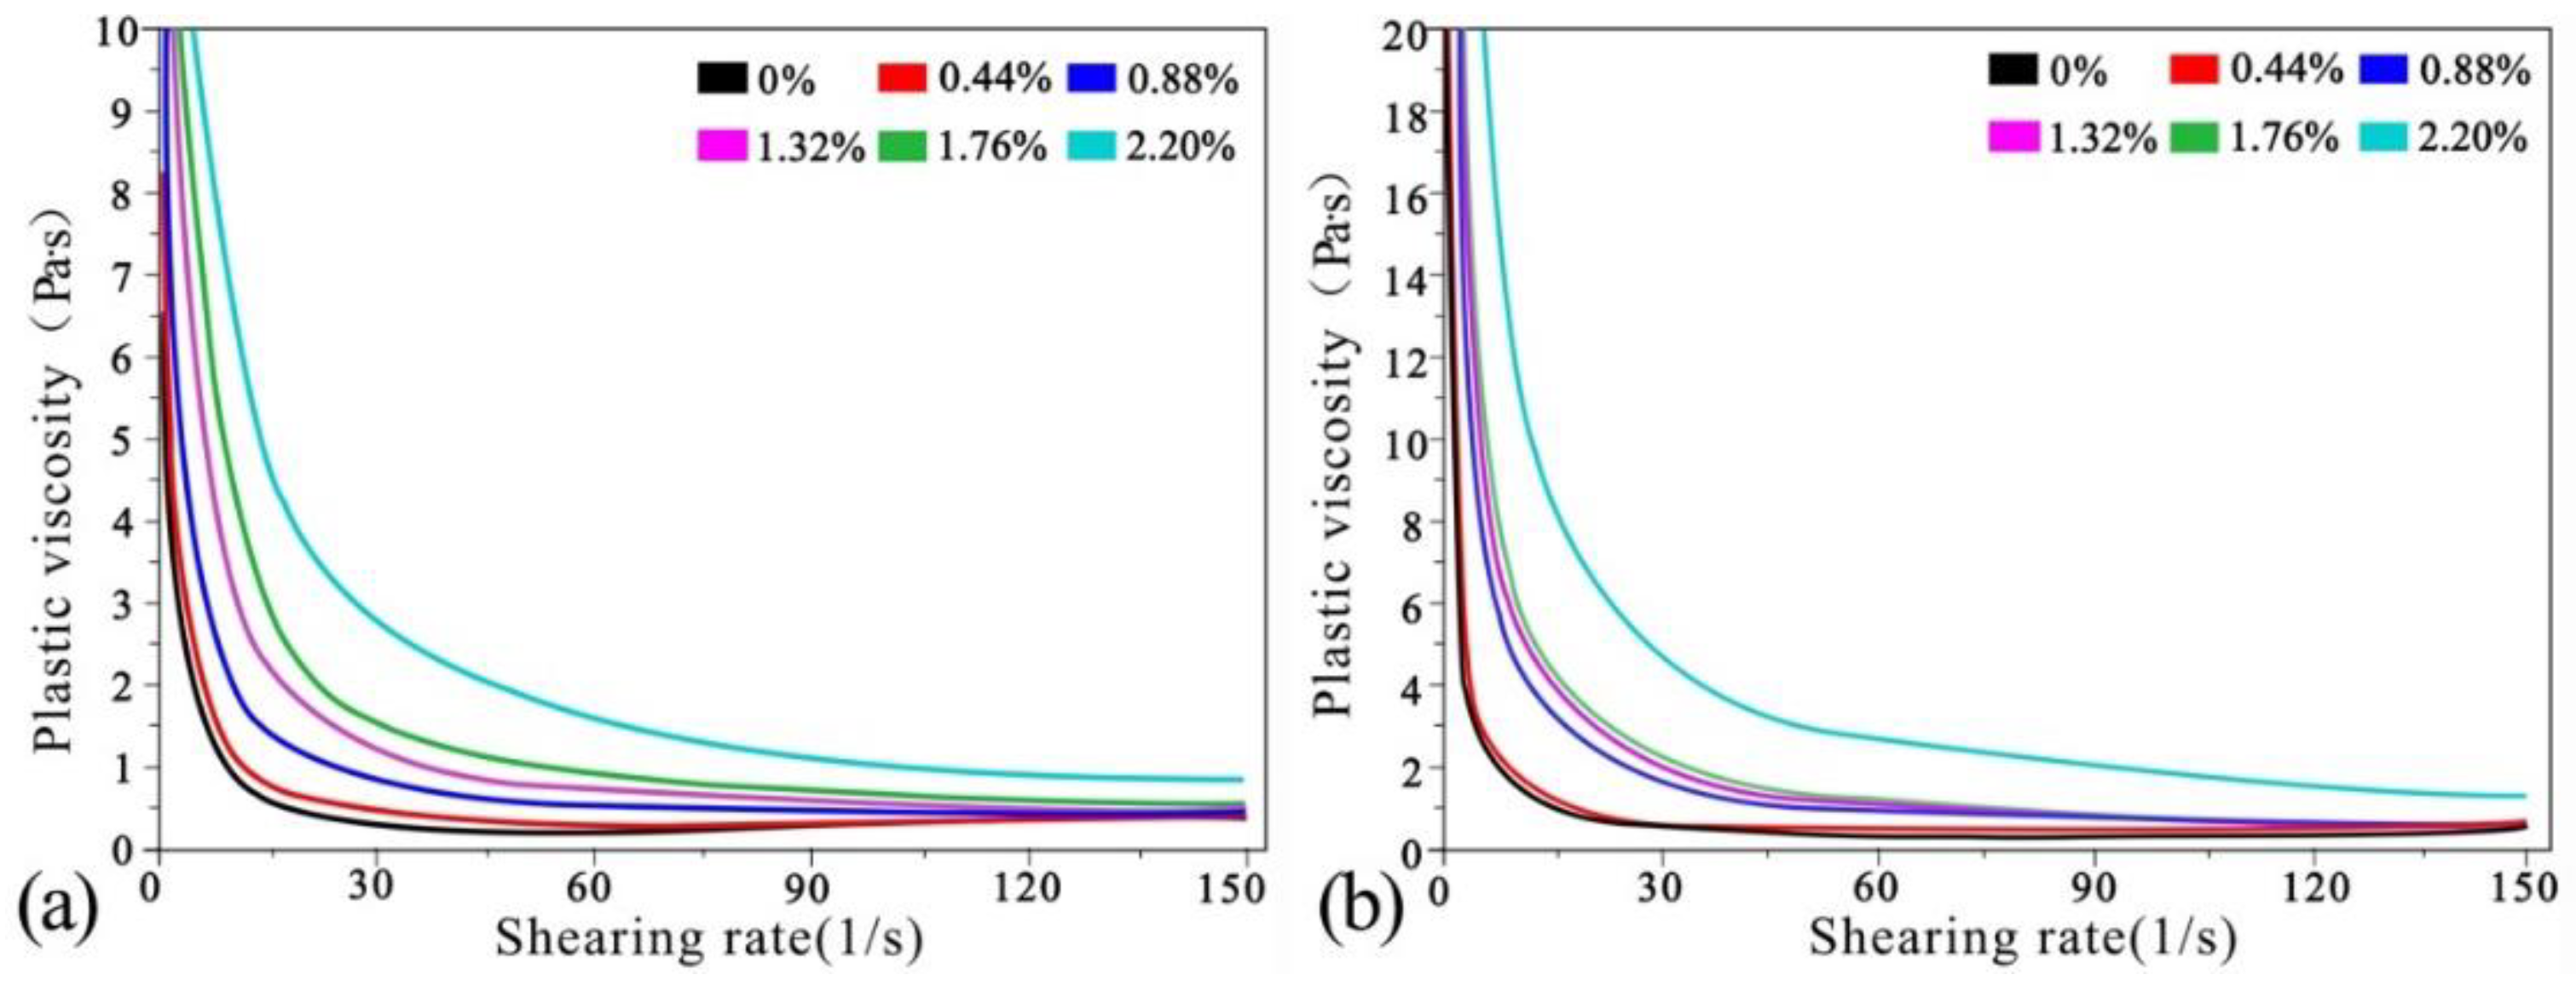
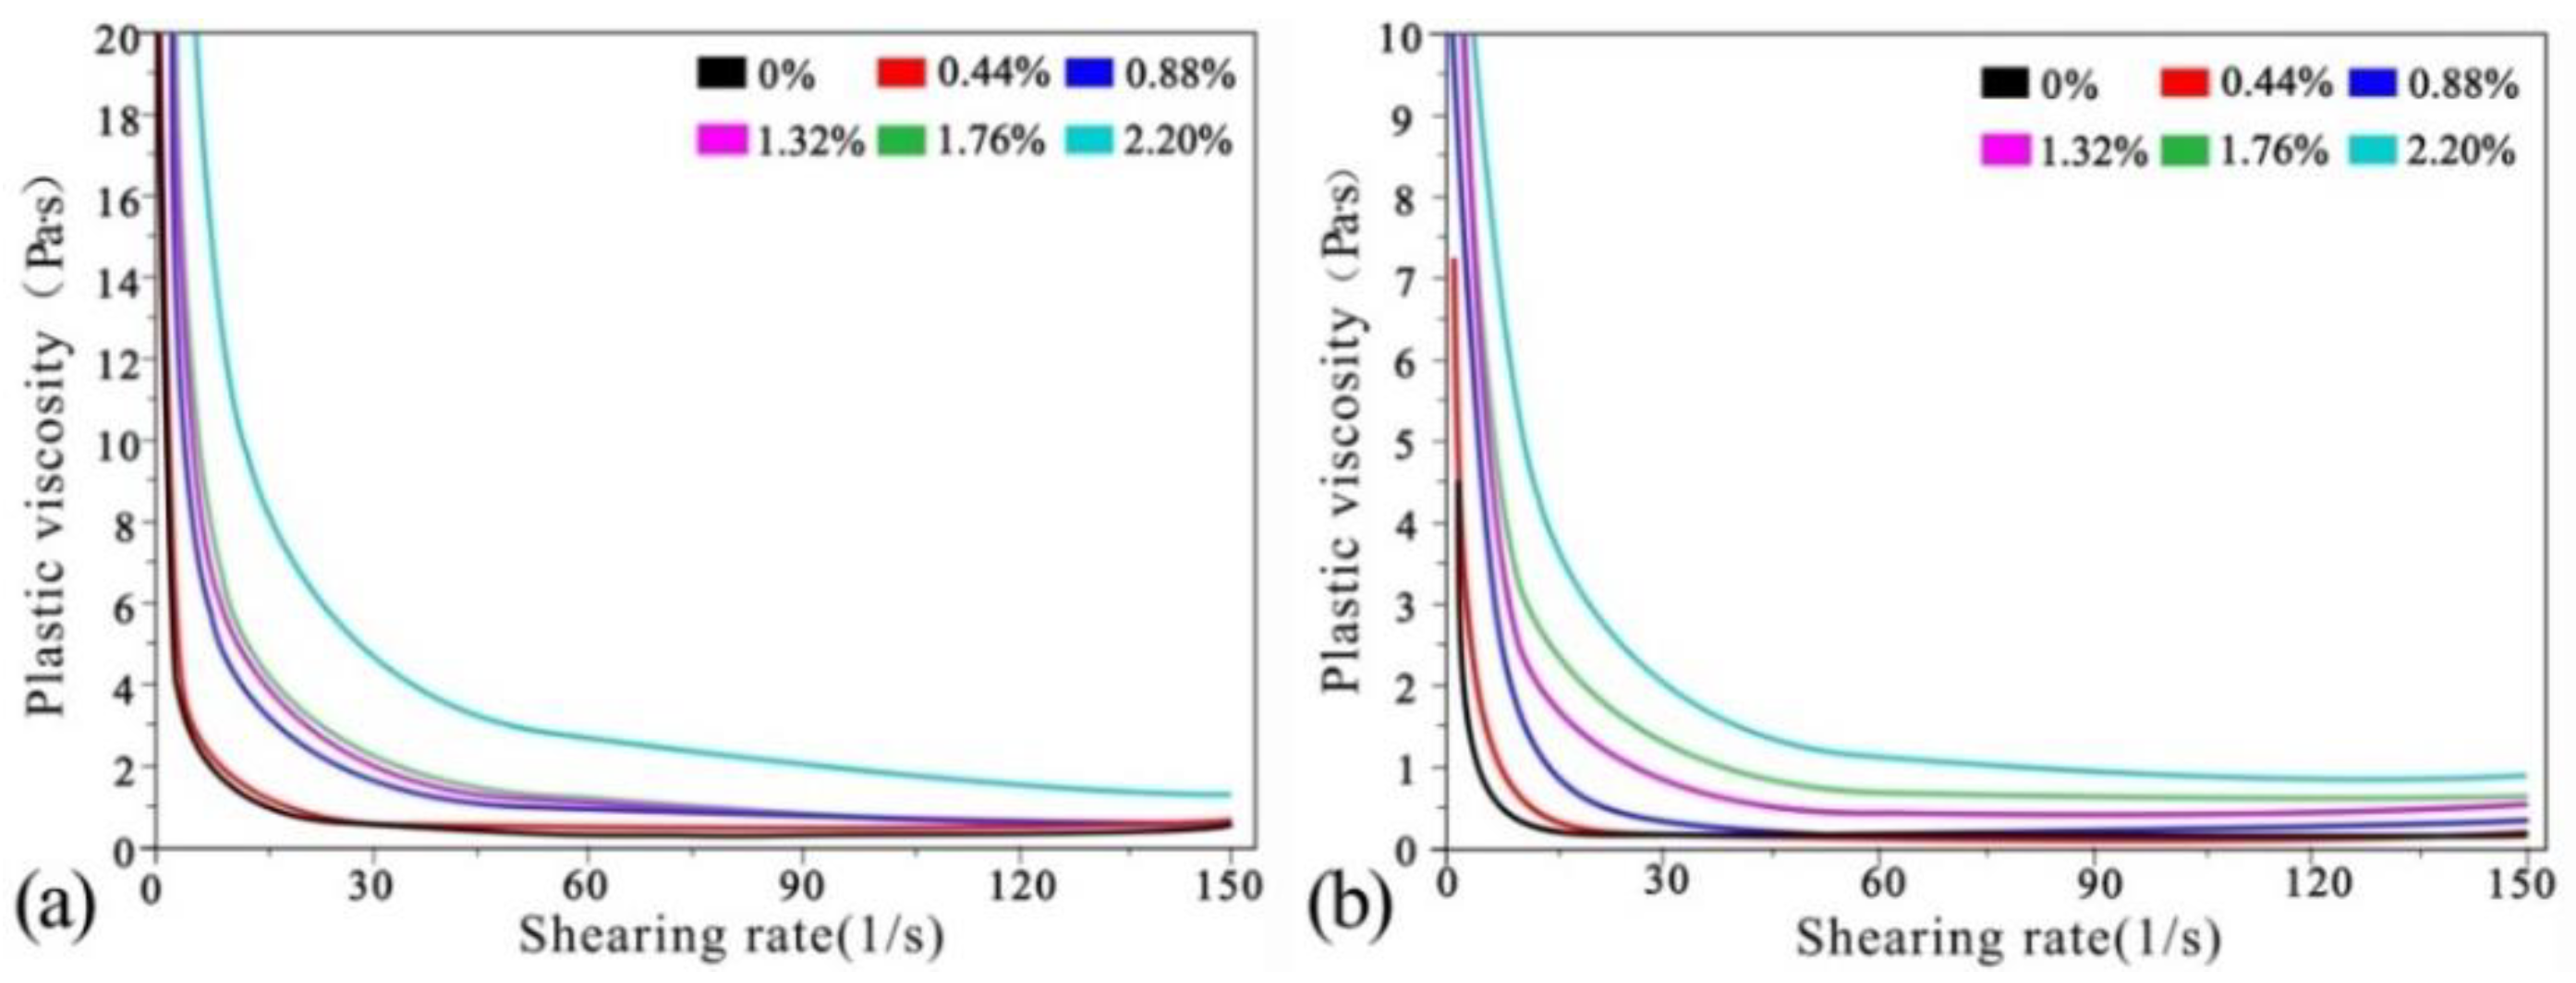
(1) Comparative analysis of viscosity
Viscosity curves of net cement pastes after carbonation under mechanical and ultrasonic vibration are shown in
Figure 8a,b.
Table 9 and
Table 10 show the viscosity values more clearly. The viscosity values were estimated for cement-paste shear rates of 30 L/s, 60 L/s, 90 L/s, 120 L/s and 150 L/s and CO
2 AA values of 0%, 0.44%, 0.88%, 1.32%, 1.76% and 2.20%, respectively.
It can be seen from
Table 9 and
Table 10 that viscosity of cement paste before carbonation at shear rates of 30 L/s, 60 L/s, 90 L/s, 120 L/s and 150 L/s were 96.7%, 80%, 28.1%, 16.7% and 41.5% higher than those carbonated under mechanical vibration. At CO
2 AA = 0.44%, the viscosities under ultrasonic vibration were 19.6%, 52.6%, 28.6%, 32.6% and 67.3% higher than under mechanical vibration. At CO
2 AA = 0.88%, the viscosities under ultrasonic vibration were 103.8%, 96.2%, 58.8%, 19.2% and 15.4% higher than under mechanical vibration. At CO
2 AA = 1.32%, the viscosities under ultrasonic vibration were 83.3%, 83.3%, 5.3%, 19.4% and 0% higher than under mechanical vibration. At CO
2 AA = 1.76%, the viscosities under ultrasonic vibration were 48%, 26.3%, 16.9%, 98.2% and 87.5%. At CO
2 AA = 2.20%, the viscosities under ultrasonic vibration were 80.9%, 64.2%, 55.8%, 141.5% and 136.5% higher.
Comparison of the two vibration modes shows that the viscosity after ultrasonic vibration is higher than that under mechanical vibration, indicating that ultrasonic vibration can effectively increase the viscosity of fresh cement paste. Moreover, the viscosity of cement paste increases gradually with increases in CO2 AA under both vibration modes. At CO2 AA = 0.44%, the viscosity changes the least with increases in shear rate. At CO2 AA = 0.88%, 1.32% and 1.76%, the viscosity presents similar variations but increases to some extent. At CO2 AA = 2.20%, the viscosity value changes the most.
(2) Comparative analysis of yielding stress
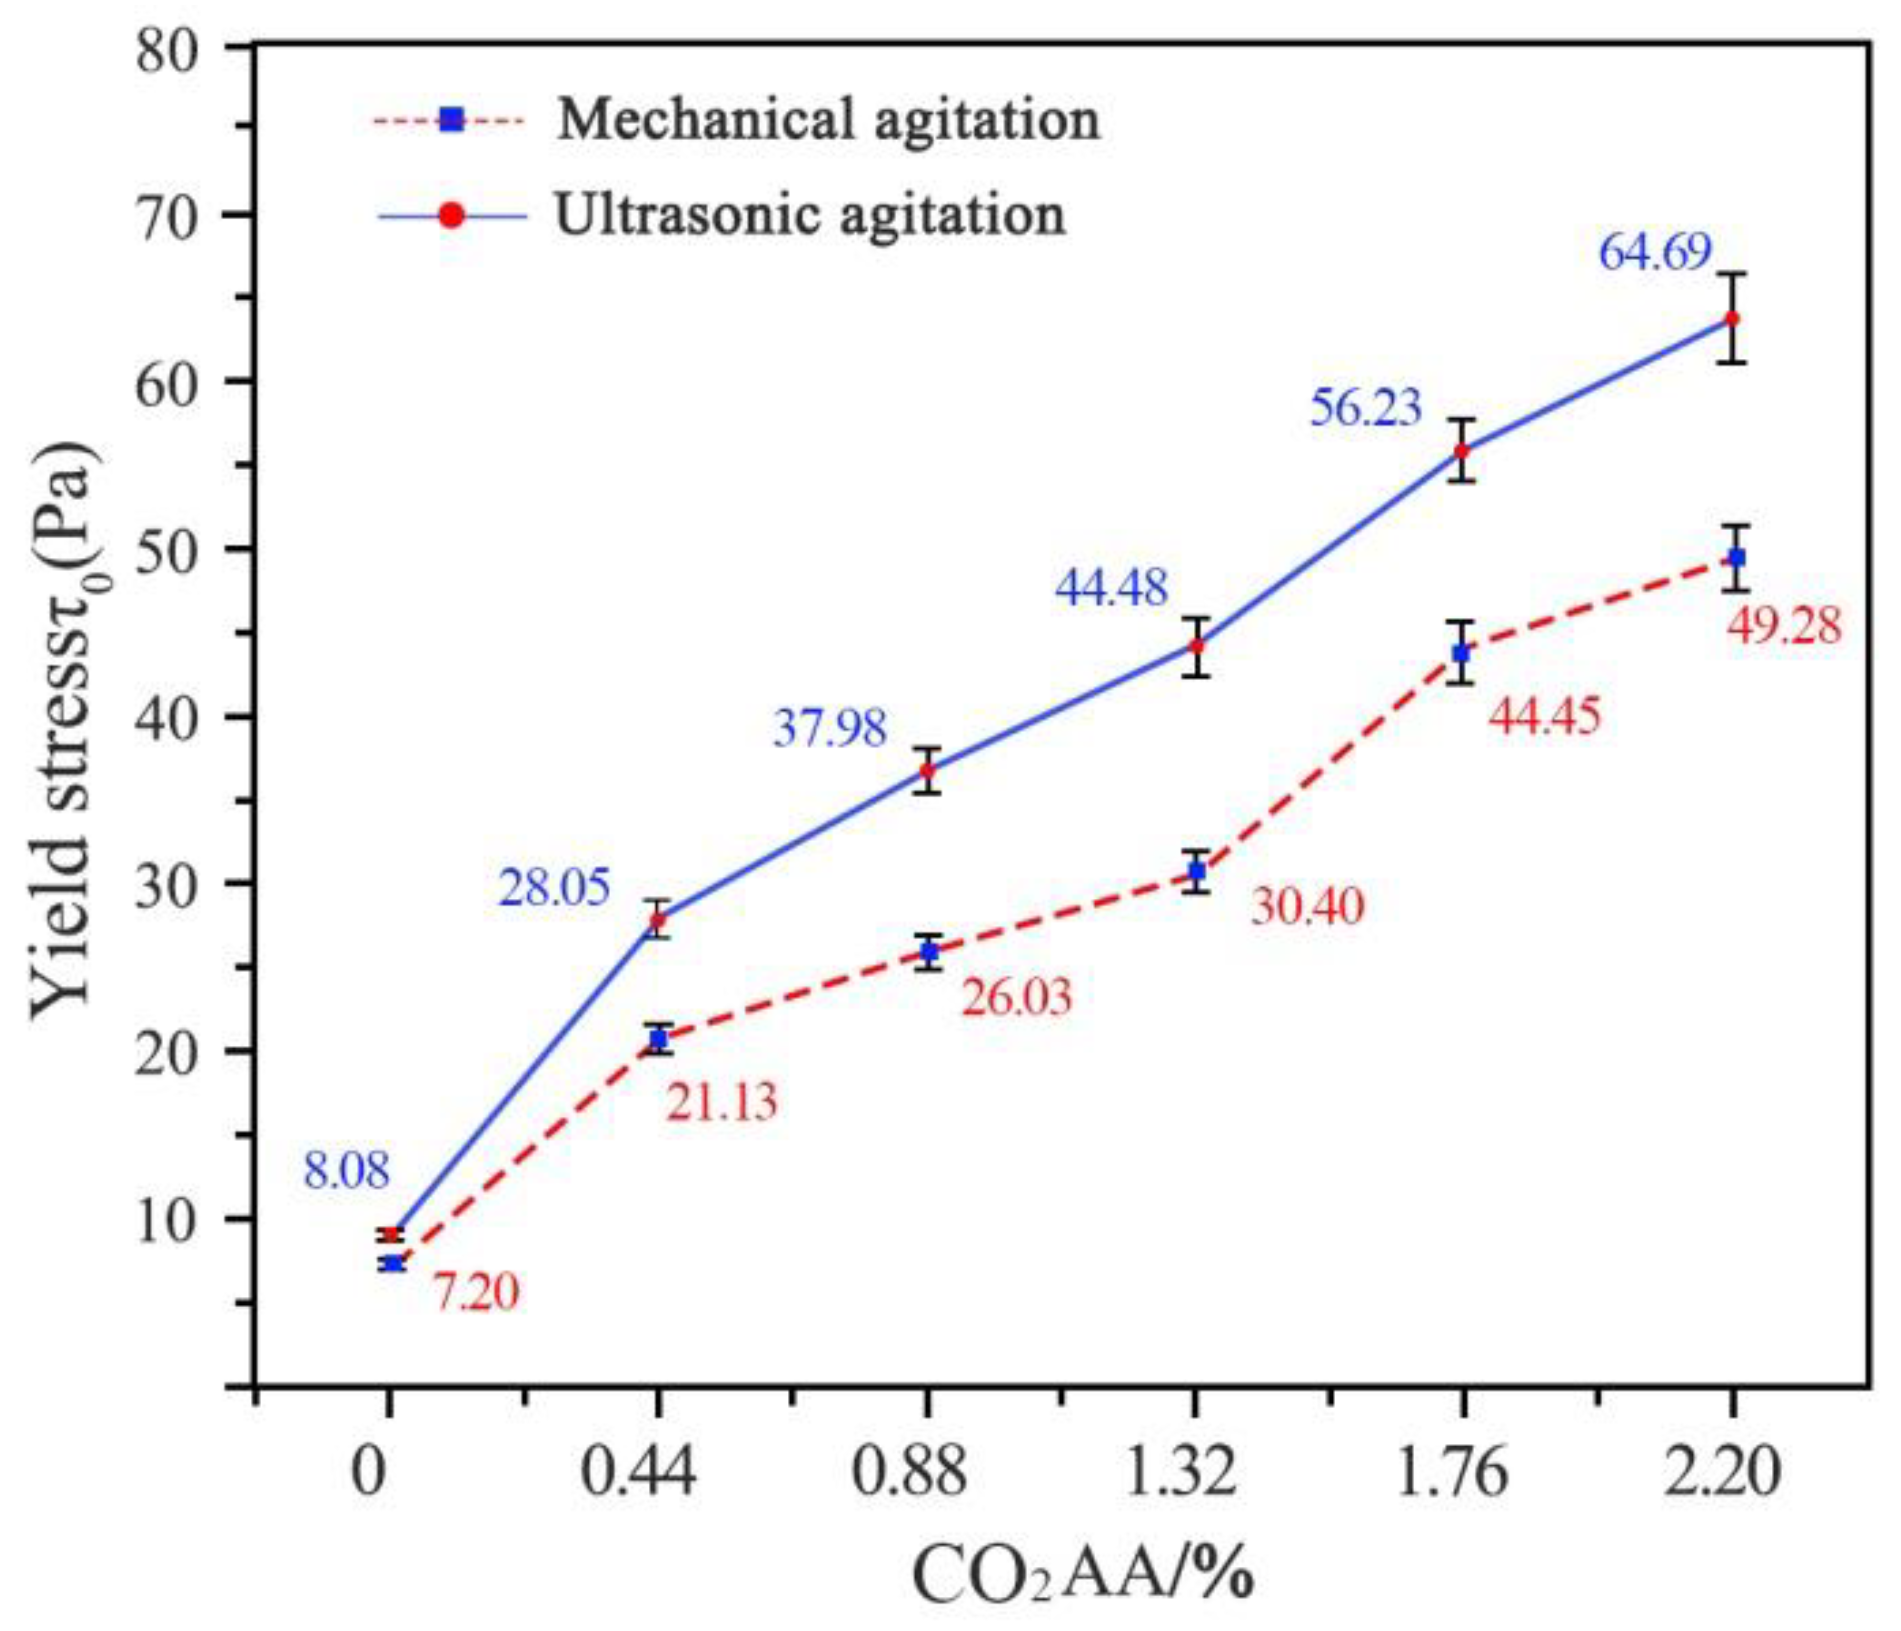
The yield stress of cement paste carbonated under ultrasonic vibration, which was derived from the ultrasonic rheological model, is shown in
Figure 9. Mechanical vibration was used as the control group. The yield stress under mechanical vibration was derived from the H-B model. It can be seen from
Figure 9 that CO
2 AA = 0%, 0.44%, 0.88%, 1.32%, 1.76% and 2.20%. At these values, the yield stresses of cement paste under ultrasonic vibration were 12.2%, 32.7%, 45.1%, 46.3%, 26.5% and 31.3%, respectively, which were higher than those under mechanical vibration. Under ultrasonic vibration, the yield stresses were 247%, 35.4.%, 17.1%, 26.4% and 31.3% higher, respectively. According to the measured data, ultrasonic vibration can effectively improve the yield stress of carbonated cement paste. The yield stress of carbonated cement paste is positively related to CO
2 AA.
5.5. Effects of PS on the Rheological Properties of Cement Paste Carbonated under Ultrasonic Vibration
(1) Analysis of shear stress variation
Rheological curves of fresh carbonated cement pastes before and after PS addition are shown in
Figure 10. The curves of shear stress after carbonation under ultrasonic vibration are shown in
Figure 10a. The curves of shear stress after CO
2 carbonation and PS addition are shown in
Figure 10b.
Table 11 was plotted according to the rheological curves in
Figure 10b. The variations in shear stress before adding PS can refer to the comparative analysis in
Table 5.
The shear stresses of fresh cement pastes before and after adding water reducer are compared next. At shear rates of 30 L/s, 60 L/s, 90 L/s, 120 L/s and 150 L/s and before carbonation, the shear stresses of fresh cement pastes with added water reducer were 92.2%, 86.2%, 81.9%, 76.4% and 71.5% lower than those without water reducer. At CO2 AA = 0.44%, the shear stresses of cement pastes were 79.8%, 73.6%, 55.6%, 50.6% and 83.3% lower, respectively. At CO2 AA = 0.88%, the shear stresses of cement pastes were 70.5%, 67.2%, 53.6%, 41.5% and 32.6% lower, respectively. At CO2 AA = 1.32%, the shear stresses were 61.2%, 54.3%, 47.9%, 39.1% and 36.9% lower, respectively. At CO2 AA = 1.76%, the shear stresses were 52.5%, 47.9%, 46.6%, 44.4% and 42.4% lower. At CO2 AA = 2.20%, the shear stresses were 48.6%, 45.6%, 40.3%, 37.6% and 37% lower, respectively.
Based on the above comparison, the shear stress of carbonated fresh cement paste declines significantly after adding water reducer. Even in fresh cement pastes with the same amount of CO2, the shear stresses of cement pastes with and without water reducer decline sharply.
(2) Analysis of viscosity-curve variation
Viscosity curves of fresh carbonated cement pastes before and after PS addition are shown in
Figure 11. The curves for pastes carbonated under ultrasonic vibration are shown in
Figure 11a. The viscosity curves for carbonated pastes after PS addition are shown in
Figure 12b.
Table 12 is plotted according to the viscosity curves after adding water reducer (
Figure 11b). The variation in viscosity before PS addition can be compared in
Table 10.
The viscosities of fresh cement pastes before and after PS addition are compared in this section. Without a supply of CO2 and at shear rates of 30 L/s, 60 L/s, 90 L/s, 120 L/s and 150 L/s, the viscosities of cement pastes decreased by 74.6%, 55.6%, 58.5%, 61.9% and 67.2%, respectively, after PS addition. At CO2 AA = 0.44%, the viscosities decreased by 77.9%, 80.4%, 67.9%, 51.6% and 36.7%. At CO2 AA = 0.88%, the viscosities decreased by 77.9%, 80.4%, 67.9%, 51.6% and 36.7%. As CO2 AA continued to increase to 1.32%, the viscosities decreased by 61.4%, 64.4%, 52.7%, 33.8% and 11.3%. When CO2 AA = 1.76%, the viscosities decreased by 86%, 43.3%, 26.5%, 61.8% and 59.1%. At CO2 AA = 2.20%, the viscosities decreased by 55.2%, 57.3%, 50.7%, 43.2% and 34.8%, respectively.
Through the above comparison, adding water reducer can decrease the viscosity of carbonated cement paste effectively. The viscosity of fresh cement paste increased to some extent with increases in CO2 AA. Hence, it is concluded that adding water reducer can effectively improve the liquidity of cement paste after carbonation. However, such liquidity weakens with increases in CO2 AA.


