
Impact and Challenges of Reducing Petroleum Consumption for Decarbonization


Abstract
:1. Introduction
2. Materials and Methods
2.1. Target Products and System Boundary of Material Flow
2.2. Data Collection
2.3. Outlook of Material Flow by Meeting 1.5 °C Target
- ✓
- 25% reduction of disposable plastic by 2030,
- ✓
- 60% reuse and recycling of waste plastic containers and packaging by 2030,
- ✓
- 100% reuse and recycling of used plastics by 2035,
- ✓
- Double the recycling of waste plastic by 2030, and
- ✓
- Introducing 2000.00 thousand ton of biomass plastic by 2030.
3. Results and Discussion
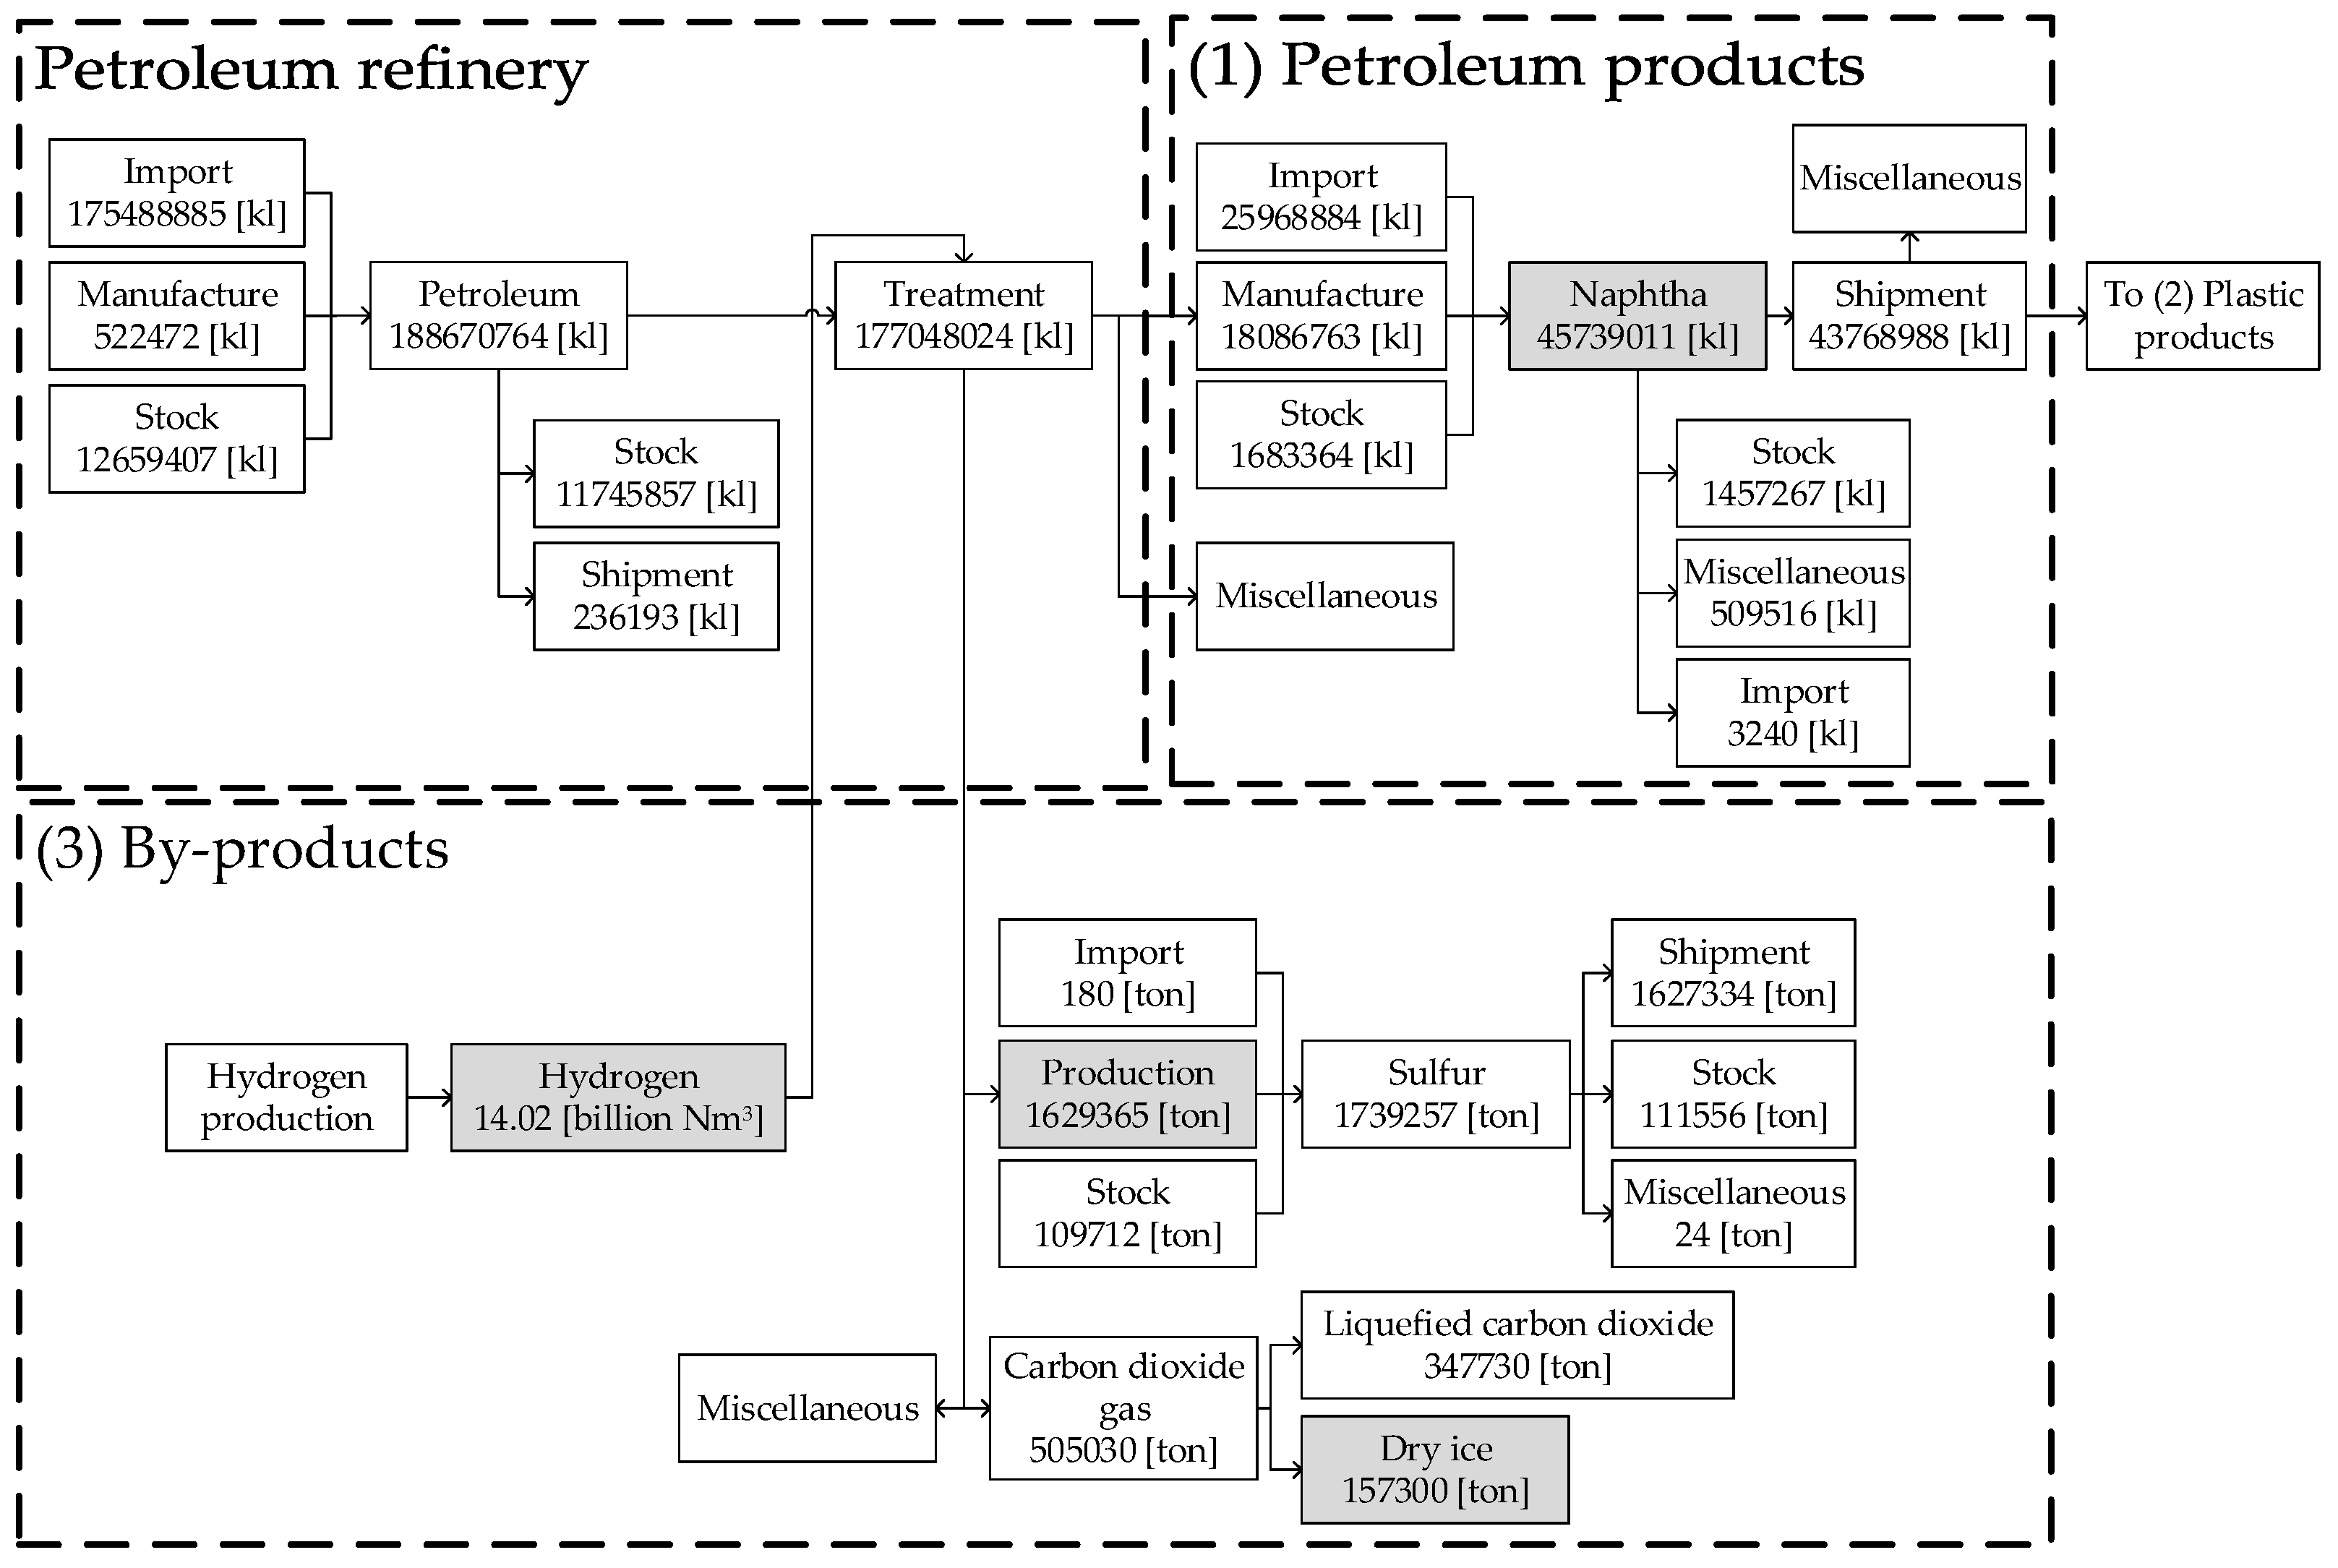
3.1. Material Flow of Petroleum-Related Processes
3.2. Outlook of Naphtha, Plastic Products, and By-Products
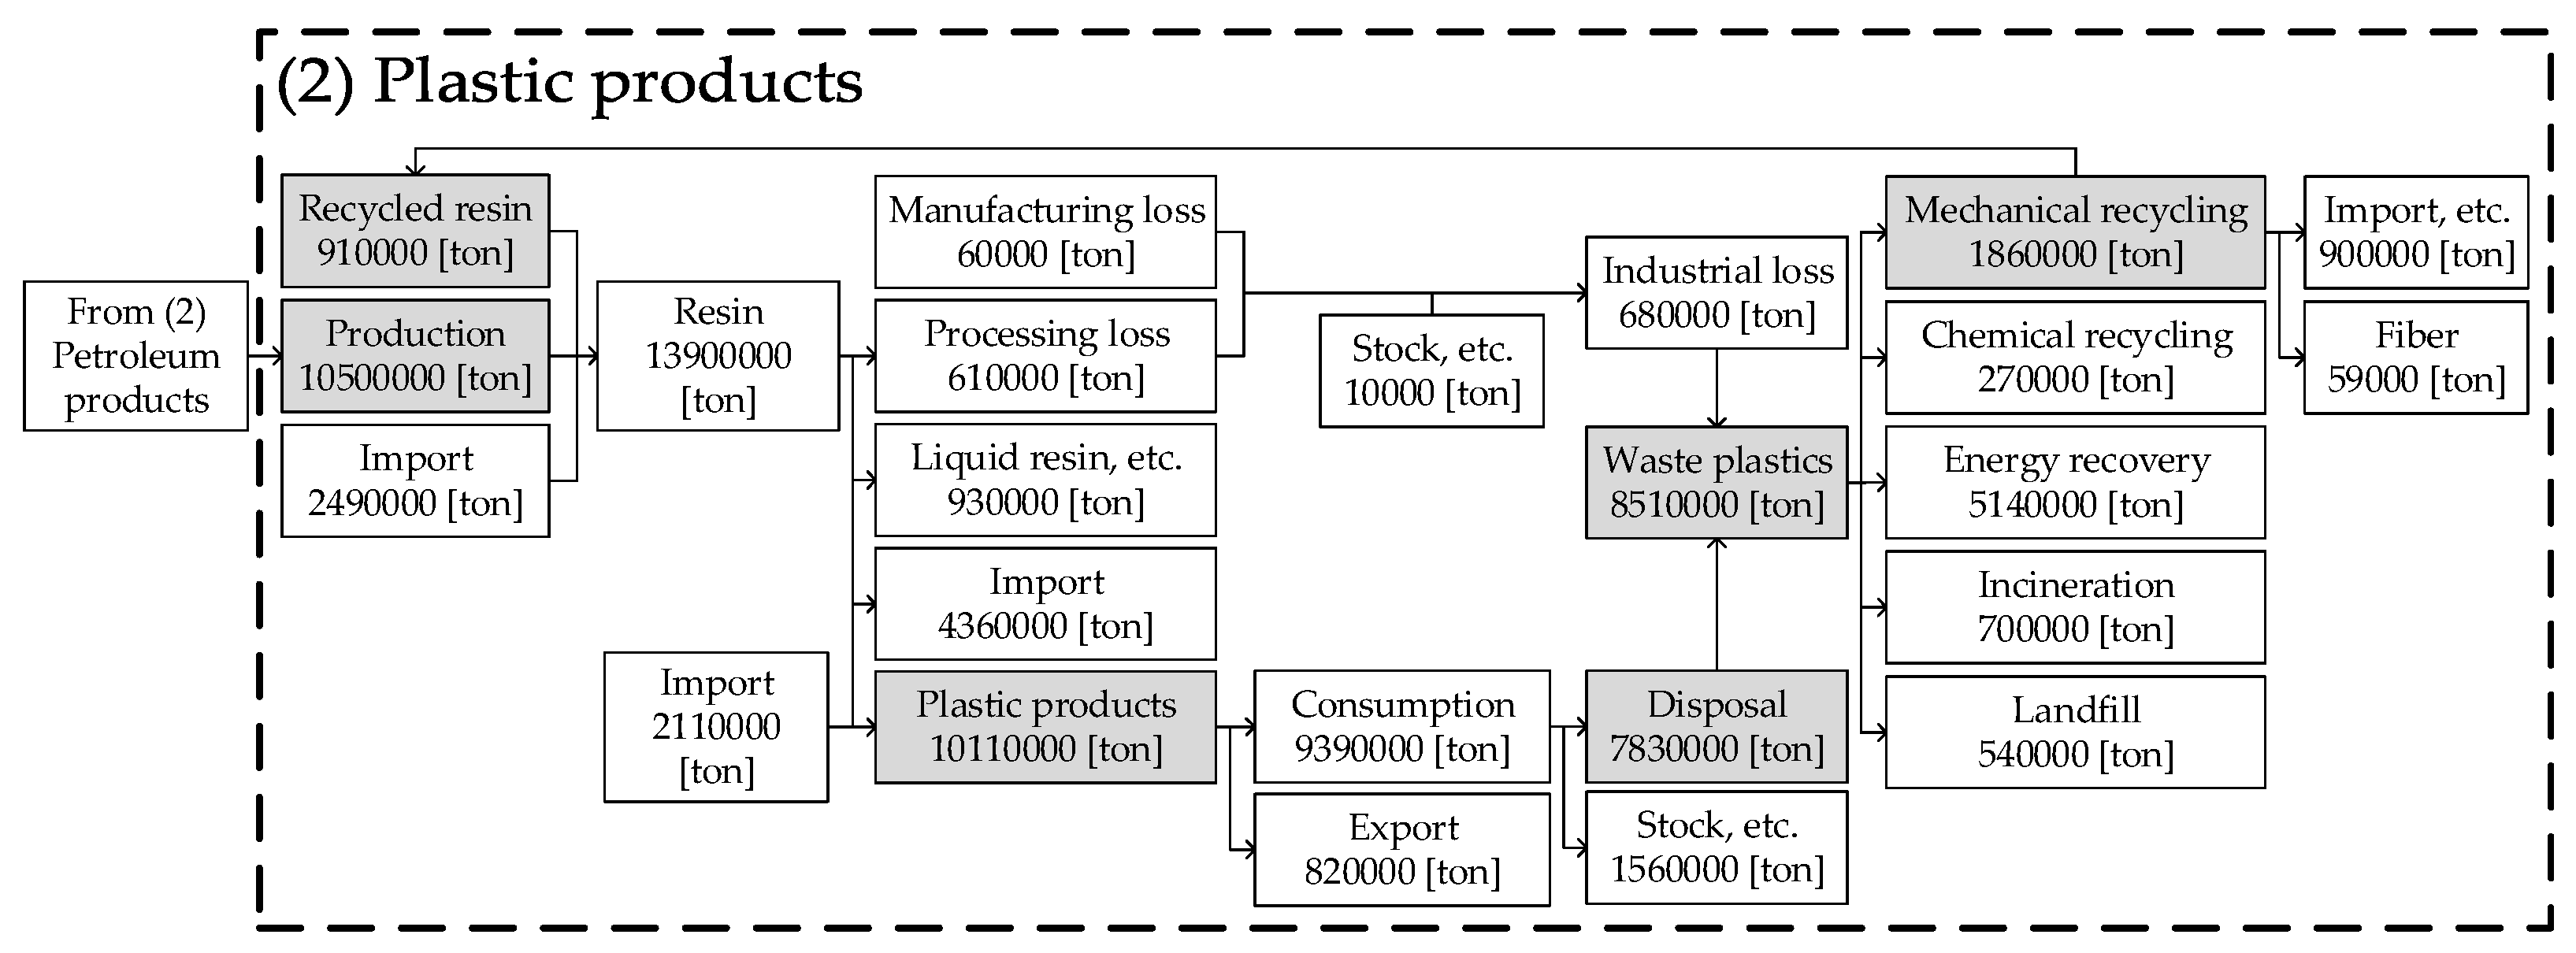
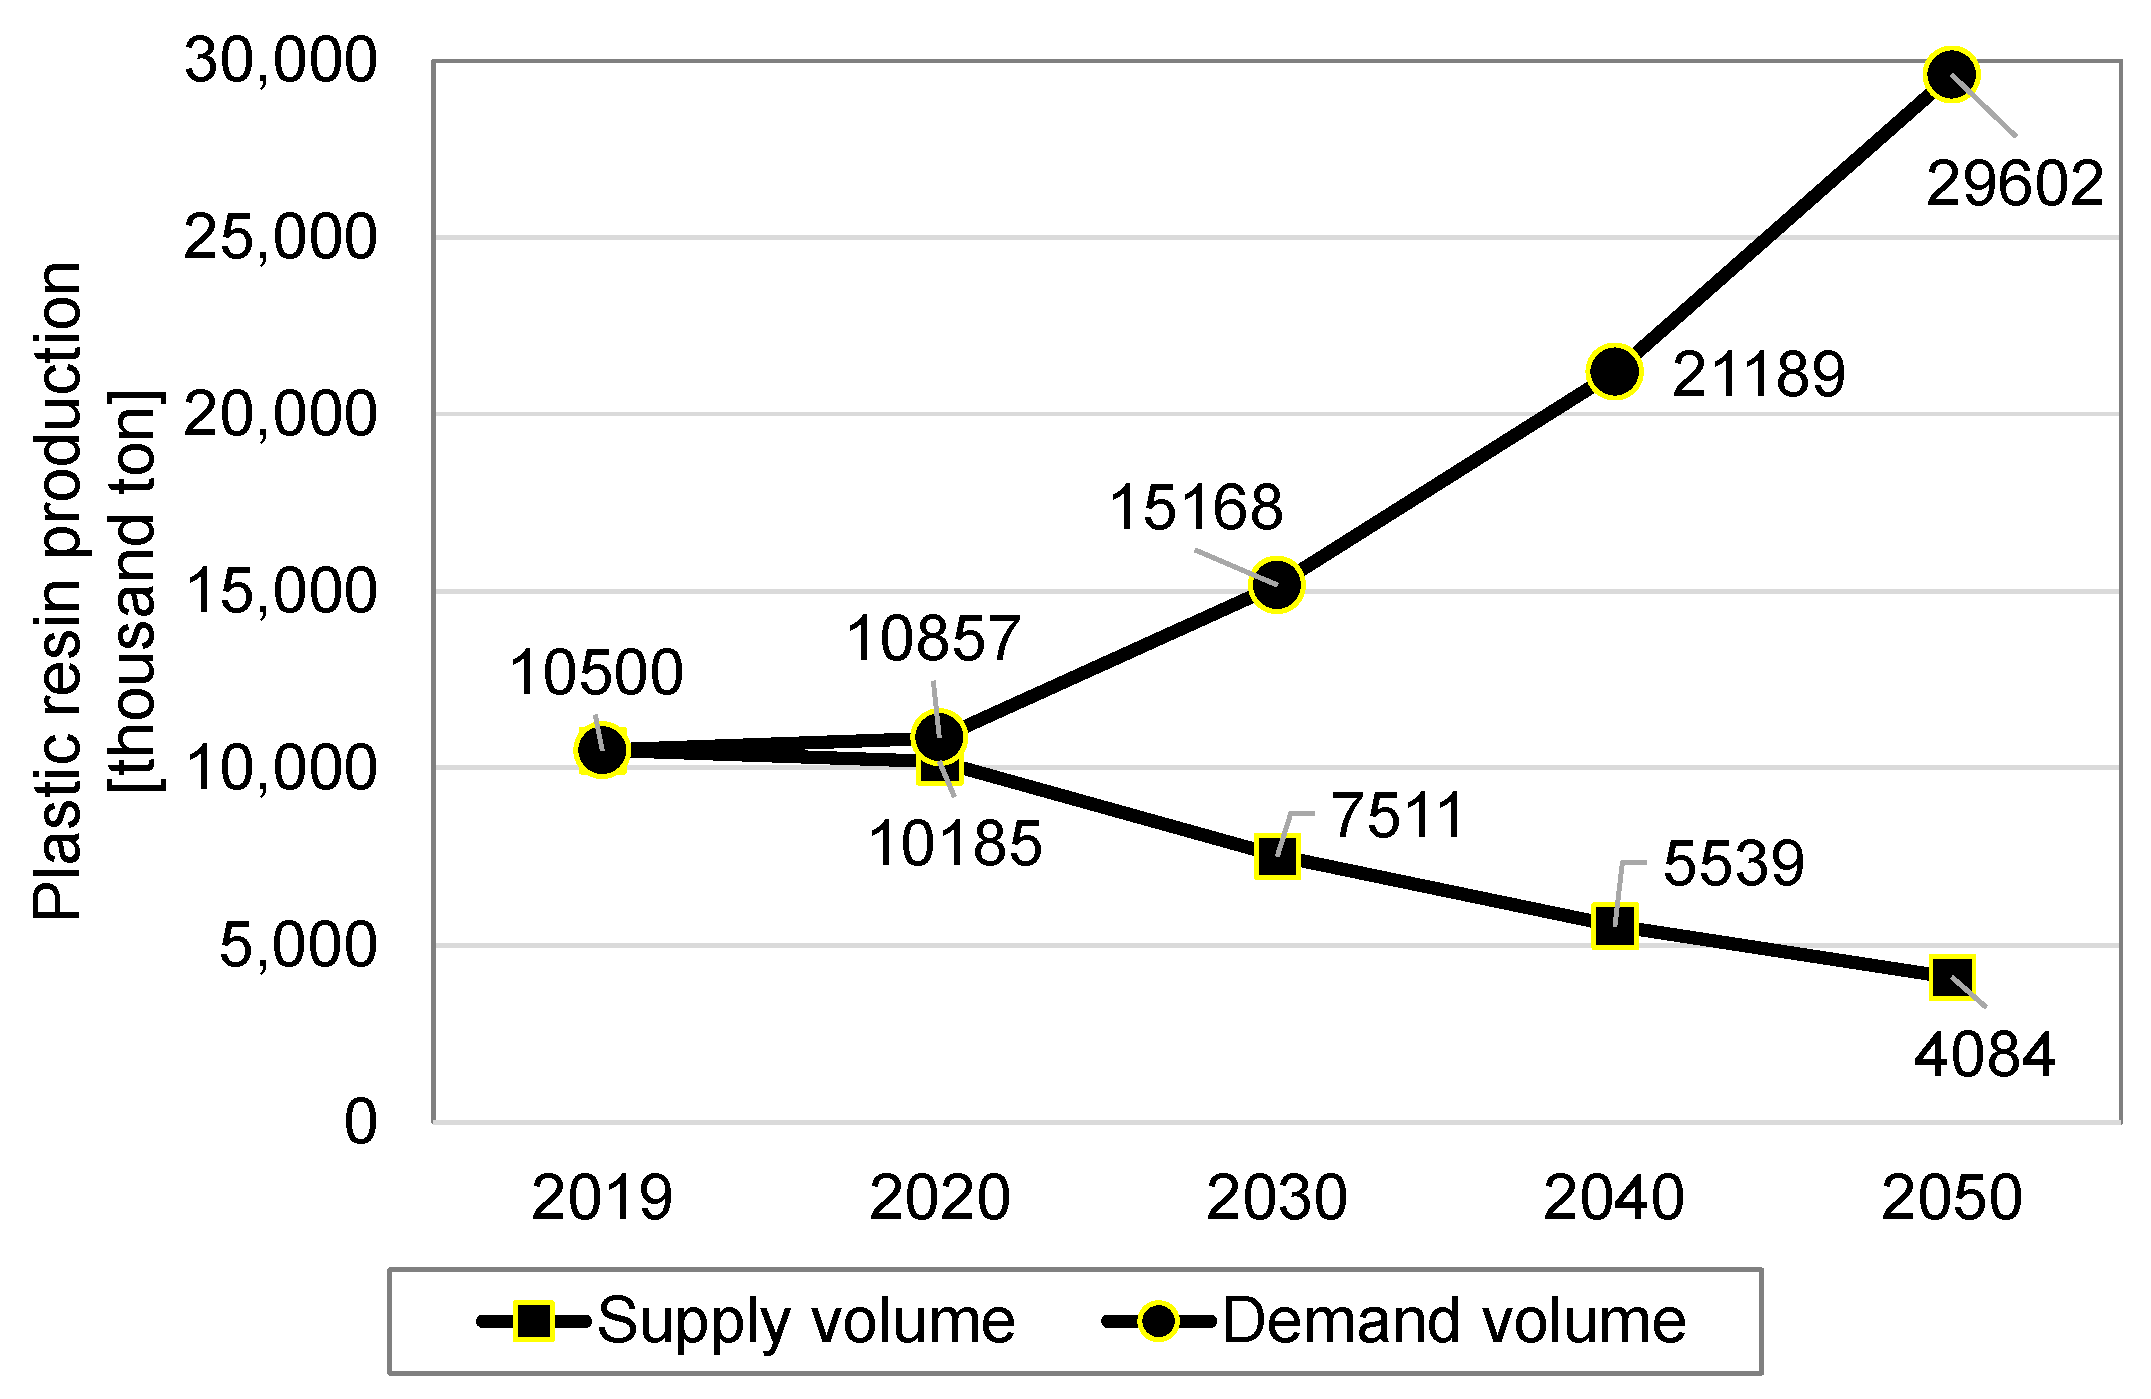
3.2.1. Plastic Products
3.2.2. Hydrogen
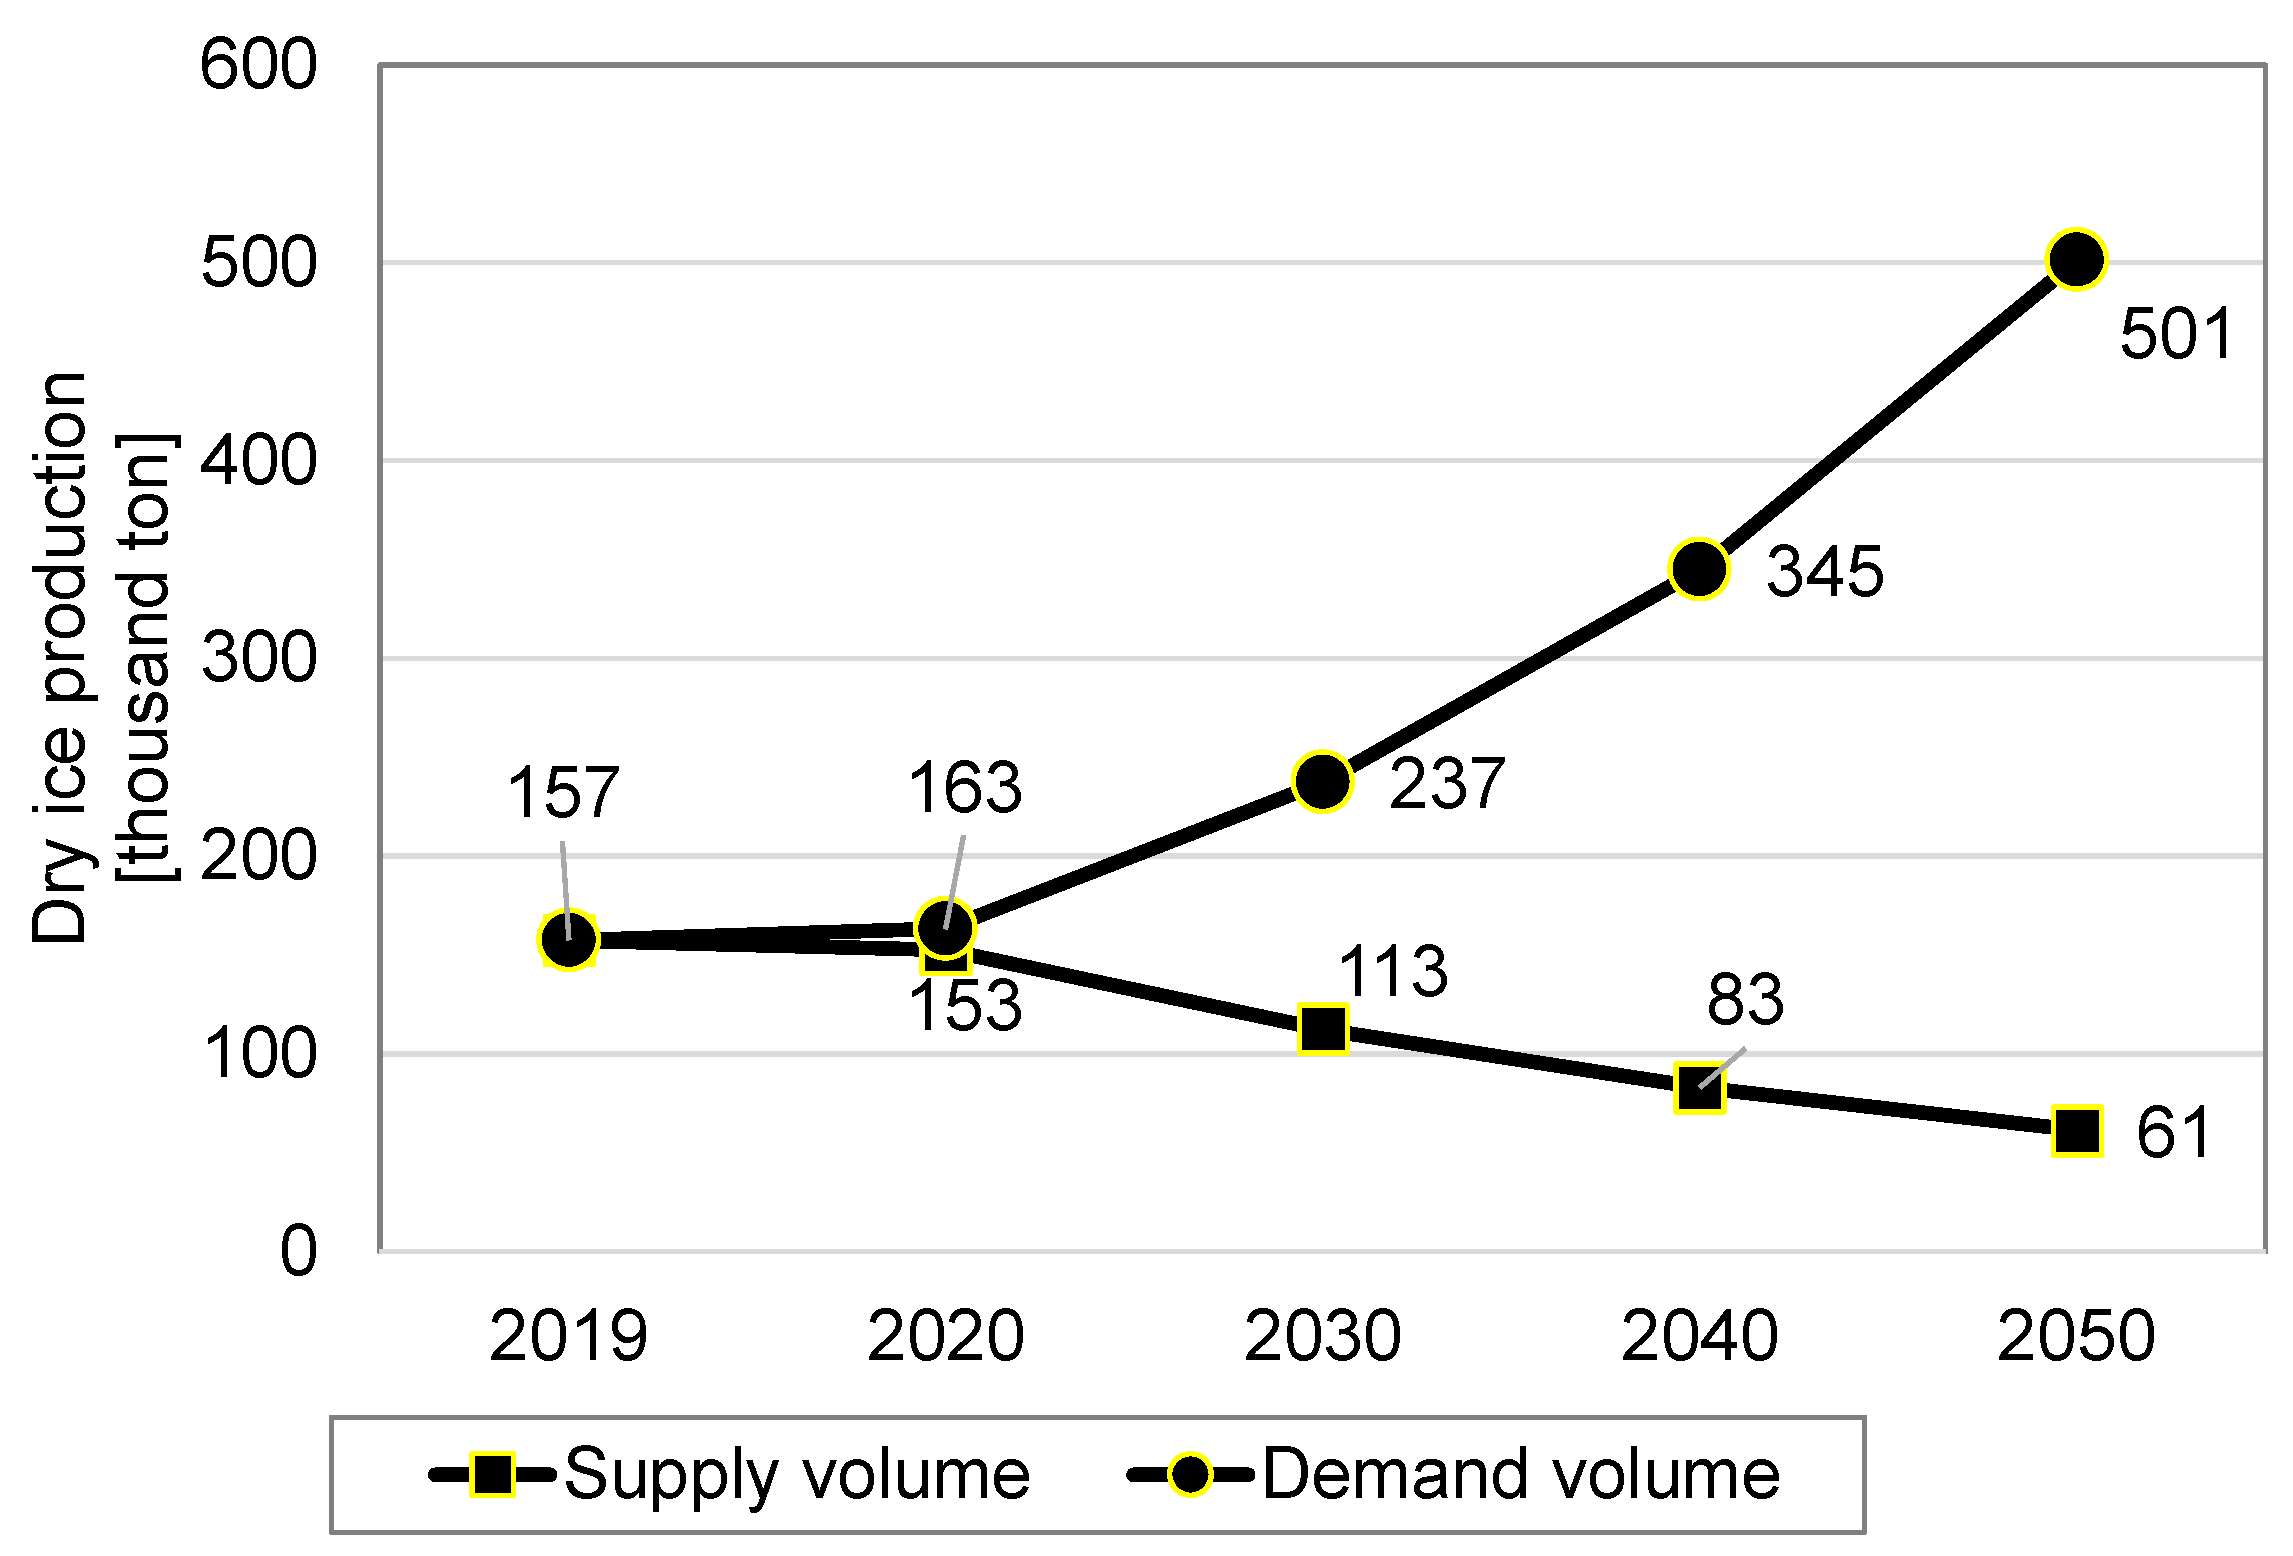
3.2.3. Dry Ice
3.2.4. Sulfur
3.3. Discussion
4. Conclusions
- (1)
- Data pertaining to petroleum refining, petroleum product manufacturing, and plastic product manufacturing processes in 2019 were collected to create a material flow diagram that provides a consistent picture of the current state of domestic petroleum supply and demand. The material flow also covered the production of sulfur, a petroleum by-product, as well as dry ice, one of the uses of carbon dioxide gas.
- (2)
- The domestic production of plastic resins in 2019 was approximately 10,500.00 thousand ton, and the production in 2030 will be approximately 7511.00 thousand ton, if the reduction in petroleum consumption that contributes to achieving the 1.5 °C target is achieved. The JMOE is planning to recycle waste plastics and produce biomass plastics in its plastic resource recycling strategy. However, this requires further separation of waste plastics and reduction of production costs through mass production of biomass plastics.
- (3)
- Hydrogen is produced and consumed during the petroleum refining process, with hydrogen produced in an adjacent hydrogen plant. Hydrogen is produced in the amount of 14.02 billion Nm3, but is consumed entirely on site. At maximum operation of this hydrogen plant, there is a potential external supply of 2.14 billion Nm3, which would decrease to 1.53 billion Nm3 in 2030 if petroleum consumption were to decrease at the rate targeted for the reduction.
- (4)
- Domestic production of dry ice derived from petroleum by-products in 2019 was approximately 157.00 thousand ton, which would decline to approximately 61.00 thousand ton in 2030 if the above target is achieved. There are many import and technological challenges to cover the shortfall, and it is expected to be difficult to secure supply to achieve the expected increase in demand.
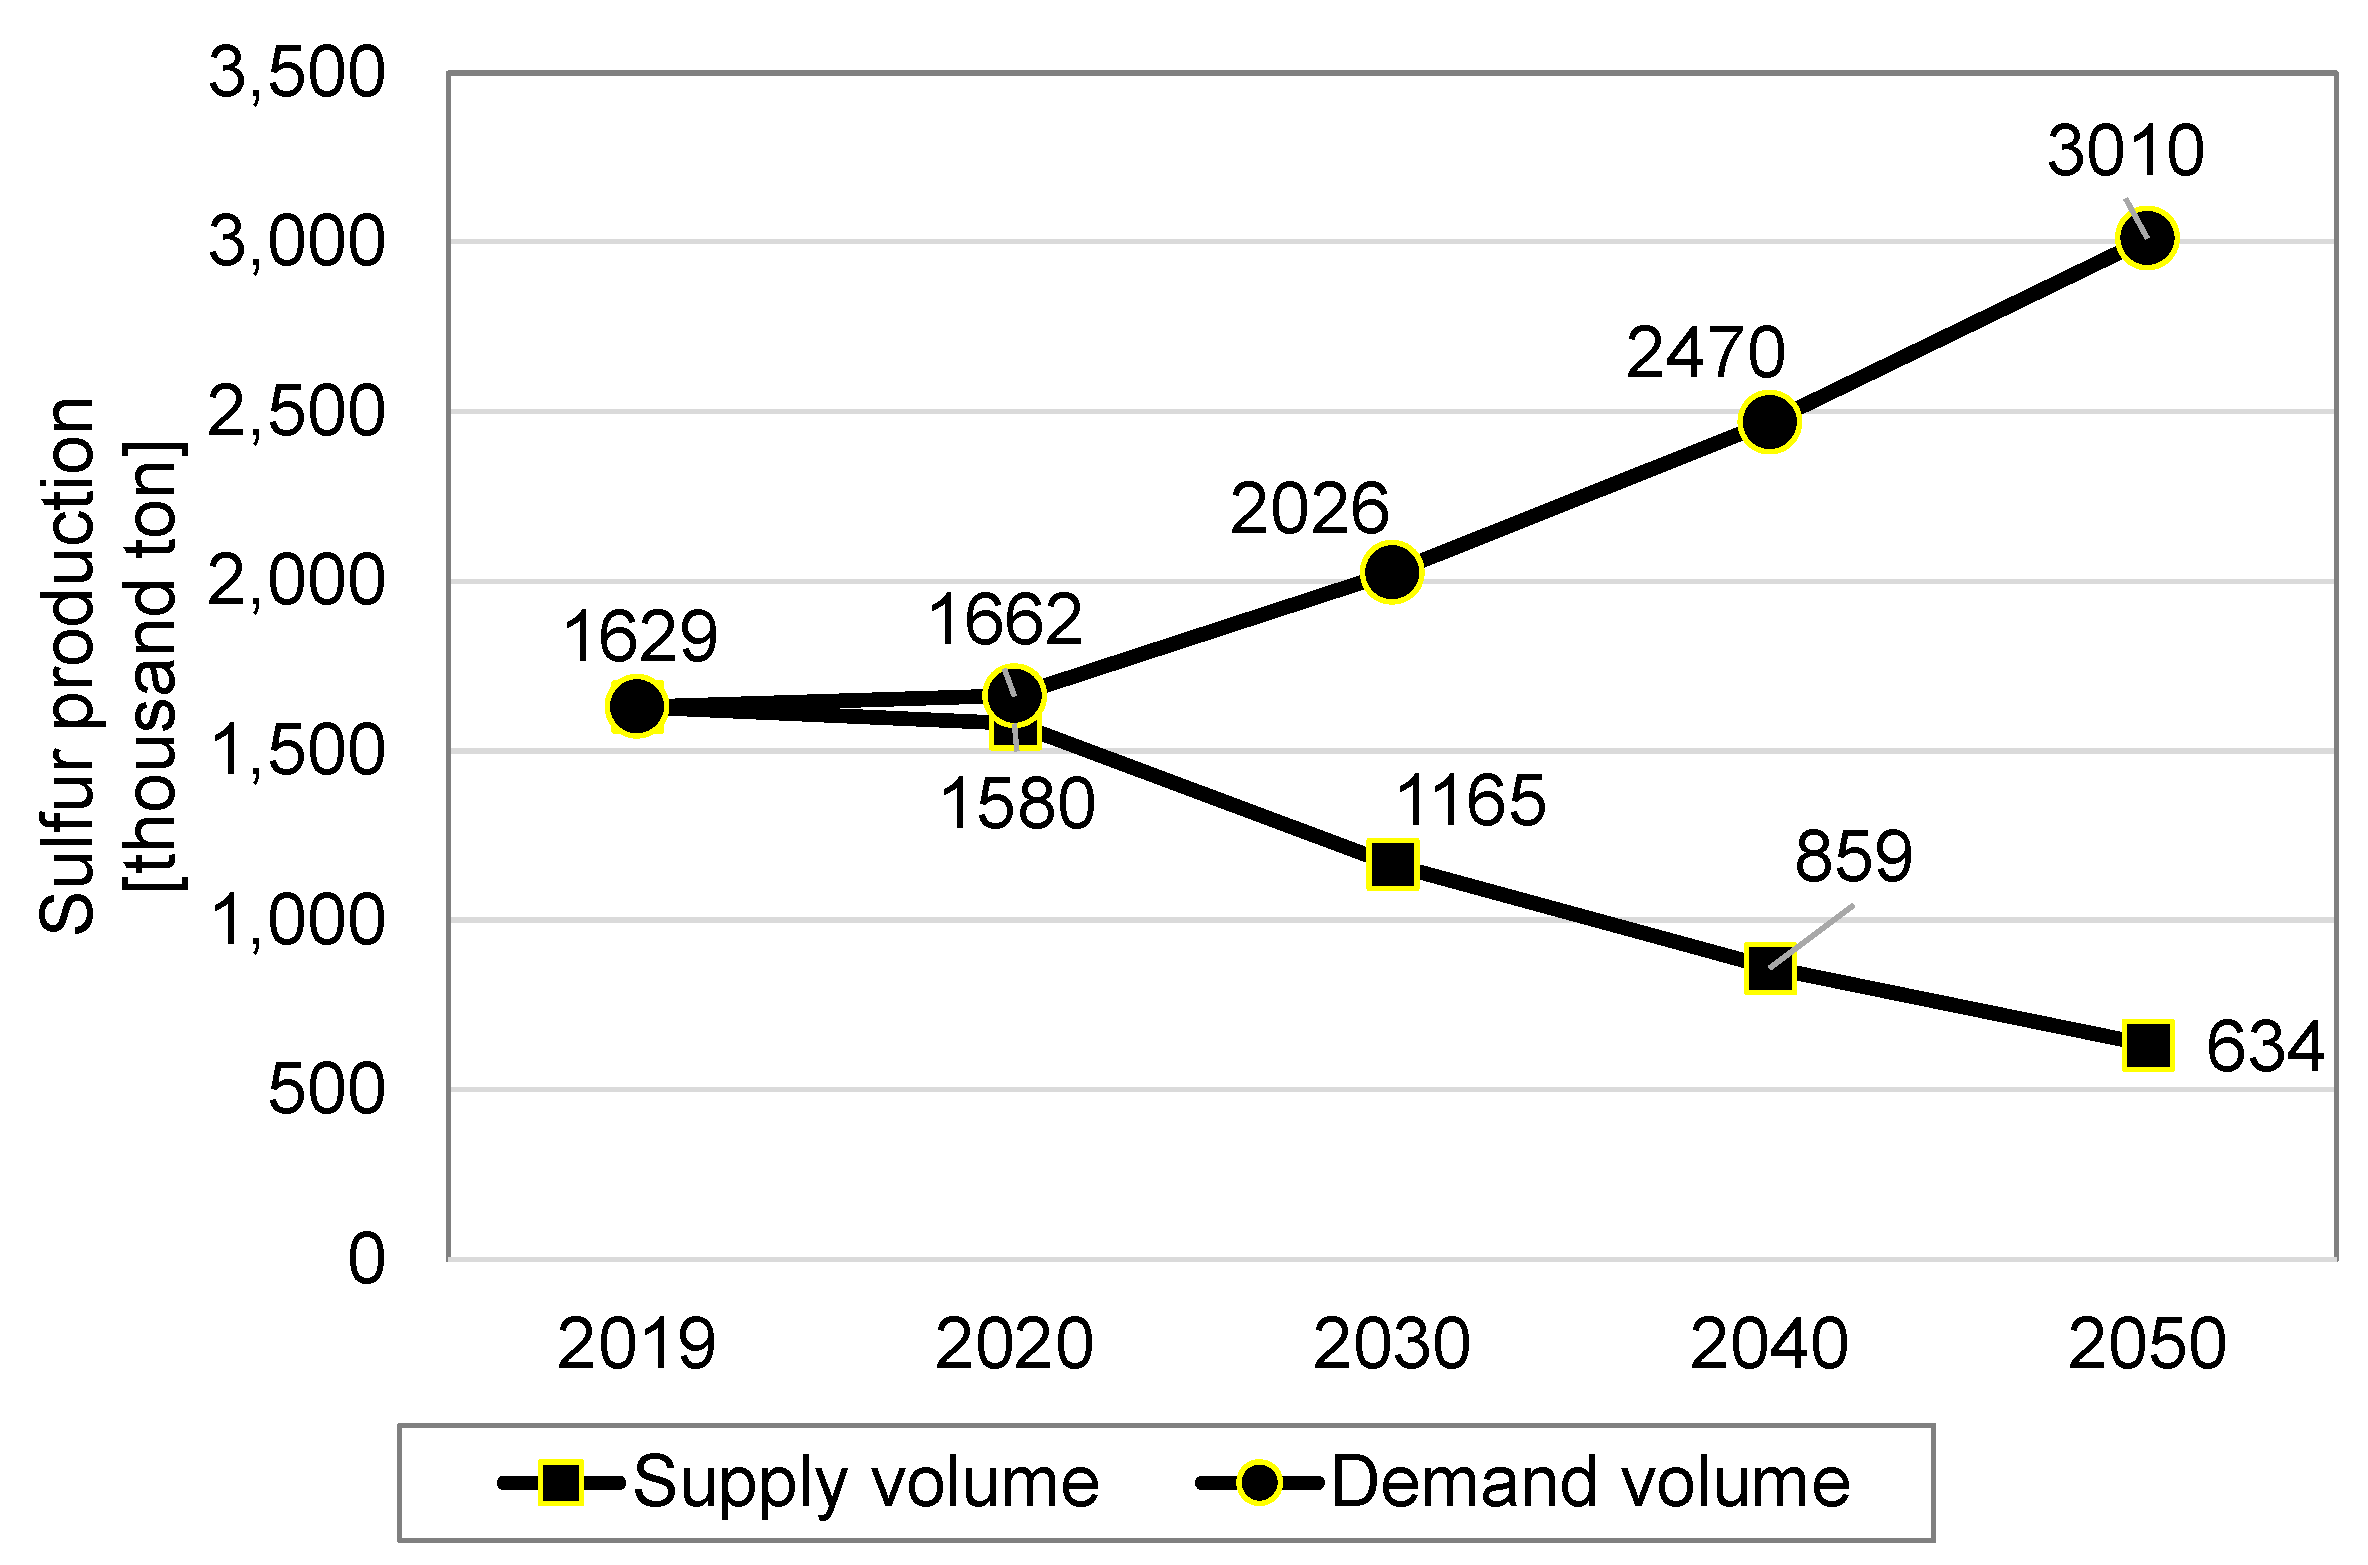
- (5)
- Domestic sulfur production from petroleum by-products in 2019 was approximately 1629.00 thousand ton. This would decrease to approximately 1165.00 thousand ton in 2030 if the above target is achieved. Since domestic demand for sulfur has remained at approximately 500.00 thousand ton, the majority of which is exported, the future domestic demand could be achieved by adjusting the volume of exports.
Author Contributions
Funding
Institutional Review Board Statement
Informed Consent Statement
Data Availability Statement
Acknowledgments
Conflicts of Interest
References
- The Paris Agreement. Available online: https://unfccc.int/process-and-meetings/the-paris-agreement/the-paris-agreement (accessed on 3 February 2022).
- Glasgow Climate Pact. Available online: https://unfccc.int/documents/310475 (accessed on 3 February 2022).
- IPCC Special Report on Global Warming of 1.5 °C. Available online: https://unfccc.int/topics/science/workstreams/cooperation-with-the-ipcc/ipcc-special-report-on-global-warming-of-15-degc (accessed on 3 February 2022).
- Japan’s 2050 Carbon Neutral Goal. Available online: https://www.meti.go.jp/english/policy/energy_environment/global_warming/roadmap/report/20201111.html (accessed on 3 February 2022).
- Pachauri, R.K.; Allen, M.R.; Barros, V.R.; Broome, J.; Cramer, W.; Christ, R.; Church, J.A.; Clarke, L.; Dahe, Q.; Dasgupta, P.; et al. IPCC: Climate Change 2014: Synthesis Report. Contribution of Working Groups I, II and III to the Fifth Assessment Report of the Intergovernmental Panel on Climate Change; Core Writing Team, Pachauri, R.K., Meyer, L.A., Eds.; IPCC: Geneva, Switzerland, 2014; 151p. [Google Scholar]
- RE100. Available online: https://www.there100.org (accessed on 3 February 2022).
- Circular Economy Action Plan. Available online: https://ec.europa.eu/environment/strategy/circular-economy-action-plan_en (accessed on 3 February 2022).
- Single-Use Plastics from European Comission. Available online: https://ec.europa.eu/environment/topics/plastics/single-use-plastics_en (accessed on 3 February 2022).
- The Plastic Resource Circulation Act from Japan Mistry of Environment. Available online: https://www.env.go.jp/recycle/plastic/pdf/14.pdf (accessed on 3 February 2022).
- Welsby, D.; Price, J.; Pye, S.; Ekins, P. Unextractable fossil fuels in a 1.5 °C world. Nature 2021, 597, 230–234. [Google Scholar] [CrossRef] [PubMed]
- Liu, J.; Yin, M.; Xia-Hou, Q.; Wang, K.; Zou, J. Comparison of sectoral low-carbon transition pathways in China under the nationally determined contribution and 2 °C targets. Renew. Sustain. Energy Rev. 2021, 149, 111336. [Google Scholar] [CrossRef]
- Davis, M.; Moronkeji, A.; Ahiduzzaman, M.; Kumar, A. Assessment of renewable energy transition pathways for a fossil fuel-dependent electricity-producing jurisdiction. Energy Sustain. Dev. 2020, 59, 243–261. [Google Scholar] [CrossRef]
- Tina, G.M.; Nicolosi, C.F. Assessment of the Impacts of Climate Change on Power Systems: The Italian Case Study. Appl. Sci. 2021, 11, 11821. [Google Scholar] [CrossRef]
- Mekonnen, T.W.; Teferi, S.T.; Kebede, F.S.; Anandarajah, G. Assessment of Impacts of Climate Change on Hydropower-Dominated Power System—The Case of Ethiopia. Appl. Sci. 2022, 12, 1954. [Google Scholar] [CrossRef]
- Rosa, L.D.; Castro, R. Forecasting and assessment of the 2030 Australian electricity mix paths towards energy transition. Energy 2020, 205, 118020. [Google Scholar] [CrossRef]
- Arioli, M.; Fulton, L.; Lah, O. Transportation Strategies for a 1.5 °C World: A Comparison of Four Countries. Transp. Res. D Transp. Environ. 2020, 87, 102526. [Google Scholar] [CrossRef]
- Bhat, A.; Garcia, J.O. Sustainability and Eu Road Transport Carbon Emissions from Consumption of Diesel and Gasoline in 2000 and 2018. Appl. Sci. 2021, 11, 7601. [Google Scholar] [CrossRef]
- Kejun, J.; Chenmin, H.; Songli, Z.; Pianpian, X.; Sha, C. Transport Scenarios for China and the Role of Electric Vehicles under Global 2 °C/1.5 °C Targets. Energy Econ. 2021, 103, 105172. [Google Scholar] [CrossRef]
- Isik, M.; Sarica, K.; Ari, I. Driving Forces of Turkey’s Transportation Sector CO2 Emissions: An LMDI Approach. Transp. Policy 2020, 97, 210–219. [Google Scholar] [CrossRef]
- Das, D.; Kalbar, P.P.; Velaga, N.R. Pathways to Decarbonize Passenger Transportation: Implications to India’s Climate Budget. J. Clean. Prod. 2021, 295, 126321. [Google Scholar] [CrossRef]
- Al-Enazi, A.; Okonkwo, E.C.; Bicer, Y.; Al-Ansari, T. A Review of Cleaner Alternative Fuels for Maritime Transportation. Energy Rep. 2021, 7, 1962–1985. [Google Scholar] [CrossRef]
- Nishiura, O.; Fujimori, S.; Oshiro, K. Economic impact and mitigation measures of reducing greenhouse gas emission in Asian countries. J. Jpn. Soc. Civ. Eng. Ser. G. 2020, 76, I_97–I_107. [Google Scholar] [CrossRef]
- Alabsi, A.A.N.; Wu, Y.; Koko, A.F.; Alshareem, K.M.; Hamed, R. Towards Climate Adaptation in Cities: Indicators of the Sustainable Climate-adaptive Urban Fabric of Traditional Cities in West Asia. Appl. Sci. 2021, 11, 10428. [Google Scholar] [CrossRef]
- Liu, L.; Tang, Y.; Chen, Y.; Zhou, X.; Bedra, K.B. Urban Sprawl and Carbon Emissions Effects in City Areas Based on System Dynamics: A Case Study of Changsha City. Appl. Sci. 2022, 12, 3244. [Google Scholar] [CrossRef]
- Pai, S.; Emmerling, J.; Drouet, L.; Zerriffi, H.; Jewell, J. Meeting well-below 2 °C target would increase energy sector jobs globally. One Earth 2021, 4, 1026–1036. [Google Scholar] [CrossRef]
- Riedl, D. The magnitude of energy transition risk embedded in fossil fuel company valuations. Heliyon 2021, 7, e08400. [Google Scholar] [CrossRef]
- Takeishi, R. Scenarios of energy transformation and evaluation of those expectations. Int. Econ. 2020, 71, 169–189. [Google Scholar] [CrossRef]
- Akimoto, K. Status of long-term energy policies in terms of climate change response measures. In Proceedings of the 28th Annual Meeting of the Energy Society of Japan, Kansai University Senriyama Campus, Suita, Japan, 7–8 August 2019; p. 28. [Google Scholar] [CrossRef]
- Hansen, T.A. Stranded assets and reduced profits: Analyzing the economic underpinnings of the fossil fuel industry’s resistance to climate stabilization. Renew. Sustain. Energy Rev. 2022, 158, 112144. [Google Scholar] [CrossRef]
- Chapman, A.; Shigetomi, Y.; Ohno, H.; McLellan, B.; Shinozaki, A. Evaluating the global impact of low-carbon energy transitions on social equity. Environ. Innov. Soc. Transit. 2021, 40, 332–347. [Google Scholar] [CrossRef]
- Cronin, J.; Hughes, N.; Tomei, J.; Couto, L.C.; Ali, M.; Kizilcec, V.; Adewole, A.; Bisaga, I.; Broad, O.; Parikh, P.; et al. Embedding justice in the 1.5 °C transition: A transdisciplinary research agenda. Renew. Sust. Energ. Trans. 2021, 1, 100001. [Google Scholar] [CrossRef]
- Japan’s Dry Ice-Makers Scramble to Meet Vaccine-Driven Demand Surge. Available online: https://www.japantimes.co.jp/news/2021/02/15/business/corporate-business/dry-ice-demand/ (accessed on 3 February 2022).
- 2019 Year Book of Mineral Resources and Petroleum Products Statistics (Petroleum) from Japan Agency of Natural Resources and Energy. Available online: https://www.meti.go.jp/statistics/tyo/sekiyuka/pdf/h2dhhpe2019k.pdf (accessed on 3 February 2022).
- 2019 Year Book of Plastic Products’ Manufacture, Disposal and Recycling from Japan Plastic Waste Management Institute. Available online: https://www.pwmi.or.jp/flow_pdf/flow2019.pdf (accessed on 3 February 2022).
- Survey on Hydrogen Supply Potential as By-product Derived from Petroleum Refinery from Mizuho Research & Technologies, Ltd. Available online: https://www.nedo.go.jp/content/100937547.pdf (accessed on 3 February 2022).
- Carbon Recycling World from Japan Carbon Recycling Fund Institute. Available online: https://carbon-recycling-fund.jp/public_relations/world/20200401 (accessed on 3 February 2022).
- Japan Industrial and Medical Gases Association. Outline of Raw Material Carbon Dioxide Production Flow (Revised JIGA-T-S/38/15); Japan Industrial and Medical Gases Association: Tokyo, Japan, 2021; 22p. [Google Scholar]
- 2019 Current Production Survey from Japan Ministry of Economy, Trade and Industry. Available online: https://www.meti.go.jp/statistics/tyo/seidou/result/ichiran/08_seidou.html (accessed on 3 February 2022).
- Strategy for Plastic Resource Circulation from Japan Ministry of Environment. Available online: https://www.env.go.jp/press/files/jp/111746.pdf (accessed on 3 February 2022).
- Plastic Raw MATERIALS production (2012–2020) from Japan Plastics Industry Federation. Available online: http://www.jpif.gr.jp/english/statistics/index.html (accessed on 3 February 2022).
- Plastic Market Size, Share & Trends Analysis Report by Product (PE, PP, PU, PVC, PET, Polystyrene, ABS, PBT, PPO, Epoxy Polymers, LCP, PC, Polyamide), by Application, by End-use, by Region, and Segment Forecasts, 2021–2028. Available online: https://www.grandviewresearch.com/industry-analysis/global-plastics-market (accessed on 3 February 2022).
- Chemical Fertilizers Global Market Report 2021: COVID-19 Impact and Recovery to 2030. Available online: https://www.researchandmarkets.com/reports/5240331/chemical-fertilizers-global-market-report-2021 (accessed on 3 February 2022).
- Global Dry Ice Market Bwc20107. Available online: https://www.blueweaveconsulting.com/report/global-dry-ice-market-bwc20107 (accessed on 20 February 2022).
- Takimoto, M. Sulphur and our life. Chem. Educ. 2014, 62, 30–33. [Google Scholar] [CrossRef]
- Tabata, T.; Hishinuma, T.; Ihara, T.; Genchi, Y. Life cycle assessment of integrated municipal solid waste management systems, taking account of climate change and landfill shortage trade-off problems. Waste Manag. Res. 2011, 29, 423–432. [Google Scholar] [CrossRef] [PubMed]
- Roadmap for Bioplastics Introduction from Japan Ministry of Environment. Available online: https://www.env.go.jp/recycle/roadmap_for_bioplastics_introduction.html (accessed on 3 February 2022).
- Roadmap for Bioplastics Introduction from Japan Ministry of Economy, Trade and Industry. Available online: https://www.meti.go.jp/shingikai/sankoshin/sangyo_gijutsu/haikibutsu_recycle/plastic_junkan_wg/pdf/008_s05_00.pdf (accessed on 3 February 2022).
- NEDO Hydrogen Energy White Paper from NEDO. Available online: https://www.nedo.go.jp/library/suiso_ne_hakusyo.html (accessed on 20 February 2022).
- Emissions from Imported Carbonated Gas from Japan Ministry of Environment. Available online: https://www.env.go.jp/earth/ondanka/ghg-mrv/methodology/material/methodology_2H3_2020.pdf (accessed on 3 February 2022).
- Petroleum Industry 2020 from Petroleum Association of Japan. Available online: https://www.paj.gr.jp/statis/data/data/2020_data.pdf (accessed on 3 February 2022).


| Products (Unit) | Material Intensity Coefficients |
|---|---|
| Plastic resin (ton/kL) | 0. 59 × 10−1 |
| Hydrogen (Nm3/kL) | 79.19 |
| Dry ice (ton/kL) | 0.89 × 10⁻³ |
| Sulfur (ton/kL) | 0.92 × 10⁻² |
| 2019 | 2020 | 2030 | 2040 | 2050 | |
|---|---|---|---|---|---|
| Petroleum treatment (thousand kL) | 177,048.00 | 171,737.00 | 126,643.00 | 93,389.00 | 68,868.00 |
| Plastic resin production (thousand ton) | 10,500.00 | 10,185.00 | 7511.00 | 5539.00 | 4084.00 |
| Hydrogen production (billion Nm3) | 14.02 | 13.60 | 10.03 | 7.40 | 5.45 |
| Hydrogen production * (billion Nm3) | 21.40 | 20.76 | 15.31 | 11.29 | 8.32 |
| Dry ice production (thousand ton) | 157.00 | 153.00 | 113.00 | 83.00 | 61.00 |
| Sulfur production (thousand ton) | 1629.00 | 1580.00 | 1165.00 | 859.00 | 634.00 |
Publisher’s Note: MDPI stays neutral with regard to jurisdictional claims in published maps and institutional affiliations. |
© 2022 by the authors. Licensee MDPI, Basel, Switzerland. This article is an open access article distributed under the terms and conditions of the Creative Commons Attribution (CC BY) license (https://creativecommons.org/licenses/by/4.0/).
Share and Cite
Matsumoto, R.; Tabata, T. Impact and Challenges of Reducing Petroleum Consumption for Decarbonization. Appl. Sci. 2022, 12, 3738. https://doi.org/10.3390/app12083738
Matsumoto R, Tabata T. Impact and Challenges of Reducing Petroleum Consumption for Decarbonization. Applied Sciences. 2022; 12(8):3738. https://doi.org/10.3390/app12083738
Chicago/Turabian StyleMatsumoto, Ryoma, and Tomohiro Tabata. 2022. "Impact and Challenges of Reducing Petroleum Consumption for Decarbonization" Applied Sciences 12, no. 8: 3738. https://doi.org/10.3390/app12083738
APA StyleMatsumoto, R., & Tabata, T. (2022). Impact and Challenges of Reducing Petroleum Consumption for Decarbonization. Applied Sciences, 12(8), 3738. https://doi.org/10.3390/app12083738