Abstract
The high confinement mode (H-mode) is considered the optimal regime for the production of energy through nuclear fusion for industrial purposes since it allows to increase the energy confinement time of the plasma roughly by a factor of two. Consequently, it has been selected at the moment as the standard scenario for the next generation of devices, such as ITER. However, pressure-driven edge instabilities, known as edge localized modes (ELMs), are a distinct feature of this plasma regime. Their extrapolated thermal and particle peak loads on the plasma-facing components (PFC) of the next generation of devices are expected to be so high as to damage such structures, compromising the normal operations of the reactors themselves. Consequently, the induced loads have to be controlled; this can be achieved by mitigating ELMs. A possibility then lays in increasing the ELMs frequency to lower the loads on the PFCs. As already demonstrated at JET, the pellet pacing of ELMs is considered one of the most promising techniques for such scope, and its optimization is therefore of great interest for present and future operations of nuclear fusion facilities. In this work, we suggest a method to access primary pieces of information to perform statistics, assess and characterize the pacing efficiency. The method, tested on JET data, is based on the clustering (k-means) of convoluted signals, using so-called spectrogram cross-correlation, between the measured pellets and ELMs time traces. Results have also been obtained by taking advantage of a new type of diagnostic for measuring the ELMs dynamic, based on synthetic diamond sensors, faster than the standard spectroscopic cameras used at JET.
1. Introduction
The demonstration of nuclear fusion as a sustainable, efficient, and abundant energy source requires high-performance thermonuclear plasmas. Today, the high-confinement mode (H-mode) is considered the best regime to produce fusion energy, since the energy confinement time is enhanced by roughly a factor of two with reference to the so-called low-confinement mode (L-mode) [1]. In H-mode, a transport barrier is formed at the edge of the plasma, creating strong gradients in the pedestal region allowing to achieve higher core temperatures, densities, and pressures, facilitating the ignition condition. However, several problems arise in such a mode, including core impurity accumulation, ash poisoning, and plasma instabilities such as the edge localized modes (ELMs).
ELMs are pressure-driven instabilities, appearing as radial plasma bursts hitting the first wall, mostly induced by the fact that the electron density exceeds a threshold value [1,2,3]. During an ELM, the pedestal pressure gradient collapses to a lower value in a few hundred microseconds before recovering, inducing the expulsion of a considerable amount of particles and energy [4,5,6].
The energy and the particle flux released during an ELM involves high loads on the PFC. Some ELM extrapolations for ITER suggest that the energy loss during large ELMs (so-called type-I ELMs) ranges from 5 to 22 MJ and that about half of this energy will be deposited in a region of about one square meter, involving a surface energy density that ranges from 2.5 to 11 MJ m−2. Such loads are 5–20 times higher than any acceptable values for the PFC [3].
Since future tokamaks will not be able to resist natural ELM loads, strategies to suppress or mitigate their occurrence are being investigated. In general, the types of countermeasures are divided into three approaches: radiating dispersion, ELM suppression, and ELM mitigation and control. The first approach, the radiating dispersion, aims at decreasing the inter-ELM heat loads onto the divertor by using gas seeding. The requirements for the radiated fraction (radiated power over the total output power) are quite stringent, 50% for ITER [7] and 90% for DEMO [8] and at ITER such approach is still under study. ELM suppression is instead based on the stabilisation of the ELM instability by avoiding reaching the boundaries of the peeling–ballooning ELM stability limit, and at ITER, it has been planned to perform it using resonant magnetic perturbation [9]. Finally, the mitigation and control of ELMs intends to trigger ELMs to drive their frequency in order to decrease the peak loads. In fact, large energy ELMs, the so-called type-I ELMs, are characterised by an inverse proportionality between loads and frequency: the higher the ELM frequency, the lower the energy released by a single ELM. Therefore, the main idea of ELM control is to trigger ELMs with a high frequency in order to reduce the peak loads on the PFC. Different approaches have been tested: vertical kicks [10,11,12], resonant magnetic perturbations [13,14,15], and pellet pace-making [15,16,17,18,19].
The pellet pacing technique is based on injecting a frozen pellet, usually made up of Deuterium, into the plasma. Such an approach has been investigated in ASDEX-Upgrade, JET, DIII-D, and EAST, and it is considered one of the most relevant tools for ITER ELM control [15,16,17,18,19]; at the same time, the physics of pellet pacing has been mostly analysed through the non-linear MHD code called JOREK [20,21,22,23]. The pellet injection induces a significant variation in the pressure profile at the edge of the plasma and alters the magnetic topology by causing a strong growth of a chain of modes which facilitate the occurrence of ELMs [24]. Therefore, the inter-ELM elapsing time interval decreases, allowing the control of their frequency. On ASDEX-Upgrade, it has been observed that the time needed by a pellet to trigger an ELM is less than 200 µs [25], while numerical simulations with JOREK found, for the JET tokamak, a triggering time around 270 µs [22].
From a practical point of view, the assessment of ELM pacing efficiency is of great relevance. Understanding when a pellet has triggered an ELM or not is a key piece of information to develop optimised pacing strategies, especially for future tokamaks. As will be discussed in Section 2, such an assessment is not an easy task because of the presence of both natural and triggered ELMs. Consequently, to identify whether an ELM was triggered by a paced pellet or not, and which pellet triggered, or not, an ELM statistical approach such as unsupervised methods is required [26,27,28].
This work aims at presenting a new method for the assessment of triggering efficiency by combining a convolution-based approach of spectrogram cross-correlation (SPCC) [29] with the use of unsupervised machine learning. The algorithm has been tested on JET data. Section 2 is dedicated to the description of the diagnostics used, while Section 3 presents the method developed to perform the triggering assessment. Section 4 shows the application of the method on real data and discusses the capabilities of this new approach. The last section closes the paper with a discussion and conclusion of the found results.
2. Diagnostics
The main diagnostics used for the purposes of this work are briefly described in this section. The next generation of devices, such as ITER, will face a relevant increase in the neutron fluxes, ranging from similar to present ones at JET, of the order of 1015 n/s in pure Deuterium plasmas, up to 1021 n/s in standard Deuterium–Tritium ones. In such a harsh environment, most of the diagnostics used in present reactors will not be able to operate; therefore, alternatives must be found. Diamond-based detectors are one possibility, both because of their endurance to high neutron fluxes and their broadband responsivity [30,31]. Since 2007, two diamond detectors for VUV and Soft X-ray measurements have been installed at JET [30] to investigate their potentialities, and more recently on the FTU machine [31,32]. This is the reason why in the following, data collected by the UV diamond detector are shown for the first time in comparison with data from the spectroscopic cameras at JET measuring the ELM fingerprints in Be II emission line. In this section, the pellet injector diagnostic is shortly described, as well as the spectroscopic cameras currently used at JET to determine the occurrence of an ELM, and the UV diamond detector.
2.1. JET Pellet Injection and Pellet Monitoring System
The JET pellet injection is a pneumatic-based propulsion injector able to shoot either hydrogen or deuterium pellets. The system can be used for fuelling or pacing [33,34]. The size of fuelling deuterium pellets ranges from 8 mg to 12 mg, while pacing pellets range from 0.47 mg to 0.69 mg (before pulse 93000) and from 0.86 mg to 1.23 mg thereafter. Before 2015, the pellets could be injected from two different locations: either the equatorial low field side (LFS) region or the vertical high field side (VHFS) one. Due to the higher ELMs triggering efficiency of the VHFS [27], after 2015, the LFS has been dismissed. At the moment, the maxima injection frequencies from such a launcher are 50 Hz for pacing pellets and 15 Hz for fuelling ones [27]. This work has been conducted with pulses performed after 2015. On the VHFS, the pellets are monitored from the injector to the vacuum vessel with three microwave cavities (MW02, MW03, MW05) and one pellet-monitor system (Figure 1) [18]. The monitor system is used to detect the pellet just before it enters the vacuum vessel, and for this reason, being the most reliable fingerprint for the actual arrival of a pellet into the plasma, it has been used as the reference signal to perform the analysis in this work. However, it also has to be stated that about 10–20% of the pellets exiting the duct are not detected by the monitor system and that the amplitude of the measured signal is not strongly correlated with the pellet size [27]. The pellet monitor signal in the pulse 92238 is shown in Figure 2 (bottom plots).
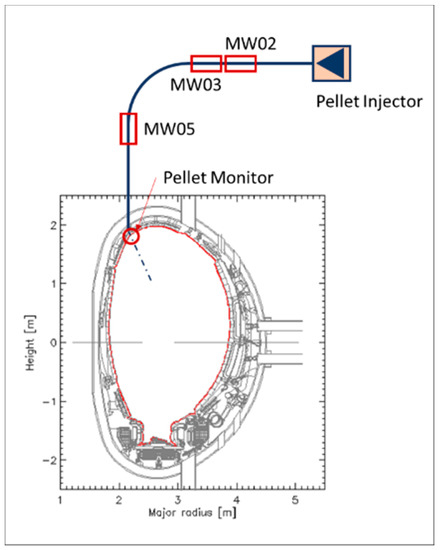
Figure 1.
Pellet injection schematics (configuration post-2015).
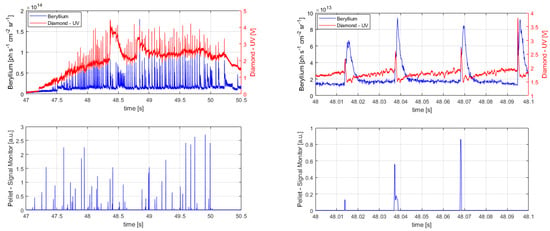
Figure 2.
Shot 92238. In the first column, the ELM signals (top plot, beryllium in blue and diamond UV in red) and the pellet signal (bottom plot) are shown along the discharge (then, plasma disrupts). Second column shows a detail of the same signals for 48.0 s < t < 48.1 s.
2.2. Beryllium Spectroscopy
The beryllium line (Be II, λ = 527 nm) is a visible spectroscopic diagnostic [35] based on a photomultiplier tube (PMT) with a narrow band pass filter (around 2 nm). At JET, there are two Be II lines of sight, looking, respectively, at the inner and outer parts of the divertor. The sampling rate of the diagnostics is 10 kHz. The Be II is the most common diagnostic used to detect and analyse ELMs at JET considering the ITER-like wall installation. In the Be signals, the ELMs are characterised by narrow and high pulses, as it is shown by the blue lines of the top plots of Figure 2. Such a diagnostic is, however, sensitive to other atomic physical processes characterizing the SOL that cannot be separated when characterizing the shape of the ELMs.
2.3. Diamond UV Sensor
The UV diamond detector is a chemical vapour deposition (CVD) single crystal diamond (SCD) detector in a metal/intrinsic/boron doped configuration, placed outside the biological shielding wall, at 19 m from the plasma vessel. Its line of sight crosses the core of the plasma on the midplane at an angle, as shown in Figure 3. The sampling rate is 200 kHz, i.e., 20 times faster than spectroscopy. The emission of ELMs in the UV region and the high speed of these detectors make them suitable for accurate spectrogram analyses, as it will be discussed in the next sections, allowing better time-resolved information [36,37]. The diamond sensitivity ranges from about 10 eV (225 nm) to a few keV and, since the actual line of sight of the diagnostic runs through the main plasma, this diagnostic can also detect phenomena characterizing the core of the plasma. The signal of UV in the pulse 92238 is described by the red line in the top plots of Figure 2.
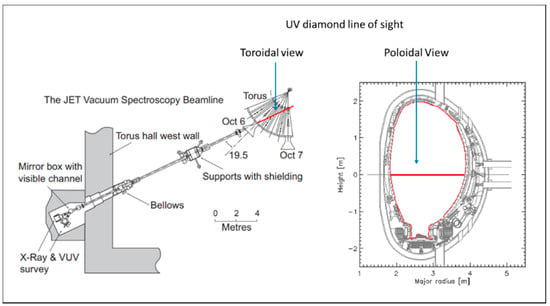
Figure 3.
UV diamond line of sight.
3. Methodology
The assessment of ELM triggering by pellets is a typical problem where it is not possible to apply supervised methods. From now on, the pellet monitor signal is indicated as x(t), while the ELM signal (Be II or UV diamond) is y(t). Both pellets and ELMs are characterized on their respective signals by rapid pulses. Such features usually appear as rapid increases of the signals followed by slower decays to their base value of the type shown in Figure 4a. The purpose of the method is to determine whether the pulse x(t) at the time instance ti has triggered the pulse y(t) at the time ti + Δttrig, with the “triggering time” Δttrig > 0. This goal is achieved by three main steps:
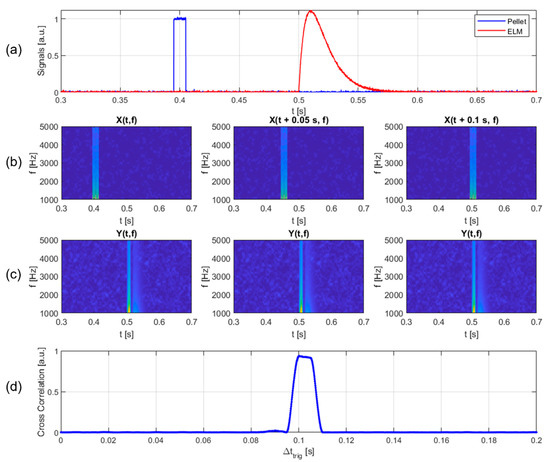
Figure 4.
Numerical example of spectrogram cross-correlation profile calculation. The top image represents two numerical pulses (a), the pellet one simulated by a Delta’s Dirac and the ELM one. The second row (b) shows the spectrogram of the pellet pulse shifted at three different times (), 0 s, 0.05 s and 0.1 s, respectively, while the third row(c) shows the ELM spectrogram (unshifted). The last row (d) represents the cross-correlation between pellet and ELM as a function of the time shift, and a maximum is obtained for the actual value (0.1 s).
- ELMs’ and pellets’ peaks detection (Section 3.1).
- Spectrogram cross-correlation (SPCC) (Section 3.2).
- Clustering of the SPCC signals (Section 3.3).
3.1. ELMs’ and Pellet’ Peaks Detection
The first step is necessary to define when ELMs occur and when pellets reach the plasma. The scope is achieved through a peak detection algorithm [38]. For pellets, the minimum amplitude considered is set to be 0.05 V, and two peaks are considered resolved if two consecutive pellets’ centroids are more distant than one over ten times the expected pellet frequency. For the ELM detection, the ELM time locations detected by Be II has also been used for the UV data. While the optimal minimum width of the peak proved to be 0.5 ms, the minimum peak height had to be set on a pulse-by-pulse basis in order to ensure that all the ELMs were correctly detected and spurious peaks not considered. Indeed, there are pulses for which the background, not related to the ELM events, changes in amplitude because of different physical mechanisms involved and detected in any case by the diagnostics; consequently, the peak height must be adjusted accordingly to perform a correct analysis.
3.2. Spectrogram Cross-Correlation
Once the ELM and pellet time locations have been found, a criterion to determine if a pellet triggered an ELM is needed. In this work, the spectrogram cross-correlation (SPCC) method has been used [20]. For each detected ELM, the calculation of the SPCC signal as a function of the time delay is performed as described in the following. Considering the i-th ELM located at the time ti, the local spectrogram of the ELM and the pellets are calculated as follows:
where and are the backward and upward time windows used to calculate the spectrogram, and is the total spectrogram window. The values of the backward and upward time windows must be set to ensure that most of the relevant features are calculated in the frequency domain. In this work, is 400 µs and is 100 µs, leading to a total spectrogram window of 500 µs (and thus, the minimum spectrogram frequency is 2 kHz). A numerical example of such spectrograms is reported in Figure 4b for the pellet and in Figure 4c for the ELM-like structure.
Then, the cross-correlation between the two spectrograms is computed as a function of :
where is the complex conjugate of , and fstart and fend are, respectively, the minimum and maximum frequency of the spectrogram. The SPCC is performed in a time window ranging from to , where and must be large enough to ensure that the most important features are considered in the cross-correlation (in this work, is 3 ms and is 1 ms). Figure 4d shows an example (by using synthetic signals) of spectrogram cross-correlation as a function of to illustrate the method. In this example, the pellet is placed 0.1 s before the ELM; therefore, the maximum P is obtained for equal to 0.1 s.
The presence of a peak in the spectrogram cross-correlation does not demonstrate that the pellet triggered the ELM, but just that the time distance between the two events is that value. The assessment of ELM triggering must be performed by a statistical assumption, i.e., that the SPCC of triggered ELMs should be statistically similar, with maxima located at comparable values, while natural ELMs are expected to have SPCC profiles without prominent peaks or with peaks located at random positions. In order to separate the two classes of SPCC profiles, a k-means clustering approach has been used as described in the next section.
3.3. Clustering of the SPCC Signals
The k-means is an unsupervised clustering algorithm that aims at partitioning n observations into k clusters [39,40,41]. The algorithm clusters the data minimising the distance between observations belonging to the same clusters and maximizing the distance between the cluster centroids. The number of clusters must be set by the user, but if they are not known a priori, a parametric analysis can be performed, and the best clustering can be chosen. Several distance types can be performed in k-means analysis. The distance used here is Cityblock (where the distance between the point i and the point j is defined as ) [42], since it provides higher stability, but comparable results have been obtained also with squared Euclidian distance [40]. Since the results are affected by the first guess clusters (especially for challenging problems), the clustering analysis can be performed multiple times and the most frequent result is taken. Figure 5 shows an illustrative example of k-means clustering, where un-classified data are separated into two clusters, according to variable 1 and variable 2. In general, the k-means can perform the clustering using any number of variables, and it can find from 1 to k number of clusters, where k must be smaller than the number of observations N. In this work, the number of expected clusters is two, natural and triggered ELMs, while the variables are the SPCC values at each analysed time delay.
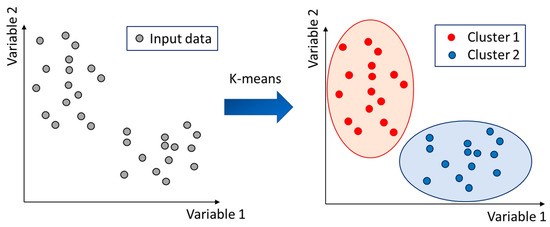
Figure 5.
Illustrative example of k-means algorithm. In left graph, data are un-clustered and each point may belong to the cluster 1 or 2. In the right graph, the k-means clustered the data minimising the “within” distance and maximising the cluster centroid distance.
Even if it is an unlikely event, the possibility has to be considered that pellets do not trigger any ELM. In this case, the correct number of clusters is one (natural ELMs), while the k-means searches for two clusters. In order to solve this problem, an indicator that quantify the clustering quality has been used. Suppose to have N observations (in this work, N SPCCs) described by M features (in this work, one feature is the SPCC value at one time delay) and suppose that the data are clustered in two, k1 and k2. The first cluster will have a number of observations Nk1, while the second cluster Nk2. This indicator is based on comparing the variance of the un-clustered data:
with the sum of the variances of the two clusters:
Thus, the indicator used to evaluate the quality of the cluster is:
This indicator highlights the relative change of the variance value when data are clustered. If the two clusters are separated, the Kscore is bigger than one; otherwise, it tends to one. The higher the Kscore is, the lower the uncertainty that the separation in two clusters is misleading.
4. Application to Data
The methodology just described was applied to JET experimental data. Specifically, a step-by-step application has been followed on a test pulse, the 92238 one, and described in Section 4.1. Then, the same method has been applied to other discharges characterized by either standard operational plasma parameters or unusually higher ones, such as very high plasma current and high external additional heating power and the results summarized in Table 1.

Table 1.
Pulses analysed with the SPCC clustering method.
4.1. Testing the Methodology on a Reference Pulse: The 92238 Case
Figure 2 shows the signals for ELMs (from the beryllium and the diamond UV diagnostics) and pellets (pellet monitor signal) during the pulse current flat top phase (left pair of plots), and in a small-time window (for 48.0 s < t < 48.1 s, right pair of plots). It can be observed that ELMs appear as large and fast pulses on the Be signal and can be easily detected (especially type-I ELMs).
In the case of the UV diamond, since the sensor line of sight was not optimised for looking at the edge of the plasma, the signal might be affected also by different radiation phenomena unrelated to the ELM. In order to minimise the influence of such spurious signals, a moving median subtraction has been applied to the UV diamond time trace. The Pellet monitor signal is characterised by narrow peaks indicating the crossing of Pellets.
Figure 6 shows the ELMs and pellets events detected using the peak detection algorithm on the ELM and pellet signals, respectively. Considering the time window from 47.5 s to 50.5 s, 114 ELMs and 59 pellets have been detected, involving an average measured frequency of 38.0 Hz and 19.7 Hz, respectively.
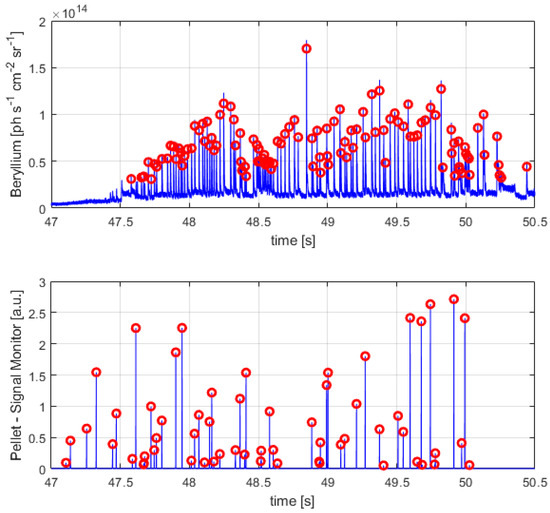
Figure 6.
Pulse 92238. ELM signals with detected ELMs (top) and pellet monitor signals with detected Pellets (bottom) using the peak detection algorithm.
The SPCC profiles calculated for each ELM are shown in Figure 7a using the beryllium line (left) and the diamond UV (right).
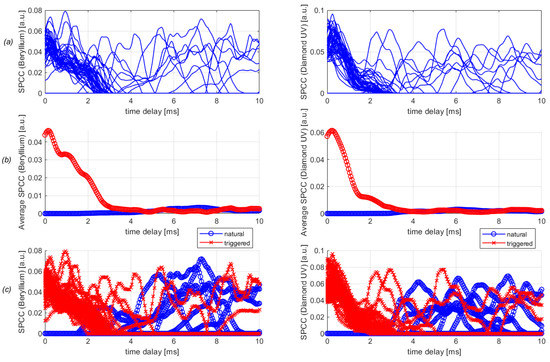
Figure 7.
Top row (a): SPCC profiles (left using beryllium line, right using diamond UV) of the 114 detected ELMs. Middle row (b): average SPCC profile; bottom row (c): clustered SPCC profiles using the k-means algorithm.
By using the k-means, the profiles are clustered into two main groups. Then, the average SPCC profile of the two groups is calculated (Figure 7b) and labelled according to the physical expectations for each cluster. In fact, in the case of natural ELMs, the profile is expected to be flat with a small average value on, while for triggered ELMs, the SPCC should be peaked and have a higher amplitude feature, as shown. In Figure 7c, all the ELM SPCC profiles are represented with their class.
A clear separation is observed for time delays from 0.0 ms to 1.5 ms, while for higher time delays, sometimes high cross-correlation is observed for both classes, due to a fortuitous presence of a pellet before the considered ELM. For consistency, the approximate probability of finding a spurious peak for a time delay from 2 ms to 10 ms was calculated for natural ELMs in the following way.
For a pellet frequency fpellet and a time delay range , the number of pellets expected in the range is ; therefore, the expected number of spurious SPCC peaks is . In this pulse, the pellet frequency is around 20 Hz, the delay time window is 10 ms and the number of natural ELMs is 70. Therefore, the expected number of spurious SPCC peaks is 11.2 ± 6.1 (95% CI), in line with the value found through the analysis (8). In similar ways, one may calculate the number of expected false positives (i.e., the number of natural ELMs classified as triggered). The analysis clearly shows that triggered ELMs have a SPCC peak between 0 ms and 1 ms. The probability that a natural ELM has a peak in this time window is 2.0% ± 3.4% (95% CI), which means 1.4 ± 2.4 (95% CI) false positives for the present shot.
The analysis on shot 92238 returned that 70 of 114 ELMs are natural, while 44 were triggered. Thus, the triggered ELM percentage is 38.6%, while the triggering pellet percentage is 74.58% (44/59). The accordance between the beryllium line and diamond UV analyses is 100% (all the ELMs have been classified in the same way). The Kscore is 1.83 for beryllium line analysis and 1.97 for diamond UV, suggesting that the cluster quality is quite high.
A specificity analysis has been performed to test the capability of the algorithm to avoid false triggered ELMs. Basically, the triggering assessment analysis has been done between the ELM signals of pulse 92237 and the pellet signal of pulse 92238 (Figure 8). In this case, of course, we should have that none of the pellets has triggered an ELM.
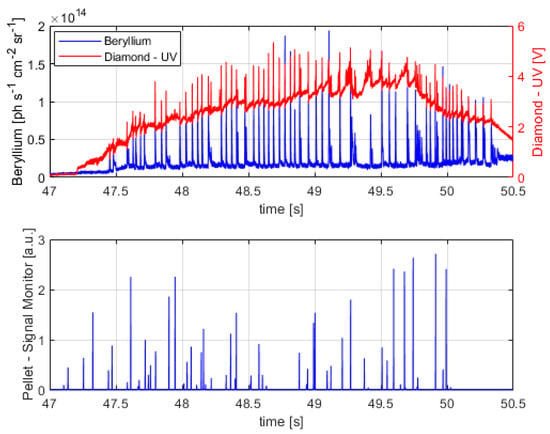
Figure 8.
The ELM signals of shot 92237 (top plot, beryllium in blue and diamond UV in red) and the pellet signal of shot 92238 (bottom plot) used for the specificity analysis.
By performing the SPCC, the profiles in Figure 9 can be obtained. Contrary to the pulse 92238, there are no statistical peak locations, and they are homogeneously distributed on the time window. The SPCC peaks are due to fortuitous correlations. The number of ELM is 84 (all to be considered untriggered by the pellets), the number of ELMs with SPCC peaks is 13, while the expected number due to fortuitous correlation is 16.8 ± 7.3 (95% CI). The k-means returns a Kscore below one for both ELM signals (0.90 for beryllium and 0.98 for diamond UV), involving that a separation in two clusters is not statistically significant and would worsen the analysis. Therefore, the presence of ELMs triggered by pellets must be excluded and a unique cluster of untriggered or natural ELMs emerges.
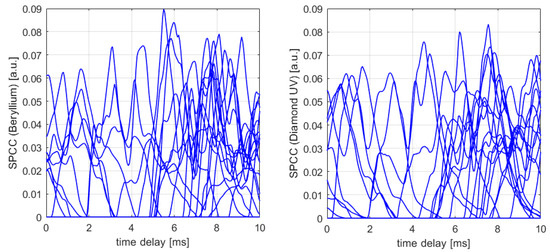
Figure 9.
SPCC profiles (left using beryllium line, right using diamond UV) of the detected ELMs of shot 92237 correlated with the pellet of shot 92238.
Considering the test pulse 92238, then, once the SPCC profiles have been clustered, it is possible to obtain further pieces of information by the analysis of the clusters, i.e., to evaluate the mean value and the standard deviation for both classes.
The differences between natural (blue for beryllium, light blue for diamond UV) and triggered (red for beryllium and purple for diamond UV) ELMs are highlighted in Figure 10. Triggered ELMs have high SPCC values for time delay smaller than 2 ms, with a maximum value located at 200 µs for the beryllium line and 250 µs for the diamond UV diagnostics, while for time delays higher than 2 ms, the triggered SPCCs converge to the natural ones, indicating that those time delays do not provide any piece of information for the triggering assessment. It must be noted that the beryllium line SPCC is affected by two local maxima smaller than the diamond UV one. This difference, even if small, suggests that the diamond UV may return more accurate values, especially for difficult pulses. This improved information can be due to two main reasons: (a) the time resolutions of the two diagnostics are different (beryllium line is 100 µs, while diamond UV is 5 µs); (b) the shape of a typical ELM on the Be II signal is wider than the diamond UV.
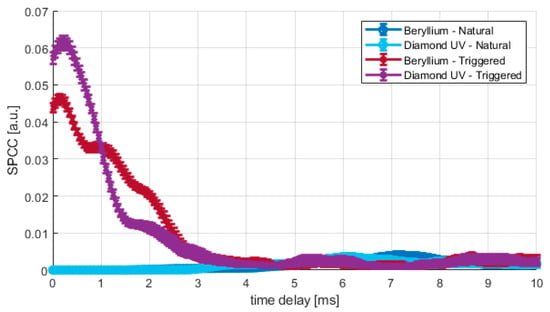
Figure 10.
Average SPCC profile of natural and triggered ELMs for shot 92238 using beryllium line and diamond UV diagnostics.
The statistical analysis of triggering times can be performed by calculating the time delays at which a maximum SPCC is observed for each triggered ELM (). The Be line diagnostic returns an average (median) triggering time of 250 µs (175 µs) with a standard deviation of 37 µs, while the UV diagnostics returns an average (median) of 280 µs (250 µs) with a standard deviation of 18 µs.
The results of the two analyses are mostly in accordance, and the average value is comparable with the JOREK numerical simulations reported in literature [26], where the authors found a triggering time (from the pellet injection to the ELM triggering) of about 270 µs.
It is worth discussing the sources of uncertainty that may affect the results. The first limit on the time resolution is the sampling rate of the diagnostics: the beryllium has a sampling rate of 10 kHz (, the diamond UV of 200 kHz (), and the pellet signal monitor is at 1 MHz (). Therefore, the time resolution limit due to the diagnostic sampling rate is about 100 µs for the beryllium-based analysis and 6 µs for the diamond-UV analysis. Moreover, a decrease in the time resolution is due to the spectrogram calculation, which is performed in a specific time window (see Section 2.3).
For the sake of completeness, the reference assumptions of time delay in the present analysis also have to be clarified. In the case of Be spectroscopy, the signal is often characterised by two maxima, one very close to the rising edge, and a second one situated from 1 ms to 2 ms after it, as shown in Figure 11a. The second peak is also usually higher than the first. The edge-peak distance also proves not to be constant. Its distribution spans from a delay of 0.8 ms to 2.4 ms, involving that an analysis based on peak-to-peak distance would be affected by significant uncertainty on the triggering time that would vary from about 1 ms to 3 ms [18]. Instead, the rising edges of the signals have been considered to perform all the statistics since they are not affected by this type of uncertainty.
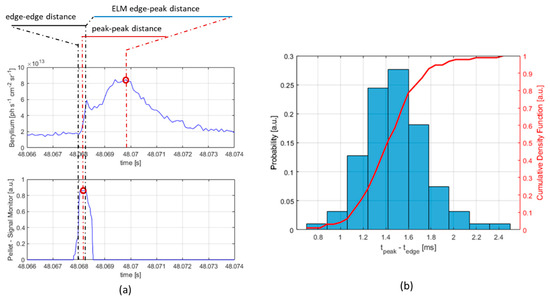
Figure 11.
Reference distances for triggering time analysis (a). Edge–peak distance analysis of ELMs using the beryllium line diagnostic (b) for all the 114 ELMs of the pulse in the time window considered.
4.2. Testing on Discharges with Different Plasma Parameters
The same analyses have been performed on a restricted set of pulses with either high current and high external heating, or standard operational plasma current and external heating power, as reported in Table 1. It has to be stated that the pulses here considered were conducted with pellets having the same injection conditions such as the pellet diameter and length (2 cm) and requested frequency (35 Hz) with the exception of the 96713 pulse for which a slightly higher frequency had been set (45 Hz). Such difference, however, has not influenced the results obtained with reference to the other pulses analysed.
The last column of the table shows the pellet triggering efficiency, i.e., the number of triggering pellets divided by the total number of pellets. The triggering efficiency reported seems to drop for pulses with higher plasma currents, i.e., with more than ~3.5 MA, but this conclusion is slightly deceitful because the values reported are based on the optimal selection of the threshold for the peak detection of the ELMs signals. High plasma current pulses indeed show different typologies of ELMs, including compound ones for which multiple peaks are observed. Consequently, lowering the threshold for the peak detection, the triggering efficiency for such pulses rises to the values obtained for low plasma current, but a proper justification for such choice would require a deeper analysis of the edge physics involved for the different ELM dynamic observed that, while being an interesting subject for further studies, goes far beyond the scope of this contribution.
Taking into consideration the definition given above of the triggering efficiency, the estimates reported in Table 1 do not change even considering the percentage of pellets not detected by the pellet local monitor, as specified in Section 2.1 (up to a 20%). On the other hand, it should be stressed that the number of triggered ELMs is, however, underestimated when such missing pellets are not considered. Getting down into the details, the percentage of underestimation of triggered ELMs would in fact be:
The triggering times of the pellet-paced ELMs measured by the diamond UV and the beryllium line are reported in Figure 12; also, for the pulses considered in this section, such estimates are in line with JOREK prediction [26]. It can be observed that all the pulses, considering their uncertainties, provide the similar values, suggesting that the average triggering time is not affected by the plasma parameters and that this new method is extremely robust, since it returns the same results in different conditions. However, it has to be stressed how the mean estimates from the diamond UV detector are more in line with the numerical simulations [26] with reference to the beryllium line, highlighting the quality and importance of the measurements of such diagnostics.
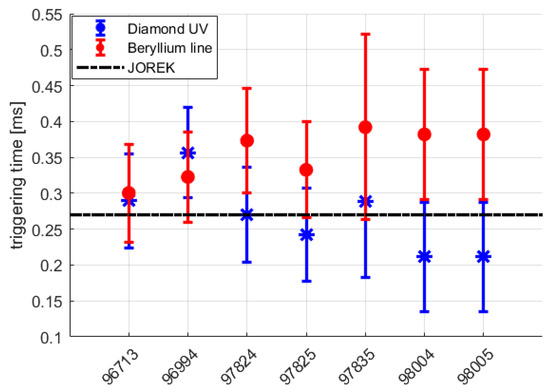
Figure 12.
Average triggering time using diamond sensor and beryllium spectroscopy. The black line reports the expected triggering time window with JOREK [17]. As it can be seen, even in different physical scenarios, the estimates are compatible, but the diamond UV detector’s ones have averages more in line with numerical estimates.
5. Conclusions
This work presents a new methodology to evaluate the efficiency of ELM pacing by pellets. The type of analysis is “by pulse”, so it does not require a reference pulse to be performed. It combines the spectrogram cross-correlation technique with the unsupervised k-means approach to statistically assess: (a) if during a plasma pulse there are triggered ELMs or not, (b) which ELM was triggered, (c) which pellet actually triggered an ELM, (d) the triggering efficiency in both terms of percentage of triggered ELMs and percentage of triggering pellets, and (e) the triggering time delay. The analysis of the spectrogram cross-correlation signals of each triggered ELM indeed allows to calculate the triggering time distribution, i.e., the time delay between a triggering pellet and the triggered ELM in terms of rising edges of the signals. The results are in line with the ones calculated by the numerical simulations [26], even in very different plasma scenarios, and confirm the importance of the pellets pacing technique to trigger ELMs, as demonstrated empirically at JET [27,43]. Furthermore, the statistical results obtained in this contribution confirm the efficiency of the pellets technique for pacing ELMs. The suggested methodology is expected to have several outcomes in ELM studies. In fact, the capability of classifying which ELM has been triggered and which pellet triggered an ELM is a precious piece of information to tune the pacing experiment, i.e., to optimize the ELM pacing. However, further analysis is suggested to improve the performances, that in this study reach, in any case, the upper limit of 73%. The methodology shown here can be in fact be used to select the not-triggered ELMs and consequently, to consider in more detail in future studies, the physical causes of their behaviour.
The paper also highlights the importance of the UV diamond sensor as a possible diagnostic for ELM tracking. The results obtained with this diagnostic are comparable to the Be spectroscopy one. Indeed, both found the same triggered ELMs, the same triggering efficiency, the same triggering pellets, and comparable triggering times within the estimated uncertainties. However, the diamond detector provides estimates more in line with the expectation [26] as Figure 12 reports, even with very different plasma conditions, as can be expected by considering the different physical phenomena occurring at the edge in the main region and those affecting the spectroscopic signal in the divertor. In particular, the average SPCC signals of the triggered ELM are more peaked in the case of a diamond sensor, as Figure 10 shows, while the signal in the case of the Be line, is characterised by both a wider peak and a second local maximum. This feature implies that the calculation of the triggering time is less accurate for the Be-based signal, as confirmed by the smaller standard deviation of the triggering time calculated with the diamond sensor. All these elements suggest that diamond sensors are good candidates for ELM detection and analysis. Despite the results obtained, it is also worth underlining that the line of sight and the signal amplification of the diamond sensor is not optimised for looking at ELMs.
Author Contributions
Conceptualization, R.R. and E.P.; data curation, F.B., P.G., M.G., M.M. and G.V.R.; formal analysis, R.R., S.C. and E.P.; funding acquisition, P.G. and M.M.; investigation, R.R., S.C., F.B., P.G., M.G., M.M., G.V.R. and E.P.; methodology, R.R. and E.P.; project administration, P.G. and M.M.; software, R.R.; supervision, E.P.; visualization, R.R. and S.C.; writing—original draft, R.R. and E.P.; writing—review and editing, R.R., S.C., F.B., P.G., M.G., M.M., G.V.R. and E.P. All authors have read and agreed to the published version of the manuscript.
Funding
This work has been carried out within the framework of the EUROfusion Consortium and has received funding from the EURATOM research and training programme 2014–2018 and 2019–2020 under grant agreement No. 633053. The views and opinions expressed herein do not necessarily reflect those of the European Commission.
Institutional Review Board Statement
Not applicable.
Informed Consent Statement
Not applicable.
Data Availability Statement
The data that support the findings of this study are available upon reasonable request from the authors.
Acknowledgments
The authors are grateful to Luca Garzotti for the fruitful interactions aimed at placing this work in the proper framework of interest. JET Contributors: See the author list of “Overview of JET results for optimising ITER operation” by J. Mailloux et al. to be published in Nuclear Fusion Special issue: Overview and Summary Papers from the 28th Fusion Energy Conference (Nice, France, 10–15 May 2021).
Conflicts of Interest
The authors declare no conflict of interest.
References
- Wagner, F.; Becker, G.; Behringer, K.; Campbell, D.; Eberhagen, A.; Engelhardt, W.; Fussmann, G.; Gehre, O.; Gernhardt, J.; Gierke, G.V.; et al. Regime of Improved Confinement and High Beta in Neutral-Beam-Heated Divertor Discharges of the ASDEX Tokamak. Phys. Rev. Lett. 1982, 49, 1408–1412. [Google Scholar] [CrossRef]
- Connor, J.W. Edge-localized modes—Physics and theory. Plasma Phys. Control. Fusion 1998, 40, 531–542. [Google Scholar] [CrossRef]
- Igochine, V. Active Control of Magneto-hydrodynamic Instabilities in Hot Plasmas; Springer: Berlin/Heidelberg, Germany, 2015; Volume 83. [Google Scholar]
- Zohm, H. Edge localized modes (ELMs). Plasma Phys. Control. Fusion 1996, 38, 105–128. [Google Scholar] [CrossRef]
- Hill, D. A review of ELMs in divertor tokamaks. J. Nucl. Mater. 1997, 241–243, 182–198. [Google Scholar] [CrossRef]
- Leonard, A.W. Edge-localized-modes in tokamaks. Phys. Plasmas 2014, 21, 090501. [Google Scholar] [CrossRef]
- Shimada, M.; Campbell, D.J.; Mukhovatov, V.; Fujiwara, M.; Kirneva, N.; Lackner, K.; Nagami, M.; Pustovitov, V.D.; Uckan, N.; Wesley, J.; et al. Chapter 1: Overview and summary. Nucl. Fusion 2007, 47, S1–S17. [Google Scholar] [CrossRef]
- Tobita, K.; Nishio, S.; Enoeda, M.; Kawashima, H.; Kurita, G.; Tanigawa, H.; Nakamura, H.; Honda, M.; Saito, A.; Sato, S.; et al. Compact DEMO, SlimCS: Design progress and issues. Nucl. Fusion 2009, 49, 075029. [Google Scholar] [CrossRef]
- Wade, M. Physics and engineering issues associated with edge localized mode control in ITER. Fusion Eng. Des. 2009, 84, 178–185. [Google Scholar] [CrossRef]
- Lang, P.T.; Degeling, A.W.; Lister, J.B.; Martin, Y.R.; Mc Carthy, P.J.; Sips, A.C.C.; Suttrop, W.; Conway, G.D.; Fattorini, L.; Gruber, O.; et al. Frequency control of type-I ELMs by magnetic triggering in ASDEX Upgrade. Plasma Phys. Control. Fusion 2004, 46, L31–L39. [Google Scholar] [CrossRef]
- Gerhardt, S.P.; Ahn, J.W.; Canik, J.; Maingi, R.; Bell, R.; Gates, D.; Goldston, R.; Hawryluk, R.; Le Blanc, B.P.; Menard, J.; et al. First observation of ELM pacing with vertical jogs in a spherical torus. Nucl. Fusion 2010, 50, 064015. [Google Scholar] [CrossRef]
- De La Luna, E.; Chapman, I.; Rimini, F.; Lomas, P.; Saibene, G.; Koechl, F.; Sartori, R.; Saarelma, S.; Albanese, R.; Flanagan, J.; et al. Understanding the physics of ELM pacing via vertical kicks in JET in view of ITER. Nucl. Fusion 2015, 56, 026001. [Google Scholar] [CrossRef]
- Kirk, A.; Nardon, E.; Akers, R.; Becoulet, M.; De Temmerman, G.; Dudson, B.; Hnat, B.; Liu, Y.; Martin, R.; Tamain, P.; et al. Resonant magnetic perturbation experiments on MAST using external and internal coils for ELM control. Nucl. Fusion 2010, 50, 034008. [Google Scholar] [CrossRef]
- Canik, J.; Maingi, R.; Evans, T.; Bell, R.; Gerhardt, S.; Kugel, H.; Leblanc, B.; Manickam, J.; Menard, J.; Osborne, T.; et al. ELM destabilization by externally applied non-axisymmetric magnetic perturbations in NSTX. Nucl. Fusion 2010, 50, 034012. [Google Scholar] [CrossRef]
- Fenstermacher, M.E.; Evans, T.E.; Osborne, T.H.; Schaffer, M.J.; Aldan, M.P.; Degrassie, J.S.; Gohil, P.; Joseph, I.; Moyer, R.A.; Snyder, P.B.; et al. Effect of island overlap on edge localized mode suppression by resonant magnetic perturbations in DIII-D. Phys. Plasmas 2008, 15, 056112. [Google Scholar] [CrossRef]
- Mukhovatov, V.; Shimada, M.; Chudnovskiy, A.N.; Costley, A.E.; Gribov, Y.; Federici, G.; Kardaun, O.; Kukushkin, A.S.; Polevoi, A.; Pustovitov, V.D.; et al. Overview of physics basis for ITER. Plasma Phys. Control. Fusion 2003, 45, A235–A252. [Google Scholar] [CrossRef]
- Lang, P.; Conway, G.; Eich, T.; Fattorini, L.; Gruber, O.; Günter, S.; Horton, L.; Kalvin, S.; Kallenbach, A.; Kaufmann, M.; et al. ELM pace making and mitigation by pellet injection in ASDEX Upgrade. Nucl. Fusion 2004, 44, 665–677. [Google Scholar] [CrossRef]
- Lang, P.; Lackner, K.; Maraschek, M.; Alper, B.; Belonohy, E.; Gál, K.; Hobirk, J.; Kallenbach, A.; Kalvin, S.; Kocsis, G.; et al. Investigation of pellet-triggered MHD events in ASDEX Upgrade and JET. Nucl. Fusion 2008, 48, 095007. [Google Scholar] [CrossRef]
- Mansfield, D.; Roquemore, A.; Carroll, T.; Sun, Z.; Hu, J.; Zhang, L.; Liang, Y.; Gong, X.; Li, J.; Guo, H.; et al. First observations of ELM triggering by injected lithium granules in EAST. Nucl. Fusion 2013, 53, 113023. [Google Scholar] [CrossRef]
- Stober, J.; Lomas, P.; Saibene, G.; Andrew, Y.; Belo, P.; Conway, G.; Herrmann, A.; Horton, L.; Kempenaars, M.; Koslowski, H.R.; et al. Small ELM regimes with good confinement on JET and comparison to those on ASDEX Upgrade, Alcator C-mod and JT-60U. Nucl. Fusion 2005, 45, 1213–1223. [Google Scholar] [CrossRef]
- Pamela, S.J.P.; Huysmans, G.T.A.; Beurskens, M.N.A.; Devaux, S.; Eich, T.; Benkadda, S.; Contributors, J.E. Nonlinear MHD simulations of edge-localized-modes in JET. Plasma Phys. Control. Fusion 2011, 53, 054014. [Google Scholar] [CrossRef]
- Cathey, A.; Hoelzl, M.; Futatani, S.; Lang, P.T.; Lackner, K.; Huijsmans, G.T.A.; Pamela, S.J.P.; Günter, S. Comparing spontaneous and pellet-triggered ELMs via non-linear extended MHD simulations. Plasma Phys. Control. Fusion 2021, 63, 075016. [Google Scholar] [CrossRef]
- Futatani, S.; Huijsmans, G.; Loarte, A.; Baylor, L.R.; Commaux, N.; Jernigan, T.C.; Fenstermacher, M.E.; Lasnier, C.; Osborne, T.H.; Pegourié, B. Non-linear MHD modelling of ELM triggering by pellet injection in DIII-D and implications for ITER. Nucl. Fusion 2014, 54, 073008. [Google Scholar] [CrossRef]
- Huysmans, G.T.A.; Pamela, S.; Van Der Plas, E.; Ramet, P. Non-linear MHD simulations of edge localized modes (ELMs). Plasma Phys. Control. Fusion 2009, 51, 124012. [Google Scholar] [CrossRef]
- Kocsis, G.; Kalvin, S.; Lang, P.; Maraschek, M.; Neuhauser, J.; Schneider, W.; Szepesi, T. Spatio-temporal investigations on the triggering of pellet induced ELMs. Nucl. Fusion 2007, 47, 1166–1175. [Google Scholar] [CrossRef][Green Version]
- Futatani, S.; Pamela, S.; Garzotti, L.; Huijsmans, G.; Hoelzl, M.; Frigione, D.; Lennholm, M.; the JOREK Team; JET Contributors. Non-linear magnetohydrodynamic simulations of pellet triggered edge-localized modes in JET. Nucl. Fusion 2019, 60, 026003. [Google Scholar] [CrossRef]
- Lennholm, M.; McKean, R.; Mooney, R.; Tvalashvili, G.; Artaserse, G.; Baruzzo, M.; Belonohy, E.; Calabro, G.; Carvalho, I.; Challis, C.D.; et al. Statistical assessment of ELM triggering by pellets on JET. Nucl. Fusion 2021, 61, 036035. [Google Scholar] [CrossRef]
- Garzotti, L.; Lang, P.T.; Alonso, A.; Alper, B.; Belonohy, E.; Boboc, A.; Devaux, S.; Eich, T.; Frigione, D.; Gál, K.; et al. Investigating pellet ELM triggering physics using the new small size pellet launcher at JET. In Proceedings of the 37th EPS Conference on Plasma Physics, Dublin, Ireland, 21–25 June 2010; European Physical Society: Mulhouse, France, 2010. [Google Scholar]
- Khanna, H.; Gaunt, S.L.L.; McCallum, D.A. Digital Spectrographic Cross-Correlation: Tests of Sensitivity. Bioacoustics 1997, 7, 209–234. [Google Scholar] [CrossRef]
- Bombarda, F.; Angelone, M.; Apruzzese, G.; Centioli, C.; Cesaroni, S.; Gabellieri, L.; Grosso, A.; Marinelli, M.; Milani, E.; Palomba, S.; et al. CVD diamond detectors for fast VUV and SX-ray diagnostics on FTU. Nucl. Fusion 2021, 61, 116004. [Google Scholar] [CrossRef]
- Cesaroni, S.; Angelone, M.; Apruzzese, G.; Bombarda, F.; Gabellieri, L.; Marinelli, M.; Milani, E.; Palomba, S.; Pucella, G.; Romano, A.; et al. CVD diamond photodetectors for FTU plasma diagnostics. Fusion Eng. Des. 2021, 166, 112323. [Google Scholar] [CrossRef]
- Angelone, M.; Pillon, M.; Marinelli, M.; Milani, E.; Prestopino, G.; Verona, C.; Rinati, G.V.; Coffey, I.; Murari, A.; Tartoni, N. Single crystal artificial diamond detectors for VUV and soft X-rays measurements on JET thermonuclear fusion plasma. Nucl. Instruments Methods Phys. Res. Sect. A Accel. Spectrometers Detect. Assoc. Equip. 2010, 623, 726–730. [Google Scholar] [CrossRef]
- Vinyar, I.; Geraud, A.; Wyman, M.; Dequan, L.; Lukin, A.; Umov, A.; Skoblikov, S.; Reznichenko, P. Pellet injectors developed at PELIN for JET, TAE and HL-2A. Fusion Eng. Des. 2011, 86, 2208–2211. [Google Scholar] [CrossRef]
- Géraud, A.; Lennholm, M.; Alarcon, T.; Bennett, P.; Frigione, D.; Garnier, D.; Lang, P.; Lukin, A.; Mooney, R.; Vinyar, I. Status of the JET high frequency pellet injector. Fusion Eng. Des. 2013, 88, 1064–1068. [Google Scholar] [CrossRef]
- Hutchinson, I.H. Principles of Plasma Diagnostics. Plasma Phys. Control. Fusion 2002, 44, 2603. [Google Scholar] [CrossRef]
- Caiffi, B.; Coffey, I.; Pillon, M.; Osipenko, M.; Prestopino, G.; Ripani, M.; Taiuti, M.; Verona, C.; Verona-Rinati, G. Analysis of the Response of CVD Diamond Detectors for UV and sX-Ray Plasma Diagnostics Installed at JET. Phys. Procedia 2015, 62, 79–83. [Google Scholar] [CrossRef][Green Version]
- MATLAB—Find Peaks Algorithm. Available online: https://it.mathworks.com/help/signal/ref/findpeaks.html (accessed on 3 April 2022).
- Mucha, H.-J.; Späth, H. Cluster dissection and analysis: Theory, FORTRAN programs, examples. (Translator: Johannes Goldschmidt.) Ellis Horwood Ltd. Wiley, Chichester 1985. 226 pp. £25. Biom. J. 1986, 28, 182. [Google Scholar] [CrossRef]
- Likas, A.; Vlassis, N.; Verbeek, J.J. The global k-means clustering algorithm. Pattern Recognit. 2003, 36, 451–461. [Google Scholar] [CrossRef]
- Hartigan, J.A.; Wong, M.A. Algorithm AS 136: A K-Means Clustering Algorithm. J. R. Stat. Soc. Ser. Appl. Stat. 1979, 28, 100–108. [Google Scholar] [CrossRef]
- Melter, R.A. Some characterizations of city block distance. Pattern Recognit. Lett. 1987, 6, 235–240. [Google Scholar] [CrossRef]
- Frigione, D.; Garzotti, L.; Lennholm, M.; Alper, B.; Artaserse, G.; Bennett, P.; Giovannozzi, E.; Eich, T.; Kocsis, G.; Lang, P.; et al. Divertor load footprint of ELMs in pellet triggering and pacing experiments at JET. J. Nucl. Mater. 2015, 463, 714–717. [Google Scholar] [CrossRef]
- Murari, A.; Craciunescu, T.; Peluso, E.; Gelfusa, M.; Lungaroni, M.; Garzotti, L.; Frigione, D.; Gaudio, P.; Contributors, J. How to assess the efficiency of synchronization experiments in tokamaks. Nucl. Fusion 2016, 56, 76008. [Google Scholar] [CrossRef]
Publisher’s Note: MDPI stays neutral with regard to jurisdictional claims in published maps and institutional affiliations. |
© 2022 by the authors. Licensee MDPI, Basel, Switzerland. This article is an open access article distributed under the terms and conditions of the Creative Commons Attribution (CC BY) license (https://creativecommons.org/licenses/by/4.0/).