Article

Prediction of Linear Cationic Antimicrobial Peptides Active against Gram-Negative and Gram-Positive Bacteria Based on Machine Learning Models

by
Ümmü Gülsüm Söylemez
1,2,†,
Malik Yousef
3,
Zülal Kesmen
4,
Mine Erdem Büyükkiraz
5 and
Burcu Bakir-Gungor
2,*,†
1
Department of Computer Engineering, Faculty of Engineering, Muş Alparslan University, Muş 49100, Turkey
2
Department of Computer Engineering, Faculty of Engineering, Abdullah Gul University, Kayseri 38170, Turkey
3
Department of Information Systems, Zefat Academic College, Zefat 13206, Israel
4
Department of Food Engineering, Faculty of Engineering, Erciyes University, Kayseri 38039, Turkey
5
Department of Nutrition and Dietetics, School of Health Sciences, Cappadocia University, Nevsehir 50420, Turkey
*
Author to whom correspondence should be addressed.
These authors contributed equally to this work.
Appl. Sci. 2022, 12(7), 3631; https://doi.org/10.3390/app12073631
Submission received: 5 January 2022 / Revised: 18 March 2022 / Accepted: 29 March 2022 / Published: 3 April 2022

Abstract

:
Antimicrobial peptides (AMPs) are considered as promising alternatives to conventional antibiotics in order to overcome the growing problems of antibiotic resistance. Computational prediction approaches receive an increasing interest to identify and design the best candidate AMPs prior to the in vitro tests. In this study, we focused on the linear cationic peptides with non-hemolytic activity, which are downloaded from the Database of Antimicrobial Activity and Structure of Peptides (DBAASP). Referring to the MIC (Minimum inhibition concentration) values, we have assigned a positive label to a peptide if it shows antimicrobial activity; otherwise, the peptide is labeled as negative. Here, we focused on the peptides showing antimicrobial activity against Gram-negative and against Gram-positive bacteria separately, and we created two datasets accordingly. Ten different physico-chemical properties of the peptides are calculated and used as features in our study. Following data exploration and data preprocessing steps, a variety of classification algorithms are used with 100-fold Monte Carlo Cross-Validation to build models and to predict the antimicrobial activity of the peptides. Among the generated models, Random Forest has resulted in the best performance metrics for both Gram-negative dataset (Accuracy: 0.98, Recall: 0.99, Specificity: 0.97, Precision: 0.97, AUC: 0.99, F1: 0.98) and Gram-positive dataset (Accuracy: 0.95, Recall: 0.95, Specificity: 0.95, Precision: 0.90, AUC: 0.97, F1: 0.92) after outlier elimination is applied. This prediction approach might be useful to evaluate the antibacterial potential of a candidate peptide sequence before moving to the experimental studies.

1. Introduction

Antimicrobial peptides (AMPs) are part of innate immunity and are natural antibiotics encoded by specific genes [1]. They are produced by various tissues and cell types of human, plant and animal species. These antimicrobial peptides usually contain 12 to 50 amino acids [2]. Nowadays, in parallel with the elevated use of antibiotics, resistance to antibiotics is rapidly increasing. The World Health Organization (WHO) reported that antimicrobial resistance continues to rise up all over the world and new resistance mechanisms emerge. Therefore, we could be faced with an era when infections can no longer be treated with antibiotics [3]. The increasing number of bacteria, which are resistant to antibiotics, create a need for the development of new antimicrobial agents that can be applied in treatment [4]. Studying the properties of antimicrobial peptides in detail is a very important topic for drug design [5]. Although AMPs are mainly used to kill Gram-positive and Gram-negative bacteria, they have potential to fight against mycobacteria, viruses, and cancerous cells. In this respect, AMPs are considered as a powerful alternative to antibiotics since they have lower risk to develop resistance [3,4]. Hence, discovering or designing novel antimicrobial peptides became a major field of interest.
The increasing interest in AMPs has recently increased the efforts to discover new peptides with antimicrobial activities. Prior to the time-consuming, costly, and difficult production processes, the accurate prediction of the activity of candidate peptides is very important. Along this line, several computational approaches such as de novo computational design [6,7,8,9], linguistic model [10,11], pattern insertion algorithm [12,13,14,15], and evolutionary-genetic algorithms [16,17,18,19] have been proposed for predicting the antimicrobial activity of AMPs and for identifying promising AMP candidates without undertaking expensive wet-lab experiments. Among different computational methods for the estimation of antimicrobial peptides [20], the use of machine learning methods became popular [21,22,23,24]. Machine learning is a computational technique where the generated models can make predictions via learning data [25]. Significant advancements in computational power and easy-to-use statistical learning tools that have come to the fore in recent years have increased the popularity of machine learning approaches. In this respect, machine learning which can leverage large datasets that are produced by high-throughput methods has become a viable option for the accurate classification of AMPs [26]. Lata et al. used the Support Vector Machine (SVM) method for prediction and classification of peptides on data which were collected from the Antimicrobial Peptides Database [24]. Their model is based on amino acid composition, and by using five-fold cross-validation, they obtained 92.14% accuracy [24]. Burdukiewicz et al. attempted to identify essential AMP potential regions via applying Random Forest (RF) as a classification algorithm [27]. Chung et al. made predictions for antimicrobial peptides on different organisms including amphibians, humans, fish, insects, plants, bacteria, and mammals [28]. Amino acid (aa) compositions, amino acid pairs, and the physico-chemical properties are used as features. They performed feature selection, and applied RF, SVM, k-Nearest Neighbor (kNN) algorithms. They reported that RF generated the best result, which was over 92% accuracy on all tested organisms [28]. Bhadra et al. also utilized an RF algorithm for AMP prediction using physico-chemical properties as features [23]. They grouped each property into three specific classes. For example, for hydrophobicity property, three classes are polar, neutral, and hydrophobic, while these three classes are positive, neutral, and negative for net charge property. They used AMP and non-AMP data with different ratios, where 19 different ratios were used in total; 1:3 ratio yielded 96% accuracy with 10-fold cross-validation technique and reduced feature sets [23]. Wang et al. combined sequence alignment with feature selection methods for classification of AMPs [29]. Xiao et al. modeled a two-level classifier. First level is for classifying peptide sequences as an AMP, and the second level is to separate these AMPs into 10 functional categories [21]. There are many computational tools to predict AMPs based on machine learning approaches [17,30,31,32,33,34]. Additionally, deep learning methods have been used to apply to antimicrobial peptides prediction problems. Bhadra et al. presented a method called deepAMP for sequences shorter than 30 aa. In their method, they used an optimal feature set of reduced amino acid composition with convolutional neural network and obtained 77% accuracy. They also compared their results with RF and SVM algorithms. While the RF model gives close accuracy (75%) to CNN, the model used for SVM has a lower accuracy (72%) [35]. Su et al. designed a deep neural network which consists of an embedding layer and multi-convolutional layers for AMP identification. Compared with the existing models, their model achieved a higher accuracy score (92%) [36]. Schneider et al. used self-organizing maps as input layers for their feedforward neural network on AMP data and obtained 92% reclassification accuracy with balanced prediction on samples [37]. Witten et al. reported a convolutional neural network model for the classification and regression of AMPs [38]. They used Minimum Inhibition Concentration (MIC) values for regression and compared with ridge regression and kNN algorithms. They showed that CNN has better root mean squared error value (0.501) than others. Moreover, for the classification part, when their CNN model is compared with other state-of-the-art methods, they have shown that higher prediction performance (97%) is obtained. Beltran et al. proposed a new feature selection approach to concentrate on molecular descriptors [39]. Their approach is applied on six benchmark datasets for evaluation. Additionally, they compared their results with state-of-the-art prediction tools and showed that their model outperforms these tools for prediction of antimicrobial and antibacterial peptides. In addition to the above-mentioned research efforts, some recent studies also used deep neural networks for the prediction of antimicrobial peptides [40,41,42,43]. However, there is no standardization in terms of the use of machine learning methods for the AMP prediction.
Nowadays, antimicrobial peptide databases provide comprehensive information on thousands of natural or synthetic antimicrobial peptides. The peptide sequences deposited in these databases can be utilized for de novo design of AMPs using computer-aided approaches [44,45]. However, in these databases, there is no standardization in terms of the experimental methods that are used to measure the activity of the AMPs in vitro. On the other hand, the antimicrobial activities of several AMPs have been predicted in silico. However, these algorithms do not take into account the physico-chemical and structural properties of the peptides and the mechanism of antimicrobial action against specific target microorganisms. Therefore, there is a need for new approaches based on the structure-activity relationship to accurately predict the antimicrobial activity of candidate peptides before synthesis.
In the last decade, a vast number of studies focused on the development of computational methods for determining the antimicrobial activity of natural or synthetic AMPs. However, the vast majority of these methods do not take into account the specific properties of bacterial targets. However, an AMP can exhibit different mechanisms of action against different target microorganisms. AMPs firstly interact with the bacterial cell wall and hence, it is considered that the cell wall composition greatly affects the antimicrobial activity of AMPs [46]. It is also well known that Gram-positive and Gram-negative bacteria have different cell-surface architectures. For example, Gram-negative bacteria have a thin peptidoglycan cell wall, surrounded by an outer membrane mainly containing lipopolysaccharide. Gram-positive bacteria lack an outer membrane but the cell wall contains thicker peptidoglycan layer and teichoic acids. Cell surface envelopes play a crucial role in the penetration and initial interaction of AMPs. Therefore, the prediction of the antimicrobial activity of AMPs need be considered separately for these two different bacterial groups. For this reason, in this paper, we aimed to develop a machine learning approach based on physico-chemical and structural properties of peptides and to predict their activities against Gram-positive and Gram-negative bacteria, separately. For this purpose, two different data sets were created in this study by selecting the peptides that are active against (i) E. coli, P. aeruginosa, and A. baumannii species for Gram-negative bacteria, and (ii) S. aureus, L. monocytogenes, and B. cereus species for Gram-positive bacteria. Different classification models are generated on each dataset and the results are compared using performance evaluation metrics in terms of accuracy, recall, specificity, precision, Area Under Curve (AUC), F1 measure, and balanced accuracy.
The rest of this paper is organized as follows. The Materials and Methods section presents our dataset and data preprocessing steps, and the machine learning algorithms that we used to predict AMPs. The Results section highlights our findings and provides an extensive evaluation of our method. The Discussions section discusses the biological relevance of our findings. Finally, the Conclusions section concludes the paper and summarizes avenues for further research.

2. Materials and Methods

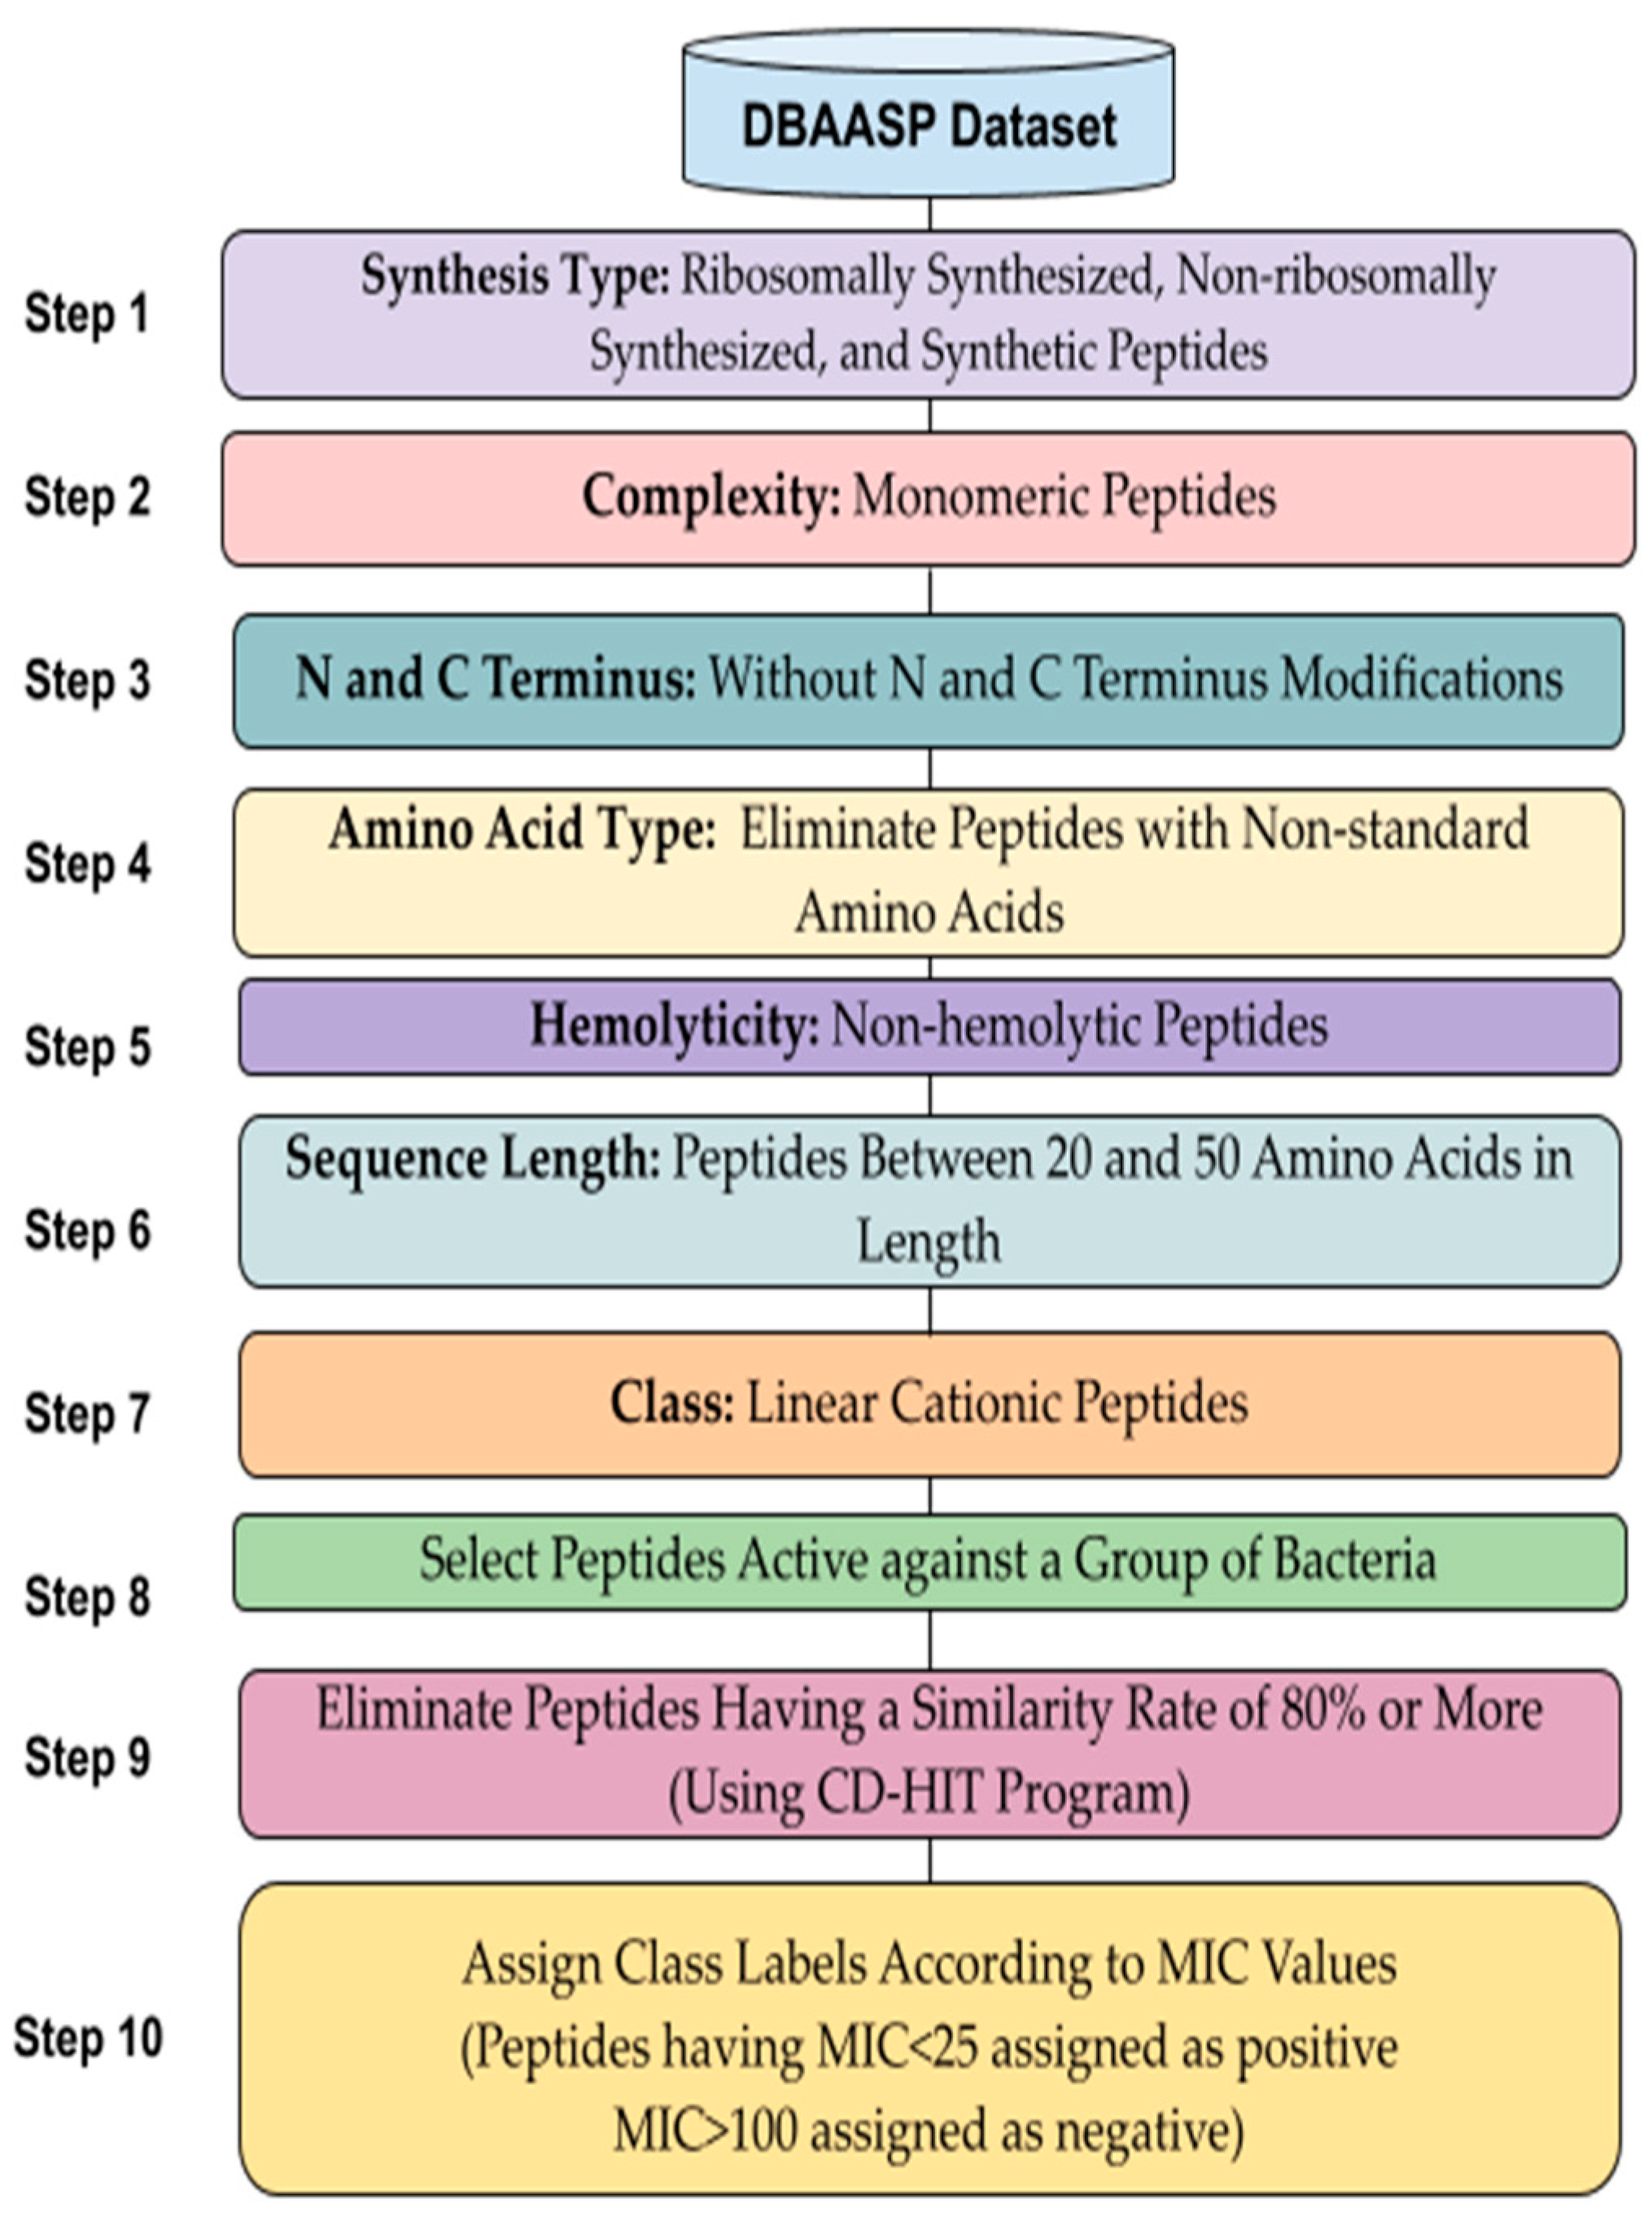
2.1. Dataset and Data Preprocessing

In this study, as a data resource, several AMP databases were investigated. Database of Antimicrobial Activity and Structure of Peptides (DBAASP v.2. http://dbaasp.org, accessed on 10 August 2021) [47] was chosen due to the following reasons: (i) DBAASP is one of the most comprehensive AMP databases and it is widely used in literature. (ii) This database provides users with detailed information about the activity of thousands of peptides, where the antimicrobial activity has been tested experimentally or in silico against more than 4200 different organisms (bacteria, fungi, some parasites, viruses, and cancer cells). (iii) DBAASP has an application programmable interface (API). (iv) While most other databases were outdated, DBAASP is being updated frequently. Therefore, in this study, we have compiled our dataset from DBAASP.
In Figure 1, we illustrate our data preprocessing steps. In terms of synthesis type, ribosomally synthesized peptides, non-ribosomally synthesized peptides, and synthetic peptides were included in our datasets (Figure 1, Step 1). In terms of peptide complexity, we focused on monomers since 90% of the peptides in databases are monomeric peptides which consist of only one polypeptide chain (Figure 1, Step 2). Most of the property calculation algorithms recognize natural amino acids. Hence, the peptides which contain non-standard amino acids, or which have N and C terminal modifications were removed from the datasets (Figure 1, Step 3 and 4).
As a continuation of this work, we plan to perform de novo antimicrobial peptide design by using the dataset that we have compiled in this study. Along this line, in therapeutic applications, the prediction of non-hemolytic peptides are reported as more important than the hemolytic peptides for the elimination of the detrimental effects of AMPs on the host [48]. Hence, here we focused on non-hemolytic peptides, and the peptides having hemolytic activity against human erythrocytes were removed from the datasets (Figure 1, Step 5).
AMPs exhibit their antimicrobial effects mainly through two different mechanisms. The membrane-targeting AMPs disrupt cell membrane integrity and lead to cytoplasmic leakage while the AMPs that use non-membrane targeting mechanisms mainly inhibit essential intracellular functions by interfering with DNA, RNA or proteins. AMPs shorter than 20 aa usually exert their antimicrobial effect by using non-membrane target mechanisms and they are defined as cell-penetrating antimicrobial peptides [49,50]. However, in this study, we focused on membrane-active peptides which are generally longer than 20 aa. Among the peptides longer than 20 aa in DBAASP, most of the peptide entries are shorter than 50 aa, hence we have selected the peptides with lengths ranging from 20 to 50 aa (Figure 1, Step 6).
Linear cationic antimicrobial peptides (LCAMPs) are the largest class of AMPs and they are widely found in different organisms [49]. Therefore, LCAMPs which have antimicrobial activity against Gram-negative bacteria including Escherichia coli, Pseudomonas aeruginosa, Acinetobacter baumannii species, and Gram-positive bacteria including Staphylococcus aureus, Listeria monocytogenes, Bacillus cereus species are selected from the DBAASP (Figure 1, Step 7 and 8).
The CD-HIT [50] program was used to eliminate the sequences that have more than 80% identity (Figure 1, Step 9). The CD-HIT program is widely used in the AMP prediction problem for removing highly similar sequences [51,52,53,54,55,56,57,58,59].
In this study, the class labels of peptides are assigned according to the antimicrobial peptide activities against target organisms. In this respect, Minimum Inhibition Concentration (MIC) values are widely used to assess the in vitro levels of susceptibility or resistance of specific bacterial strains to a particular AMP [50]. Hence, we utilized MIC values provided in DBAASP for each protein against different target organisms. All concentration units were converted to µg/mL using the molecular weights of the peptides. While the peptides having MIC value < 25 µg/mL against one of our target organisms are assigned as positive (antimicrobial), the peptides having MIC >100 µg/mL are assigned as negative (non-antimicrobial) (Figure 1, Step 10). This procedure is repeated separately for our Gram-negative and Gram-positive datasets. Hence, we assigned a class label to each peptide in our dataset.
The final dataset includes 231 positive (AMP) and 114 negative (non-AMP) labeled peptides in the Gram-negative dataset, and 165 positive and 194 negative samples in the Gram-positive dataset.

2.1.1. Feature Generation

Machine learning algorithms paved the way for the discovery of novel AMPs. Since ML models require numerical or categorical data (features) as an input, an informative encoding of proteins is crucial. Unfortunately, the development of appropriate encodings for proteins is a major challenge, and hence the feature generation problem for peptides has not been entirely solved so far. Therefore, the development of novel amino acid encodings is an active stand-alone research branch. A recent review paper [60] discussed state-of-the-art encodings of amino acids as well as their properties in sequence- and structure-based aggregation.

Generation of Physico-Chemical Features (Descriptors)

Most AMPs exhibit their antimicrobial effects mainly by perturbing bacterial membrane integrity. Therefore, the development of an effective predictive model strongly depends on the deep understanding of physico-chemical parameters, especially those that affect the AMP–membrane interaction. For AMPs, the sequence length of the peptide, normalized hydrophobic moment, normalized hydrophobicity, net charge, isoelectric point, penetration depth, orientation of peptides relative to the surface of membrane (tilt angle), propensity to disordering, linear moment and in vitro aggregation are widely used physico-chemical properties [9,46,60,61,62,63]. As Spanig et al. noted in their recent review paper [60], the physico-chemical property encoding is also utilized by several web servers such as AVPpred [64] and DBAASP [47] in order to perform database queries, classify, and retrieve peptides. Moreover, physico-chemical properties have been employed in different studies to predict the antimicrobial effects of synthetic peptides [65] or to find substructures with antimicrobial potency in larger proteins [66]. These parameters strongly affect the extent of peptide–membrane interactions and the depth of the penetration in lipid bilayer, and determine the mode of action of membrane-targeting AMPs [46]. For instance, net charge reflects the propensity of electrostatic interaction of cationic peptides with the negatively charged membrane while hydrophobicity is responsible for the insertion and partition of the peptides into the hydrophobic core of the bilayer [5]. In our study, these 10 features were used as features to represent each peptide. All these features except sequence length are calculated by the DBAASP web server. Table 1 presents example sequences that are included in our Gram-negative dataset. As shown in Table 1, along with 10 physico-chemical properties, each peptide has a class label as 0 or 1, where 0 implies that the peptide is not active against Gram-negative bacteria, and 1 implies that the peptide is active against these bacteria.

Generation of Sequence-Based, Structure-Based, and Linguistic-Based Features

Several studies have provided web servers or standalone programs to calculate features from peptide sequences [67,68,69]. These tools are reviewed in detail in [60]. Propy tool, which was developed by Cao et al., provides five feature groups with 13 subfeatures from proteins or peptide sequences [70]. Chen et al. developed iFeature tool, which calculates 18 feature groups and also provides clustering and feature selection on protein and peptide sequences [71]. PyBioMed is another Python package that computes features not only from protein, DNA sequences but also from chemical structures [72]. It is a frequently used tool in this field due to its wide scope in attribute definition [73,74,75]. The PyProtein [72] is a module of PyBioMed for calculating the structural and physico-chemical features of proteins and peptides. It computes five feature groups including physico-chemical, amino acid composition, pseudo amino acid composition (PseAAC), Composition, Transition, and Distribution (CTD) of physico-chemical properties, autocorrelation, sequence order, and conjoint triad. These features are also known as different Chou’s PseAAC modes [70]. For our Gram-positive and Gram-negative datasets, 1497 features including amino acid composition (20), dipeptide composition (400), CTD composition (21), CTD transition (21), CTD distribution (105), Moran autocorrelation (240), Geary autocorrelation (240), Moreau–Broto autocorrelation (240), quasi-sequence-order descriptors (100), sequence order coupling number (60), and pseudo amino acid composition (50) are calculated via freely available PyProtein module in PyBioMed python package [72]. These features are also used in other studies for AMP prediction using machine learning [61,76].

2.2. Machine Learning Models

AdaBoost: Boosting technique creates a strong learner by bringing together several weak learners. The basic approach of boosting methods is to train the estimators cumulatively. In this model, the training set is first trained with a weak learner. For this algorithm, incorrectly predicted samples after the training step are important. In the next training phase, the incorrectly learned training data in the first iteration is retrained by giving more priority [77].
LogitBoost: LogitBoost has been developed to provide solutions to the overfitting problem experienced in AdaBoost. This algorithm linearly reduces the errors in the training to solve the above-mentioned problem [78].
Decision Tree: The decision tree creates a classification or regression model in the form of a tree structure. While dividing the dataset into smaller and smaller subsets, an associated decision tree is progressively and concurrently developed [79].
Random Forest: Random Forests (RF) are an ensemble learning method for classification, regression, and other tasks, by generating a large number of decision trees during the training phase and estimating the class or number according to the type of problem [80].
Support Vector Machine: A Support Vector Machine (SVM) can be defined as a vector space-based machine learning method that finds a decision boundary between the two classes that are furthest away from any point in the training data [81].
K-Nearest Neighbor: The k-nearest neighbor (kNN) algorithm is one of the supervised learning algorithms that is used in solving both classification and regression problems. The algorithm is used by making use of the data in a sample set with known classes. The distance of the new data, which will be added to the sample data set, is calculated according to the existing data, and its k closest neighbors are examined [82].
The Konstanz Information Miner (KNIME) platform is used for the implementation of our workflow [83] and the Jupyter Notebook [84] was used for visualization.

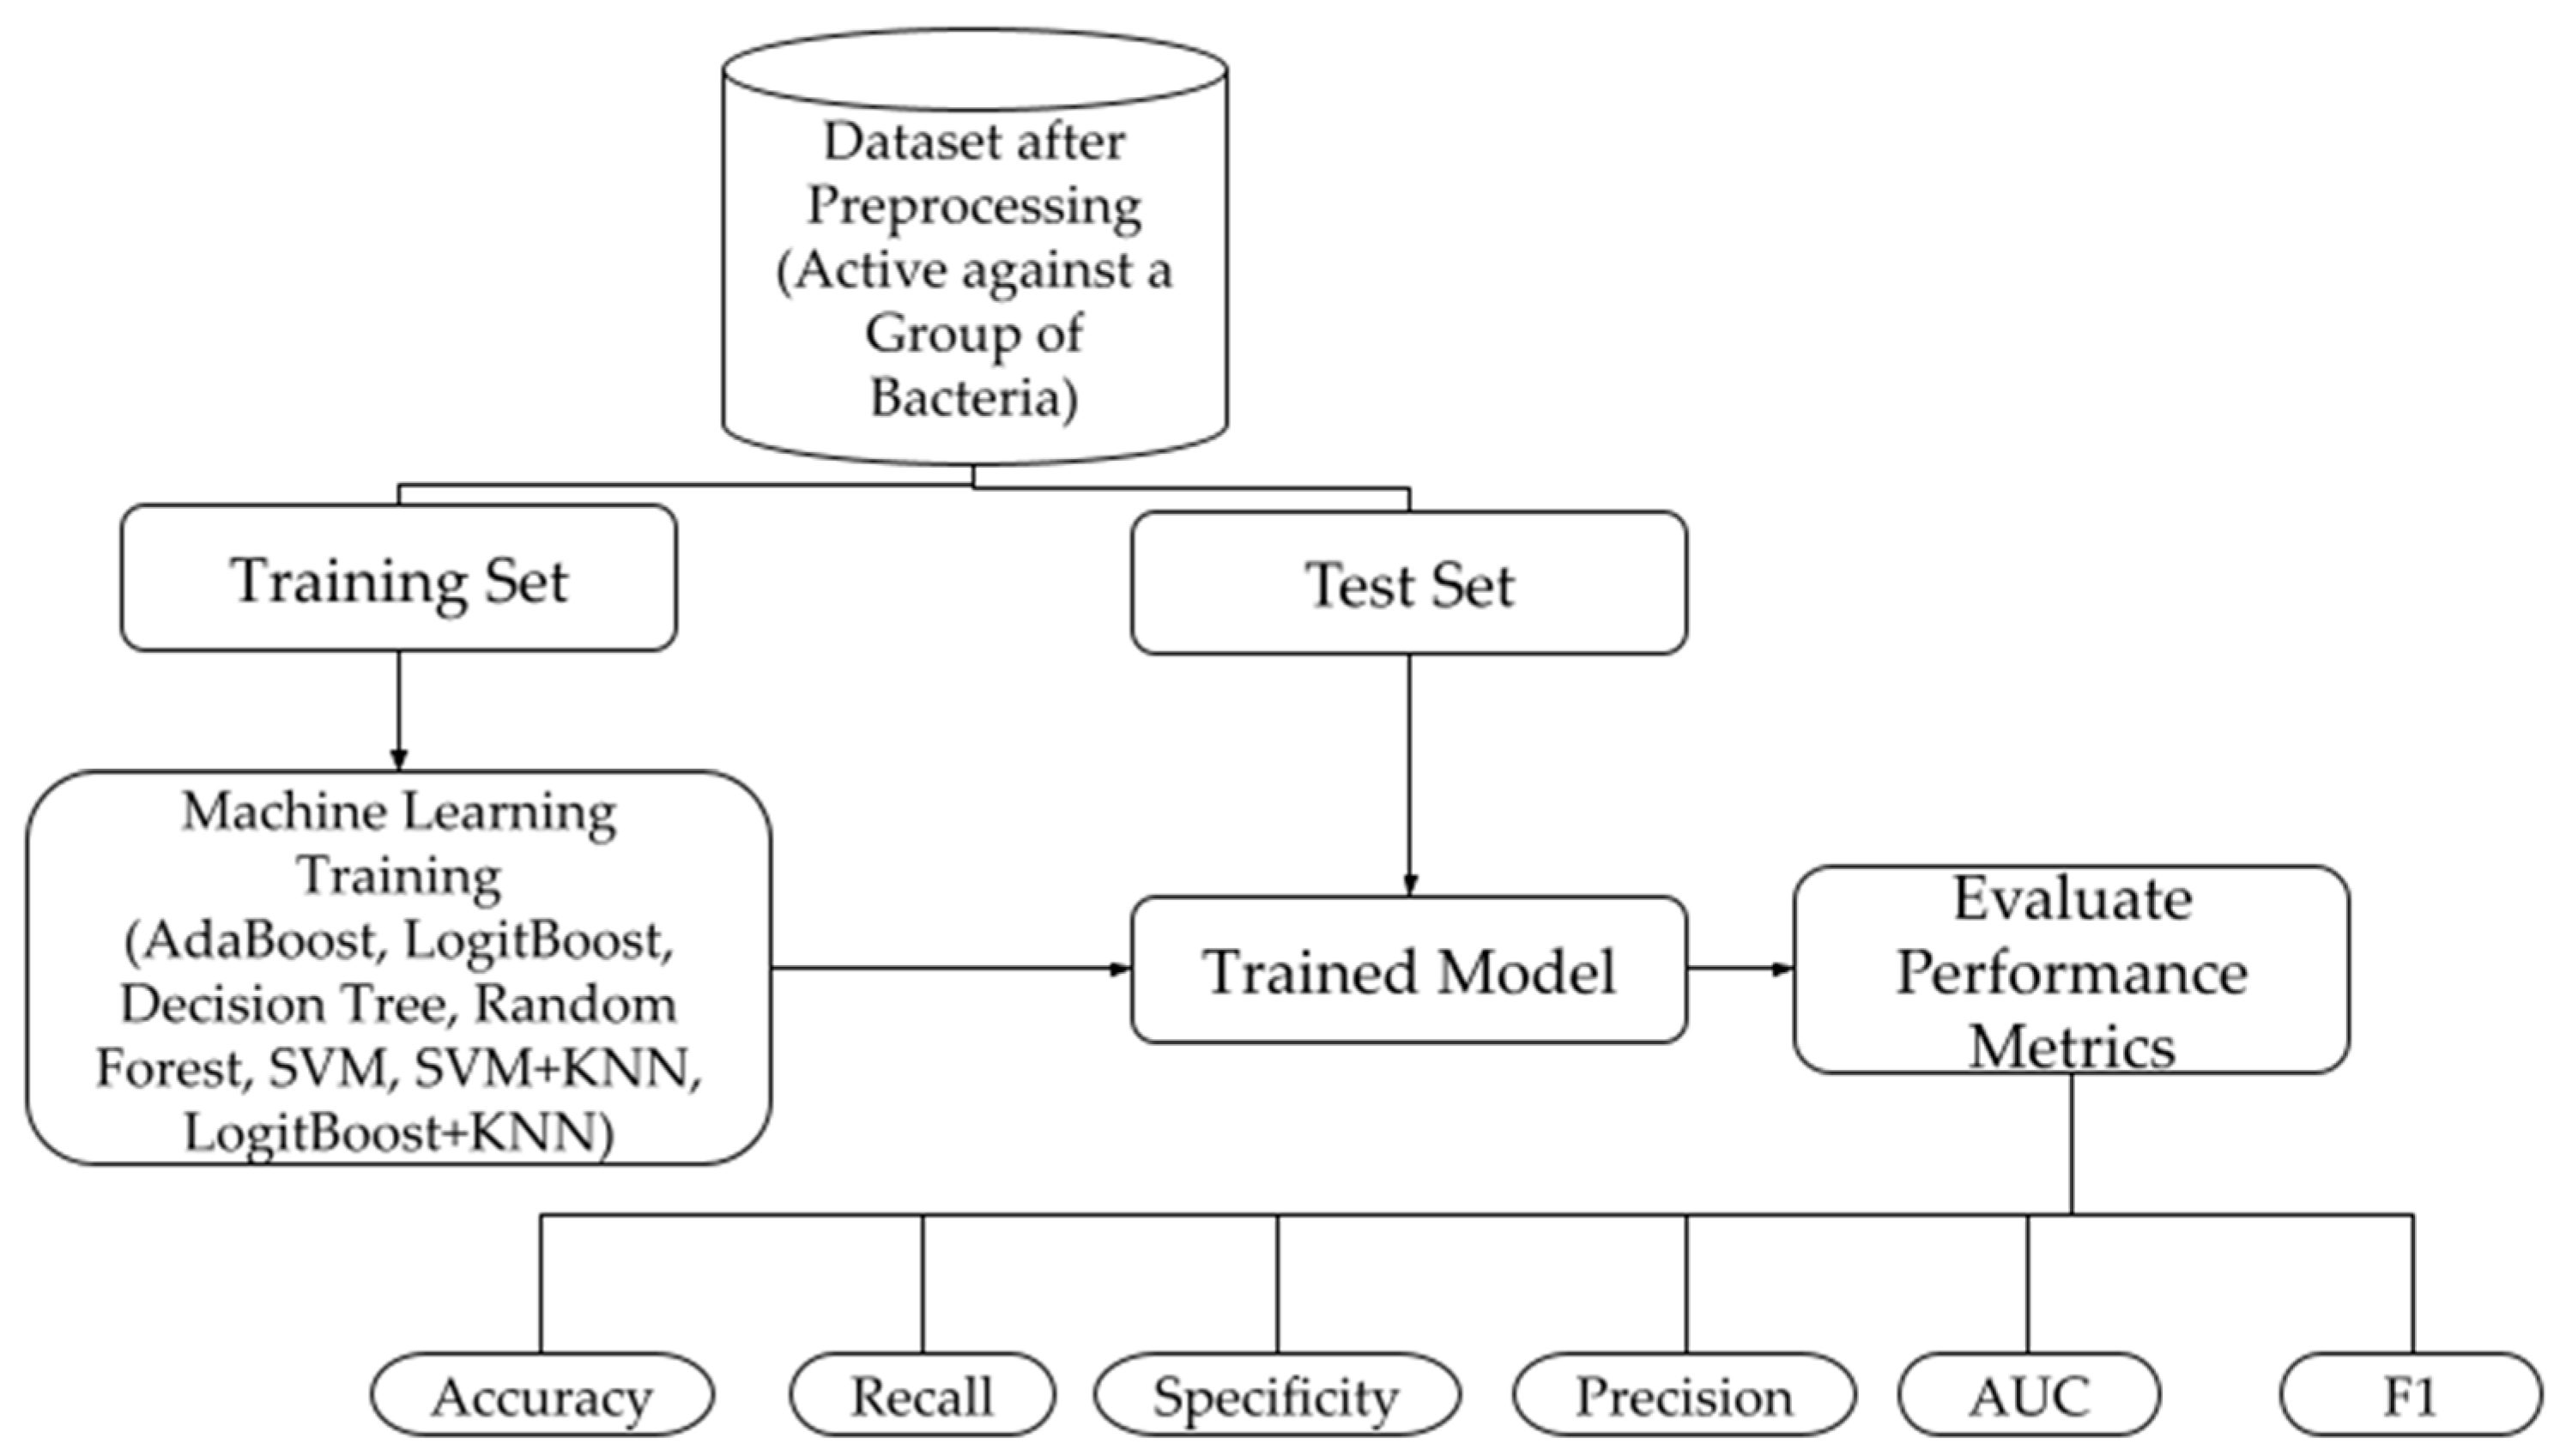
2.2.1. Model Construction

As illustrated in Figure 2, we applied several machine learning algorithms that are explained in the above section to classify antimicrobial and non-antimicrobial peptides. We also constructed stacking ensemble learners. All the findings we obtained in our study were obtained using 100-fold Monte Carlo Cross-Validation (MCCV) [85]. MCCV is a technique that selects a part of the data (unaltered) to create the training set, and then assigns the remaining data as the test set. This process is then repeated many times randomly, creating new training and testing segments each time. In our study, the training set is 90% of the data and the test is 10%.

2.2.2. Performance Metrics

We have assessed the performance of our models using several performance evaluation metrics such as accuracy, recall, specificity, AUC, F1 measure, and balanced accuracy. These metrics are employed as follows where TP: True Positive, TN: True Negative, FP: False Positive, FN: False Negative.
Accuracy = TP + TN TP + TN + FN + FP
Recall   ( Sensitivity ) = TP TP + FN
Specificity = TN TN + FP
F 1 = 2 TP 2 TP + FP + FN
Balanced   Accuracy = 1 2 ( TP TP + FN ) + 1 2 ( TN TN + FP )

3. Results

3.1. Training Models Using Physico-Chemical Features

In our experiments, firstly we have used the above-mentioned ten physico-chemical features and different machine learning methods: (i) to learn whether the peptides in each of our datasets have antimicrobial activity or not and (ii) to classify them accordingly. To this end, we have applied methods such as AdaBoost, Decision Tree, LogitBoost, RF, and SVM. As shown in Table 2 and Table 3, for both Gram-negative and Gram-positive datasets, RF classifier resulted in the best performance metrics. While the AUC rate reached up to 90% for Gram-positive data, this rate was 92% for Gram-negative data. Not only for AUC rate, but also for other measures such as accuracy, recall, specificity, precision, and F1 measure, RF yielded the best performance metrics. Figure 3 displays the comparative evaluation of different models using AUC values for (a) Gram-negative dataset and (b) Gram-positive dataset. As it can be seen in Figure 3a and in Table 2, while 92% AUC value is obtained for Gram-negative dataset, 90% AUC value is obtained for Gram-positive dataset (shown in Figure 3b and in Table 3) using RF classifier. While the AUC values of other classifiers range between 0.77–0.87 for Gram-positive dataset (shown in Figure 3b and in Table 3), it ranges between 0.78–0.89 for Gram-negative dataset.
To analyze the pairwise correlations of the features, Pearson correlation values between all pairs of features have been calculated using Python Seaborn Library. These relations were illustrated in Supplementary Figures S1 and S2 using a heatmap. The only statistically significant pairwise correlation worth mentioning was observed between the “Isoelectric Point” and “Net Charge” features. Between any other pairs of features, no significant correlation is observed.
Feature selection procedure tries to reduce the computational costs by removing redundant or irrelevant variables from input data. This technique contributes to better understanding the generated model and allows one to improve the model via focusing on the important features. In order to perform this task, one needs to score or rank the features in terms of how useful they are at predicting the output. There are different approaches for feature ranking that are based on statistics measurements or wrapper approaches that are based on machine learning [86]. Moreover, more advanced approaches that integrate biological knowledge into the machine learning algorithm for performing feature selection or for selecting groups of features are used in different recent tools. Such an approach was adopted by different tools such as SVM RCE, SVM-RCE-R [87,88,89], maTE [90], CogNet [91], miRcorrNet [92], miRModuleNet [93], and Integrating Gene Ontology-Based Grouping and Ranking [94]. Recently, these tools and their competitors were reviewed in [95].
In this study, for each tested machine learning algorithm, we have recorded the scores assigned to each feature during the MCCV (100 iteration) procedure. Since we obtain higher performance metrics using RF classifier, we have utilized the feature scores of this model throughout the rest of the paper. When we analyze the feature scores (shown in Figure 4 and Figure 5), we observe that Net Charge, Isoelectric Point, Disordered Conformation Propensity, Normalized Hydrophobicity, and Normalized Hydrophobic Moment are more crucial features than others for both Gram-negative and Gram-positive datasets.

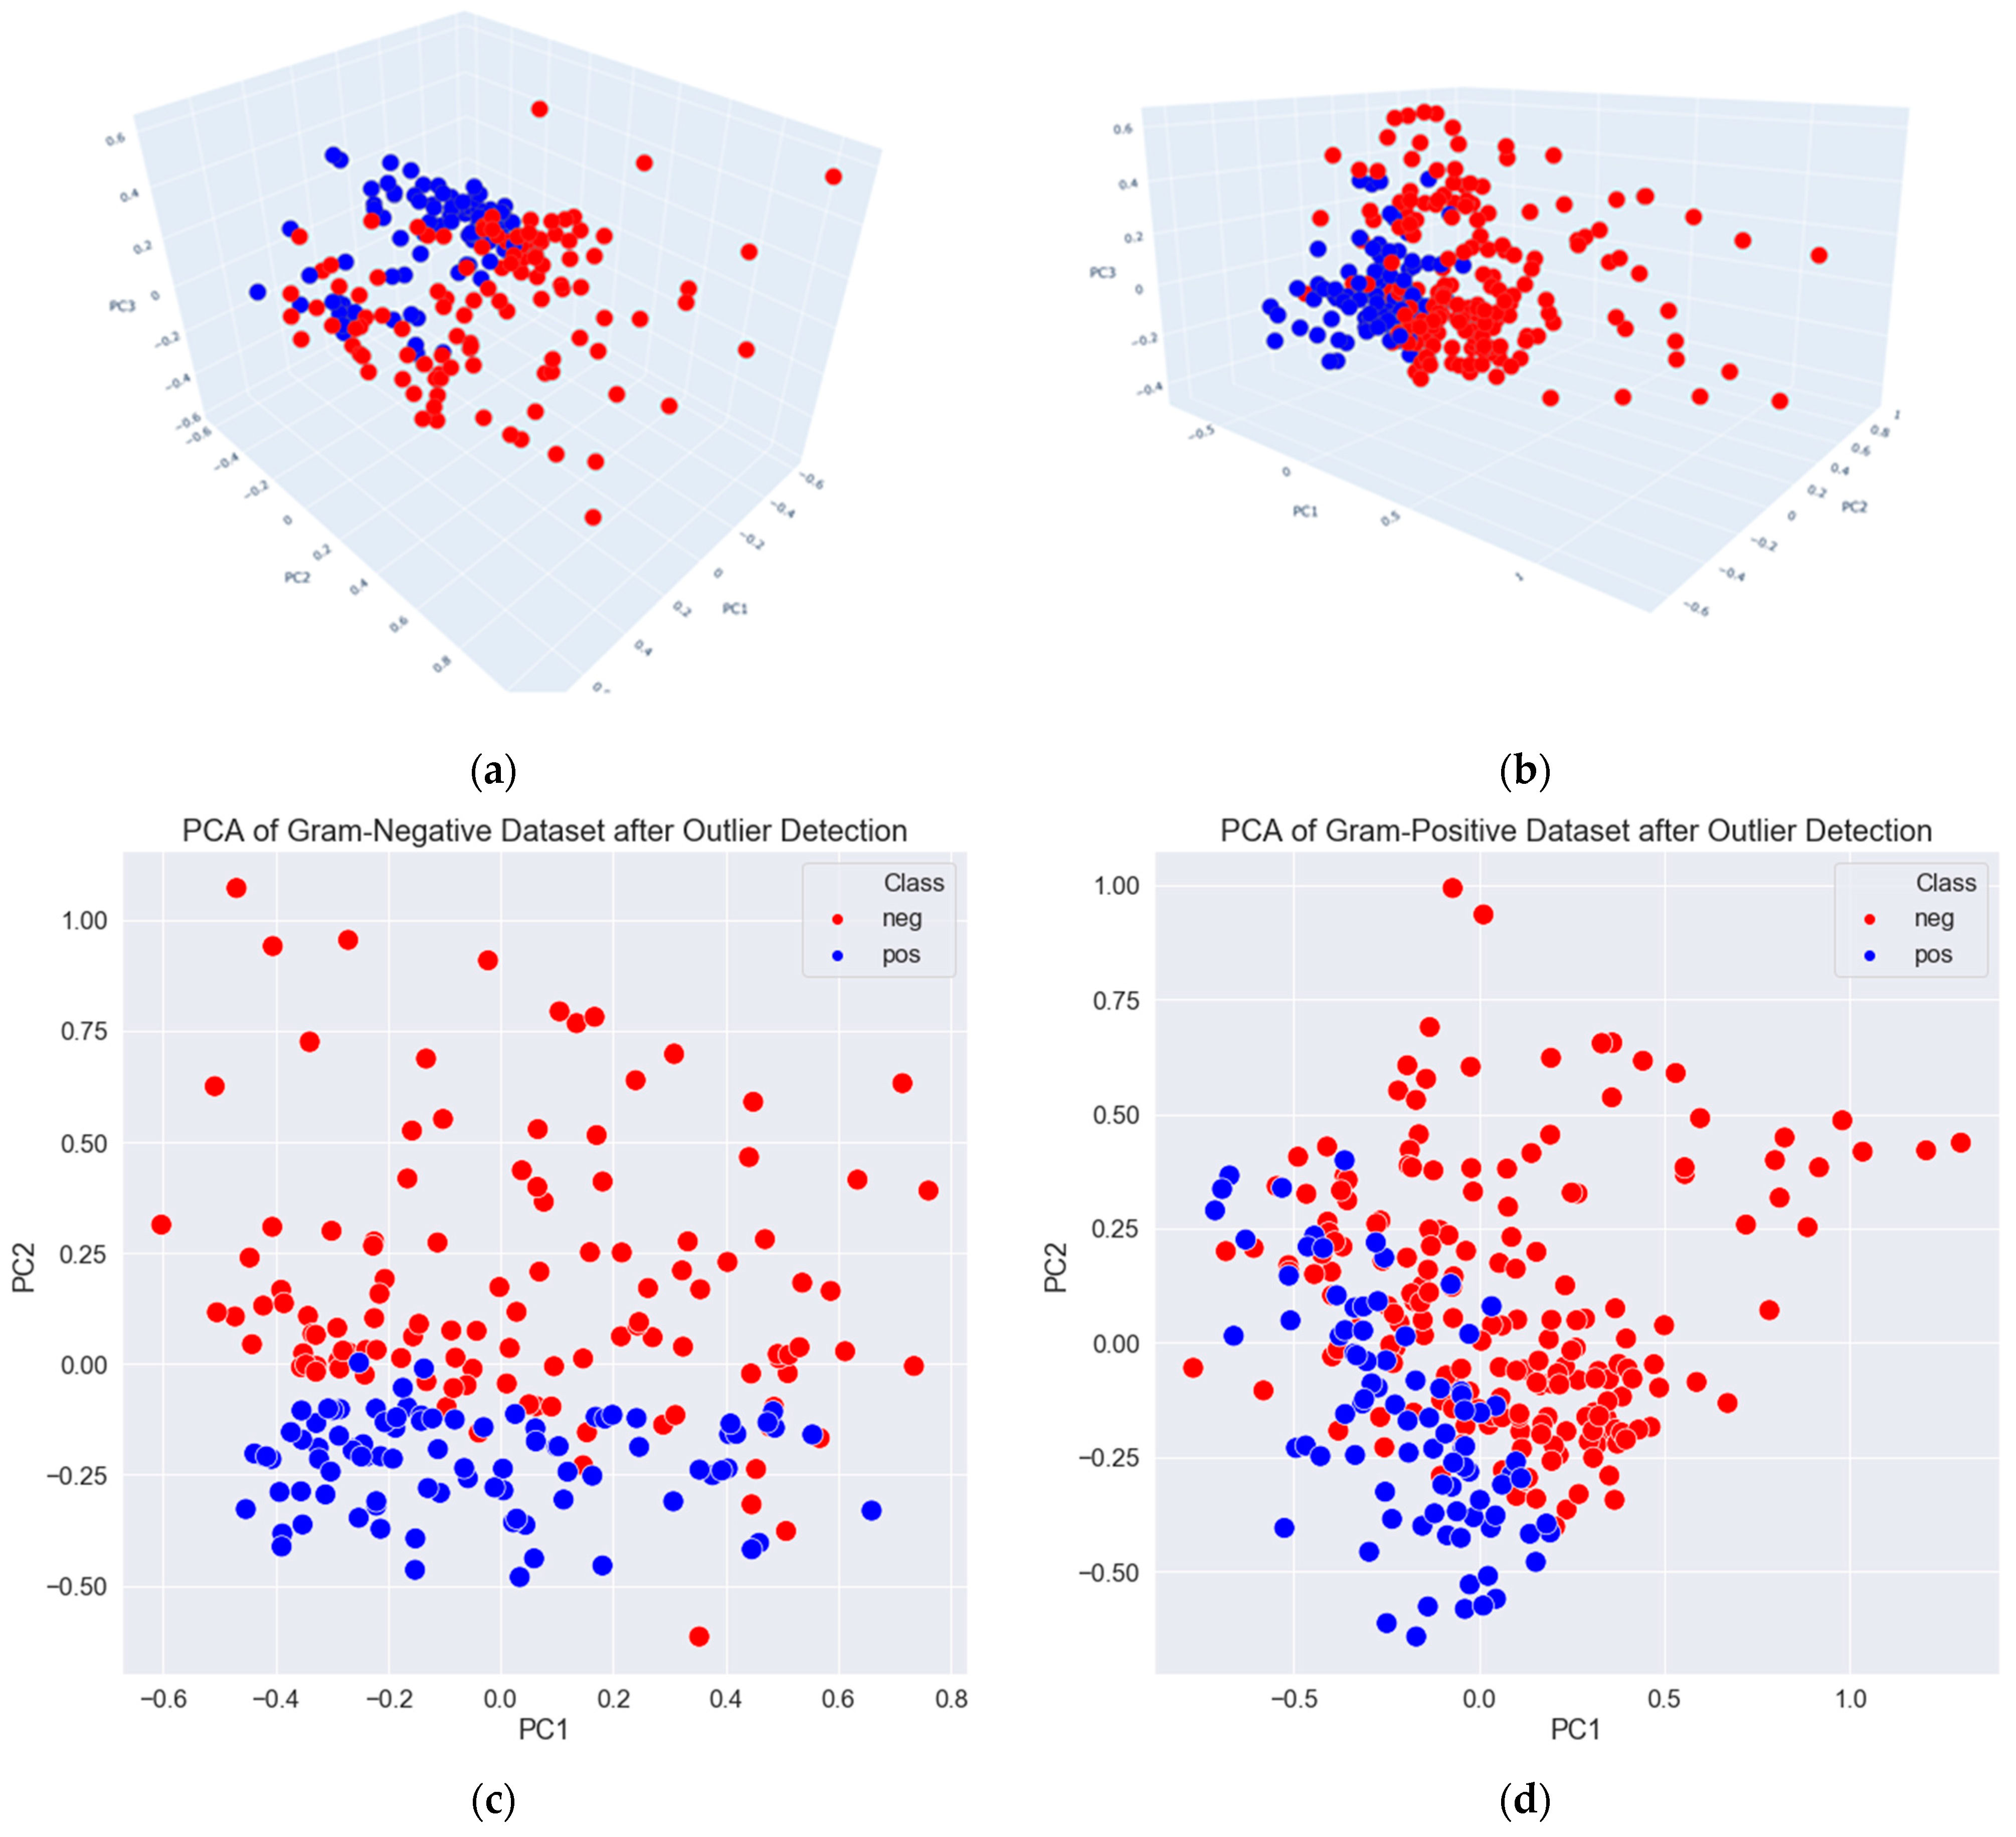
3.2. Data Exploration, Outlier Detection, and Elimination

In order to obtain the underlying structure of the data, we apply Principal Component Analysis (PCA) on Gram-negative and Gram-positive datasets separately. PCA is a dimensionality reduction technique that maps the data in high dimensional space (here each dimension corresponds to a physico-chemical property of a peptide) to a lower dimensional space (usually 2D or 3D) preserving the original structure of the data [96]. This technique is commonly used to highlight variation in a dataset and to capture strong patterns. Hence, PCA helps to visualize the data and the outliers. PCA has been applied to antimicrobial peptide data in several studies for data exploration and outlier detection purposes [97,98,99,100]. In our study, we also applied PCA to our dataset for visualizing the AMP and non-AMP samples. In Figure 6, we present PCA results of the Gram-negative dataset (Figure 6a,c) and of the Gram-positive dataset (Figure 6b,d). While Figure 6a,b refer to the PCA results in 3D, Figure 6c,d refer to the PCA results in 2D. Interactive 3D plots are provided as Supplementary Material. We observe in Figure 6 that there are some outlier samples (peptides) in both Gram-negative and Gram-positive datasets.
The presence of outliers can result in a poor fit and lower predictive modeling performance in classification or regression problems. For most machine learning datasets, due to the large number of input variables, the identification and removal of outliers is challenging by only using simple statistical methods. There are different computational approaches for outlier detection. One of those approaches depends on novelty detection based on machine learning [101], more specifically on one-class approaches [102,103,104,105,106].
In this study, in order to have a more homogenous group of peptides having antimicrobial activities, we wanted to eliminate outlier samples (peptides) if one of their physico-chemical features acts as an outlier. To see the distribution of the attributes in positive class (AMP) and negative class (non-AMP), we plotted the histograms for each feature. Figure 7 presents two histograms drawn for the Net Charge feature of the Gram-positive dataset for (a) AMP class and (b) Non-AMP class. It can be observed from Figure 7 that while the net charge values are in the range of [0, 31] for AMP class, it is in the range of [−6, 16] for the negative class. Based on our analysis using such histograms, we define a certain range of values for each feature for the positive class (AMP, the peptides having antimicrobial activity). We perform this analysis separately for the Gram-positive dataset and the Gram-negative dataset, and we eliminate the peptides in the positive class if their physico-chemical properties are outside of this predefined range. The range for each attribute is shown in Table 4.
At the end of the outlier elimination step, we obtain 194 non-AMPs and 88 AMPs for the Gram-positive dataset; 114 non-AMPs and 90 AMPs for the Gram-negative dataset. In Figure 8, we present PCA results of the Gram-negative dataset (shown in a,c), and of the Gram-positive dataset (shown in b,d) after outlier detection and elimination. While PCA plots are presented in 3D in (Figure 8a,b), they are presented in 2D in (Figure 8c,d). While the red colors refer to non-AMPs, blue colors indicate AMPs. Compared with Figure 6, Figure 8 implies that the positive class members are better separated from negative class members for both datasets after outliers are eliminated.
Using two of the datasets after outlier elimination, we repeated our classification experiment as explained in the Methods section. As shown in Table 5 and Table 6, when outlier removal is applied, we have obtained higher performance metrics. As presented in Table 5 and Table 6, the AUC rate increased by 7% and reached 99% AUC for the Gram-negative dataset, while this score is obtained as 97% for the Gram-positive dataset.

3.3. Training Models Using an Extended Set of Features

In addition to the physico-chemical features, structural properties, sequence order, compositional features, the pattern of terminal residues, amino acid composition, dipeptide composition, autocorrelation, pseudo amino acid composition, and sequence order properties have been suggested as additional features for representing amino acid sequences [60,64]. Hence, in our experiments, we have also tested the effect of different features, in addition to the ten physico-chemical features. As explained in the Methods section, amino acid composition, pseudo amino acid composition, autocorrelation, and sequence order properties are calculated for the peptides included in our dataset. These 1497 additional features were added to the initially calculated 10 physico-chemical features, and our final dataset included 1507 features in total. Using the datasets including the extended set of features, we have repeated our classification experiment as explained in the Methods section. For both Gram-negative and Gram-positive datasets, when an extended set of features are utilized, the obtained performance metrics (as shown in Table 7 and Table 8) were slightly lower than the performance metrics obtained using only ten physico-chemical features (as shown in Table 5 and Table 6). For the Gram-negative dataset, while the extended set of features yielded 98% AUC with LogitBoost, physico-chemical features yielded 99% AUC with RF. For the Gram-positive dataset, while the model using an extended set of features achieved 95% AUC with RF, the generated model using only ten physico-chemical features achieved 97% AUC.

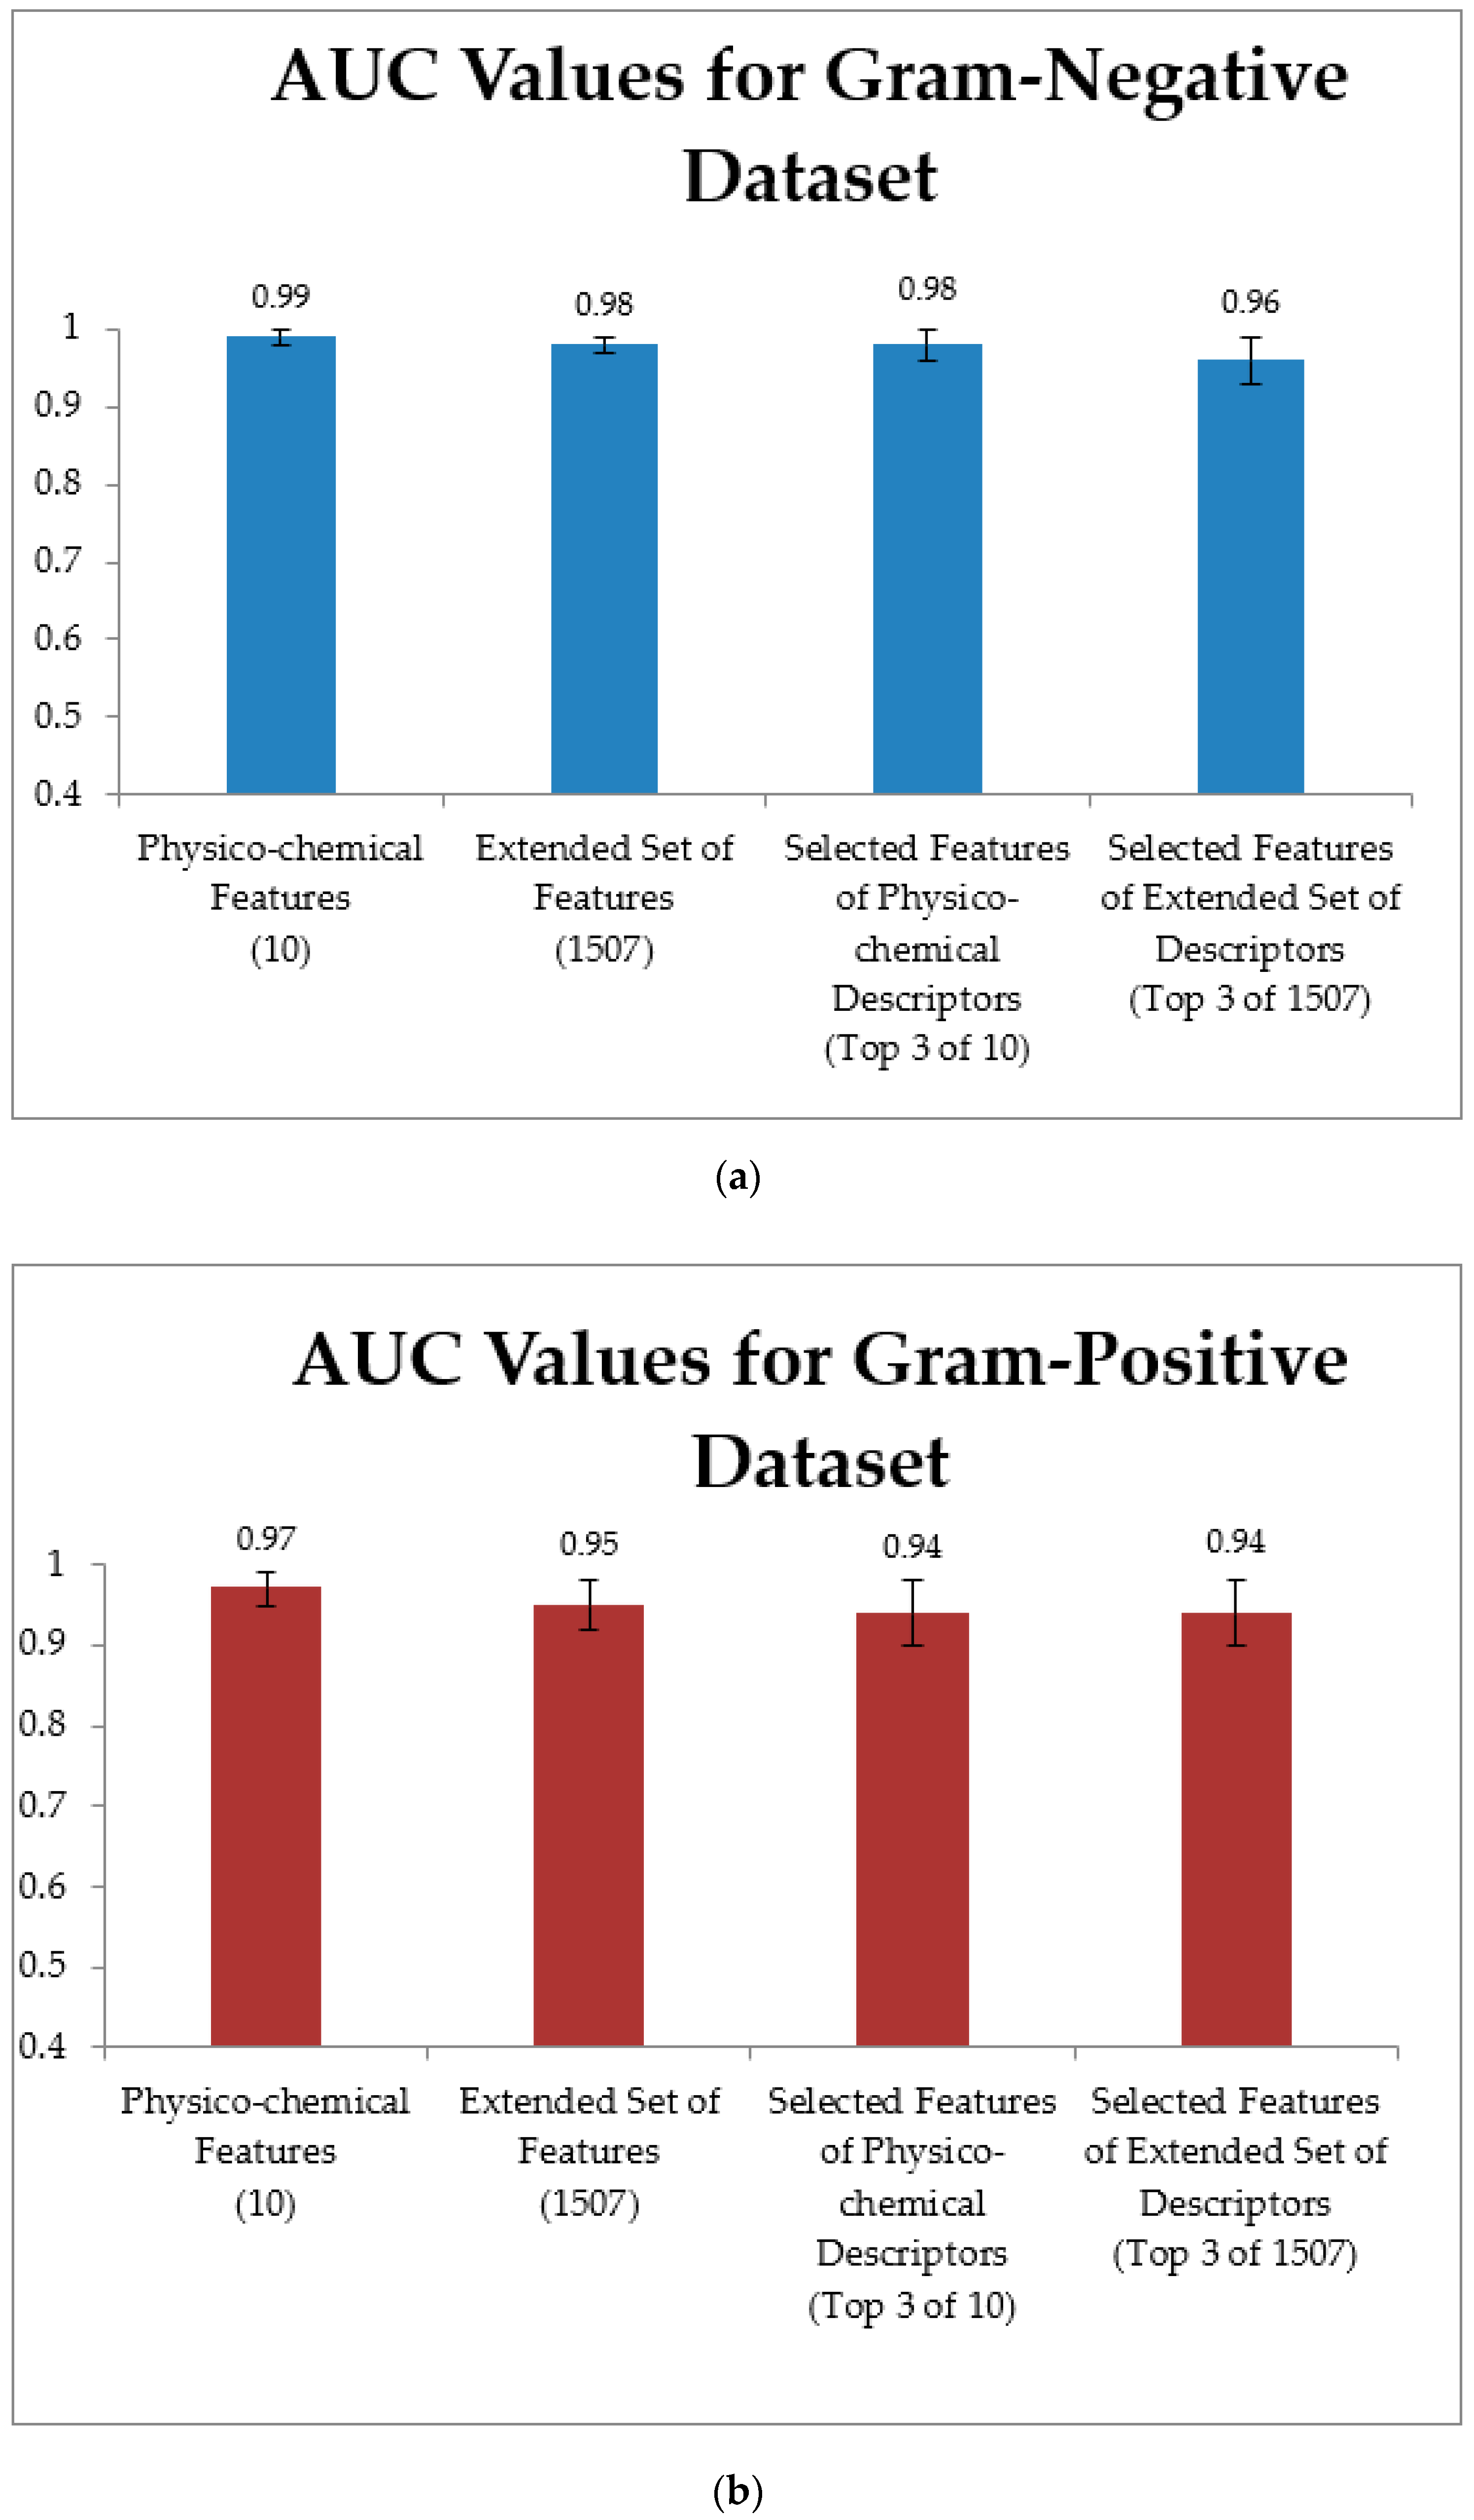
3.4. Training Models Using an Extended Set of Features and Applying Feature Selection

There are a high number of features (1507) in the extended feature set. To remove redundant features and select informative ones, we repeated our experiments with different feature selection methods including Information Gain (IG) [107], Maximum Relevance-Minimum Redundancy (MRMR) [108], Conditional Mutual Information Maximization (CMIM) [109], SelectKBest (SKB) [110], XGBoost (XGB) [111], Fast Correlation-Based Filter (FCBF) [112]. We have focused on the top 3 scoring features in both Gram-negative and Gram-positive datasets. The performance metrics obtained after feature selection are presented in Table 9 and Table 10 for Gram-negative and Gram-positive datasets, respectively. For the Gram-negative dataset, the generated LogitBoost model with the three selected features by XGBoost resulted in the best performance metric (96% AUC) among all other tested classifiers and all other tested feature selection methods. The top 3 selected features on the Gram-negative dataset are GearyAuto_Steric14 from Geary Autocorrelation set, PAAC42 from pseudo amino acid composition, and PolarityT13 from composition, transition, and distribution of physico-chemical properties. On the Gram-negative dataset, the performance of the physico-chemical feature set (99% AUC with RF with 10 features) was still higher than the performance of the extended feature set (98% AUC with LogitBoost with 1507 features), and also higher than the performance of the extended feature set after feature selection (96% AUC with LogitBoost with 3 features).
For the Gram-positive dataset, the generated RF model with the three selected features by Information Gain resulted in the best performance metric (94% AUC) among all other tested classifiers and all other tested feature selection methods. On the Gram-positive dataset, the performance of the physico-chemical feature set (97% AUC with RF with 10 features) was still higher than the performance of the extended feature set (95% AUC with RF with 1507 features), and also higher than the performance of the extended feature set after feature selection (94% AUC with RF with 3 features). It is interesting to note that on the Gram-positive dataset, the top 3 scoring features of the extended descriptors are isoelectric point, net charge, and disordered conformation propensity, which all belong to our initial 10 physico-chemical features.
When we compare the performance metrics before and after feature selection is applied on the extended set of features, we observed that for Gram-positive and for Gram-negative datasets, the AUC performance metrics only decreased by 1% and 2%, respectively, when three selected features are used to generate the model (as compared with the 1507 features included in the extended set of features). That is to say that using only 3 features yields satisfactory performance results (96% and 94% AUC) for Gram-negative and Gram-positive datasets, respectively.
Similarly, to compare the performance metrics of the models which use physico-chemical features with the models which use the extended set of features, we reduced the number of features in the original dataset to the same number of features (top 3 scoring features). For this purpose, we applied the same feature selection strategy on our original dataset which includes only physico-chemical features. We wanted to test whether a certain number of attributes will be sufficient for prediction. In Figure 9, we present the AUC values obtained using (i) 10 physico-chemical features, (ii) extended set of features (1507 features), (iii) top 3 scoring features of physico-chemical descriptors, and (iv) top 3 scoring features of extended descriptors. As illustrated in Figure 9a, for the Gram-negative dataset, the models which use the physico-chemical features yield the best AUC score (99%). For this dataset, the extended features and the top 3 scoring features (normalized hydrophobicity, normalized hydrophobic moment, net charge) of the physico-chemical features generate the same AUC values (98%). It can be observed from Figure 9b that on the Gram-positive dataset, the model which uses physico-chemical features achieves 97% AUC and hence obtains better performance metrics than the extended dataset and than the models using top 3 scoring features. On the Gram-positive dataset, the top 3 scoring features of physico-chemical descriptors are net charge, isoelectric point, and disordered conformation propensity.

4. Discussion

Antimicrobial peptides are characterized as positively charged, short-chain compounds which act against a wide range of microorganisms by interacting with the target cell components using different mechanisms [53]. The fact that AMPs have various mechanisms of action on the membrane makes bacterial resistance formation against them more complex compared to the conventional therapeutics. Therefore, AMPs are an attractive alternative to combat resistant bacteria [9]. However, AMPs derived from natural sources have some disadvantages such as low stability, salt tolerance, and high toxicity that limit their therapeutic applications. Computational studies on AMPs help us to better understand the effect of the physico-chemical properties of the peptides on stability and activity of AMPs. With the help of computational approaches in the study of AMPs, now it has become possible to overcome the above-mentioned difficulties and to design peptides with broad-spectrum activities and good stability [5].
In this study, a machine learning-based approach was developed for the first time to separately predict the peptides active against Gram-positive and Gram-negative bacteria. It is well known that Gram-positive and Gram-negative bacteria have different cell-surface architectures. For example, Gram-negative bacteria have a thin peptidoglycan cell wall, surrounded by an outer membrane mainly containing lipopolysaccharide. Gram-positive bacteria lack an outer membrane but the cell wall contains a thicker peptidoglycan layer and teichoic acids. Cell surface envelopes play a crucial role in the penetration and initial interaction of AMP. Therefore, the prediction of the antimicrobial activity of AMPs needs to be considered separately for these two different bacterial groups. For this purpose, in this study, two different data sets were created by selecting peptides that are active against (i) E. coli, P. aeruginosa, and A. baumannii species for Gram-negative bacteria and (ii) S. aureus, L. monocytogenes, and B. cereus species for Gram-positive bacteria.
As mentioned above, in this study, we have an important biological question. The whole study aims to answer this biological question via developing a specific classification model for AMP prediction, separately for Gram-positive and Gram-negative datasets. For this reason, we created a new AMP prediction dataset from publicly available DBAASP dataset by filtering for specific values (as shown in Figure 1 and as explained in detail in the Section 2.1). In this study, we have only focused on linear cationic antimicrobial peptides. Among these peptides, we selected the peptides having antimicrobial activity against above-mentioned species. For each peptide, in order to define the activity against a group of bacteria (positive class label), we have utilized MIC values. Since we focus on the membrane-targeting AMPs, we have selected the peptides with lengths ranging from 20 to 50 aa. Here we focused on non-hemolytic peptides because in therapeutic applications, the prediction of non-hemolytic peptides is reported as more important than the hemolytic peptides for the elimination of the detrimental effects of AMPs on the host. Since there are many peptides with very similar sequences, we eliminated those with a similarity rate of 80% or more using the CD-HIT program [52]. We carried out our classification procedure with the remaining peptides.
The antimicrobial activity of the peptides (AMP or non-AMP class) was predicted separately for each bacterial group by using different physico-chemical properties. For each bacterial group, different models were developed using different classification algorithms. We have experimented with several machine learning methods including Adaboost, Logitboost, Decision Tree, RF, SVM, and stacking classifiers using 100-fold MCCV. In our experiments using ten physico-chemical features, we have observed that RF outperforms other classifiers. As summarized in Table 2 and Table 3, 0.92 and 0.90 AUC values were obtained for Gram-negative and Gram-positive datasets, respectively. Additionally, in this research effort, for the first time, feature scoring and feature ranking were performed for Gram-positive and Gram-negative datasets separately, and the importance (score) of each feature in these two data sets were compared.
In order to understand the underlying structure of the data, we apply PCAon Gram-negative and Gram-positive datasets separately. The PCA results in Figure 6a–d show that when we visualize the AMP and non-AMP samples with PCA plots, we have noticed that there are some outlier samples (peptides) in both Gram-negative and positive datasets. In order to understand more in detail why these samples are outliers and to compile a more homogenous dataset, we have examined the physico-chemical features of the peptides. To see the distribution of each feature, we plotted histograms for the Gram-negative and the Gram-positive datasets separately (Figure 7a,b). Based on our analysis using such histograms, we define a certain range of values for each attribute for the positive class which represents the peptides having antimicrobial activity as illustrated in Table 4. While the peptides within the selected ranges are kept, other peptides are eliminated from our dataset. Once again, PCA visualization has been applied to this outlier eliminated dataset and it has been observed that the peptides can be better separated into two classes in this new dataset (Figure 8a–d). For this outlier eliminated dataset, all classification experiments have been repeated. As shown in Table 5 and Table 6, we have achieved higher performance metrics when outlier removal is applied.
The studies on the structure-activity relationship of AMPs emphasized that the antimicrobial activity is affected by changes in many structural and physico-chemical parameters such as net charge, hydrophobicity, and peptide chain length. Therefore, studying these properties of peptides and the similarities and differences between these features provide important insights for the development of new antimicrobial peptide prediction methods [113]. In this study, the net charge was found as the most important feature for the Gram-negative data set while it is identified as the second most important feature for the Gram-positive dataset. The net charge is an important feature that shows the affinity of cationic peptides to bind to anionic cell surface structures through electrostatic interactions. In other words, the positive charge of the cationic AMPs enables an electrostatic interaction with the negatively charged bacterial cell wall components [114]. The outer surface of the Gram-negative bacteria contains lipopolysaccharides (LPS), while Gram-positive bacteria contain acidic polysaccharides (teichoic acids). These structures confer a net negative charge to the surface of both Gram-positive and Gram-negative bacteria. In addition, the inner membrane of Gram-negative bacteria and the single membrane of Gram-positive bacteria are composed of negatively charged phospholipids. The net positive charge is the most conserved property of AMPs, making it possible to bind to the negatively charged outer surface of the bacteria [115]. Therefore, the net charge of AMPs has an essential role in the administration of peptide−membrane interactions resulting in the disruption of the membrane integrity [5]. The consistency of the results obtained with this computational study with the previous experimental results also supports the validity of the computational models created in this study. As mentioned above, Gram-positive and Gram-negative bacteria possess different cell wall components such as teichoic acid and lipopolysaccharides (LPSs). The difference in the importance of the net charge feature between the two datasets (peptides active against Gram-positive bacteria vs. peptides active against Gram-negative bacteria) may be due to the differences between the cell wall components of anionic characters.
On the other hand, for the Gram-positive dataset, the isoelectric point (pI) was found to be the most important feature, while it was the second most important feature for the Gram-negative dataset. The pI is defined as the pH at which the net charge of a protein/peptide is equal to zero. In other words, a protein has zero net charge at its isoelectric point. As the pH of the environment becomes closer to the isoelectric point of the peptide, the net charge on the peptide surface gradually decreases and peptide–peptide interaction increases. Proteins have minimum solubility at or near their isoelectric point while protein solubility increases when pH moves away from pI. The pI is a feature that is closely related to the peptide charge and directly affects solubility. When the pH is equal to the pI of the peptide, the peptide loses its solubility and hereby its biological function [116]. Therefore, pI has an important role to exhibit the AMP’s antimicrobial activity; pIs of the AMPs are generally at alkaline pH, and hereby maintain their activity at physiological pH. Therefore, the isoelectric point is another important feature that administers the antibacterial activity of AMPs [117,118,119,120]. Ahn et al. reported that rather than the net charge, pI was a better parameter for predicting the antibacterial activity [121]. Our results are in accordance with the previous literature, supporting the feature ranking analysis performed in this study. Along this line, the findings of this study support the idea that isoelectric point and the net charge are two main descriptors of antimicrobial peptides.
In our experiments, the above-mentioned two features were followed by the disordered conformation propensity, normalized hydrophobicity, and normalized hydrophobic moment features, respectively, for both bacterial groups. The majority of LCAMPs are disordered structures in aqueous solution and acquire their biologically active conformation upon interaction with the membrane. The majority of linear AMPs adapt to the alpha-helical conformation in lipid membrane environment, and this regular structure is important for antimicrobial activity for this AMP class [122]. Hence, the identification of disordered conformation propensity feature as the third important feature in our analysis makes sense in terms of the underlying biology.
Hydrophobicity and hydrophobic moment are two important physico-chemical features that affect the antimicrobial activity of AMPs. In this study, the effect of these determinants was found lower than expected. The hydrophobicity reflects the ratio of hydrophobic residues within a peptide sequence. In the first step of peptide–lipid interactions, AMPs attach to the cell surface by electrostatic interactions, and then the hydrophobic interactions become a primary driving force for their insertion and partitions into the lipid bilayer [123,124]. In general, the increase of hydrophobicity promotes antimicrobial activity in peptides [125]. However, some studies demonstrated that an increase above a certain level in hydrophobicity leads to a decrease in antimicrobial activity [125]. The hydrophobic moment is defined as a quantitative measure of peptide amphipathicity [126]. The amphipathic α-helical AMPs have polar and hydrophobic residues that are arranged in opposite faces. This arrangement facilitates the interactions of AMPs to membranes. The increase of the hydrophobic moment results in a significant elevation in antimicrobial activity, however, it also leads to cytotoxicity [124].
In addition to the physico-chemical descriptors, we have comparatively evaluated the effect of structure-based and sequence-based features on the classification performance. To this end, we have computed an extended set of features including amino acid composition, dipeptide composition, pseudo amino acid composition, CTD of physico-chemical properties, different autocorrelations, quasi-sequence-order descriptors, and sequence order coupling number, separately for Gram-positive and Gram-negative datasets. We have compared the performances of the models which use only the physico-chemical features with the models which use an extended set of features, separately for Gram-positive and Gram-negative datasets. As shown in Table 7 and Table 8, the addition of an extended set of features did not improve performance metrics, and even lowered the metrics slightly. For the Gram-positive dataset, when we applied feature selection on the extended set of features, we observed that all three selected features (isoelectric point, net charge, disordered conformation propensity) belong to the physico-chemical features category. Among 1507 different descriptors belonging to the structure-based, linguistic-based, sequence-based, and physico-chemical-based classes in the extended dataset, the identification of the three physico-chemical descriptors as the top three scoring features was noteworthy. These three physico-chemical descriptors are computed from sequence information only. A similar observation is reported for miRNAs in [127,128,129]. In these studies, it is shown for miRNAs that the use of sequence information only (k-mer representation) is just enough for the prediction, while different studies use structure information, motif representation, and k-mer for that purpose. Khabbaz et al. [61] imported AMPs with reported quantitative hemolytic activity from DBAASP and extracted 1541 features from physico-chemical, structure, and sequence categories. They trained models using SVM classifier with radial basis function (RBF) and Polynomial kernels, Linear Support Vector Classifier (LSVC), RF, Naïve Bayes and kNN. In their experiments, the top three scoring features (aggregation propensity, polarity, charge density) among the 1541 features belong to the physico-chemical category. They have also applied feature selection and reported the performance metrics for 90 selected features among 1541 features. Among the selected 90 features, three features (aggregation propensity in vivo, charge density, isoelectric point) in the top ten scoring features belong to the physico-chemical features. In their study, the performance metrics reported after feature selection (including 90 features) were very close to the performance metrics before applying feature selection (with 1541 features).
The models developed in this study were mainly based on physico-chemical features because as a continuation of this work, we are working on de novo antimicrobial peptide design by using the datasets that we have compiled in this study, and by using the classification models that we have developed in this study, separately for Gram-positive and Gram-negative datasets. Before synthesizing de novo peptides, we would like to computationally evaluate the antimicrobial activity of these candidate peptides using our classification model. During the wet-lab part of our future studies (when we synthesize those peptides), we need to know about those physico-chemical features. As a future work, once we identify a promising candidate (a de novo peptide), we plan to continue with the recombinant peptide production steps in wet-lab, and we plan to test the antimicrobial activity of this peptide against Gram-positive or Gram-negative bacteria in wet-lab.

5. Conclusions

The main contribution of this paper is the development of two accurate classification models for the prediction of antimicrobial peptides active against (i) Gram-negative and (ii) Gram-positive bacteria, separately. To this end, we have compiled two different datasets for (i) peptides active against Gram-negative bacteria and (ii) peptides active against Gram-positive bacteria, and evaluated different machine learning models for the prediction of antimicrobial peptide activity. In our experiments with 100-fold MCCV, the RF algorithm achieved better results compared to other algorithms for both datasets. At the end of our feature ranking procedure, the net charge was found as the most important feature for Gram-negative dataset and second most important feature for Gram-positive dataset. Moreover, for the Gram-positive dataset, the pI was found as the most important feature, while it was determined as the second most important feature for the Gram-negative dataset. In literature, both net charge and the isoelectric point of a peptide are known to have a considerable effect in terms of determining the activity of AMPs [119]. Hence, our findings are not contradictory with previous results which suggest that net charge and pI are the main factors for strong antimicrobial activity, and this situation further proves the validity of the computational models created in this study. The PCA visualization is applied on the Gram-negative and the Gram-positive dataset, and some outlier samples have been observed. Based on the distribution of the positive and negative labeled samples (peptides having antimicrobial activity vs. non-AMP peptides), certain ranges are defined for each attribute. In our secondary experiments, in which the peptides outside those ranges were eliminated (outlier detection), we observed that the AUC results increased by 7% for both the Gram-negative and Gram-positive dataset.
We repeated our experiments using an extended feature set including amino acid composition, pseudo amino acid composition, sequence order, autocorrelation, composition, distribution, and transition of physico-chemical properties. When we run our workflow on these extended feature sets, the performance metrics did not improve, and even lowered slightly. For the Gram-negative dataset, while the extended set of features yielded 98% AUC with LogitBoost, physico-chemical features yielded 99% AUC with RF. For the Gram-positive dataset, while the model using an extended set of features achieved 95% AUC with RF, the generated model using only ten physico-chemical features achieved 97% AUC. When we compared the performance metrics obtained using physico-chemical properties (10 features) with an extended set of features (1507 features), we observed that rather than using a large selection of features, a small number of features yielded better results on both Gram-negative and Gram-positive datasets.
Different feature selection methods are applied on the extended dataset for removing redundant features. It is worthwhile to note that for the Gram-positive dataset, among 1507 different descriptors belonging to the structure-based, linguistic-based, sequence-based, and physico-chemical-based classes in the extended dataset, all 3 selected features (isoelectric point, net charge, disordered conformation propensity) are physico-chemical descriptors. After the feature selection is applied on the extended dataset including 1507 features, the AUC values of the models using the top 3 scoring features decreased only by 1% and 2% for the Gram-positive and Gram-negative datasets, respectively. When we compare the performance metrics before and after feature selection is applied, we can deduce that using only 3 features yields satisfactory performance results (96% and 94% AUC) for Gram-negative and Gram-positive datasets, respectively. However, for both of the Gram-negative and Gram-positive datasets, the performance of the models using 10 physico-chemical features (99% and 97% AUC values respectively) was still higher than the performance of the extended feature set, and higher than the performance of the extended feature set after feature selection.
To conclude, AMPs are considered as the most promising alternatives to antibiotics. Therefore, accurate prediction of antimicrobial peptides contributes to the production of more effective peptides with lower costs. Additionally, since computational prediction approaches minimize the losses during production steps, they became popular in this field. In this respect, the classification model that we have developed in this study paves the way to the precise prediction and the design of antimicrobial peptides that are highly effective against specific bacterial pathogens. Even though the classification approach that we have developed here is only applied on the bacteria, it has the potential to be utilized for the prediction of antifungal, antivirus, antiprotozoal, and anticancer agents in future studies.

Supplementary Materials

The following supporting information can be downloaded at: https://www.mdpi.com/article/10.3390/app12073631/s1, Figure S1: Heatmap of Gram-negative dataset for pairwise correlation; Figure S2: Heatmap of Gram-positive dataset for pairwise correlation; Figure S3: Interactive 3D plot of Gram-negative dataset before outlier detection; Figure S4: Interactive 3D plot of Gram-positive dataset before outlier detection; Figure S5: Interactive 3D plot of Gram-negative dataset after outlier detection; Figure S6: Interactive 3D plot of Gram-positive dataset after outlier detection.

Author Contributions

Conceptualization, Z.K., M.E.B., B.B.-G., M.Y. and Ü.G.S.; methodology, Z.K., M.Y. and B.B.-G.; software, M.Y. and Ü.G.S.; validation, Ü.G.S. and M.Y.; formal analysis, Ü.G.S., B.B.-G. and M.Y.; investigation, Ü.G.S., Z.K. and B.B.-G.; resources, Ü.G.S., B.B.-G. and Z.K.; data curation, Z.K., M.E.B. and Ü.G.S.; writing—original draft preparation, Ü.G.S.; writing—review and editing, B.B.-G., Z.K., M.E.B. and M.Y.; visualization, Ü.G.S.; supervision, B.B.-G. and M.Y.; project administration, Z.K. and B.B.-G.; funding acquisition, M.Y., B.B.-G. and Z.K. All authors have read and agreed to the published version of the manuscript.

Funding

The work of M.Y. has been supported by the Zefat Academic College. The work of B.B.-G. has been supported by the Abdullah Gul University Support Foundation (AGUV). The works of Z.K. and M.E.B. have been supported by the TUBITAK 1001 program (Project No: 120Z565) to support scientific and technological research projects.

Institutional Review Board Statement

Not applicable.

Informed Consent Statement

Not applicable.

Data Availability Statement

The data are obtained from the Database of Antimicrobial Activity and Structure of Peptides (DBAASP) web server.

Conflicts of Interest

The authors declare no conflict of interest.

References

  1. Carnicelli, V.; Lizzi, A.R.; Ponzi, A.; Amicosante, G.; Bozzi, A.; Di Giulio, A. Interaction between antimicrobial peptides (AMPs) and their primary target, the biomembranes. In Microbial Pathogens and Strategies for Combating Them: Science, Technology and Education; Formatex Research Center: Badajoz, Spain, 2013; Volume 2, pp. 1123–1134. [Google Scholar]
  2. Brogden, N.K.; Brogden, K.A. Will new generations of modified antimicrobial peptides improve their potential as pharmaceuticals? Int. J. Antimicrob. Agents 2011, 38, 217–225. [Google Scholar] [CrossRef] [PubMed] [Green Version]
  3. Xie, F.; Wang, Y.; Li, G.; Liu, S.; Cui, N.; Liu, S.; Langford, P.R.; Wang, C. The SapA Protein Is Involved in Resistance to Antimicrobial Peptide PR-39 and Virulence of Actinobacillus pleuropneumoniae. Front. Microbiol. 2017, 8, 811. [Google Scholar] [CrossRef] [PubMed]
  4. Neubauer, D.; Jaśkiewicz, M.; Migoń, D.; Bauer, M.; Sikora, K.; Sikorska, E.; Kamysz, E.; Kamysz, W. Retro analog concept: Comparative study on physico-chemical and biological properties of selected antimicrobial peptides. Amino Acids 2017, 49, 1755–1771. [Google Scholar] [CrossRef] [Green Version]
  5. Büyükkiraz, M.E.; Kesmen, Z. Antimicrobial peptides (AMPs): A promising class of antimicrobial compounds. J. Appl. Microbiol. 2021, 132, 1573–1596. [Google Scholar] [CrossRef] [PubMed]
  6. Mishra, B.; Wang, G. Ab Initio Design of Potent Anti-MRSA Peptides Based on Database Filtering Technology. J. Am. Chem. Soc. 2012, 134, 12426–12429. [Google Scholar] [CrossRef] [PubMed] [Green Version]
  7. Faccone, D.; Veliz, O.; Corso, A.; Noguera, M.; Martínez, M.; Payes, C.; Semorile, L.; Maffía, P.C. Antimicrobial activity of de novo designed cationic peptides against multi-resistant clinical isolates. Eur. J. Med. Chem. 2014, 71, 31–35. [Google Scholar] [CrossRef] [PubMed] [Green Version]
  8. Chen, C.H.; Starr, C.G.; Troendle, E.P.; Wiedman, G.; Wimley, W.C.; Ulmschneider, J.P.; Ulmschneider, M.B. Simulation-Guided Rational de Novo Design of a Small Pore-Forming Antimicrobial Peptide. J. Am. Chem. Soc. 2019, 141, 4839–4848. [Google Scholar] [CrossRef]
  9. Vishnepolsky, B.; Zaalishvili, G.; Karapetian, M.; Nasrashvili, T.; Kuljanishvili, N.; Gabrielian, A.; Rosenthal, A.; Hurt, D.E.; Tartakovsky, M.; Grigolava, M.; et al. De Novo Design and In Vitro Testing of Antimicrobial Peptides against Gram-Negative Bacteria. Pharmaceuticals 2019, 12, 82. [Google Scholar] [CrossRef] [PubMed] [Green Version]
  10. Loose, C.; Jensen, K.; Rigoutsos, I.; Stephanopoulos, G. A linguistic model for the rational design of antimicrobial peptides. Nature 2006, 443, 867–869. [Google Scholar] [CrossRef]
  11. Nagarajan, D.; Nagarajan, T.; Roy, N.; Kulkarni, O.; Ravichandran, S.; Mishra, M.; Chakravortty, D.; Chandra, N. Computational antimicrobial peptide design and evaluation against multidrug-resistant clinical isolates of bacteria. J. Biol. Chem. 2018, 293, 3492–3509. [Google Scholar] [CrossRef] [PubMed] [Green Version]
  12. Cardoso, M.H.; Cândido, E.S.; Chan, L.Y.; Torres, M.D.T.; Oshiro, K.G.N.; Rezende, S.B.; Porto, W.F.; Lu, T.K.; de la Fuente-Nunez, C.; Craik, D.J.; et al. A Computationally Designed Peptide Derived from Escherichia coli as a Potential Drug Template for Antibacterial and Antibiofilm Therapies. ACS Infect. Dis. 2018, 4, 1727–1736. [Google Scholar] [CrossRef] [PubMed]
  13. Cândido, E.D.S.; Cardoso, M.H.; Chan, L.Y.; Torres, M.; Oshiro, K.G.N.; Porto, W.F.; Ribeiro, S.; Haney, E.F.; Hancock, R.; Lu, T.K.; et al. Short Cationic Peptide Derived from Archaea with Dual Antibacterial Properties and Anti-Infective Potential. ACS Infect. Dis. 2019, 5, 1081–1086. [Google Scholar] [CrossRef] [PubMed]
  14. Fensterseifer, I.C.; Felício, M.R.; Alves, E.S.; Cardoso, M.; Torres, M.; Matos, C.O.; Silva, O.N.; Lu, T.K.; Freire, M.V.; Neves, N.C.; et al. Selective antibacterial activity of the cationic peptide PaDBS1R6 against Gram-negative bacteria. Biochim. Biophys. Acta (BBA)—Biomembr. 2019, 1861, 1375–1387. [Google Scholar] [CrossRef] [PubMed]
  15. Oshiro, K.G.N.; Cândido, E.S.; Chan, L.Y.; Torres, M.D.T.; Monges, B.E.D.; Rodrigues, S.G.; Porto, W.F.; Ribeiro, S.M.; Henriques, S.T.; Lu, T.K.; et al. Computer-Aided Design of Mastoparan-like Peptides Enables the Generation of Nontoxic Variants with Extended Antibacterial Properties. J. Med. Chem. 2019, 62, 8140–8151. [Google Scholar] [CrossRef] [PubMed]
  16. Fjell, C.D.; Jenssen, H.; Cheung, W.; Hancock, R.; Cherkasov, A. Optimization of Antibacterial Peptides by Genetic Algorithms and Cheminformatics. Chem. Biol. Drug Des. 2010, 77, 48–56. [Google Scholar] [CrossRef] [PubMed]
  17. Maccari, G.; Di Luca, M.; Nifosì, R.; Cardarelli, F.; Signore, G.; Boccardi, C.; Bifone, A. Antimicrobial Peptides Design by Evolutionary Multiobjective Optimization. PLoS Comput. Biol. 2013, 9, e1003212. [Google Scholar] [CrossRef] [PubMed] [Green Version]
  18. Porto, W.F.; Irazazabal, L.; Alves, E.S.F.; Ribeiro, S.M.; Matos, C.O.; Pires, Á.S.; Fensterseifer, I.C.M.; Miranda, V.J.; Haney, E.F.; Humblot, V.; et al. In silico optimization of a guava antimicrobial peptide enables combinatorial exploration for peptide design. Nat. Commun. 2018, 9, 1490. [Google Scholar] [CrossRef]
  19. Yoshida, M.; Hinkley, T.; Tsuda, S.; Abul-Haija, Y.; McBurney, R.T.; Kulikov, V.; Mathieson, J.S.; Reyes, S.G.; Castro, M.D.; Cronin, L. Using Evolutionary Algorithms and Machine Learning to Explore Sequence Space for the Discovery of Antimicrobial Peptides. Chem 2018, 4, 533–543. [Google Scholar] [CrossRef] [Green Version]
  20. Liu, S.; Fan, L.; Sun, J.; Lao, X.; Zheng, H. Computational resources and tools for antimicrobial peptides. J. Pept. Sci. 2017, 23, 4–12. [Google Scholar] [CrossRef] [PubMed]
  21. Xiao, X.; Wang, P.; Lin, W.-Z.; Jia, J.-H.; Chou, K.-C. iAMP-2L: A two-level multi-label classifier for identifying antimicrobial peptides and their functional types. Anal. Biochem. 2013, 436, 168–177. [Google Scholar] [CrossRef] [PubMed]
  22. Schierz, A.C. Virtual screening of bioassay data. J. Cheminform. 2009, 1, 21. [Google Scholar] [CrossRef] [PubMed] [Green Version]
  23. Bhadra, P.; Yan, J.; Li, J.; Fong, S.; Siu, S.W.I. AmPEP: Sequence-based prediction of antimicrobial peptides using distribution patterns of amino acid properties and random forest. Sci. Rep. 2018, 8, 1697. [Google Scholar] [CrossRef] [Green Version]
  24. Lata, S.; Mishra, N.K.; Raghava, G.P. AntiBP2: Improved version of antibacterial peptide prediction. BMC Bioinform. 2010, 11, S19. [Google Scholar] [CrossRef] [PubMed] [Green Version]
  25. Dhall, D.; Kaur, R.; Juneja, M. Machine Learning: A Review of the Algorithms and Its Applications. In Proceedings of ICRIC 2019; Springer: Cham, Switzerland, 2020; pp. 47–63. [Google Scholar]
  26. Lee, E.Y.; Lee, M.W.; Fulan, B.M.; Ferguson, A.L.; Wong, G.C.L. What can machine learning do for antimicrobial peptides, and what can antimicrobial peptides do for machine learning? Interface Focus 2017, 7, 20160153. [Google Scholar] [CrossRef] [PubMed]
  27. Burdukiewicz, M.; Sidorczuk, K.; Rafacz, D.; Pietluch, F.; Chilimoniuk, J.; Rödiger, S.; Gagat, P. Proteomic Screening for Prediction and Design of Antimicrobial Peptides with AmpGram. Int. J. Mol. Sci. 2020, 21, 4310. [Google Scholar] [CrossRef]
  28. Chung, C.-R.; Jhong, J.-H.; Wang, Z.; Chen, S.; Wan, Y.; Horng, J.-T.; Lee, T.-Y. Characterization and Identification of Natural Antimicrobial Peptides on Different Organisms. Int. J. Mol. Sci. 2020, 21, 986. [Google Scholar] [CrossRef] [PubMed] [Green Version]
  29. Wang, P.; Hu, L.; Liu, G.; Jiang, N.; Chen, X.; Xu, J.; Zheng, W.; Li, L.; Tan, M.; Chen, Z.; et al. Prediction of Antimicrobial Peptides Based on Sequence Alignment and Feature Selection Methods. PLoS ONE 2011, 6, e18476. [Google Scholar] [CrossRef] [PubMed]
  30. Agrawal, P.; Raghava, G.P.S. Prediction of Antimicrobial Potential of a Chemically Modified Peptide From Its Tertiary Structure. Front. Microbiol. 2018, 9, 2551. [Google Scholar] [CrossRef] [PubMed] [Green Version]
  31. Gull, S.; Shamim, N.; Minhas, F. AMAP: Hierarchical multi-label prediction of biologically active and antimicrobial peptides. Comput. Biol. Med. 2019, 107, 172–181. [Google Scholar] [CrossRef] [PubMed]
  32. Torrent, M.; Nogués, V.M.; Boix, E. A theoretical approach to spot active regions in antimicrobial proteins. BMC Bioinform. 2009, 10, 373. [Google Scholar] [CrossRef] [PubMed] [Green Version]
  33. Waghu, F.H.; Barai, R.S.; Gurung, P.; Idicula-Thomas, S. CAMP R3: A database on sequences, structures and signatures of antimicrobial peptides: Table 1. Nucleic Acids Res. 2016, 44, D1094–D1097. [Google Scholar] [CrossRef] [PubMed] [Green Version]
  34. Lin, W.; Xu, D. Imbalanced multi-label learning for identifying antimicrobial peptides and their functional types. Bioinformatics 2016, 32, 3745–3752. [Google Scholar] [CrossRef] [PubMed]
  35. Yan, J.; Bhadra, P.; Li, A.; Sethiya, P.; Qin, L.; Tai, H.K.; Wong, K.H.; Siu, S.W. Deep-AmPEP30: Improve Short Antimicrobial Peptides Prediction with Deep Learning. Mol. Ther.-Nucleic Acids 2020, 20, 882–894. [Google Scholar] [CrossRef] [PubMed]
  36. Su, X.; Xu, J.; Yin, Y.; Quan, X.; Zhang, H. Antimicrobial peptide identification using multi-scale convolutional network. BMC Bioinform. 2019, 20, 730. [Google Scholar] [CrossRef] [Green Version]
  37. Schneider, P.; Müller, A.T.; Gabernet, G.; Button, A.L.; Posselt, G.; Wessler, S.; Hiss, J.A.; Schneider, G. Hybrid Network Model for “Deep Learning” of Chemical Data: Application to Antimicrobial Peptides. Mol. Inform. 2017, 36, 1600011. [Google Scholar] [CrossRef] [PubMed]
  38. Witten, J.; Witten, Z. Deep learning regression model for antimicrobial peptide design. bioRxiv 2019, 692681. [Google Scholar] [CrossRef] [Green Version]
  39. Beltran, J.A.; Aguilera-Mendoza, L.; Brizuela, C.A. Optimal selection of molecular descriptors for antimicrobial peptides classification: An evolutionary feature weighting approach. BMC Genom. 2018, 19, 672. [Google Scholar] [CrossRef] [PubMed]
  40. Fu, H.; Cao, Z.; Li, M.; Wang, S. ACEP: Improving antimicrobial peptides recognition through automatic feature fusion and amino acid embedding. BMC Genom. 2020, 21, 597. [Google Scholar] [CrossRef] [PubMed]
  41. Müller, A.T.; Kaymaz, A.C.; Gabernet, G.; Posselt, G.; Wessler, S.; Hiss, J.A.; Schneider, G. Sparse Neural Network Models of Antimicrobial Peptide-Activity Relationships. Mol. Inform. 2016, 35, 606–614. [Google Scholar] [CrossRef] [PubMed]
  42. Hamid, M.-N.; Friedberg, I. Identifying antimicrobial peptides using word embedding with deep recurrent neural networks. Bioinformatics 2019, 35, 2009–2016. [Google Scholar] [CrossRef] [PubMed] [Green Version]
  43. Li, C.; Sutherland, D.; Hammond, S.A.; Yang, C.; Taho, F.; Bergman, L.; Houston, S.; Warren, R.L.; Wong, T.; Hoang, L.M.N.; et al. AMPlify: Attentive deep learning model for discovery of novel antimicrobial peptides effective against WHO priority pathogens. BMC Genom. 2022, 23, 77. [Google Scholar] [CrossRef] [PubMed]
  44. Liu, S.; Bao, J.; Lao, X.; Zheng, H. Novel 3D Structure Based Model for Activity Prediction and Design of Antimicrobial Peptides. Sci. Rep. 2018, 8, 11189. [Google Scholar] [CrossRef] [PubMed]
  45. Capecchi, A.; Cai, X.; Personne, H.; Köhler, T.; van Delden, C.; Reymond, J.-L. Machine learning designs non-hemolytic antimicrobial peptides. Chem. Sci. 2021, 12, 9221–9232. [Google Scholar] [CrossRef] [PubMed]
  46. Vishnepolsky, B.; Gabrielian, A.; Rosenthal, A.; Hurt, D.E.; Tartakovsky, M.; Managadze, G.; Grigolava, M.; Makhatadze, G.I.; Pirtskhalava, M. Predictive Model of Linear Antimicrobial Peptides Active against Gram-Negative Bacteria. J. Chem. Inf. Model. 2018, 58, 1141–1151. [Google Scholar] [CrossRef] [PubMed]
  47. Vishnepolsky, B.; Grigolava, M.; Zaalishvili, G.; Karapetian, M.; Pirtskhalava, M. DBAASP Special prediction as a tool for the prediction of antimicrobial potency against particular target species. In Proceedings of the 4th International Electronic Conference on Medicinal Chemistry, Basel, Switzerland, 1–30 November 2018. [Google Scholar]
  48. Plisson, F.; Ramírez-Sánchez, O.; Martínez-Hernández, C. Machine learning-guided discovery and design of non-hemolytic peptides. Sci. Rep. 2020, 10, 16581. [Google Scholar] [CrossRef] [PubMed]
  49. Ohtsuka, Y.; Inagaki, H. In silico identification and functional validation of linear cationic α-helical antimicrobial peptides in the ascidian Ciona intestinalis. Sci. Rep. 2020, 10, 12619. [Google Scholar] [CrossRef]
  50. Wiegand, I.; Hilpert, K.; Hancock, R.E.W. Agar and broth dilution methods to determine the minimal inhibitory concentration (MIC) of antimicrobial substances. Nat. Protoc. 2008, 3, 163–175. [Google Scholar] [CrossRef]
  51. Li, W.; Godzik, A. Cd-hit: A fast program for clustering and comparing large sets of protein or nucleotide sequences. Bioinformatices 2006, 22, 1658–1659. [Google Scholar] [CrossRef] [Green Version]
  52. Vishnepolsky, B.; Pirtskhalava, M. Comment on: ‘Empirical comparison of web-based antimicrobial peptide prediction tools’. Bioinformatics 2019, 35, 2692–2694. [Google Scholar] [CrossRef]
  53. Lee, J.H.; Chung, H.; Shin, Y.P.; Kim, I.-W.; Natarajan, S.; Veerappan, K.; Seo, M.; Park, J.; Hwang, J.S. Transcriptome Analysis of Psacothea hilaris: De Novo Assembly and Antimicrobial Peptide Prediction. Insects 2020, 11, 676. [Google Scholar] [CrossRef]
  54. Fernandes, F.C.; Rigden, D.; Franco, O.L. Prediction of antimicrobial peptides based on the adaptive neuro-fuzzy inference system application. Biopolymers 2012, 98, 280–287. [Google Scholar] [CrossRef]
  55. Veltri, D.; Kamath, U.; Shehu, A. Deep learning improves antimicrobial peptide recognition. Bioinformatics 2018, 34, 2740–2747. [Google Scholar] [CrossRef] [Green Version]
  56. Gautam, A.; Sharma, A.; Jaiswal, S.; Fatma, S.; Arora, V.; Iquebal, M.A.; Nandi, S.; Sundaray, J.K.; Jayasankar, P.; Rai, A.; et al. Development of Antimicrobial Peptide Prediction Tool for Aquaculture Industries. Probiotics Antimicrob. Proteins 2016, 8, 141–149. [Google Scholar] [CrossRef]
  57. Gabere, M.N.; Noble, W.S. Empirical comparison of web-based antimicrobial peptide prediction tools. Bioinformatics 2017, 33, 1921–1929. [Google Scholar] [CrossRef] [PubMed]
  58. Waghu, F.H.; Gopi, L.; Barai, R.S.; Ramteke, P.; Nizami, B.; Idicula-Thomas, S. CAMP: Collection of sequences and structures of antimicrobial peptides. Nucleic Acids Res. 2014, 42, D1154–D1158. [Google Scholar] [CrossRef] [PubMed] [Green Version]
  59. Yu, X.-Y.; Fu, R.; Luo, P.-Y.; Hong, Y.; Huang, Y.-H. Construction and Prediction of Antimicrobial Peptide Predicition Model Based on BERT. Available online: https://jasonyanglu.github.io/files/lecture_notes/%E6%B7%B1%E5%BA%A6%E5%AD%A6%E4%B9%A0_2020/Project/Construction%20and%20Prediction%20of%20Antimicrobial%20Peptide.pdf (accessed on 16 December 2021).
  60. Spänig, S.; Heider, D. Encodings and models for antimicrobial peptide classification for multi-resistant pathogens. BioData Min. 2019, 12, 7. [Google Scholar] [CrossRef] [PubMed] [Green Version]
  61. Khabbaz, H.; Karimi-Jafari, M.H.; Saboury, A.A.; BabaAli, B. Prediction of antimicrobial peptides toxicity based on their physico-chemical properties using machine learning techniques. BMC Bioinform. 2021, 22, 549. [Google Scholar] [CrossRef] [PubMed]
  62. Moretta, A.; Salvia, R.; Scieuzo, C.; Di Somma, A.; Vogel, H.; Pucci, P.; Sgambato, A.; Wolff, M.; Falabella, P. A bioinformatic study of antimicrobial peptides identified in the Black Soldier Fly (BSF) Hermetia illucens (Diptera: Stratiomyidae). Sci. Rep. 2020, 10, 16875. [Google Scholar] [CrossRef] [PubMed]
  63. Vishnepolsky, B.; Pirtskhalava, M. Prediction of Linear Cationic Antimicrobial Peptides Based on Characteristics Responsible for Their Interaction with the Membranes. J. Chem. Inf. Model. 2014, 54, 1512–1523. [Google Scholar] [CrossRef] [PubMed]
  64. Thakur, N.; Qureshi, A.; Kumar, M. AVPpred: Collection and prediction of highly effective antiviral peptides. Nucleic Acids Res. 2012, 40, W199–W204. [Google Scholar] [CrossRef] [Green Version]
  65. Lira, F.; Perez, P.S.; Baranauskas, J.A.; Nozawa, S.R. Prediction of Antimicrobial Activity of Synthetic Peptides by a Decision Tree Model. Appl. Environ. Microbiol. 2013, 79, 3156–3159. [Google Scholar] [CrossRef] [PubMed] [Green Version]
  66. Pane, K.; Durante, L.; Crescenzi, O.; Cafaro, V.; Pizzo, E.; Varcamonti, M.; Zanfardino, A.; Izzo, V.; Di Donato, A.; Notomista, E. Antimicrobial potency of cationic antimicrobial peptides can be predicted from their amino acid composition: Application to the detection of “cryptic” antimicrobial peptides. J. Theor. Biol. 2017, 419, 254–265. [Google Scholar] [CrossRef] [PubMed]
  67. Chen, Z.; Zhao, P.; Li, F.; Marquez-Lago, T.T.; Leier, A.; Revote, J.; Zhu, Y.; Powell, D.R.; Akutsu, T.; Webb, G.I.; et al. iLearn: An integrated platform and meta-learner for feature engineering, machine-learning analysis and modeling of DNA, RNA and protein sequence data. Briefings Bioinform. 2020, 21, 1047–1057. [Google Scholar] [CrossRef] [PubMed]
  68. Muhammod, R.; Ahmed, S.; Farid, D.M.; Shatabda, S.; Sharma, A.; Dehzangi, A. PyFeat: A Python-based effective feature generation tool for DNA, RNA and protein sequences. Bioinformatics 2019, 35, 3831–3833. [Google Scholar] [CrossRef] [PubMed] [Green Version]
  69. Nikam, R.; Gromiha, M.M. Seq2Feature: A comprehensive web-based feature extraction tool. Bioinformatics 2019, 35, 4797–4799. [Google Scholar] [CrossRef] [PubMed]
  70. Cao, D.-S.; Xu, Q.-S.; Liang, Y.-Z. Propy: A tool to generate various modes of Chou’s PseAAC. Bioinformatics 2013, 29, 960–962. [Google Scholar] [CrossRef] [PubMed] [Green Version]
  71. Chen, Z.; Zhao, P.; Li, F.; Leier, A.; Marquez-Lago, T.T.; Wang, Y.; Webb, G.I.; Smith, A.I.; Daly, R.J.; Chou, K.-C.; et al. iFeature: A Python package and web server for features extraction and selection from protein and peptide sequences. Bioinformatics 2018, 34, 2499–2502. [Google Scholar] [CrossRef] [PubMed] [Green Version]
  72. Dong, J.; Yao, Z.-J.; Zhang, L.; Luo, F.; Lin, Q.; Lu, A.-P.; Chen, A.F.; Cao, D.-S. PyBioMed: A python library for various molecular representations of chemicals, proteins and DNAs and their interactions. J. Cheminform. 2018, 10, 16. [Google Scholar] [CrossRef] [Green Version]
  73. Mahmud, S.H.; Chen, W.; Meng, H.; Jahan, H.; Liu, Y.; Hasan, S.M. Prediction of drug-target interaction based on protein features using undersampling and feature selection techniques with boosting. Anal. Biochem. 2020, 589, 113507. [Google Scholar] [CrossRef] [PubMed]
  74. Yeh, S.-J.; Lin, J.-F.; Chen, B.-S. Multiple-Molecule Drug Design Based on Systems Biology Approaches and Deep Neural Network to Mitigate Human Skin Aging. Molecules 2021, 26, 3178. [Google Scholar] [CrossRef]
  75. Yeh, S.-J.; Chung, Y.-C.; Chen, B.-S. Investigating the Role of Obesity in Prostate Cancer and Identifying Biomarkers for Drug Discovery: Systems Biology and Deep Learning Approaches. Molecules 2022, 27, 900. [Google Scholar] [CrossRef]
  76. Wani, M.A.; Garg, P.; Roy, K.K. Machine learning-enabled predictive modeling to precisely identify the antimicrobial peptides. Med. Biol. Eng. Comput. 2021, 59, 2397–2408. [Google Scholar] [CrossRef] [PubMed]
  77. Freund, Y.; Schapire, R.E. A Short Introduction to Boosting. J. Jpn. Soc. Artif. Intell. 1999, 14, 771–780. [Google Scholar]
  78. Friedman, J.; Hastie, T.; Tibshirani, R. Additive logistic regression: A statistical view of boosting (With discussion and a rejoinder by the authors). Ann. Stat. 2000, 28, 337–407. [Google Scholar] [CrossRef]
  79. Breiman, L.; Friedman, J.H.; Olshen, R.A.; Stone, C.J. Classification and Regression Trees, 1st ed.; Routledge: Boca Raton, FL, USA, 2017. [Google Scholar] [CrossRef]
  80. Ho, T.K. Random Decision Forests. In Proceedings of the 3rd International Conference on Document Analysis and Recognition, Montreal, QC, Canada, 14–16 August 1995; pp. 278–282. [Google Scholar] [CrossRef]
  81. Cortes, C.; Vapnik, V. Support-vector networks. Mach. Learn. 1995, 20, 273–297. [Google Scholar] [CrossRef]
  82. Fix, E.; Hodges, J.L. Discriminatory Analysis. Nonparametric Discrimination: Consistency Properties. Int. Stat. Rev. Rev. Int. Stat. 1989, 57, 238–247. [Google Scholar] [CrossRef]
  83. Berthold, M.R.; Cebron, N.; Dill, F.; Gabriel, T.R.; Kötter, T.; Meinl, T.; Ohl, P.; Thiel, K.; Wiswedel, B. KNIME—The Konstanz information miner. ACM SIGKDD Explor. Newsl. 2009, 11, 26–31. [Google Scholar] [CrossRef] [Green Version]
  84. Randles, B.M.; Pasquetto, I.V.; Golshan, M.S.; Borgman, C.L. Using the Jupyter Notebook as a Tool for Open Science: An Empirical Study. In Proceedings of the 2017 ACM/IEEE Joint Conference on Digital Libraries (JCDL), Toronto, ON, Canada, 19–23 June 2017; pp. 1–2. [Google Scholar]
  85. Xu, Q.-S.; Liang, Y.-Z. Monte Carlo cross validation. Chemom. Intell. Lab. Syst. 2001, 56, 1–11. [Google Scholar] [CrossRef]
  86. Jovic, A.; Brkic, K.; Bogunovic, N. A review of feature selection methods with applications. In Proceedings of the 2015 38th International Convention on Information and Communication Technology, Electronics and Microelectronics (MIPRO), Opatija, Croatia, 25–29 May 2015; pp. 1200–1205. [Google Scholar]
  87. Yousef, M.; Jung, S.; Showe, L.C.; Showe, M.K. Recursive Cluster Elimination (RCE) for classification and feature selection from gene expression data. BMC Bioinform. 2007, 8, 144. [Google Scholar] [CrossRef] [Green Version]
  88. Yousef, M.; Bakir-Gungor, B.; Jabeer, A.; Goy, G.; Qureshi, R.; Showe, L.C. Recursive Cluster Elimination based Rank Function (SVM-RCE-R) implemented in KNIME. F1000Research 2021, 9, 1255. [Google Scholar] [CrossRef] [PubMed]
  89. Yousef, M.; Jabeer, A.; Bakir-Gungor, B. SVM-RCE-R-OPT: Optimization of Scoring Function for SVM-RCE-R. In Database and Expert Systems Applications—DEXA 2021 Workshops; Kotsis, G., Tjoa, A.M., Khalil, I., Moser, B., Mashkoor, A., Sametinger, J., Fensel, A., Martinez-Gil, J., Fischer, L., Czech, G., et al., Eds.; Springer International Publishing: Cham, Switzerland, 2021; Volume 1479, pp. 215–224. [Google Scholar] [CrossRef]
  90. Yousef, M.; Abdallah, L.; Allmer, J.; Abddallah, L. maTE: Discovering expressed interactions between microRNAs and their targets. Bioinformatics 2019, 35, 4020–4028. [Google Scholar] [CrossRef] [PubMed]
  91. Yousef, M.; Ülgen, E.; Sezerman, O.U. CogNet: Classification of gene expression data based on ranked active-subnetwork-oriented KEGG pathway enrichment analysis. PeerJ Comput. Sci. 2021, 7, e336. [Google Scholar] [CrossRef] [PubMed]
  92. Yousef, M.; Goy, G.; Mitra, R.; Eischen, C.M.; Jabeer, A.; Bakir-Gungor, B. miRcorrNet: Machine learning-based integration of miRNA and mRNA expression profiles, combined with feature grouping and ranking. PeerJ 2021, 9, e11458. [Google Scholar] [CrossRef] [PubMed]
  93. Yousef, M.; Goy, G.; Bakir-Gungor, B. miRModuleNet: Detecting miRNA-mRNA Regulatory Modules. Front. Genet. 2022, 13, 767455. [Google Scholar] [CrossRef]
  94. Yousef, M.; Sayıcı, A.; Bakir-Gungor, B. Integrating Gene Ontology Based Grouping and Ranking into the Machine Learning Algorithm for Gene Expression Data Analysis. In Database and Expert Systems Applications—DEXA 2021 Workshops; Kotsis, G., Tjoa, A.M., Khalil, I., Moser, B., Mashkoor, A., Sametinger, J., Fensel, A., Martinez-Gil, J., Fischer, L., Czech, G., et al., Eds.; Springer International Publishing: Cham, Switzerland, 2021; pp. 205–214. [Google Scholar] [CrossRef]
  95. Yousef, M.; Kumar, A.; Bakir-Gungor, B. Application of Biological Domain Knowledge Based Feature Selection on Gene Expression Data. Entropy 2020, 23, 2. [Google Scholar] [CrossRef] [PubMed]
  96. Pearson, K. On lines and planes of closest fit to systems of points in space. Lond. Edinb. Dublin Philos. Mag. J. Sci. 1901, 2, 559–572. [Google Scholar] [CrossRef] [Green Version]
  97. Porto, W.F.; Pires, Á.S.; Franco, O.L. CS-AMPPred: An Updated SVM Model for Antimicrobial Activity Prediction in Cysteine-Stabilized Peptides. PLoS ONE 2012, 7, e51444. [Google Scholar] [CrossRef] [PubMed]
  98. Shu, M.; Yu, R.; Zhang, Y.; Wang, J.; Yang, L.; Wang, L.; Lin, Z. Predicting the Activity of Antimicrobial Peptides with Amino Acid Topological Information. Med. Chem. 2013, 9, 32–44. [Google Scholar] [CrossRef] [PubMed]
  99. Moll, L.; Badosa, E.; Planas, M.; Feliu, L.; Montesinos, E.; Bonaterra, A. Antimicrobial Peptides with Antibiofilm Activity against Xylella fastidiosa. Front. Microbiol. 2021, 12, 753874. [Google Scholar] [CrossRef]
  100. Lin, H.; Yan, T.; Wang, L.; Guo, F.; Ning, G.; Xiong, M. Statistical design, structural analysis, andin vitrosusceptibility assay of antimicrobial peptoids to combat bacterial infections. J. Chemom. 2016, 30, 369–376. [Google Scholar] [CrossRef]
  101. Thudumu, S.; Branch, P.; Jin, J.; Singh, J. A comprehensive survey of anomaly detection techniques for high dimensional big data. J. Big Data 2020, 7, 1–30. [Google Scholar] [CrossRef]
  102. Manevitz, L.M.; Yousef, M. One-Class SVMs for Document Classification. J. Mach. Learn. Res. 2001, 2, 139–154. [Google Scholar]
  103. Manevitz, L.; Yousef, M. One-class document classification via Neural Networks. Neurocomputing 2007, 70, 1466–1481. [Google Scholar] [CrossRef]
  104. Abdallah, L.; Badarna, M.; Khalifa, W.; Yousef, M. MultiKOC: Multi-One-Class Classifier Based K-Means Clustering. Algorithms 2021, 14, 134. [Google Scholar] [CrossRef]
  105. Abedalla, L.; Badarna, M.; Khalifa, W.; Yousef, M. K-Means Based One-Class SVM Classifier. In Database and Expert Systems Applications; Anderst-Kotsis, G., Tjoa, A.M., Khalil, I., Elloumi, M., Mashkoor, A., Sametinger, J., Larrucea, X., Fensel, A., Martinez-Gil, J., Moser, B., et al., Eds.; Springer International Publishing: Cham, Switzerland, 2019; Volume 1062, pp. 45–53. [Google Scholar] [CrossRef]
  106. Yousef, M.; Khalifa, W.; Abedallah, L. Ensemble Clustering Classification compete SVM and One-Class classifiers applied on plant microRNAs Data. J. Integr. Bioinform. 2016, 13, 304. [Google Scholar] [CrossRef] [PubMed]
  107. Kent, J.T. Information gain and a general measure of correlation. Biometrika 1983, 70, 163–173. [Google Scholar] [CrossRef]
  108. Brown, G.; Pocock, A.; Zhao, M.-J.; Lujan, M. Conditional Likelihood Maximisation: A Unifying Framework for Information Theoretic Feature Selection. J. Mach. Learn. Res. 2012, 13, 27–66. [Google Scholar]
  109. Fleuret, F. Fast Binary Feature Selection with Conditional Mutual Information. J. Mach. Learn. Res. 2004, 5, 1531–1555. [Google Scholar]
  110. Pedregosa, F. Scikit-learn: Machine Learning in Python. J. Mach. Learn. Res. 2011, 12, 2825–2830. [Google Scholar]
  111. Chen, T.; He, T. xgboost: eXtreme Gradient Boosting. Available online: https://cran.microsoft.com/snapshot/2017-12-11/web/packages/xgboost/vignettes/xgboost.pdf (accessed on 8 March 2022).
  112. Senliol, B.; Gulgezen, G.; Yu, L.; Cataltepe, Z. Fast Correlation Based Filter (FCBF) with a different search strategy. In Proceedings of the 2008 23rd International Symposium on Computer and Information Sciences, Istanbul, Turkey, 27–29 October 2008; pp. 1–4. [Google Scholar]
  113. Pirtskhalava, M.; Grigolava, M. Transmembrane and Antimicrobial Peptides. Hydrophobicity, Amphiphilicity and Propensity to Aggregation. arXiv 2013, arXiv:1307.6160. [Google Scholar]
  114. Kumar, P.; Kizhakkedathu, J.N.; Straus, S.K. Antimicrobial Peptides: Diversity, Mechanism of Action and Strategies to Improve the Activity and Biocompatibility In Vivo. Biomolecules 2018, 8, 4. [Google Scholar] [CrossRef] [PubMed] [Green Version]
  115. Shai, Y. Mode of action of membrane active antimicrobial peptides. Biopolymers 2002, 66, 236–248. [Google Scholar] [CrossRef] [PubMed]
  116. Osorio, D.; Rondón-Villarreal, P.; Torres, R.T.R. Peptides: A Package for Data Mining of Antimicrobial Peptides. R J. 2015, 7, 4–14. [Google Scholar] [CrossRef]
  117. Romestand, B.; Molina, F.; Richard, V.; Roch, P.; Granier, A.C. Key role of the loop connecting the two beta strands of mussel defensin in its antimicrobial activity. J. Biol. Inorg. Chem. 2003, 270, 2805–2813. [Google Scholar] [CrossRef]
  118. Bezerra, I.; Moreira, L.; Chiavone-Filho, O.; Mattedi, S. Effect of different variables in the solubility of ampicillin and corresponding solid phase. Fluid Phase Equilibria 2018, 459, 18–29. [Google Scholar] [CrossRef]
  119. Le, H.; Ting, L.; Jun, C.; Weng, W. Gelling properties of myofibrillar protein from abalone (Haliotis Discus Hannai Ino) muscle. Int. J. Food Prop. 2018, 21, 277–288. [Google Scholar] [CrossRef] [Green Version]
  120. Ni, N.; Wang, Z.; He, F.; Wang, L.; Pan, H.; Li, X.; Wang, Q.; Zhang, D. Gel properties and molecular forces of lamb myofibrillar protein during heat induction at different pH values. Process Biochem. 2014, 49, 631–636. [Google Scholar] [CrossRef]
  121. Ahn, H.-S.; Cho, W.; Kang, S.-H.; Ko, S.-S.; Park, M.-S.; Cho, H.; Lee, K.-H. Design and synthesis of novel antimicrobial peptides on the basis of α helical domain of Tenecin 1, an insect defensin protein, and structure-activity relationship study. Peptides 2006, 27, 640–648. [Google Scholar] [CrossRef]
  122. Pirtskhalava, M.; Vishnepolsky, B.; Grigolava, M. Physicochemical Features and Peculiarities of Interaction of Antimicrobial Peptides with the Membrane. Pharmaceuticals 2021, 14, 471. [Google Scholar] [CrossRef] [PubMed]
  123. Papo, N.; Shai, Y. Can we predict biological activity of antimicrobial peptides from their interactions with model phospholipid membranes? Peptides 2003, 24, 1693–1703. [Google Scholar] [CrossRef]
  124. Teixeira, V.; Feio, M.J.; Bastos, M. Role of lipids in the interaction of antimicrobial peptides with membranes. Prog. Lipid Res. 2012, 51, 149–177. [Google Scholar] [CrossRef] [PubMed]
  125. Chen, Y.; Guarnieri, M.T.; Vasil, A.I.; Vasil, M.L.; Mant, C.T.; Hodges, R.S. Role of Peptide Hydrophobicity in the Mechanism of Action of α-Helical Antimicrobial Peptides. Antimicrob. Agents Chemother. 2007, 51, 1398–1406. [Google Scholar] [CrossRef] [PubMed] [Green Version]
  126. Eisenberg, D.; Weiss, R.M.; Terwilliger, T. The helical hydrophobic moment: A measure of the amphiphilicity of a helix. Nature 1982, 299, 371–374. [Google Scholar] [CrossRef] [PubMed]
  127. Yousef, M.; Levy, D.; Allmer, J. Species Categorization via MicroRNAs—Based on 3′UTR Target Sites using Sequence Features. In Proceedings of the 11th International Joint Conference on Biomedical Engineering Systems and Technologies, Funchal, Portugal, 19–21 January 2018; pp. 112–118. [Google Scholar]
  128. Yousef, M.; Khalifa, W.; Acar, I.E.; Allmer, J. Distinguishing between MicroRNA Targets from Diverse Species using Sequence Motifs and K-mers. In Proceedings of the 10th International Joint Conference on Biomedical Engineering Systems and Technologies, Porto, Portugal, 21–23 February 2017; pp. 133–139. [Google Scholar]
  129. Yousef, M.; Khalifa, W.; Acar, I.E.; Allmer, J. MicroRNA categorization using sequence motifs and k-mers. BMC Bioinform. 2017, 18, 170. [Google Scholar] [CrossRef] [Green Version]
Figure 1. Workflow of data preprocessing.
Applsci 12 03631 g001
Figure 2. Flowchart of our model construction.
Applsci 12 03631 g002
Figure 3. Comparison of the performances of different models in terms of their AUC values with standard deviation values for (a) Gram-negative, and (b) Gram-positive dataset, using physico-chemical features.
Applsci 12 03631 g003
Figure 4. Feature ranking according to their importances in classification using RF model in Gram-negative dataset.
Applsci 12 03631 g004
Figure 5. Feature ranking according to their importances in classification using RF model in Gram-positive dataset.
Applsci 12 03631 g005
Figure 6. Principal component analysis results for Gram-negative dataset are shown in (a,c); for Gram-positive dataset are shown in (b,d). While 3D plots are presented in (a,b), 2D plots are presented in (c,d).
Applsci 12 03631 g006
Figure 7. Graphical representation of Net Charge feature of the Gram-positive dataset. Histogram of (a) AMP class and (b) non-AMP class.
Applsci 12 03631 g007
Figure 8. Principal component analysis of Gram-negative dataset (a,c) and of Gram-positive dataset (b,d) after outlier detection and elimination, shown in 3D in (a,b) and in 2D in (c,d).
Applsci 12 03631 g008
Figure 9. Comparison of the AUC results before and after feature selection is applied on physico-chemical features and extended set of features for (a) Gram-negative and (b) Gram-positive dataset.
Applsci 12 03631 g009
Table 1. An example of AMP and non-AMP peptides included in our Gram-negative dataset and their physico-chemical properties, excerpted from DBAASP [47].
Name
of Sequence
SequenceSeq.
Length
Norm. Hyd.
Moment
Norm. Hyd.Net ChargeIsoelectric
Point
Penet.
Depth
Tilt AngleDisordered Conf. PropensityLinear MomentPropensity
In Vitro
Aggregation
Mean MICClass
(AMP Category)
XPF-B2GWASKIGTQLGKMAKVGLKEFVQS241.11−0.25310.715760.090.160256.810
Ovalbumin (271–290)SNVMEERKIKVYLPRMKMEE200.13−0.2819.383067−0.110.2908000
MBI 29 A1KWKSFIKKLTSVLKKVVTTALPALIS261.03−0.54611.37121060.160.273.49.331
CyanophlyctinFLNALKNFAKTAGKRLKSLLN211.69−0.24511.741588−0.030.250121
Table 2. Comparison of different models according to different performance metrics for Gram-negative dataset, using physico-chemical features.
ModelAccuracyRecallSpecificityPrecisionArea Under CurveF1Balanced Acc.
AdaBoost0.85 ± 0.060.92 ± 0.060.72 ± 0.200.87 ± 0.070.88 ± 0.060.89 ± 0.040.82 ± 0.13
Decision Tree0.79 ± 0.060.87 ± 0.070.66 ± 0.240.84 ± 0.070.78 ± 0.070.85 ± 0.040.76 ± 0.15
LogitBoost0.86 ± 0.050.92 ± 0.060.74 ± 0.160.88 ± 0.060.89 ± 0.060.90 ± 0.030.83 ± 0.11
RF0.89 ± 0.050.93 ± 0.040.79 ± 0.160.90 ± 0.060.92 ± 0.050.91 ± 0.030.86 ± 0.10
SVM0.80 ± 0.050.93 ± 0.060.56 ± 0.210.81 ± 0.070.82 ± 0.060.86 ± 0.030.74 ± 0.13
SVM + kNN0.80 ± 0.070.93 ± 0.050.56 ± 0.250.81 ± 0.080.82 ± 0.080.86 ± 0.040.74 ± 0.15
LogitBoost + kNN0.80 ± 0.050.93 ± 0.060.56 ± 0.210.81 ± 0.070.82 ± 0.060.86 ± 0.030.74 ± 0.13
Table 3. Comparison of different models according to different performance metrics for Gram-positive dataset, using physico-chemical features.
ModelAccuracyRecallSpecificityPrecisionArea Under CurveF1Balanced Acc.
AdaBoost0.84 ± 0.060.85 ± 0.080.83 ± 0.140.83 ± 0.100.86 ± 0.060.83 ± 0.050.84 ± 0.11
Decision Tree0.77 ± 0.070.77 ± 0.100.77 ± 0.160.769 ± 0.090.77 ± 0.060.76 ± 0.050.77 ± 0.13
LogitBoost0.83 ± 0.060.84 ± 0.090.82 ± 0.150.83 ± 0.100.87 ± 0.050.83 ± 0.050.83 ± 0.12
RF0.87 ± 0.040.87 ± 0.070.87 ± 0.080.87 ± 0.070.90 ± 0.040.87 ± 0.040.87 ± 0.07
SVM0.77 ± 0.070.85 ± 0.110.71 ± 0.190.75 ± 0.120.81 ± 0.060.78 ± 0.050.78 ± 0.15
SVM + kNN0.76 ± 0.080.81 ± 0.110.72 ± 0.210.76 ± 0.130.80 ± 0.070.77 ± 0.050.76 ± 0.16
LogitBoost + kNN0.77 ± 0.070.85 ± 0.110.71 ± 0.190.75 ± 0.120.81 ± 0.060.78 ± 0.050.78 ± 0.15
Table 4. Minimum and maximum values of each feature that are used in outlier elimination.
FeaturesGram-Negative DatasetGram-Positive Dataset
Minimum ThresholdMaximum ThresholdMinimum ThresholdMaximum Threshold
Hydrophobic Moment0.420.11.7
Normalized Hydrophobicity−0.90.55−0.81
Net Charge513413
Isoelectric Point10.5131013
Penetration Depth13301230
Tilt Angle4015030152
Linear Moment0.10.40.150.32
Propensity in vitro Aggregation0250087
Disordered Conformation Propensity−0.50.08−0.850.15
Table 5. Comparison of the models according to performance metrics for the Gram-negative dataset after outlier elimination.
ModelAccuracyRecallSpecificityPrecisionArea Under CurveF1Balanced Acc.
AdaBoost0.97 ± 0.030.99 ± 0.030.96 ± 0.040.95 ± 0.050.99 ± 0.010.97 ± 0.030.97 ± 0.04
Decision Tree0.91 ± 0.060.92 ± 0.080.91 ± 0.080.89 ± 0.090.91 ± 0.060.90 ± 0.060.91 ± 0.08
LogitBoost0.97 ± 0.030.99 ± 0.020.96 ± 0.050.95 ± 0.050.99 ± 0.010.97 ± 0.030.98 ± 0.03
RF0.98 ± 0.020.99 ± 0.020.97 ± 0.040.97 ± 0.050.99 ± 0.010.98 ± 0.030.98 ± 0.03
SVM0.98 ± 0.020.99 ± 0.030.97 ± 0.040.96 ± 0.040.98 ± 0.010.97 ± 0.030.98 ± 0.03
SVM + kNN0.81 ± 0.110.82 ± 0.140.80 ± 0.240.81 ± 0.160.84 ± 0.100.80 ± 0.090.81 ± 0.19
LogitBoost + kNN0.98 ± 0.020.99 ± 0.030.97 ± 0.040.96 ± 0.040.98 ± 0.010.97 ± 0.030.98 ± 0.03
Table 6. Comparison of the models according to performance metrics for the Gram-positive dataset after outlier elimination.
ModelAccuracyRecallSpecificityPrecisionArea Under CurveF1Balanced Acc.
AdaBoost0.93 ± 0.040.92 ± 0.080.94 ± 0.060.89 ± 0.090.96 ± 0.030.90 ± 0.050.93 ± 0.07
Decision Tree0.88 ± 0.050.82 ± 0.120.91 ± 0.060.82 ± 0.110.86 ± 0.070.81 ± 0.090.86 ± 0.09
LogitBoost0.93 ± 0.050.93 ± 0.090.93 ± 0.070.88 ± 0.110.96 ± 0.030.90 ± 0.070.93 ± 0.08
RF0.95 ± 0.030.95 ± 0.070.95 ± 0.050.90 ± 0.090.97 ± 0.020.92 ± 0.050.95 ± 0.06
SVM0.91 ± 0.040.90 ± 0.110.91 ± 0.060.85 ± 0.110.93 ± 0.040.86 ± 0.06091 ± 0.09
SVM + kNN0.77 ± 0.100.75 ± 0.160.78 ± 0.200.68 ± 0.170.81 ± 0.080.68 ± 0.080.76 ± 0.18
LogitBoost + kNN0.91 ± 0.040.90 ± 0.110.91 ± 0.060.85 ± 0.110.93 ± 0.040.86 ± 0.040.91 ± 0.09
Table 7. Comparison of the models according to performance metrics for the Gram-negative dataset with 1507 features.
ModelAccuracyRecallSpecificityPrecisionArea Under CurveF1Balanced Acc.
AdaBoost0.96 ± 0.030.98 ± 0.040.95 ± 0.050.94 ± 0.060.98 ± 0.020.96 ± 0.030.96 ± 0.05
Decision Tree0.90 ± 0.060.90 ± 0.090.90 ± 0.080.88 ± 0.090.90 ± 0.060.88 ± 0.070.90 ± 0.08
LogitBoost0.97 ± 0.030.98 ± 0.030.95 ± 0.060.95 ± 0.060.98 ± 0.010.96 ± 0.030.97 ± 0.04
RF0.95 ± 0.040.98 ± 0.040.94 ± 0.060.93 ± 0.070.98 ± 0.020.95 ± 0.040.96 ± 0.05
Table 8. Comparison of the models according to performance metrics for the Gram-positive dataset with 1507 features.
ModelAccuracyRecallSpecificityPrecisionArea Under CurveF1Balanced Acc.
AdaBoost0.89 ± 0.050.88 ± 0.100.90 ± 0.080.82 ± 0.110.93 ± 0.040.84 ± 0.070.89 ± 0.09
Decision Tree0.82 ± 0.100.74 ± 0.140.86 ± 0.160.75 ± 0.130.80 ± 0.070.73 ± 0.100.80 ± 0.15
LogitBoost0.90 ± 0.050.89 ± 0.090.91 ± 0.070.84 ± 0.110.94 ± 0.030.85 ± 0.060.90 ± 0.08
RF0.92 ± 0.040.91 ± 0.090.92 ± 0.060.86 ± 0.100.95 ± 0.030.88 ± 0.060.92 ± 0.08
Table 9. Comparison of the models according to performance metrics for the Gram-negative dataset after feature selection (XGBoost).
ModelAccuracyRecallSpecificityPrecisionArea Under CurveF1Balanced Acc.
AdaBoost0.94 ± 0.050.97 ± 0.050.91 ± 0.090.91 ± 0.090.95 ± 0.060.93 ± 0.070.94 ± 0.07
Decision Tree0.90 ± 0.070.90 ± 0.110.89 ± 0.090.87 ± 0.100.90 ± 0.080.88 ± 0.100.90 ± 0.10
LogitBoost0.94 ± 0.050.98 ± 0.040.91 ± 0.090.90 ± 0.090.96 ± 0.060.94 ± 0.070.95 ± 0.06
RF0.94 ± 0.050.97 ± 0.060.92 ± 0.080.91 ± 0.080.96 ± 0.050.93 ± 0.070.94 ± 0.07
Table 10. Comparison of the models according to performance metrics for the Gram-positive dataset after feature selection (Information gain).
ModelAccuracyRecallSpecificityPrecisionArea Under CurveF1Balanced Acc.
AdaBoost0.86 ± 0.060.91 ± 0.100.83 ± 0.100.74 ± 0.120.90 ± 0.050.80 ± 0.070.87 ± 0.10
Decision Tree0.83 ± 0.100.77 ± 0.120.86 ± 0.160.76 ± 0.140.82 ± 0.070.75 ± 0.100.82 ± 0.14
LogitBoost0.87 ± 0.050.90 ± 0.100.86 ± 0.080.77 ± 0.110.91 ± 0.040.82 ± 0.060.88 ± 0.09
RF0.90 ± 0.040.89 ± 0.100.91 ± 0.070.84 ± 0.110.94 ± 0.040.86 ± 0.060.90 ± 0.08
Publisher’s Note: MDPI stays neutral with regard to jurisdictional claims in published maps and institutional affiliations.

