
An Efficient and Portable LED Multispectral Imaging System and Its Application to Human Tongue Detection


Abstract
:1. Introduction
2. Principle
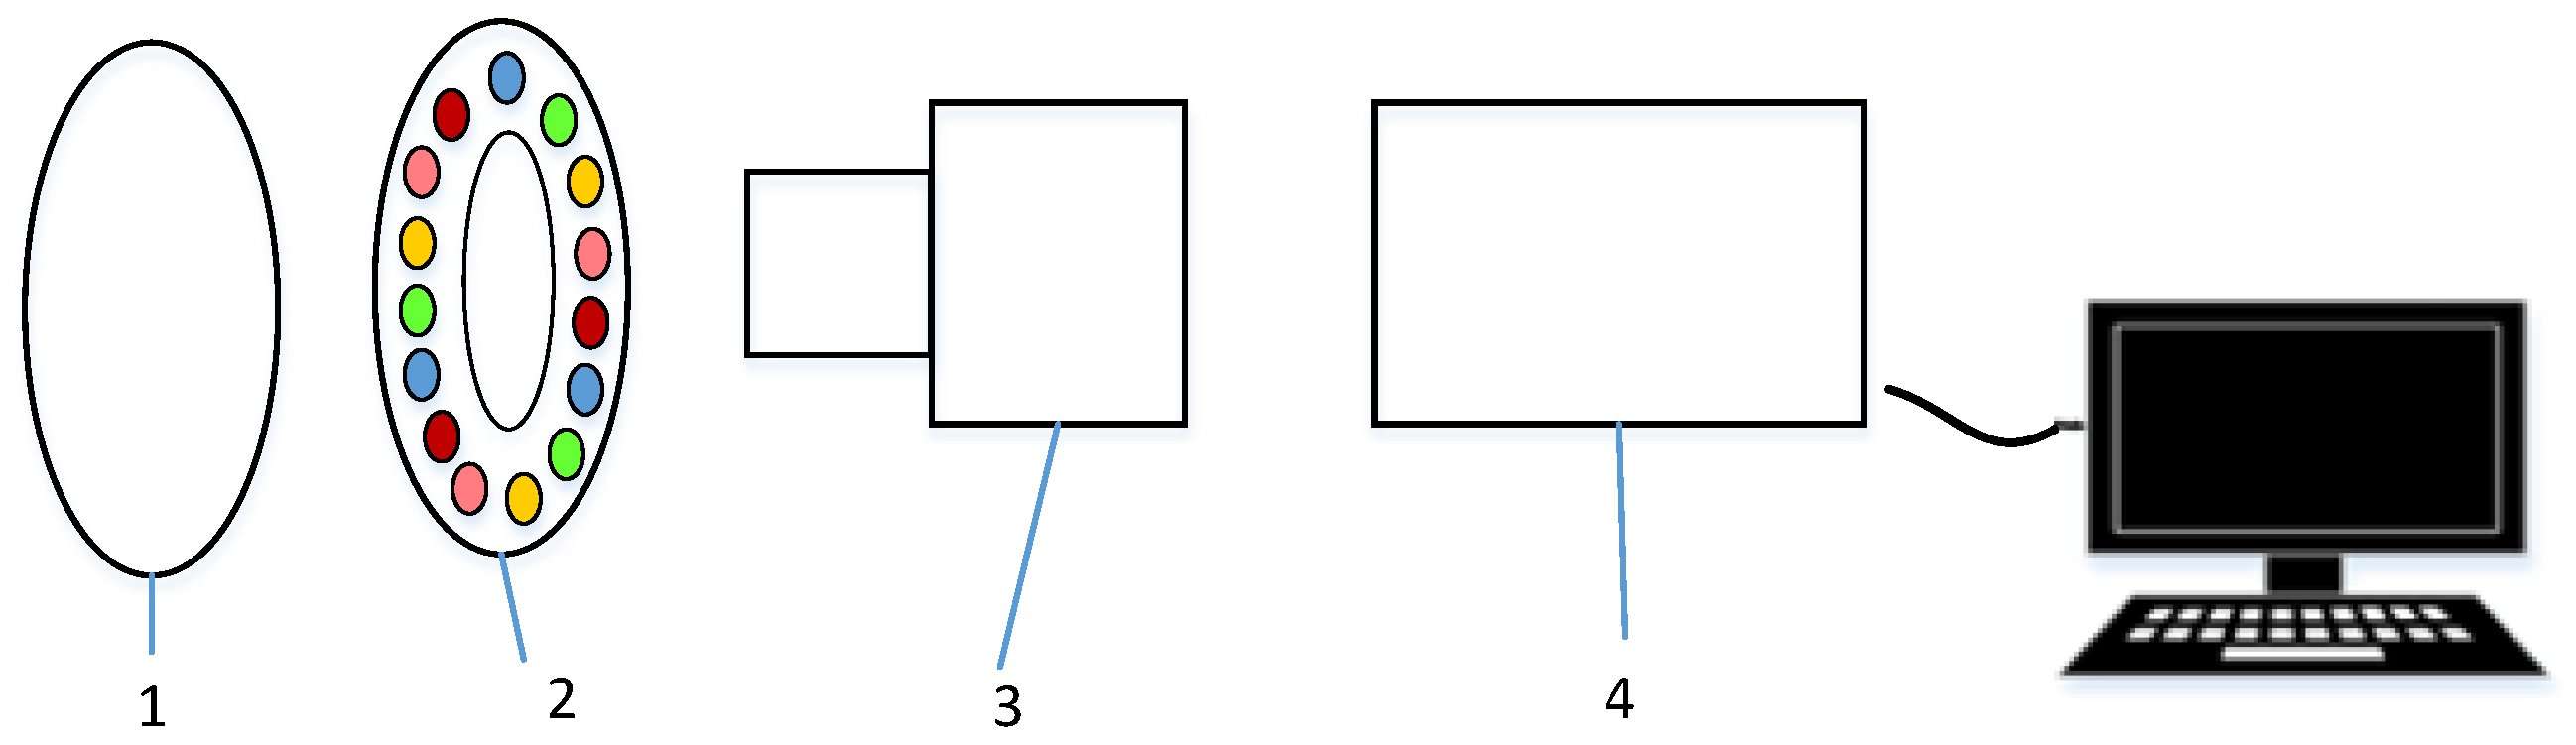
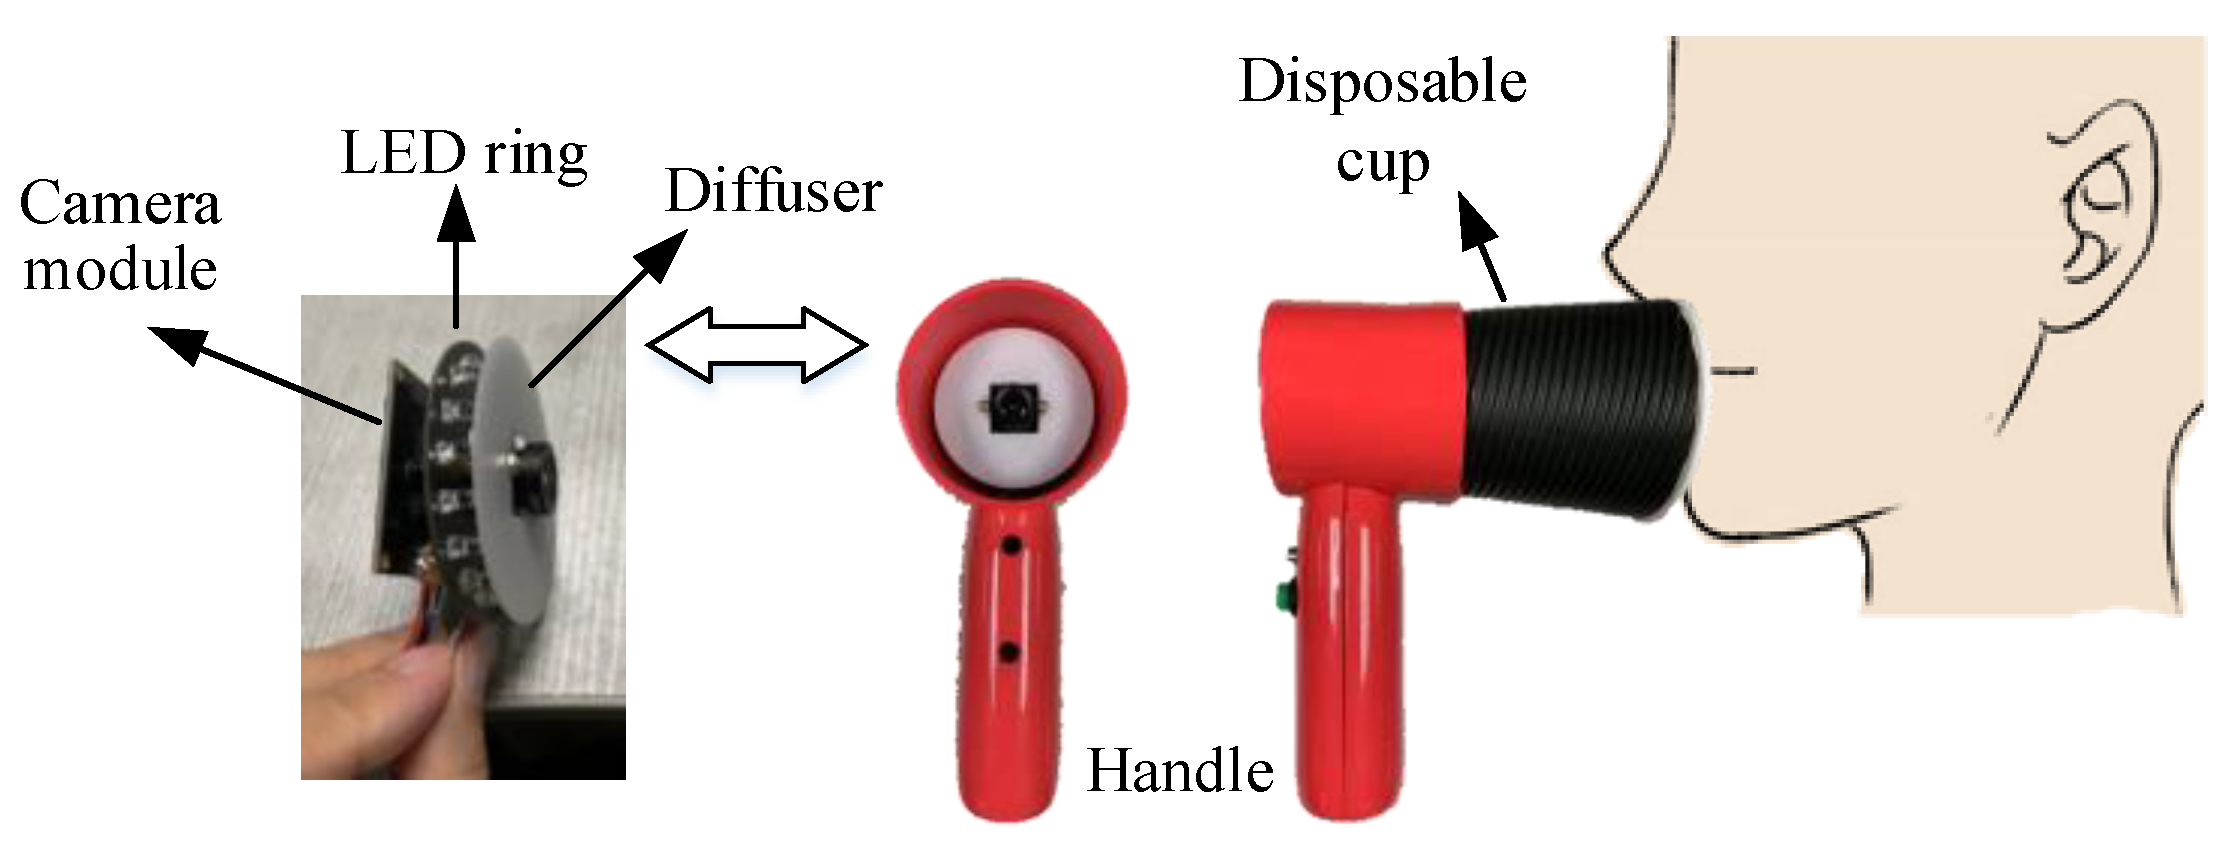
2.1. Hardware
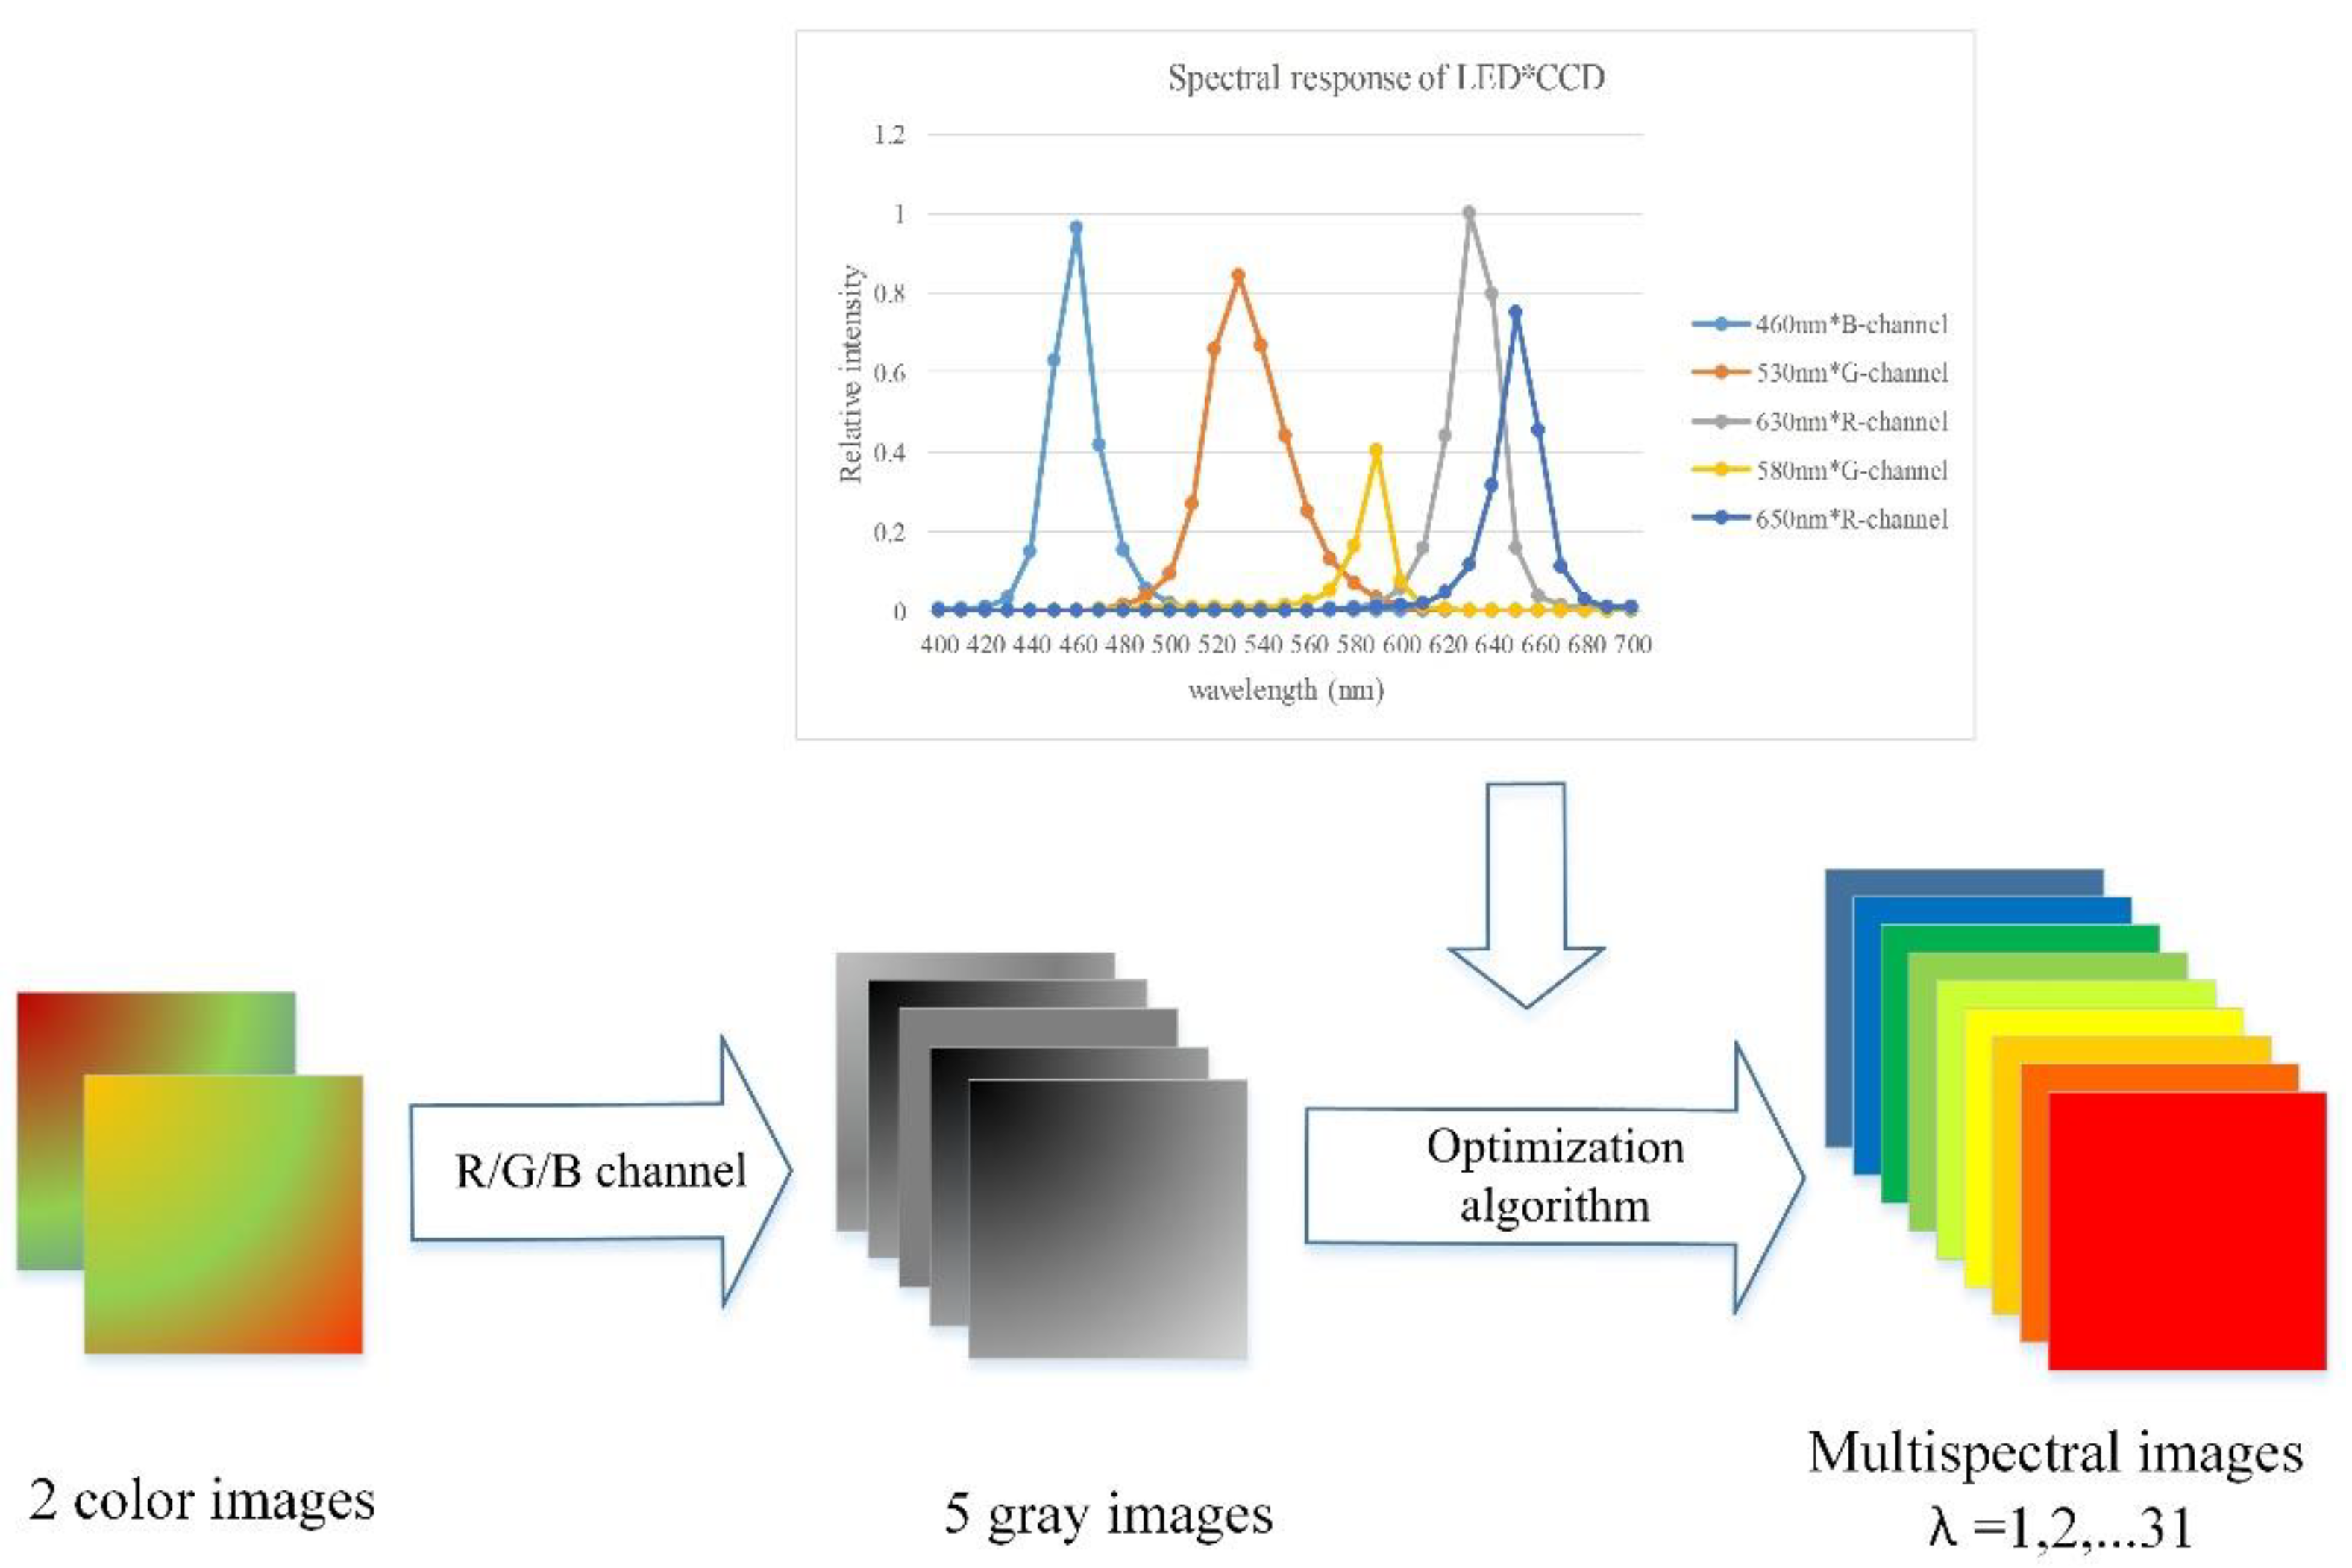
2.2. Multispectral Image Reconstruction Method
2.2.1. Traditional Point-by-Point Optimization
2.2.2. Improved Method to Reduce Computation Time
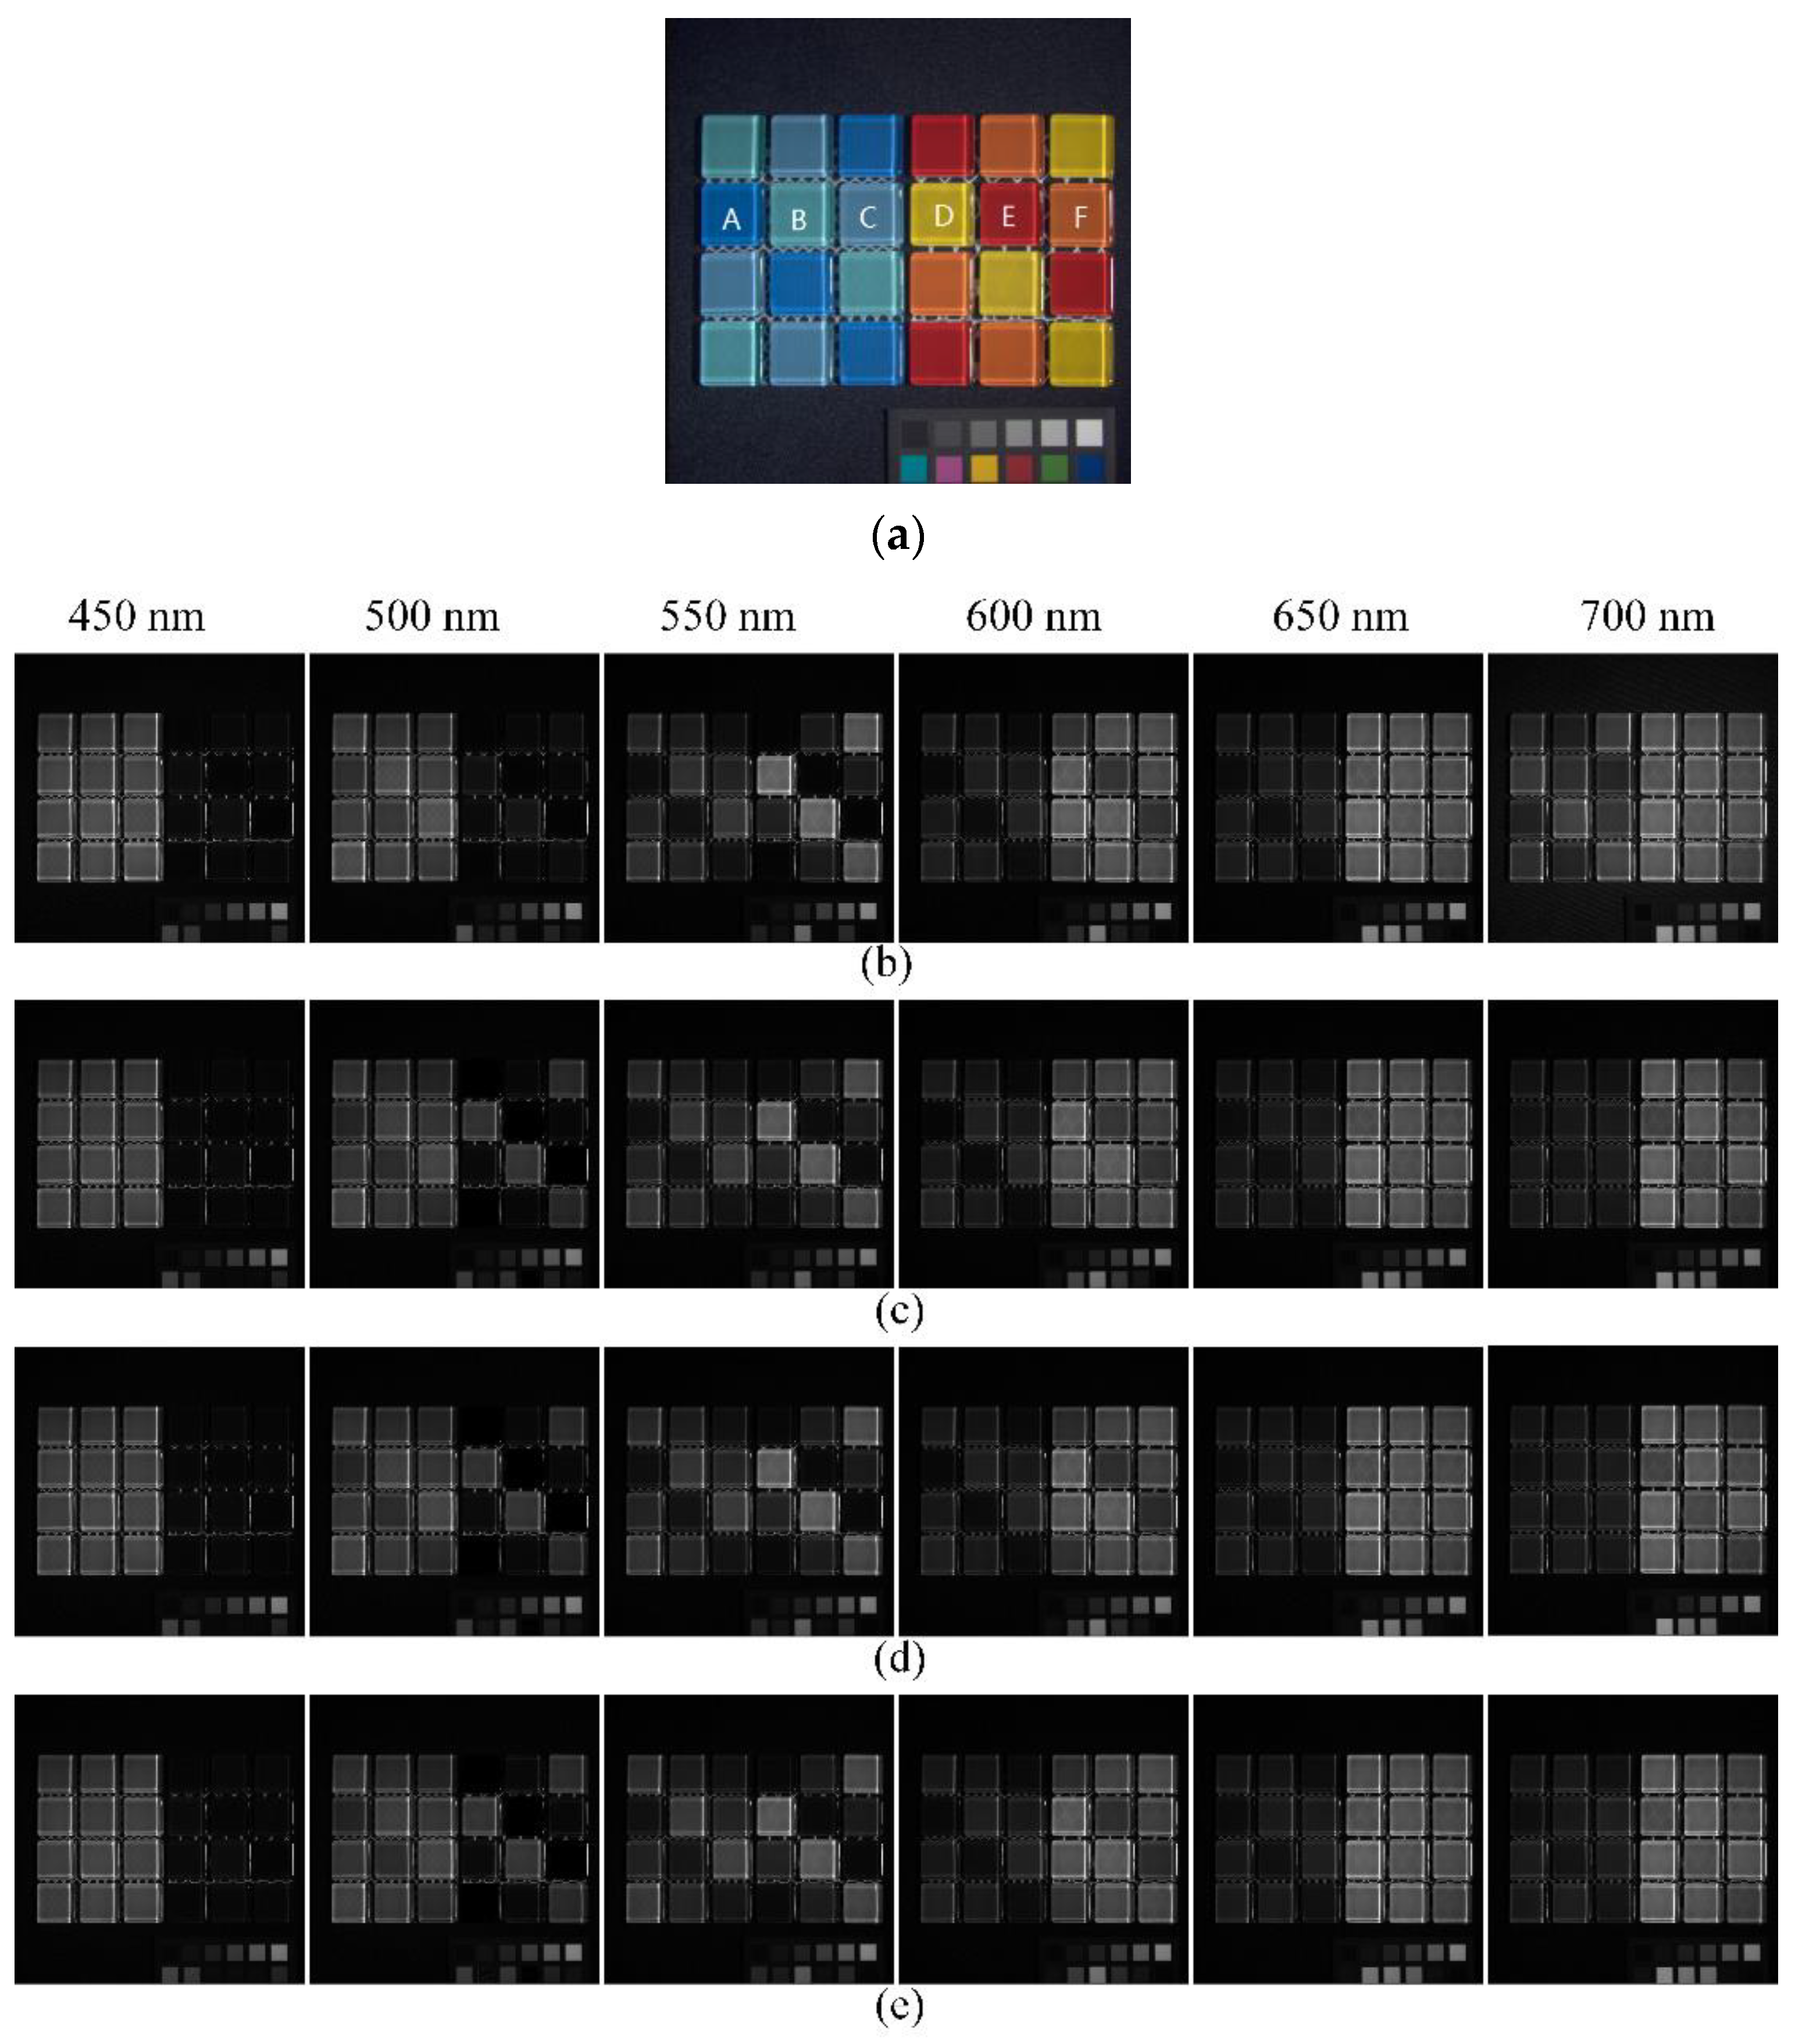
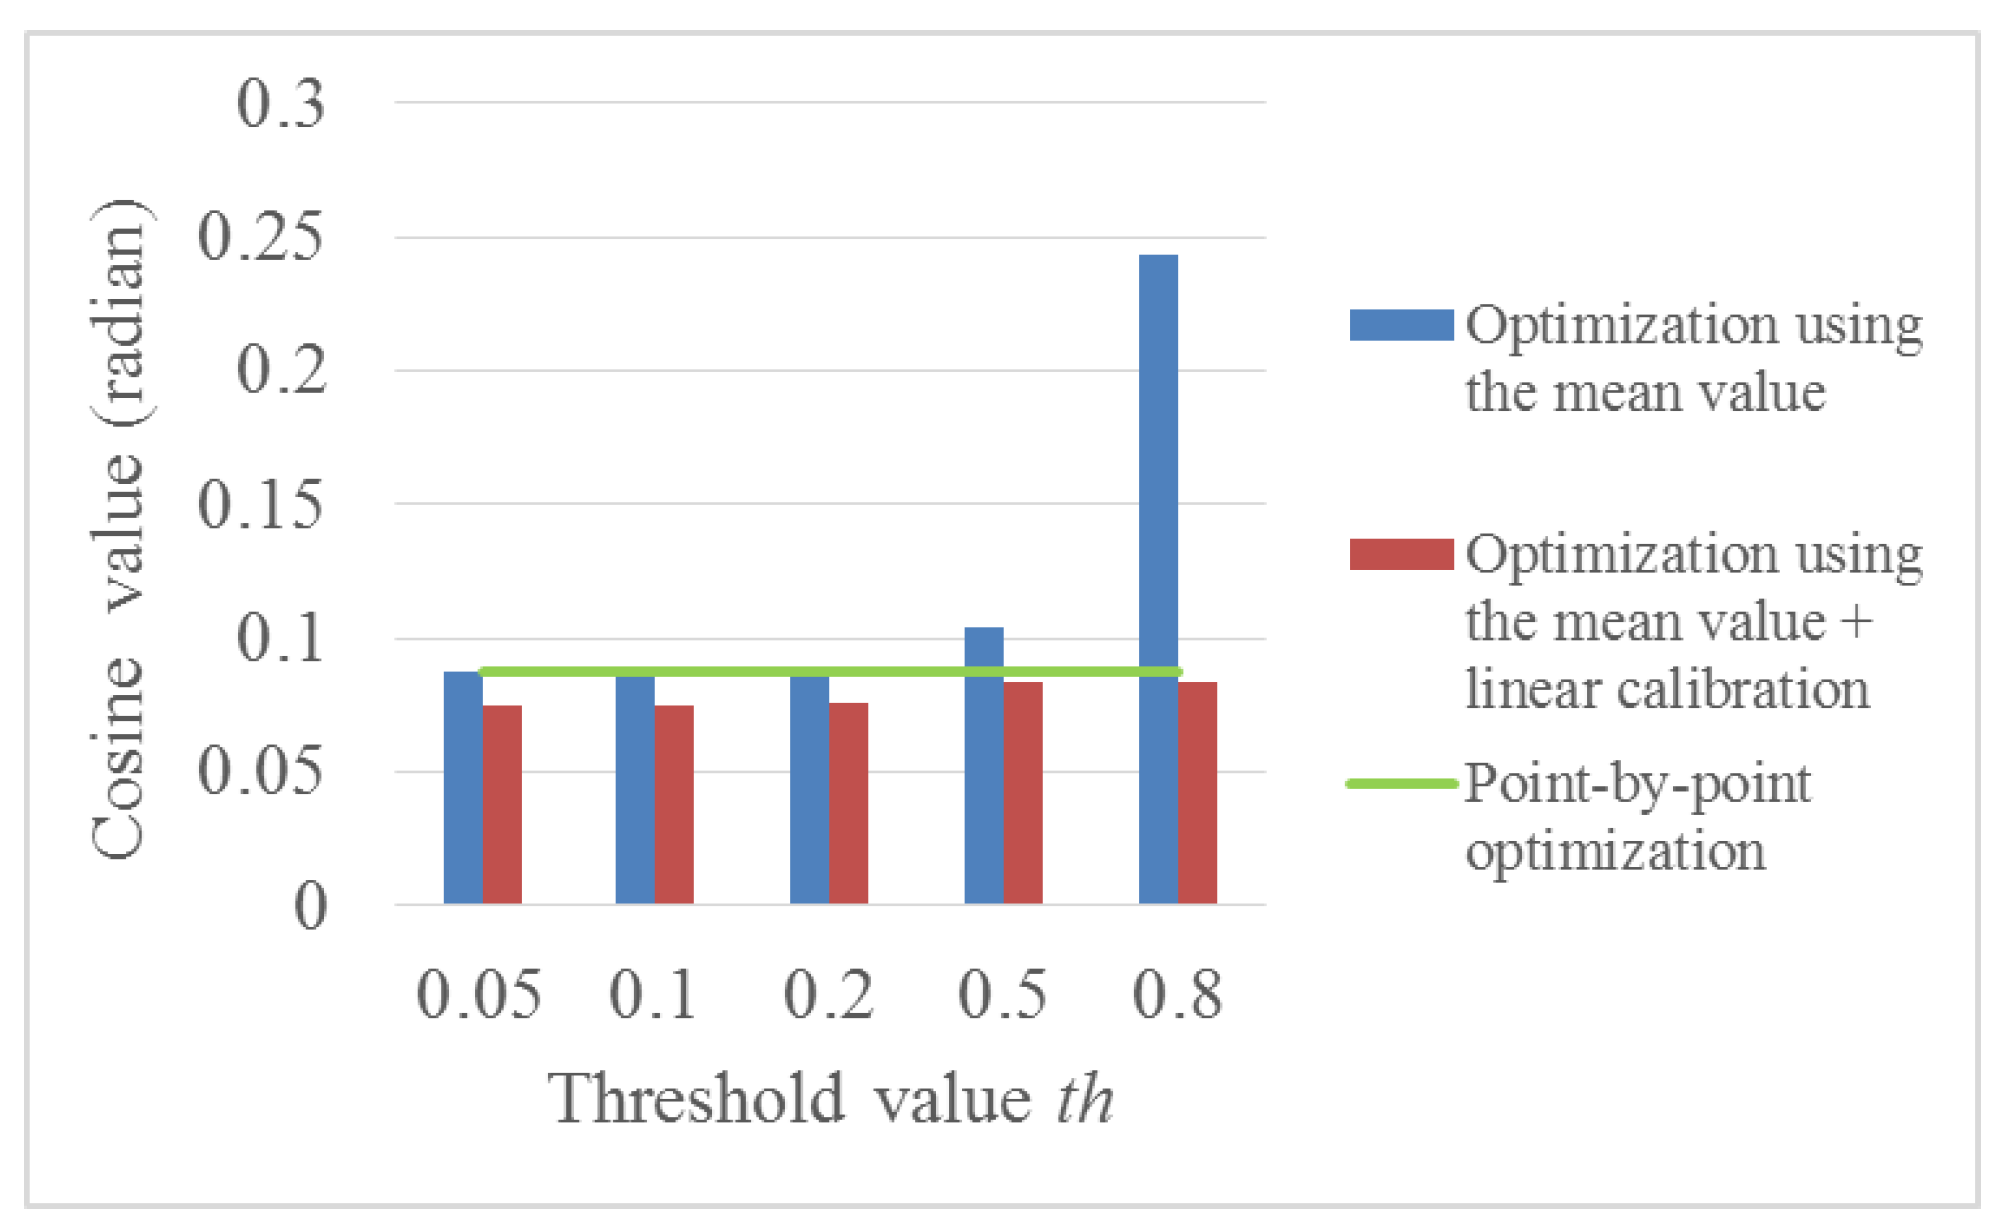
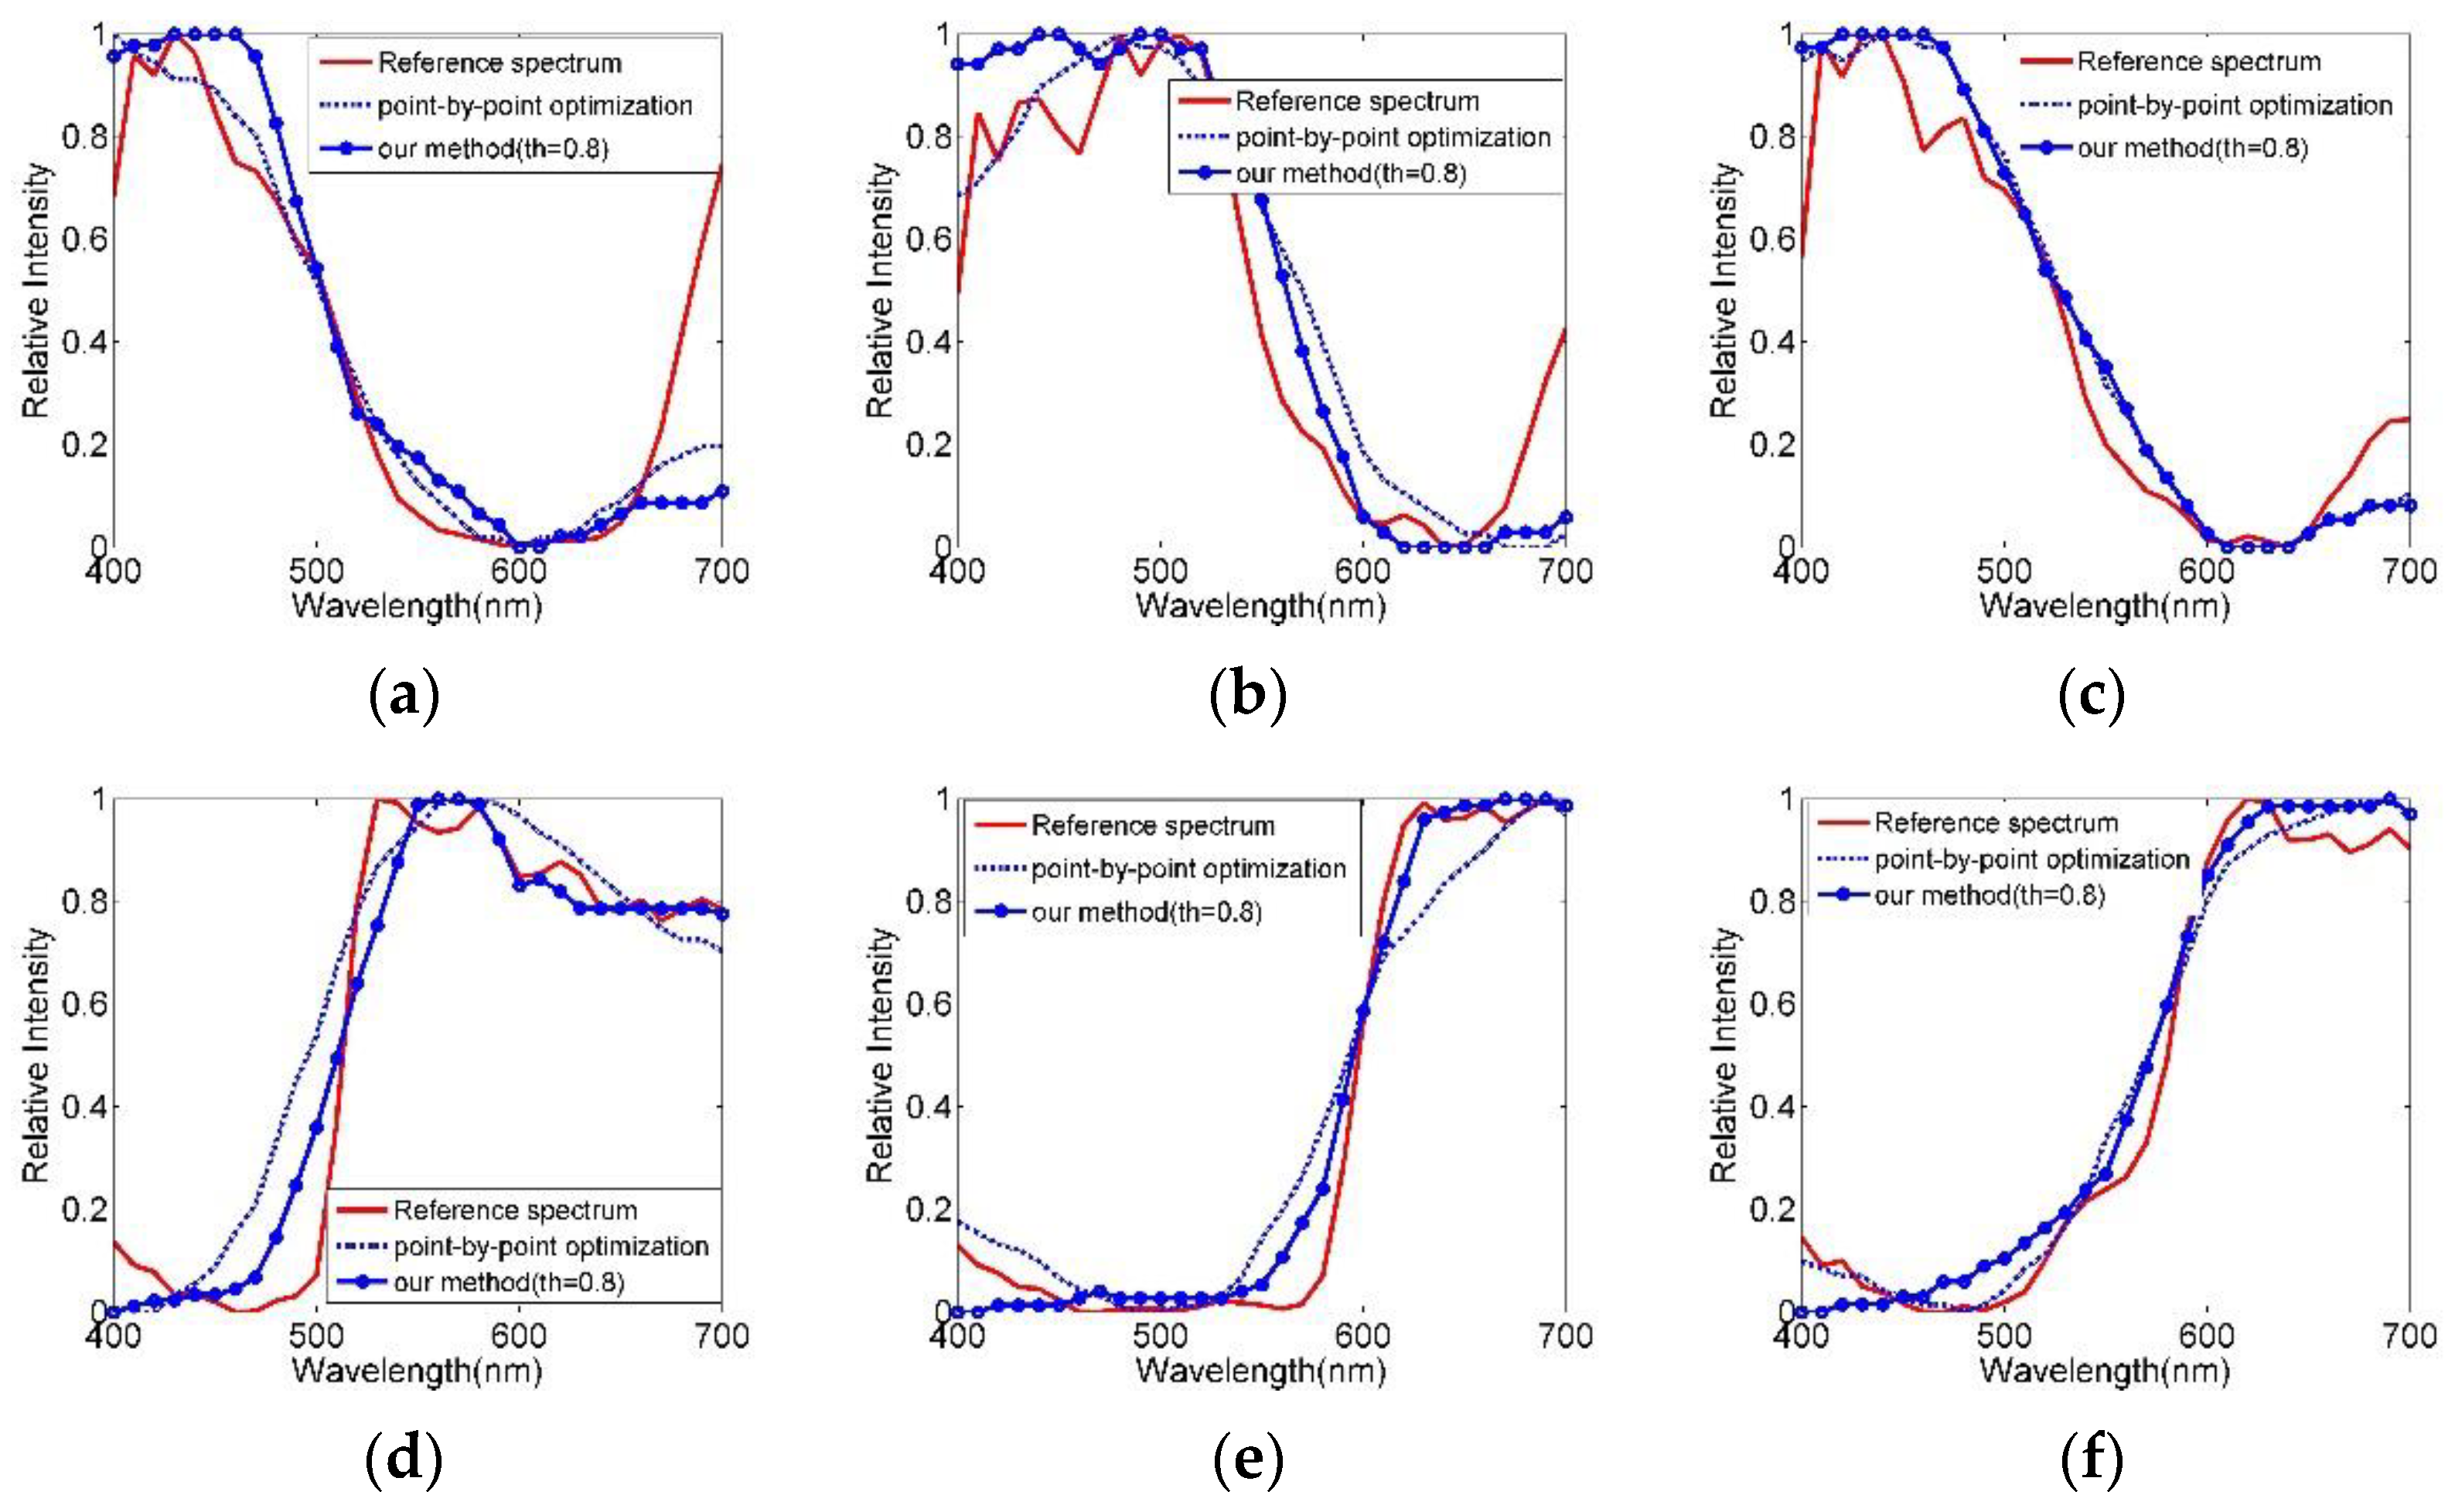
3. Simulation
4. Experiment on Human Tongue Detection
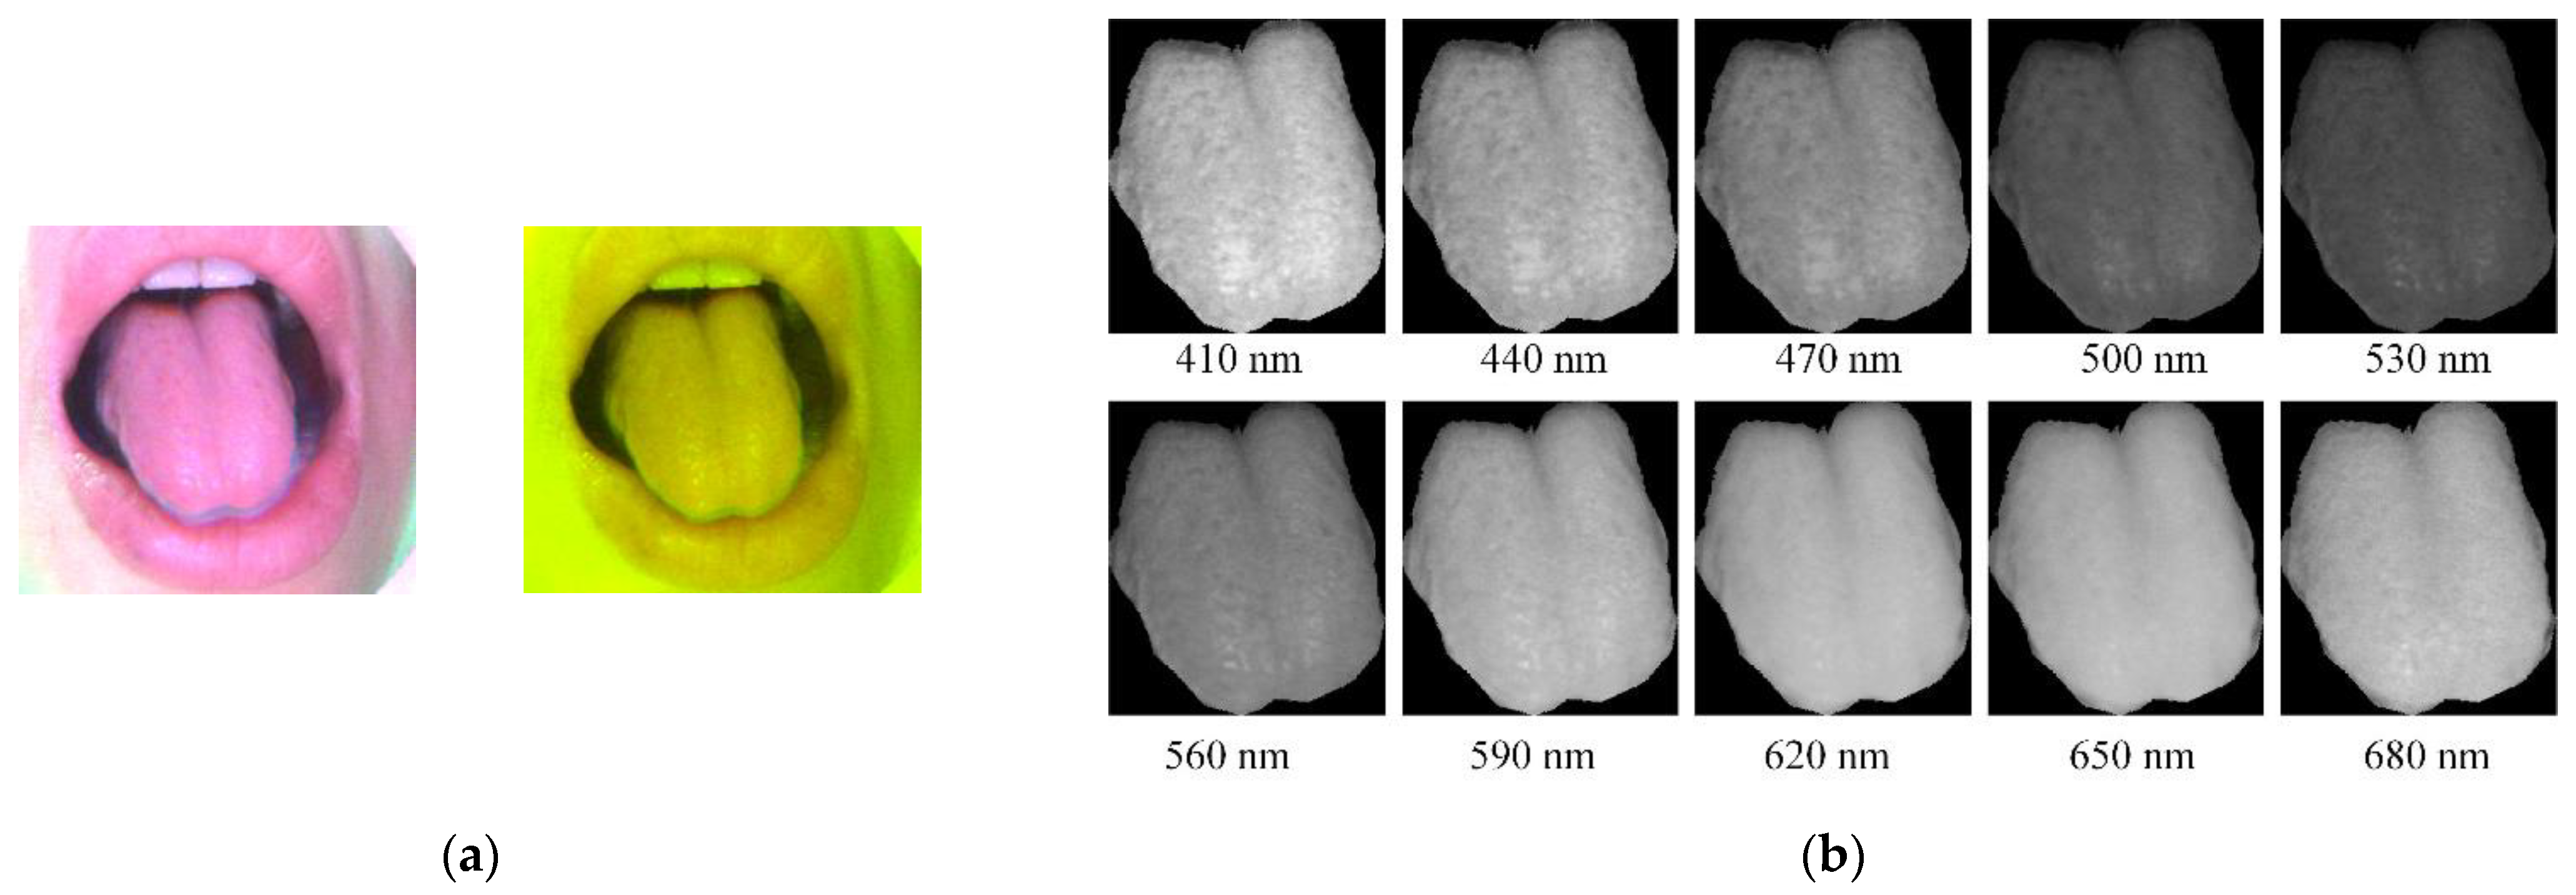
4.1. Multispectral Images for the Human Tongue
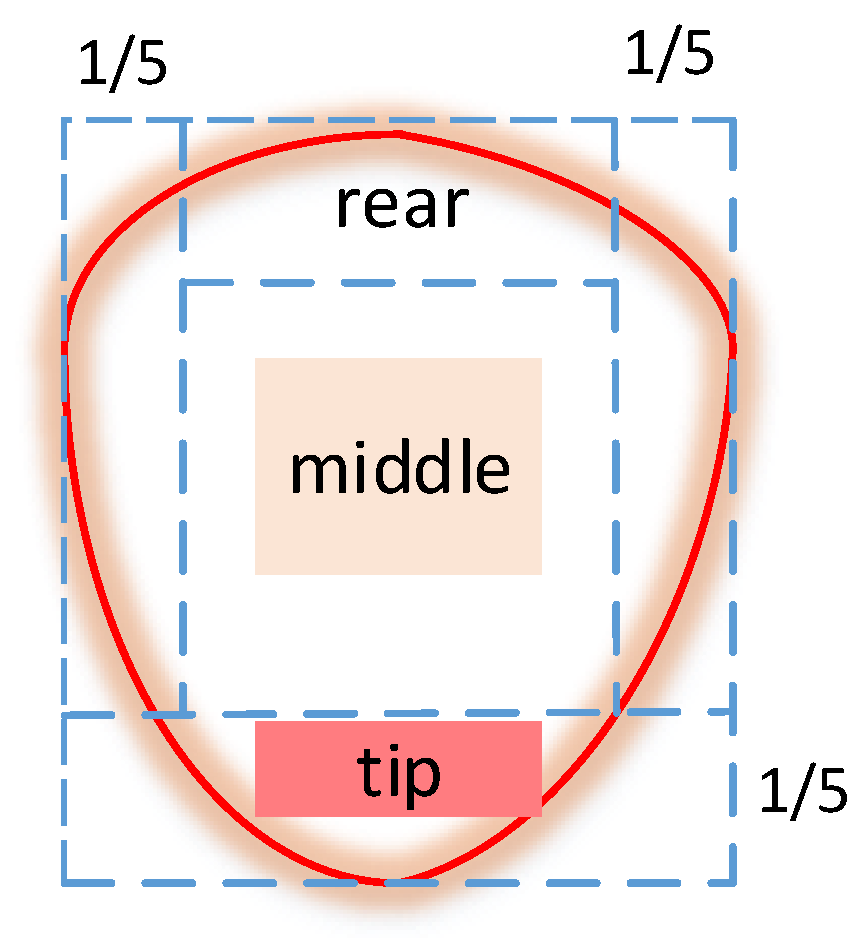
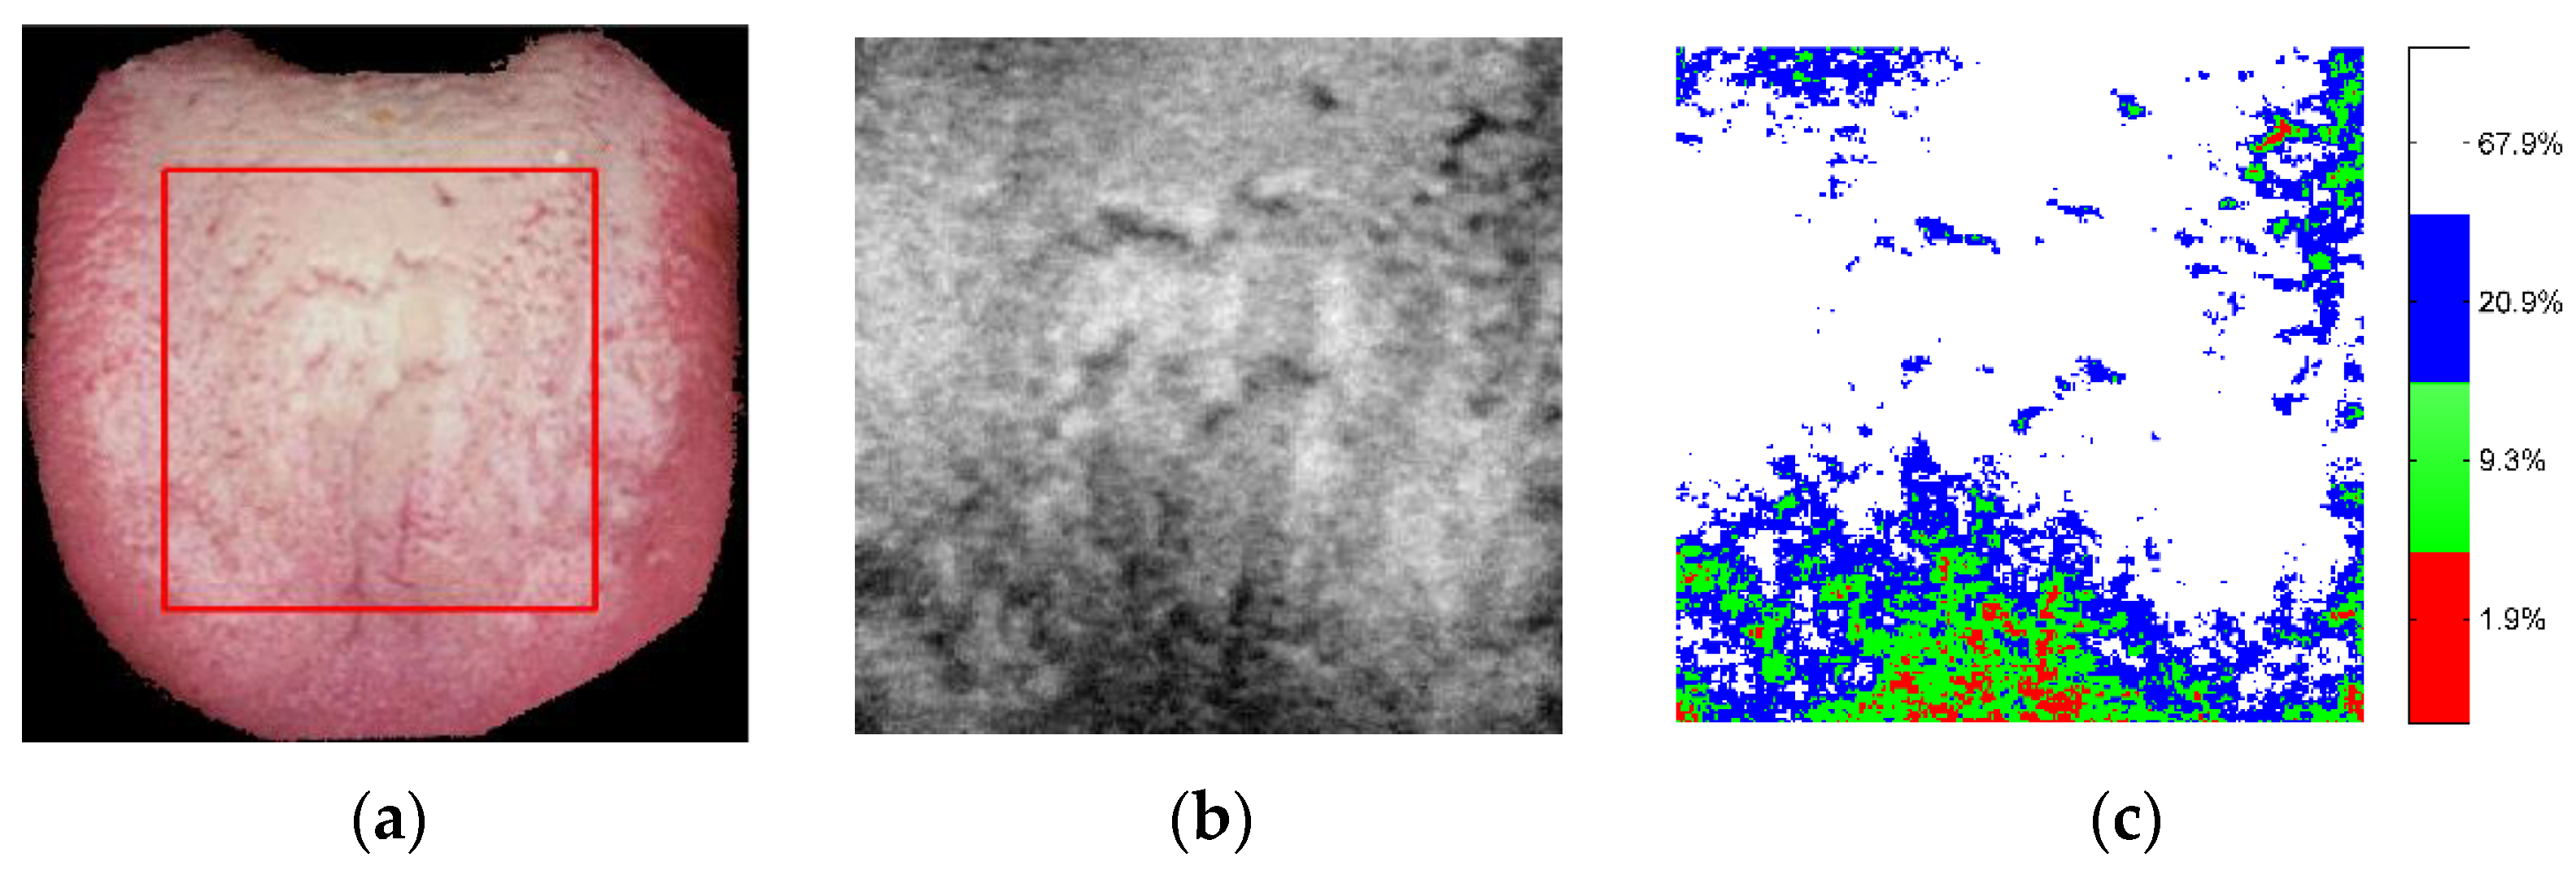
4.2. Quantity Analysis of Tongue Color and Tongue Fur
5. Conclusions
- (1)
- Spatial similarity and segment linear calibration were used to improve the reconstruction process. The spatial pixels were merged based on cosine similarity, which greatly decreased the computation time. A following linear calibration was used to improve the reconstruction accuracy. Our simulation results showed that the reconstruction time was only 5.5% of that of the point-by-point optimization method when the threshold value was 0.5. Further, the mean PSNR and SAM of the reconstructed images were better than those of the traditional point-by-point method.
- (2)
- A portable prototype was built to detect the human tongue. As this system is not affected by environmental light, it can obtain an accurate tongue color. Further, it has a fast detection and reconstruction speed for a friendly human experience. The experiment showed that multispectral images are useful for quantitatively analyzing tongue color and fur thickness.
Author Contributions
Funding
Institutional Review Board Statement
Informed Consent Statement
Data Availability Statement
Conflicts of Interest
References
- Garini, Y.; Young, I.T.; Mcnamara, G. Spectral imaging: Principles and applications. Cytometry 2006, 69, 735–747. [Google Scholar] [CrossRef] [PubMed]
- Marengo, E.; Manfredi, M.; Zerbinati, O.O.; Robotti, E. Technique based on LED multispectral imaging and multivariate analysis for monitoring the conservation state of the Dead Sea scrolls. Anal. Chem. 2011, 83, 6609–6618. [Google Scholar] [CrossRef]
- Yamamoto, S.; Tsumura, N. Development of a multispectral scanner using LED array for digital color proof. J. Imaging Sci. Technol. 2007, 51, 61–69. [Google Scholar] [CrossRef]
- Setiadi, I.C.; Nasution, A.M.T.; Chandra, T.G. A new LED-based multispectral imaging system for blood and melanin content estimation: The validation. AIP Conf. Proc. 2019, 2193, 050017. [Google Scholar]
- Liu, H.; Sticklus, J.; Köser, K.; Hoving, H.T.; Song, H.; Chen, Y.; Greinert, J.; Schoening, T. TuLUMIS—A tunable LED-based underwater multispectral imaging system. Opt. Express 2018, 26, 7811–7828. [Google Scholar] [CrossRef] [PubMed]
- Shrestha, R.; Hardeberg, J.Y.; Boust, C. LED based multispectral film scanner for accurate color imaging. In Proceedings of the 8th International Conference on Signal Image Technology and Internet Based Systems IEEE, Sorrento, Italy, 25–29 November 2012; pp. 811–817. [Google Scholar]
- Park, J.; Lee, M.H.; Grossberg, M.D.; Nayar, S.K. Multispectral Imaging using Multiplexed Illumination. In Proceedings of the IEEE International Conference on Computer Vision, Rio de Janeiro, Brazil, 14–21 October 2007. [Google Scholar]
- Shrestha, R.; Hardeberg, J.Y. Multispectral imaging using LED illumination and an RGB camera. In Proceedings of the 21st Color and Imaging Conference on Color Science and Engineering Systems, Technologies and Applications, Albuquerque, New Mexico, USA, 4–8 November 2013; pp. 8–13. [Google Scholar]
- Kamshilin, A.A.; Nippolainen, E. Chromatic discrimination by use of computer controlled set of light-emitting diodes. Opt. Express 2007, 15, 15093–15100. [Google Scholar] [CrossRef] [PubMed]
- Fauch, L.; Nippolainen, E.; Teplov, V.; Kamshilin, A.A. Recovery of reflection spectra in a multispectral imaging system with light emitting diodes. Opt. Express 2010, 18, 23394–23405. [Google Scholar] [CrossRef] [PubMed]
- Li, H.; Li, G.; Ye, Y.; Lin, L. A high-efficiency acquisition method of LED multispectral images based on frequency-division modulation and RGB camera. Opt. Commun. 2021, 480, 126492. [Google Scholar] [CrossRef]
- Haneishi, H.; Hasegawa, T.; Hosoi, A.; Yokoyama, Y.; Tsumura, N.; Miyake, Y. System design for accurately estimating the spectral reflectance of art paintings. Appl. Opt. 2000, 39, 6621–6632. [Google Scholar] [CrossRef] [Green Version]
- Shimano, N.; Terai, K.; Hironaga, M. Recovery of spectral reflectances of objects being imaged by multispectral cameras. J. Opt. Soc. Am. A 2007, 24, 3211–3219. [Google Scholar] [CrossRef] [PubMed]
- Shimano, N. Recovery of spectral reflectances of objects being imaged without prior knowledge. IEEE Trans. Image Processing 2006, 15, 1848–1856. [Google Scholar] [CrossRef] [PubMed]
- Agahian, F.; Amirshahi, S.A.; Amirshahi, S.H. Reconstruction of reflectance spectra using weighted principal component analysis. Color Res. Appl. 2008, 33, 360–371. [Google Scholar] [CrossRef]
- Shen, H.L.; Wan, H.J.; Zhang, Z.C. Estimating reflectance from multispectral camera responses based on partial least-squares regression. J. Electron. Imaging 2010, 19, 020501. [Google Scholar] [CrossRef]
- Xiao, G.S.; Wan, X.X.; Wang, L.X.; Liu, S.W. Reflectance spectra reconstruction from trichromatic camera based on kernel partial least square method. Opt. Express 2019, 27, 34921–34936. [Google Scholar] [CrossRef] [PubMed]
- Lopez, M.; Hernandez, J.; Valero, E.; Romero, J. Selecting algorithms, sensors, and linear bases for optimum spectral recovery of skylight. J. Opt. Soc. Am. A 2007, 24, 942–956. [Google Scholar] [CrossRef] [PubMed]
- Arias, L.; Sbarbaro, D.; Torres, S. Removing baseline flame’s spectrum by using advanced recovering spectrum techniques. Appl. Opt. 2012, 51, 6111–6116. [Google Scholar] [CrossRef] [PubMed]
- Toro, C.; Arias, L.; Torres, S.; Sbarbaro, D. Flame spectra-temperature estimation based on a color imaging camera and a spectral reconstruction technique. Appl. Opt. 2014, 53, 6351–6361. [Google Scholar] [CrossRef]
- Tschannerl, J.; Ren, J.C.; Zhao, H.M.; Kao, F.J.; Marshall, S.; Yuen, P. Hyperspectral image reconstruction using multi-color and time-multiplexed LED illumination. Opt. Lasers Eng. 2019, 121, 352–357. [Google Scholar] [CrossRef]
- Fu, Y.; Zheng, Y.R.; Zhang, L.; Huang, H. Spectral reflectance recovery from a single RGB image. IEEE Trans. Comput. Imaging 2018, 4, 382–394. [Google Scholar] [CrossRef]
- Wu, G.Y.; Xiong, Y.F.; Li, X.Z. Spectral sparse recovery from a single RGB image. Laser Phys. Lett. 2021, 18, 095201. [Google Scholar] [CrossRef]
- Paray, J.N. LED Selection for Spectral (Multispectral) Imaging. Master’s Thesis, Rochester Institute of Technology, Rochester, NY, USA, May 2020. [Google Scholar]
- Parkkinen, J.P.S.; Hallikainen, J.; Jaaskelainen, T. Characteristic spectra of Munsell colors. J. Opt. Soc. Am. A. 1989, 6, 318–322. [Google Scholar] [CrossRef]
- Han, S.; Sato, I.; Okabe, T.; Sato, Y. Fast spectral reflectance recovery using DLP projector. Int. J. Comput. Vis. 2014, 110, 172–184. [Google Scholar] [CrossRef]
- Lahitani, A.R.; Permanasari, A.E.; Setiawan, N.A. Cosine similarity to determine similarity measure: Study case in online essay assessment. In Proceedings of the 2016 4th International Conference on Cyber and IT Service Management, Bandung, Indonesia, 26–27 April 2016; pp. 1–6. [Google Scholar] [CrossRef]
- Database [DB/OL]. Available online: http://www.cs.columbia.edu/CAVE/databases/multispectral/ (accessed on 20 January 2022).
- Hu, M.C.; Lan, K.C.; Fang, W.C.; Huang, Y.C. Automated tongue diagnosis on the smartphone and its applications. Comput. Methods Programs Biomed. 2019, 174, 51–64. [Google Scholar] [CrossRef]
- Liu, Z.; Wang, H.J.; Li, Q.L. Tongue tumor detection in medical hyperspectral images. Sensors 2012, 12, 162–174. [Google Scholar] [CrossRef] [PubMed] [Green Version]
- Zhang, D.; Zhang, J.H.; Wang, Z.; Sun, M.J. Tongue colour and coating prediction in traditional Chinese medicine based on visible hyperspectral imaging. IET Image Process 2019, 13, 2265–2270. [Google Scholar] [CrossRef]
- Xu, J.T. Clinical Illustration of Tongue Diagnosis of Traditional Chinese Medicine; Chemical Industry Press: Beijing, China, 2017; p. 3. [Google Scholar]

| Computation Time | PSNR (Mean Value of All Wavebands) | SAM (Mean Value of All Spatial Points) | SMAPE (Mean Value of All Spatial Points) | |
|---|---|---|---|---|
| Point-by-point optimization | 1162.2 s | 30.38 dB | 0.1545 | 15.84% |
| Our method (th = 0.1) | 342.0 s (29.4%) | 31.56 dB | 0.1407 | 14.95% |
| Our method (th = 0.3) | 74.5 s (6.4%) | 31.35 dB | 0.1481 | 15.28% |
| Our method (th = 0.5) | 64.0 s (5.5%) | 31.09 dB | 0.1500 | 15.99% |
| Average Spectra of Tip and Middle Part of Tongue | Color Value Under CIE1964 10° and D50 Illumination | Standard Color of CIE-LAB | |
|---|---|---|---|
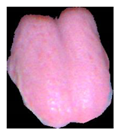 Sample 1 | 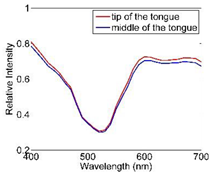 | Tip part (Tongue body): CIE-LAB (77.09, 28.33, −8.17) |  |
| Middle part (Tongue fur): CIE-LAB (76.13, 28.13, −8.55) |  | ||
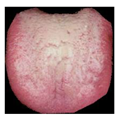 Sample 2 | 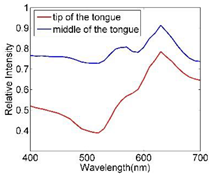 | Tip part (Tongue body): CIE-LAB (77.98, 18.40, 6.29) |  |
| Middle part (Tongue fur): CIE-LAB (91.02, 4.77, 2.27) |  |
Publisher’s Note: MDPI stays neutral with regard to jurisdictional claims in published maps and institutional affiliations. |
© 2022 by the authors. Licensee MDPI, Basel, Switzerland. This article is an open access article distributed under the terms and conditions of the Creative Commons Attribution (CC BY) license (https://creativecommons.org/licenses/by/4.0/).
Share and Cite
Ma, C.; Yu, M.; Chen, F.; Lin, H. An Efficient and Portable LED Multispectral Imaging System and Its Application to Human Tongue Detection. Appl. Sci. 2022, 12, 3552. https://doi.org/10.3390/app12073552
Ma C, Yu M, Chen F, Lin H. An Efficient and Portable LED Multispectral Imaging System and Its Application to Human Tongue Detection. Applied Sciences. 2022; 12(7):3552. https://doi.org/10.3390/app12073552
Chicago/Turabian StyleMa, Cui, Ming Yu, Fokui Chen, and Hui Lin. 2022. "An Efficient and Portable LED Multispectral Imaging System and Its Application to Human Tongue Detection" Applied Sciences 12, no. 7: 3552. https://doi.org/10.3390/app12073552
APA StyleMa, C., Yu, M., Chen, F., & Lin, H. (2022). An Efficient and Portable LED Multispectral Imaging System and Its Application to Human Tongue Detection. Applied Sciences, 12(7), 3552. https://doi.org/10.3390/app12073552