
Geophysical Imaging of the Critical Zone along the Eastern Betic Shear Zone (EBSZ), SE Iberian Peninsula

 ,
,  , , ,
, , ,  , , , ,
Abstract
:1. Introduction
2. Geological Setting
3. Geophysical Data and Methodology
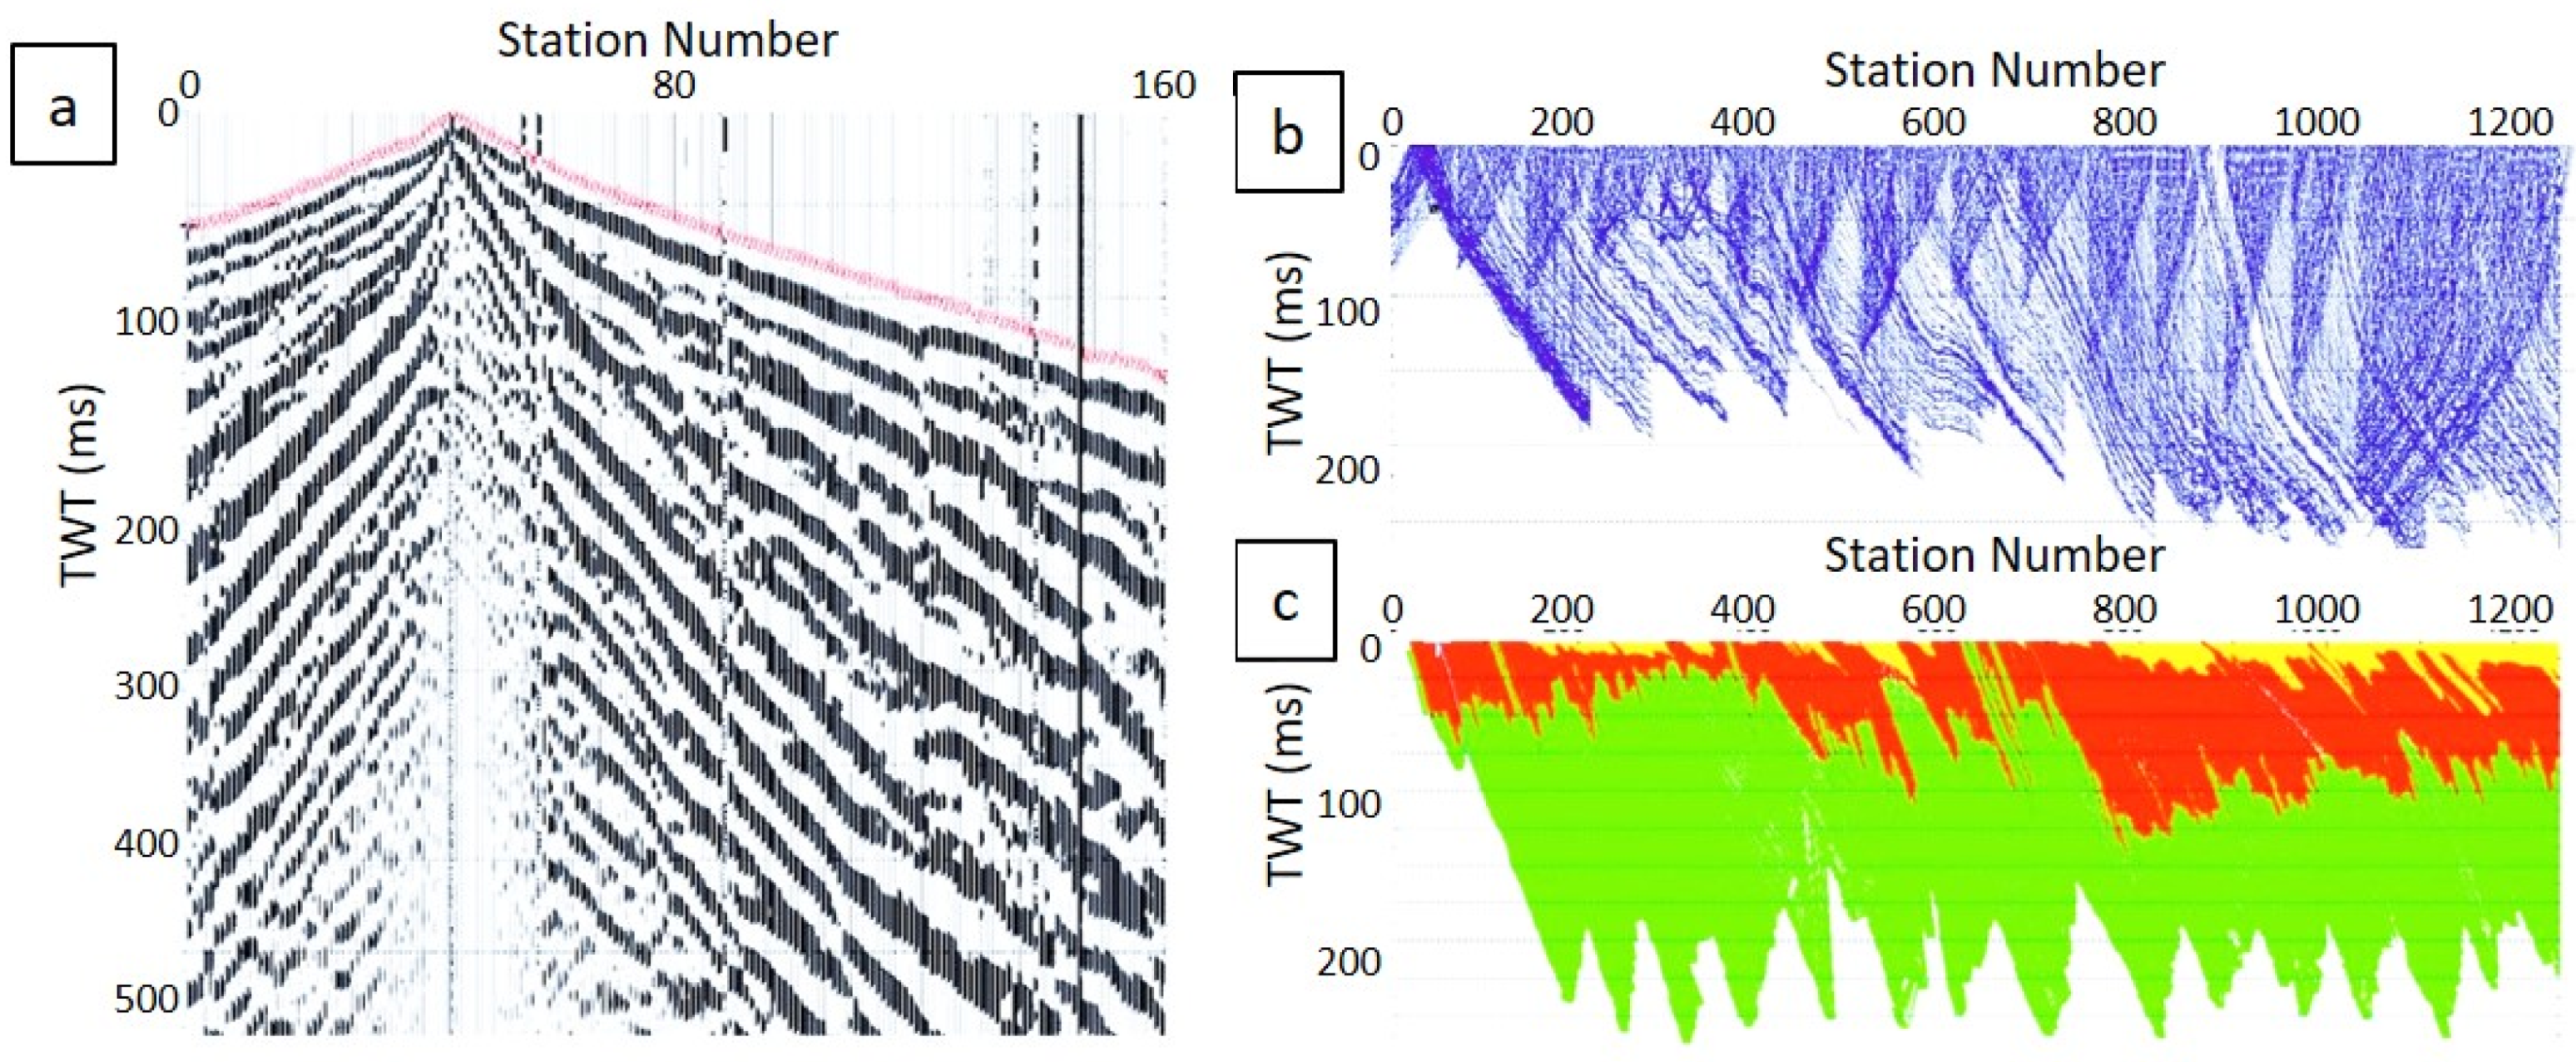
3.1. Electrical Resistivity Tomography
3.2. Seismic Data Acquisition
3.3. Multichannel Analysis of Surface Waves
3.4. P-Wave Tomography
4. Results
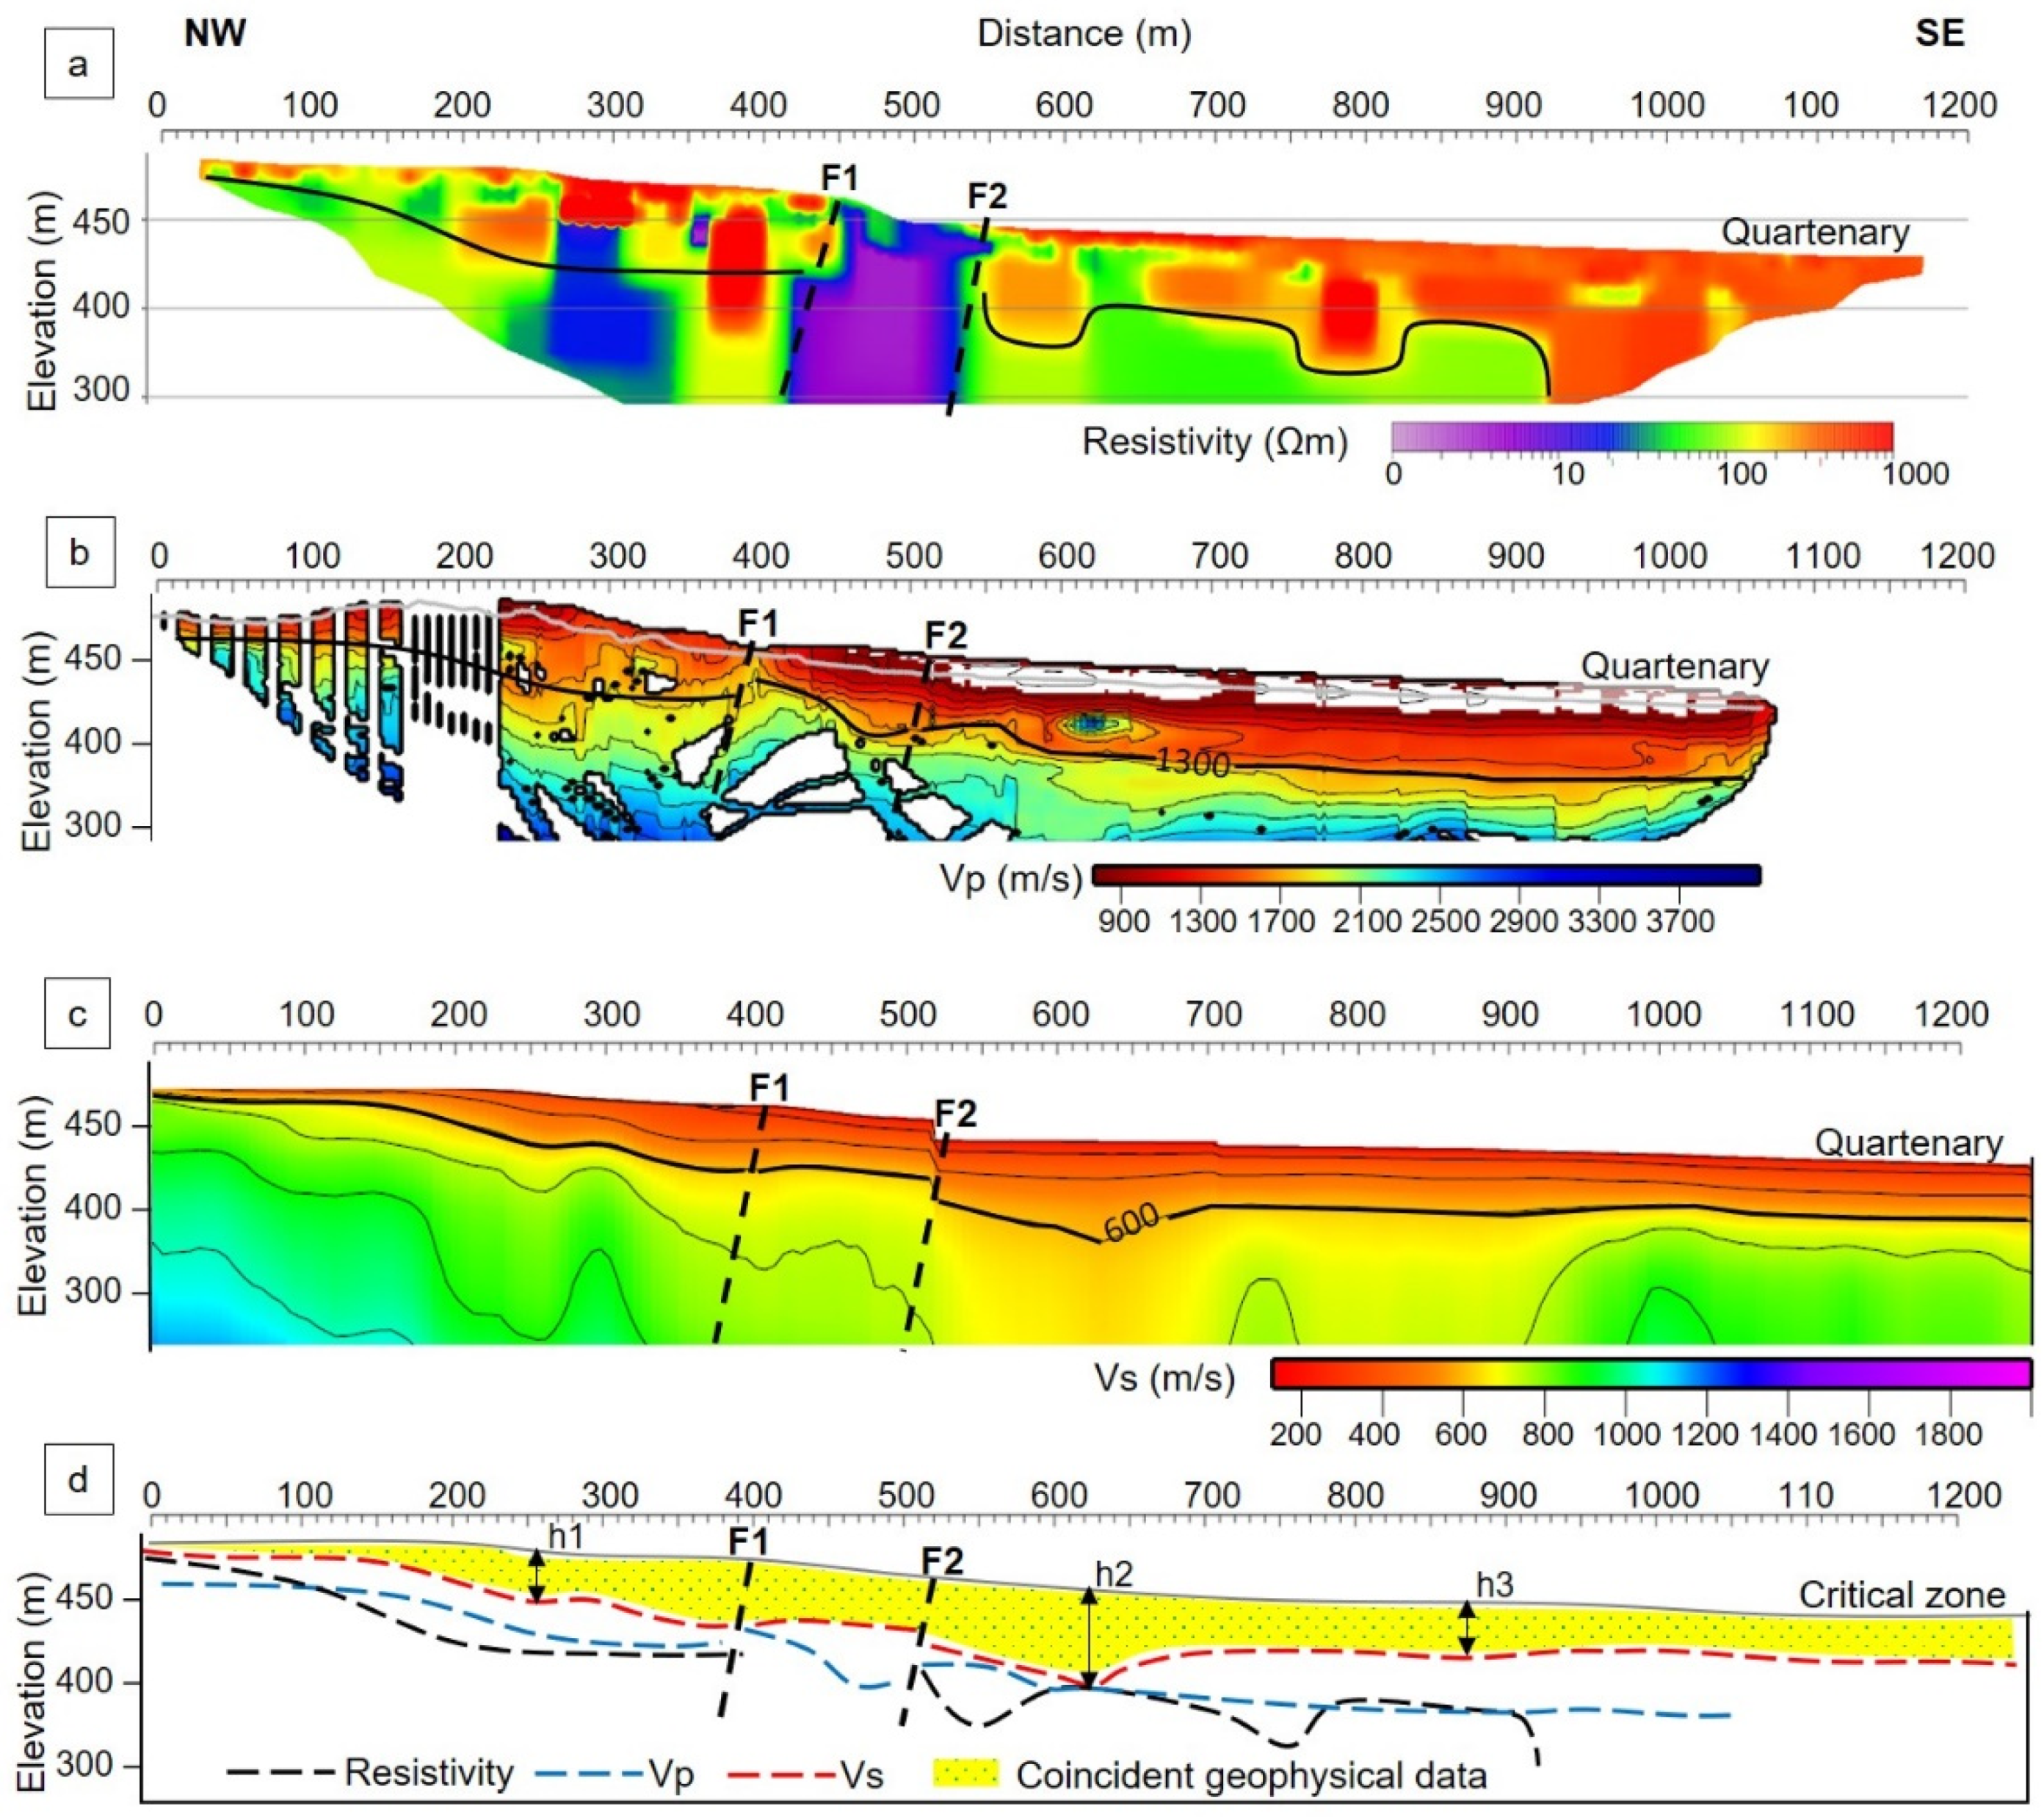
4.1. La Torrecilla
4.2. La Salud North
4.3. La Salud South
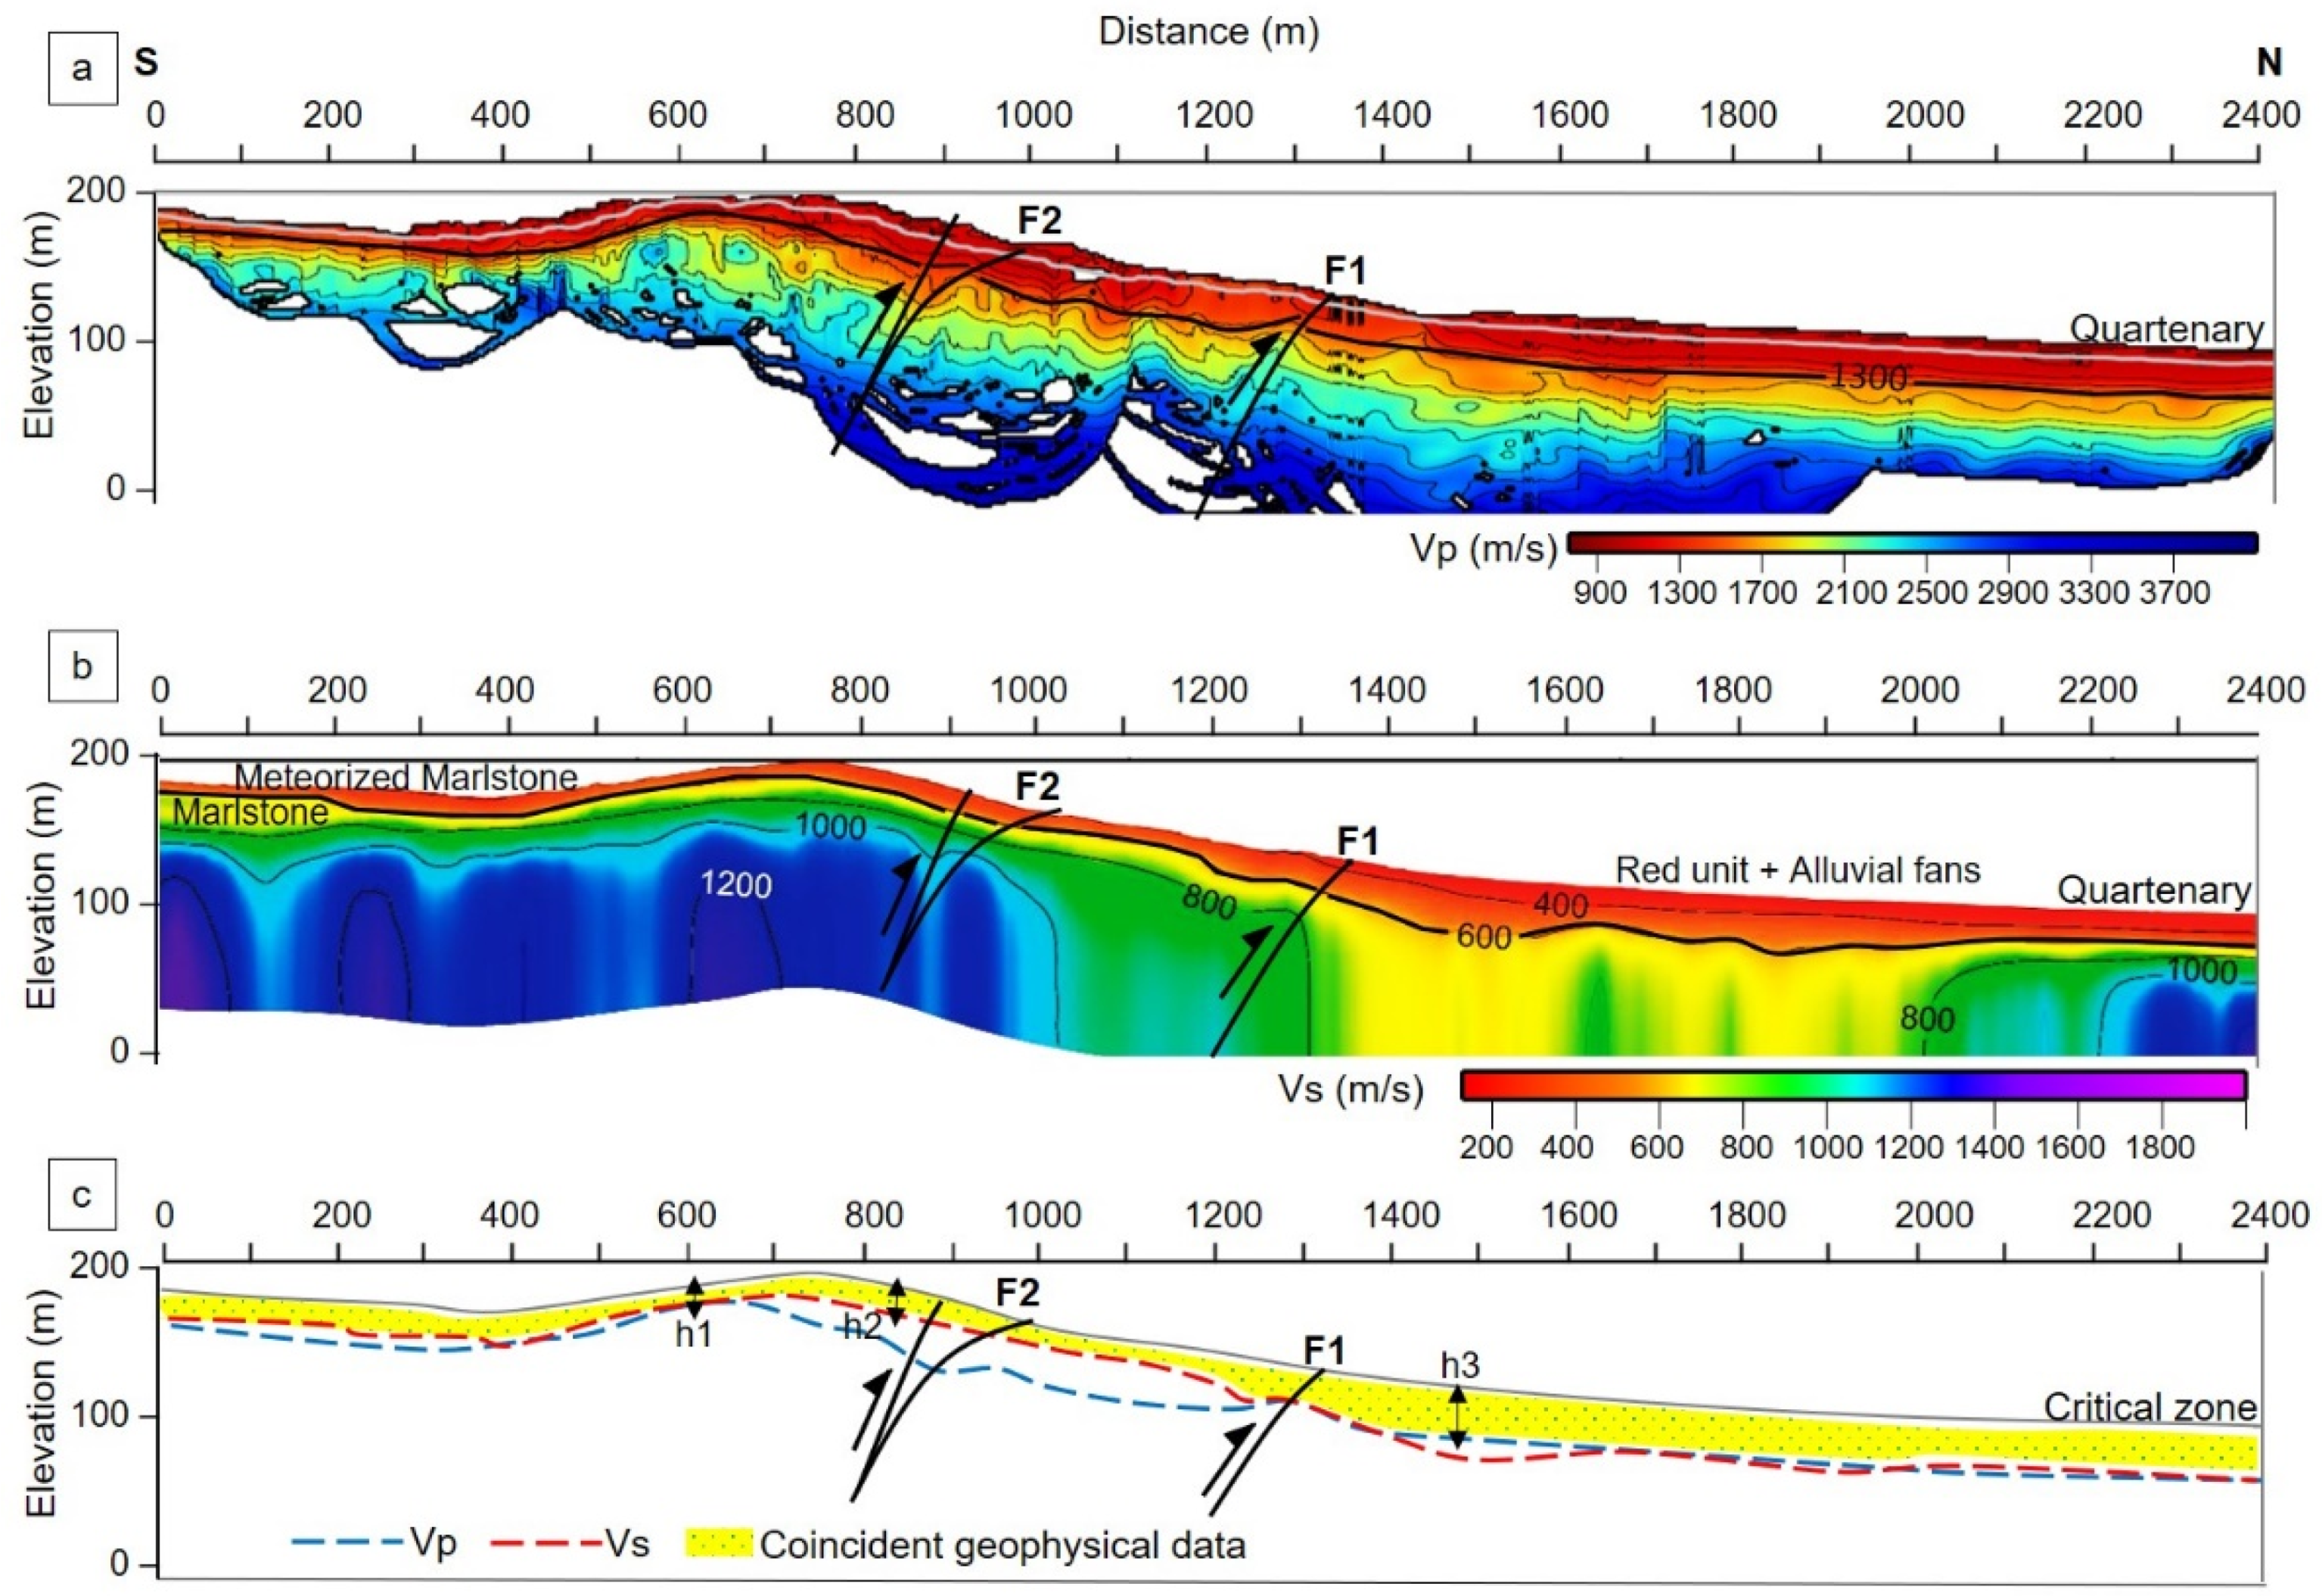
4.4. Carrascoy
5. Implications and Discussion
5.1. The Advantages of Multi-Geophysical Measurements and Implications for the Interpretation of the CZ
5.2. The Impact of a Fault Zone, Elevation, and Topographic Slope on CZ Thickness
5.3. Relationship between the Geological Units and the Cz Thickness
6. Conclusions
Author Contributions
Funding
Institutional Review Board Statement
Informed Consent Statement
Data Availability Statement
Acknowledgments
Conflicts of Interest
References
- Banwart, S.A.; Nikolaidis, N.P.; Zhu, Y.G.; Peacock, C.L.; Sparks, D.L. Soil Functions: Connecting Earth’s Critical Zone. Annu. Rev. Earth Planet. Sci. 2019, 47, 333–359. [Google Scholar] [CrossRef]
- Brantley, S.L.; Goldhaber, M.B.; Ragnarsdottir, K.V. Crossing disciplines and scales to understand the critical zone. Elements 2007, 3, 307–314. [Google Scholar] [CrossRef]
- National Research Council (NRC). Basic Research Opportunities in the Earth Sciences; National Academies Press: Washington, DC, USA, 2001. [Google Scholar]
- European Commission. Communication from the Commission to the Council, the European Parliament, the European Economic, and Social Committee, and the Committee of Regions. In Thematic Strategy for Soil Protection (COM 2006. 231); Commission of the European Communities: Brussels, Belgium, 2006. [Google Scholar]
- Panagos, P.; Van Liedekerke, M.; Jones, A.; Montanarella, L. European Soil DataCentre: Response to European policy support and public data requirements. Land Use Policy 2012, 29, 329–338. [Google Scholar] [CrossRef]
- Field, J.P.; Breshears, D.D.; Law, D.J.; Villegas, J.C.; López-Hoffman, L.; Brooks, P.D.; Chorover, J.; Barron-Gafford, G.A.; Gallery, R.E.; Litvak, M.E.; et al. Critical Zone Services: Expanding Context, Constraints, and Currency beyond Ecosystem Services. Vadose Zone J. 2015, 14, vzj2014.10.0142. [Google Scholar] [CrossRef] [Green Version]
- Montanarella, L.; Panagos, P. Policy relevance of critical zone science. Land Use Policy 2015, 49, 86–91. [Google Scholar] [CrossRef]
- Anderson, S.P.; Hinckley, E.-L.; Kelly, P.; Langston, A. Variation in critical zone processes and architecture across slope aspects. Procedia Earth Planet. Sci. 2014, 10, 28–33. [Google Scholar] [CrossRef] [Green Version]
- Anderson, R.S.; Anderson, S.P.; Tucker, G.E. Rock damage and regolith transport by frost: An example of climate modulation of the geomorphology of the critical zone. Earth Surf. Process. Land. 2013, 38, 299–316. [Google Scholar] [CrossRef]
- Rempe, D.M.; Dietrich, W.E. A bottom-up control on fresh-bedrock topography under landscapes. Proc. Natl. Acad. Sci. USA 2014, 111, 6576–6581. [Google Scholar] [CrossRef] [Green Version]
- Xu, X.; Liu, W. The global distribution of Earth’s critical zone and its controlling factors. Geophys. Res. Lett. 2017, 44, 3201–3208. [Google Scholar] [CrossRef]
- Grant, G.E.; Dietrich, W.E. The frontier beneath our feet. Water Resour. Res. 2017, 53, 2605–2609. [Google Scholar] [CrossRef]
- Rempe, D.M.; Dietrich, W.E. Direct observations of rock moisture, a hidden component of the hydrologic cycle. Proc. Natl. Acad. Sci. USA 2018, 115, 2664–2669. [Google Scholar] [CrossRef] [Green Version]
- Lin, H. Earth’s critical zone and hydropedology: Concepts, characteristics and advances. Hydrol. Earth Syst. Sci. 2010, 14, 24–45. [Google Scholar] [CrossRef] [Green Version]
- Chorover, J.; Troch, P.A.; Rasmussen, C.; Brooks, P.; Pelletier, J.; Breshears, D.D.; Huxman, T.; Lohse, K.; McIntosh, J.; Meixner, T.; et al. How water, carbon, and energy drive critical zone evolution: The Jemez-Santa Catalina Critical Zone Observatory. Vadose Zone J. 2011, 10, 884–899. [Google Scholar] [CrossRef] [Green Version]
- Lin, H.; Hopmans, J.W.; Richter, D.D. Interdisciplinary sciences in a global network of Critical- Zone Observatories. Vadose Zone J. 2011, 10, 781–785. [Google Scholar] [CrossRef]
- Rasmussen, C.; Troch, P.A.; Chorover, J.; Brooks, P.; Pelletier, J.; Huxman, T.E. An open system energy-based framework for predicting critical zone structure and function. Biogeochemistry 2011, 102, 15–29. [Google Scholar] [CrossRef]
- ISRM (International Society of Rock Mechanics). Rock Characterization, Testing and Monitoring; ISRM Suggested Methods; Pergamon Press: Oxford, UK, 1981; ISBN 0080273084/9780080273082. [Google Scholar]
- Holbrook, W.; Riebe, C.S.; Elwaseif, M.; Hayes, J.L.; Basler-Reeder, K.; Harry, D.L.; Malazian, A.; Dosseto, A.; Hartsough, P.C.; Hapmans, J.W. Geophysical constraints on deep weathering and water storage potential in the Southern Sierra Critical Zone Observatory. Earth Surf. Processes Landf. 2014, 39, 366–380. [Google Scholar] [CrossRef] [Green Version]
- Schaetzl, R.J.; Anderson, S. Soils–Genesis and Geomorphology; Cambridge University Press: Cambridge, UK, 2005. [Google Scholar]
- Fletcher, R.C.; Brantley, S.L. Reduction of bedrock blocks as cornerstones in the weathering profile: Observations and model. Am. J. Sci. 2010, 310, 131–164. [Google Scholar] [CrossRef]
- Clarke, B.A.; Burbank, D.W. Quantifying bedrock-fracture patterns within the shallow subsurface: Implications for rock mass strength, bedrock landslides, and erodibility. J. Geophys. Res. 2011, 116, F04009. [Google Scholar] [CrossRef] [Green Version]
- Slim, M.; Perron, J.T.; Martel, S.J.; Singha, K. Topographic stress and rock fracture: A two-dimensional numerical model for arbitrary topography and preliminary comparison with bore-hole observations. Earth Surf. Processes Landf. 2015, 40, 512–529. [Google Scholar] [CrossRef] [Green Version]
- Flinchum, B.A.; Holbrook, W.S.; Carr, B.J. What Do P-Wave Velocities Tell Us about the Critical Zone? Front. Water 2022, 3, 772185. [Google Scholar] [CrossRef]
- St. Clair, J.; Moon, S.; Holbrook, W.S.; Perron, J.T.; Riebe, C.S.; Martel, S.J.; Carr, B.; Harman, C.; Singha, K.; de Richter, D. Geophysical imaging reveals topographic stress control of bedrock weathering. Science 2015, 350, 534–538. [Google Scholar] [CrossRef] [Green Version]
- Place, J.; Géraud, Y.; Diraison, M.; Herquel, G.; Edel, J.-B.; Bano, M.; Le Garzic, E.; Walter, B. Structural control of weathering processes within exhumed granitoids: Compartmentalisation of geophysical properties by faults and fractures. J. Struct. Geol. 2016, 84, 102–119. [Google Scholar] [CrossRef]
- Handoyo, H.; DeFelipe, I.; Martín-Banda, R.; García-Mayordomo, J.; Martí, D.; Martínez-Díaz, J.J.; Insua-Arévalo, J.M.; Teixidó, T.; Alcalde, J.; Palomeras, I.; et al. Characterization of the shallow structure across the frontal strands of the Carrascoy fault system (SE Iberian Peninsula), an oblique reverse fault within an active strike-slip fault system. Geol. Acta, 2022; in review. [Google Scholar]
- De Larouzière, F.D.; Bolze, J.; Bordet, P.; Hernández, J.; Montenat, C.; Ott d’Estevou, P. The Betic segment of the lithospheric Trans-Alboran shear zone during the Late Miocene. Tectonophysics 1988, 152, 41–52. [Google Scholar] [CrossRef]
- DeMets, C.; Iaffaldano, G.; Merkouriev, S. High-resolution Neogene and Quaternary estimates of nubia-eurasia-north America plate motion. Geophys. J. Int. 2015, 203, 416–427. [Google Scholar] [CrossRef]
- Egeler, C.; Simon, O.J. Orogenic evolution of the betic zone (Betic cordilleras, Spain) with emphasis on the nappe structure. Geol. Mijnbouw 1969, 48, 295–305. [Google Scholar]
- Azañón, J.M.; Crespo-Blanc, A.; García-Dueñas, V. Continental collision, crustal thinning and nappe forming during the pre-Miocene evolution of Alpujarride Complex (Alboran Domain, Betic). J. Struct. Geol. 1997, 19, 1055–1071. [Google Scholar] [CrossRef]
- Sanz de Galdeano, C. Geologic evolution of the Betic Cordilleras in the Western Mediterranean. Miocene to the present. Tectonophysics 1990, 172, 107–119. [Google Scholar] [CrossRef]
- Azañón, J.M.; Crespo-Blanc, A. Exhumation during a continental collision inferred from the tectonometamorphic evolution of the Alpujarride Complex in the central Betics (Alboran Domain, SE Spain). Tectonics 2000, 19, 549–565. [Google Scholar] [CrossRef]
- López Ruiz, J.; Cebriá, J.M.; Doblas, M.; Benito, R. El vulcanismo Neógeno Peninsular. In Geologia de España; Vera, J.A., Ed.; SGE-IGME: Madrid, Spain, 2004; pp. 678–680. [Google Scholar]
- Montenat, C.; Barrier, P.; Di Geronimo, I. The Messina Strait, past and present: A review. In Le Détroit de Messine (Italie). Evolutiontectono-Sédimentaire Récente (Pliocène et Quaternaire) et Environnement Actuel; Barrier, P., Di Geronimo, I., Montenat, C., Eds.; Doc. et Trav. IGAL: Paris, France, 1987; Volume 11, pp. 7–14. [Google Scholar]
- Khazaradze, G.; Gárate, J.; Suriñach, E.; Davila, J.M.; Asensio, E. Crustal deformation in south-eastern Betics from CuaTe-Neo GPS network. Geotemas 2008, 10, 1023–1026. [Google Scholar]
- Echeverria, A.; Khazaradze, G.; Garate, J.; Asensio, E.; Masana, E.; Suriñach, E. Present-day GPS crustal deformation rates in the Eastern Betics (SE. Spain). In Proceedings of the Geophysical Research Abstracts 13, EGU General Assembly 2011, Viena, Austria, 3–8 April 2011. [Google Scholar]
- De Larouzière, F.; Montenat, C.; O’Estevou, P.O.; Griveaud, P. Evolution simultanée des basin néogènes en compression et enextension dans un couloir de décrochement: Hinojar et Malarron (Sud Est de l’Espagn). Bull. Cent. Rech. Explor. Prod. EIf-Aquitaine 1987, 11, 23–38. [Google Scholar]
- Vissers, R.L.M.; Meijninger, B.M.L. The 11 May 2011 earthquake at Lorca (SE Spain) viewed in a structural-tectonic context. Solid Earth 2011, 2, 199–204. [Google Scholar] [CrossRef] [Green Version]
- Martínez-Díaz, J.J. Stress field variety related to fault interaction in a reverse oblique-slip fault: The Alhama de Murcia Fault, Betic Cordillera, Spain. Tectonophysics 2002, 356, 291–305. [Google Scholar] [CrossRef]
- Silva, P.G. Evolución Geodinámica de la Depresión del Guadalentín (Murcia) desde el Mioceno Superior Hasta la Actualidad: Neotectónica y Geomorfología. Ph.D. Thesis, Universidad Complutense de Madrid, Madrid, Spain, 1994; 642p. [Google Scholar]
- Martínez-Díaz, J.J.; Masana, E.; Ortuño, M. Active tectonics of the Alhama de Murcia fault, Betic Cordillera, Spain. J. Iber. Geol. 2012, 38, 253–270. [Google Scholar] [CrossRef] [Green Version]
- Gómez Novell, O. Paleoseismic Transect across the Alhama de Murcia Fault and Implications of a Fault-Based Seismic Hazard Assessment for the Eastern Betics. Ph.D. Thesis, Departament—Dinàmica de la Terra i de l’Oceà, Universitat de Barcelona, Barcelona, Spain, 2021. [Google Scholar] [CrossRef]
- Martín-Banda, R.; García-Mayordomo, J.; Insua-Arévalo, J.M.; Salazar, Á.E.; Rodríguez-Escudero, E.; Álvarez-Gómez, J.A.; Medialdea, A.; Herrero, M.J. New insights on the seismogenic potential of the Eastern Betic Shear Zone (SE Iberia): Quaternary activity and paleoseismicity of th SW segment of the Carrascoy Fault Zone. Tectonics 2016, 35, 55–75. [Google Scholar] [CrossRef]
- Marín-Lechado, C.; Roldán-García, F.J.; Pineda-Velasco, A.; Martínez-Zubieta, P.; Rodero-Pérez, J.; Díaz-Pinto, G. Mapa Geológico Digital Continuo E 1:50000, Zonas Internas de las Cordilleras Béticas (Zona-2100): GEODE. Mapa Geológico Digital Continuo de España. 2011. Available online: https://mapas.igme.es/gis/services/Cartografia_Geologica/IGME_MAGNA_50/MapServer/WMSServer (accessed on 22 March 2022).
- García-Mayordomo, J.; Martínez-Díaz, J.J.; Capote, R.; Martín-Banda, R.; Insua-Arévalo, J.M.; Álvarez-Gómez, J.A.; Perea, H.; González, A.; Lafuente, P.; Martín-González, F.; et al. Modelo de Zonas Sismogénicas para el Cálculo de la Peligrosidad Sísmica en España. In Proceedings of the 7th Asamblea Hispano-Portuguesa de Geodesia y Geofísica, Donostia, Spain, 25–28 June 2012. [Google Scholar] [CrossRef]
- IGME; ENRESA. Mapas Neotectónico y Sismotectónico de España a Escala 1:1.000.000. Vol. I (237 pp.) and Vol. II (167 pp.). 1998. Available online: www.igme.es (accessed on 22 March 2022).
- IGN-UPM. Actualización de Mapas de Peligrosidad Sísmica de España 2012; Centro Nacional de Información Geográfica, Instituto Geográfico Nacional: Madrid, Spain, 2013; 267p. [Google Scholar]
- Martínez-Pagán, P.; Navarro, M.; Pérez-Cuevas, J.; Alcalá, F.J.; García-Jerez, A.; Vidal, F. Shear-wave velocity structure from MASW and SPAC methods: The case of Adra town, SE Spain. Near Surf. Geophys. 2018, 16, 356–371. [Google Scholar] [CrossRef]
- Martín-Banda, R.; Insua-Arévalo, J.M.; García-Mayordomo, J. Slip Rate Variation During the Last ∼210 ka on a Slow Fault in a Transpressive Regime: The Carrascoy Fault (Eastern Betic Shear Zone, SE Spain). Front. Earth Sci. 2021, 8, 599608. [Google Scholar] [CrossRef]
- Martínez-Díaz, J.J.; Insua-Arévalo, J.M.; Tsige, M.; Rodríguez-Escudero, E.; Alonso-Henar, J.; Crespo, J.; Jiménez-Molina, D.; Moratalla, J.M.; Rodríguez-Péces, M.J.; Álvarez-Gómez, J.A.; et al. FAM-1 Borehole: First results from the scientific drilling of the Alhama de Murcia Fault, Betic Cordillera, Spain. GeoTemas 2016, 16, 579–582. [Google Scholar]
- Martínez-Díaz, J.J.; Masana, E.; Hernández-Enrile, J.L.; Santanach, P. Effects of repeated paleoearthquakes on the Alhama de Murcia Fault (Betic Cordillera, Spain) on the Quaternary evolution of an alluvial fan system. Ann. Geophys. 2003, 46, 775–791. [Google Scholar] [CrossRef]
- Masana, E.; Martínez-Díaz, J.J.; Hernández-enrile, J.L.; Santanach, P. The Alhama de Murcia fault (SE Spain), a seismogenic fault in a diffuse plate boundary: Seismotectonic implications for the Ibero-Magrebian region. J. Geophys. Res. 2004, 109, 1–17. [Google Scholar] [CrossRef]
- Ferrater, M.; Echeverría, A.; Masana, E.; Martínez-Díaz, J.J.; Sharp, W.D. A 3D measurement of the offset in paleoseismological studies. Comput. Geosci. 2016, 90, 156–163. [Google Scholar] [CrossRef] [Green Version]
- Silva, P. Landscapes and Landforms of Spain; Gutiérrez, F., Gutiérrez, M., Eds.; Springer: Dordrecht, The Netherlands, 2014; World Geomorphological Landscapes; Volume 2, pp. 273–288. [Google Scholar] [CrossRef]
- Griffiths, D.H.; Barker, R.D. Two-dimensional resistivity imaging and modelling in areas of complex geology. J. Appl. Geophys. 1993, 29, 211–226. [Google Scholar] [CrossRef]
- Loke, M.H.; Barker, R.D. Rapid least-squares inversion of apparent resistivity pseudosections by a quasi-Newton method. Geophys. Prospect. 1996, 44, 131–152. [Google Scholar] [CrossRef]
- McInnis, D.; Silliman, S.; Boukari, M.; Yalo, N.; Orou-Pete, S.; Fertenbaugh, C.; Sarre, K.; Fayomi, H. Combined application of electrical resistivity and shallow groundwater sampling to assess salinity in a shallow coastal aquifer in Benin. West Africa. J. Hydrol. 2013, 505, 335–345. [Google Scholar] [CrossRef]
- Zarroca, M.; Bach, J.; Linares, R.; Pellicer, X.M. Electrical methods (VES and ERT) for identifying, mapping and monitoring different saline domains in a coastal plain region (Alt Emporda, Northern Spain). J. Hydrol. 2011, 409, 407–422. [Google Scholar] [CrossRef]
- Samouëlian, A.; Cousin, I.; Tabbagh, A.; Bruand, A.; Richard, G. Electrical resistivity survey in soil science: A review. Soil Till. Res. 2005, 83, 173–193. [Google Scholar] [CrossRef] [Green Version]
- Friedman, S.P. Soil properties influencing apparent electrical conductivity: A review. Comput. Electron. Agric. 2005, 46, 45–70. [Google Scholar] [CrossRef]
- Ardanaz, O.; Dávila, L.; Teixidó, T.; Martí, D.; Martí, A.; Queralt, P.; Rodríguez-Escudero, E.; Camacho, J.; Martínez-Díaz, J.; Carbonell, R. Geophysical characterization of the Alhama de Murcia Fault in the Torrecilla sector. In Proceedings of the III Reunión Ibérica Sobre Fallas Activas y Paleosismologia (Iberfault), Alicante, Spain, 11–13 June 2018. [Google Scholar]
- Dahlin, T.; Zhou, B. Multiple-gradient array measurements for multichannel 2D resistivity imaging. Near Surf. Geophys. 2006, 4, 113–123. [Google Scholar] [CrossRef] [Green Version]
- Zhou, B.; Bouzidi, Y.; Ullah, S.; Asim, M. A full-range gradient survey for 2D electrical resistivity tomography. Near Surf. Geophys. 2020, 18, 609–626. [Google Scholar] [CrossRef]
- Park, C.B.; Miller, R.D.; Xia, J. Multichannel analysis of surface waves. Geophysics 1999, 64, 800–808. [Google Scholar] [CrossRef] [Green Version]
- Xia, J.; Miller, R.D.; Park, C.B. Estimation of near-surface shear-wave velocity by inversion of Rayleigh waves. Geophysics 1999, 64, 691–700. [Google Scholar] [CrossRef] [Green Version]
- Park, C.B.; Xia, J.; Miller, R.D. Imaging dispersion curves of surface waves on multi-channel record. SEG Technical Program Expanded Abstracts. Society of Exploration Geophysicists. USA, 1998; pp. 1377–1380. Available online: https://library.seg.org/doi/10.1190/SEGEAB.17# (accessed on 22 March 2022).
- Benz, H.M.; Chouet, B.A.; Dawson, P.B.; Lahr, J.C.; Page, R.A.; Hole, J.A. Three-dimension P and S wave velocity structure of Redoubt Volcano, Alaska. J. Geophys. Res. 1996, 101, 8111–8128. [Google Scholar] [CrossRef]
- Tryggvason, A.; Rognvaldsson, S.T.; Flovenz, O.G. Three-dimensional imaging of the P- and S-wave velocity structure and earthquake locations beneath Southwest Iceland. Geophys. J. Int. 2002, 151, 848–866. [Google Scholar] [CrossRef] [Green Version]
- Podvin, P.; Lecomte, I. Finite different computation of traveltimes in very contrasted velocity models: A massively parallel approach and its associated tools. Geophys. J. Int. 1991, 105, 271–284. [Google Scholar] [CrossRef]
- Tryggvason, A.; Bergman, B. A traveltime reciprocity discrepancy in the Podvin & Lecomte time3d finite difference algorithm. Geophys. J. Int. 2006, 165, 432–435. [Google Scholar]
- Vidale, J. Finite-difference calculation of travel times. Bull. Seismol. Soc. Am. 1988, 78, 2062–2076. [Google Scholar]
- Hole, J.A.; Zelt, B.C. 3-D finite-difference reflection traveltimes. Geophys. J. Int. 1995, 121, 427–434. [Google Scholar] [CrossRef] [Green Version]
- Olona, J.; Pulgar, J.A.; Fernández-Viejo, G.; López-Fernández, C.; González-Cortina, J.M. Weathering variations in a granitic massif and related geotechnical properties through seismic and electrical resistivity methods. Near Surf. Geophys. 2010, 8, 585–599. [Google Scholar] [CrossRef]
- Parsekian, A.D.; Singha, K.; Minsley, B.J.; Holbrook, W.S.; Slater, L. Multiscale geophysical imaging of the critical zone. Rev. Geophys. 2015, 53, 1–26. [Google Scholar] [CrossRef]
- Malehmir, A.; Socco, L.V.; Bastani, M.; Krawczyk, C.M.; Pfaffhuber, A.A.; Miller, R.D.; Maurer, H.; Frauenfelder, R.; Suto, K.; Bazin, S.; et al. Near-surface geophysical characterization of areas prone to natural hazards: A review of the current and perspective on the future. Adv. Geophys. 2016, 57, 51–146. [Google Scholar]
- Ogaya, X.; Alcalde, J.; Marzán, I.; Ledo, J.; Queralt, P.; Marcuello, A.; Martí, D.; Saura, E.; Carbonell, R.; Benjumea, B. Joint interpretation of magnetotelluric, seismic, and well-log data in Hontomín (Spain). Solid Earth 2016, 7, 943–958. [Google Scholar] [CrossRef] [Green Version]
- Befus, A.F.; Sheehan, M.; Leopold, S.P.; Anderson, S.P.; Anderson, R.S. Seismic Constraints on Critical Zone Architecture, Boulder Creek Watershed, Front Range, Colorado. Vadose Zone J. 2011, 10, 915–927. [Google Scholar] [CrossRef]
- Marzán, I.; Martí, D.; Lobo, A.; Alcalde, J.; Ruiz, M.; Alvarez-Marrón, J.; Carbonell, R. Joint interpretation of geophysical data: Applying machine learning to the modeling of an evaporitic sequence in Villar de Cañas (Spain). Eng. Geol. 2021, 288, 106126. [Google Scholar] [CrossRef]
- Linde, N.; Doetsch, J. Joint inversion in hydrogeophysics and near-surface geophysics. Integr. Imaging Earth Theory Appl. 2016, 218, 119. [Google Scholar]
- Nielson, T.; Bradford, J.; Holbrook, W.S.; Seyfried, M. The Effect of Aspect and Elevation on Critical Zone Architecture in the Reynolds Creek Critical Zone Observatory: A Seismic Refraction Study. Front. Water 2021, 3, 670524. [Google Scholar] [CrossRef]
- Anderson, S.P.; Blum, J.; Brantley, S.L.; Chadwick, O.; Chorover, J.; Derry, L.A.; Drever, J.I.; Hering, J.G.; Kirchner, J.W.; Kump, L.R.; et al. Proposed initiative would study Earth’s weathering engine. Eos Trans. Am. Geophys. Union 2004, 85, 265–269. [Google Scholar] [CrossRef]
- Nichols, G. Sedimentology and Stratigraphy, 2nd ed.; Wiley-Blackwell: London, UK; Washington, DC, USA, 2009. [Google Scholar]
- Heward, A.P. Alluvial fan sequence and megasequence models: With examples from Westphalian D–Stephanian B coalfields, northern Spain. In Fluvial Sedimentology; Miall, A.D., Ed.; Memoir 5, Canadian Society of Petroleum Geology: Calgary, AB, Canada, 1978; pp. 669–702. [Google Scholar]
- Martí, A.; Queralt, P.; Marcuello, A.; Ledo, J.; Rodríguez-Escudero, E.; Martínez-Díaz, J.J.; Campanyà, J.; Meqbel, N. Magnetotelluric characterization of the Alhama de Murcia Fault (Eastern Betics, Spain) and study of magnetotelluric interstation impedance inversion. Earth Planets Space 2020, 72, 16. [Google Scholar] [CrossRef] [Green Version]
- DeFelipe, I.; Alcalde, J.; Ivandic, M.; Martí, D.; Ruiz, M.; Marzán, I.; Diaz, J.; Ayarza, P.; Palomeras, I.; Fernandez-Turiel, J.; et al. Reassessing the lithosphere: SeisDARE, an open access seismic data repository. Earth Syst. Sci. Data 2021, 13, 1053–1071. [Google Scholar] [CrossRef]


| Software Package | Processing Step | Rationale |
|---|---|---|
| Prosys II (Iris Instruments) | Step 1 | Data point inspection |
| Resix2Dinv | Step 2 | Negative values removal (filtering) |
| Step 3 | Insertion of the topography | |
| Step 4 | Adjust the X,Z points along the GPS track | |
| Step 5 | Edition of bad data points | |
| Step 6 | Selection of inversion parameters | |
| Step 7 | Display of model parameterization and selection of a finer mesh (Figure 4a) | |
| Step 8 | With the new dataset, return to step 6 for a new iteration process (Figure 4b) |
| Seismic Survey Parameter | Description |
|---|---|
| Seismic source | Accelerated weight-drop (200 kg) |
| Source interval | 6 m |
| Source impacts | 1 |
| Transect Length | a. La Torrecilla = 1278 m b. La Salud North = 960 m c. La Salud South = 1488 m d. Carrascoy = 2496 m |
| Receiver interval | 2 m |
| Geophone Natural Frequency | 5 Hz |
| Recording Time | 4 s |
| Sample rate | 1 ms |
| File format | SEGY |
| Profile | Geological Units | Minimum CZ (m) | Maximum CZ (m) | Average CZ (m) |
|---|---|---|---|---|
| La Torrecilla | Quaternary fluvial sediments and alluvial fan deposits (quartzites conglomerates and unconsolidated deposits formed by gravel, sands, silts, and clays). | 30–40 | 50–60 | 40–50 |
| La Salud North | Quaternary formations (alluvial gravels and siltstones). | 30–40 | 40–50 | 35–45 |
| La Salud South | Quaternary formations (alluvial gravels and siltstones). | 30–40 | 50–55 | 40–47.5 |
| Carrascoy | The Messinian rocks are associated with a weathered layer of marlstone as well as the Red Unit and Pleistocene-Quaternary alluvial fan deposits. | 15–30 | 45–50 | 30–40 |
Publisher’s Note: MDPI stays neutral with regard to jurisdictional claims in published maps and institutional affiliations. |
© 2022 by the authors. Licensee MDPI, Basel, Switzerland. This article is an open access article distributed under the terms and conditions of the Creative Commons Attribution (CC BY) license (https://creativecommons.org/licenses/by/4.0/).
Share and Cite
Handoyo, H.; Alcalde, J.; DeFelipe, I.; Palomeras, I.; Martín-Banda, R.; García-Mayordomo, J.; Martí, D.; Martínez-Díaz, J.J.; Insua-Arévalo, J.M.; Teixidó, T.; et al. Geophysical Imaging of the Critical Zone along the Eastern Betic Shear Zone (EBSZ), SE Iberian Peninsula. Appl. Sci. 2022, 12, 3398. https://doi.org/10.3390/app12073398
Handoyo H, Alcalde J, DeFelipe I, Palomeras I, Martín-Banda R, García-Mayordomo J, Martí D, Martínez-Díaz JJ, Insua-Arévalo JM, Teixidó T, et al. Geophysical Imaging of the Critical Zone along the Eastern Betic Shear Zone (EBSZ), SE Iberian Peninsula. Applied Sciences. 2022; 12(7):3398. https://doi.org/10.3390/app12073398
Chicago/Turabian StyleHandoyo, Handoyo, Juan Alcalde, Irene DeFelipe, Imma Palomeras, Raquel Martín-Banda, Julián García-Mayordomo, David Martí, José J. Martínez-Díaz, Juan Miguel Insua-Arévalo, Teresa Teixidó, and et al. 2022. "Geophysical Imaging of the Critical Zone along the Eastern Betic Shear Zone (EBSZ), SE Iberian Peninsula" Applied Sciences 12, no. 7: 3398. https://doi.org/10.3390/app12073398
APA StyleHandoyo, H., Alcalde, J., DeFelipe, I., Palomeras, I., Martín-Banda, R., García-Mayordomo, J., Martí, D., Martínez-Díaz, J. J., Insua-Arévalo, J. M., Teixidó, T., Marzán, I., & Carbonell, R. (2022). Geophysical Imaging of the Critical Zone along the Eastern Betic Shear Zone (EBSZ), SE Iberian Peninsula. Applied Sciences, 12(7), 3398. https://doi.org/10.3390/app12073398