Article

Reconstructing the 26 June 1917 Samoa Tsunami Disaster

1
School of the Environment, Geography and Geosciences, University of Portsmouth, Portsmouth PO1 3QL, UK
2
NIWA Taihoro Nukurangi, Ōtautahi Christchurch 8440, New Zealand
3
Disaster Management Office & National Emergency Operations Centre, Ministry of Natural Resources and Environment, Private Bag, Apia WS1338, Samoa
4
Geosciences Section, Ministry of Natural Resources and Environment, Private Bag, Apia WS1338, Samoa
5
GNS Science, Avalon, Lower Hutt 5011, New Zealand
*
Author to whom correspondence should be addressed.
Appl. Sci. 2022, 12(7), 3389; https://doi.org/10.3390/app12073389
Submission received: 28 February 2022 / Revised: 23 March 2022 / Accepted: 24 March 2022 / Published: 26 March 2022
(This article belongs to the Special Issue Mapping, Monitoring and Assessing Disasters)

Abstract

:
The 1917 Samoa tsunamigenic earthquake is the largest historical event to impact this region. Over a century later, little is known about the tsunami magnitude and its implications for modern society. This study reconstructs the 1917 tsunami to understand its hazard characteristics in the Samoan region and assesses the risk implications of tsunamis sourced from different locations along the subduction zone bend of the Northern Tonga Trench (NTT). We model the event from its origin to produce outputs of tsunami inundation extent and depth at spatially flexible grid resolution, which are validated using available runup observations and Apia harbour tide gauge records. We then combine the inundation model with digital distributions of buildings to produce exposure metrics for evaluating the likely impacts on present-day coastal assets and populations if a similar tsunami were to occur. Results exhibit recorded and modelled wave arrival time discrepancies in Apia harbour of between 30–40 min, with runup underestimated in southeast Upolu Island compared with the rest of the country. These differences could reflect complexities in the tsunami source mechanism that are not represented in our modelling and require further investigation. Nevertheless, our findings suggest that if a characteristic 1917-type event were to occur again, approximately 71% of exposed people would reside in Savai’i. Overall, this study provides the first detailed inundation model of the 1917 tsunami that supports an appreciation of the regional risk to local tsunamis sourced at the subduction zone bend of the NTT in Samoa.

1. Introduction

More than 700 million people live in island states, most of them developing countries, and low-lying areas at the coast are under constant risk from tsunamis, storm surges, or severe fluctuations of sea levels. In the Pacific, small island developing states (SIDS) represent a collection of remote island communities with developing economies that are often at elevated risk from climate change, sea level rise, coastal erosion, and both natural and anthropogenic hazards [1,2]. It is often the case that due to their geography and the relatively small size of these islands, a significant proportion of the population, infrastructure, and commercial and industrial activity are concentrated in low lying areas, typically in a strip close to the coasts, which render them at considerable risk from coastal inundation from tsunamis [3].
The central south Pacific region is frequently affected by tsunamis generated from earthquakes centred on the Tonga Kermadec Trench, including 39 events between 1837 and 2009 that included the 1917 and 2009 tsunamis that affected the Samoan islands [4]. These two nearly identical events suggest that tsunamis in this region are relatively common, and, as a consequence, the SIDS in this area are exposed not only to global tsunamigenic events, but also to frequent locally derived tsunamis triggered by earthquakes, volcanic eruptions, and submarine landslides [5]. Indeed, the recent submarine volcanic eruption of Hunga-Tonga Hunga-Ha’apai (HTHH) in Tonga on 14 January 2022 [6,7], and the resulting tsunami along with potential inferred predecessors (e.g., [8]), illustrate that there is a high degree of residual risk to these islands from local tsunami generating events.
Local tsunamis with less than 30 min impact time are extremely hazardous to the island communities, due to the limited warnings and response times between the triggering event (earthquake or eruption, for example), and the tsunami wave making landfall. Consequently, when trying to understand current tsunami risks and the nature and extent of exposure to these islands, it is common to use data or records from historical events to constrain the likely intensity (inundation extent and flow depths, for example), and then use this within a scenario-based context to understand the present-day exposure if such an event was to occur today.
The focus of this study is to reconstruct the 1917 tsunami that struck the islands of Samoa, which was the second most deadly tsunamigenic event on record to affect this region after the fatal 2009 tsunami that devastated the southeast coast of Upolu [9,10] (Figure 1). Although the 2009 event provides a benchmark to help plan for and mitigate the impacts of local tsunamis sourced at the Northern Tonga Trench (NTT) in Samoa, areas that experienced little or no impact give rise to a public perception that these areas are at minimal threat from tsunamis. This is particularly the case for coastal areas in Savai’i island to the west of Upolu. However, very little is known about the impacts of the 1917 tsunami predecessor, despite the earthquake source magnitude being the largest ever recorded in this region [11].
The 1917 earthquake epicentre was located along the transform segment of the NTT margin about 100 km south of west Savai’i, and approximately 150 km west of the 2009 earthquake. Preliminary modelling by Okal et al. (2011) [12] suggests a focusing of tsunami flux northwards toward the west and southern areas of Savai’i. This implies that these areas would have been severely impacted compared with what they had experienced in the 2009 event. Paradoxically, the evidence presented in [12] does not seem commensurate with the lack of documented impacts for the event, which led them to hypothesize that the scale of impacts was masked by the impacts of the 1918 influenza pandemic, which occurred approximately 1 yr later. The 1918 pandemic is Samoa’s deadliest disaster in history, which saw the loss of between 20 and 25% of the country’s population at the time [13,14], most of whom were adults or knowledge holders. This is a gap in our current understanding of the scale and magnitude of the 1917 tsunami disaster within the context of regional hazard risk resilience planning. To help elucidate this enigma, we model the tsunami from source to inundation and use this scenario to evaluate the exposure characteristics of a similar event-type on present-day distributions of buildings and people.
We provide an overview of the geographical and historical event context in Section 2, and describe the data and analytical methods in Section 3. Findings of the analysis are presented in Section 4, which includes a comparison with observations of the 2009 event. The uncertainties and implications of our results in understanding the regional hazard characteristics that tsunamigenic-earthquakes occurring on different segments of the NTT have on the distribution of exposed areas are discussed in Section 5, with conclusions and suggestions for future research provided in Section 6.

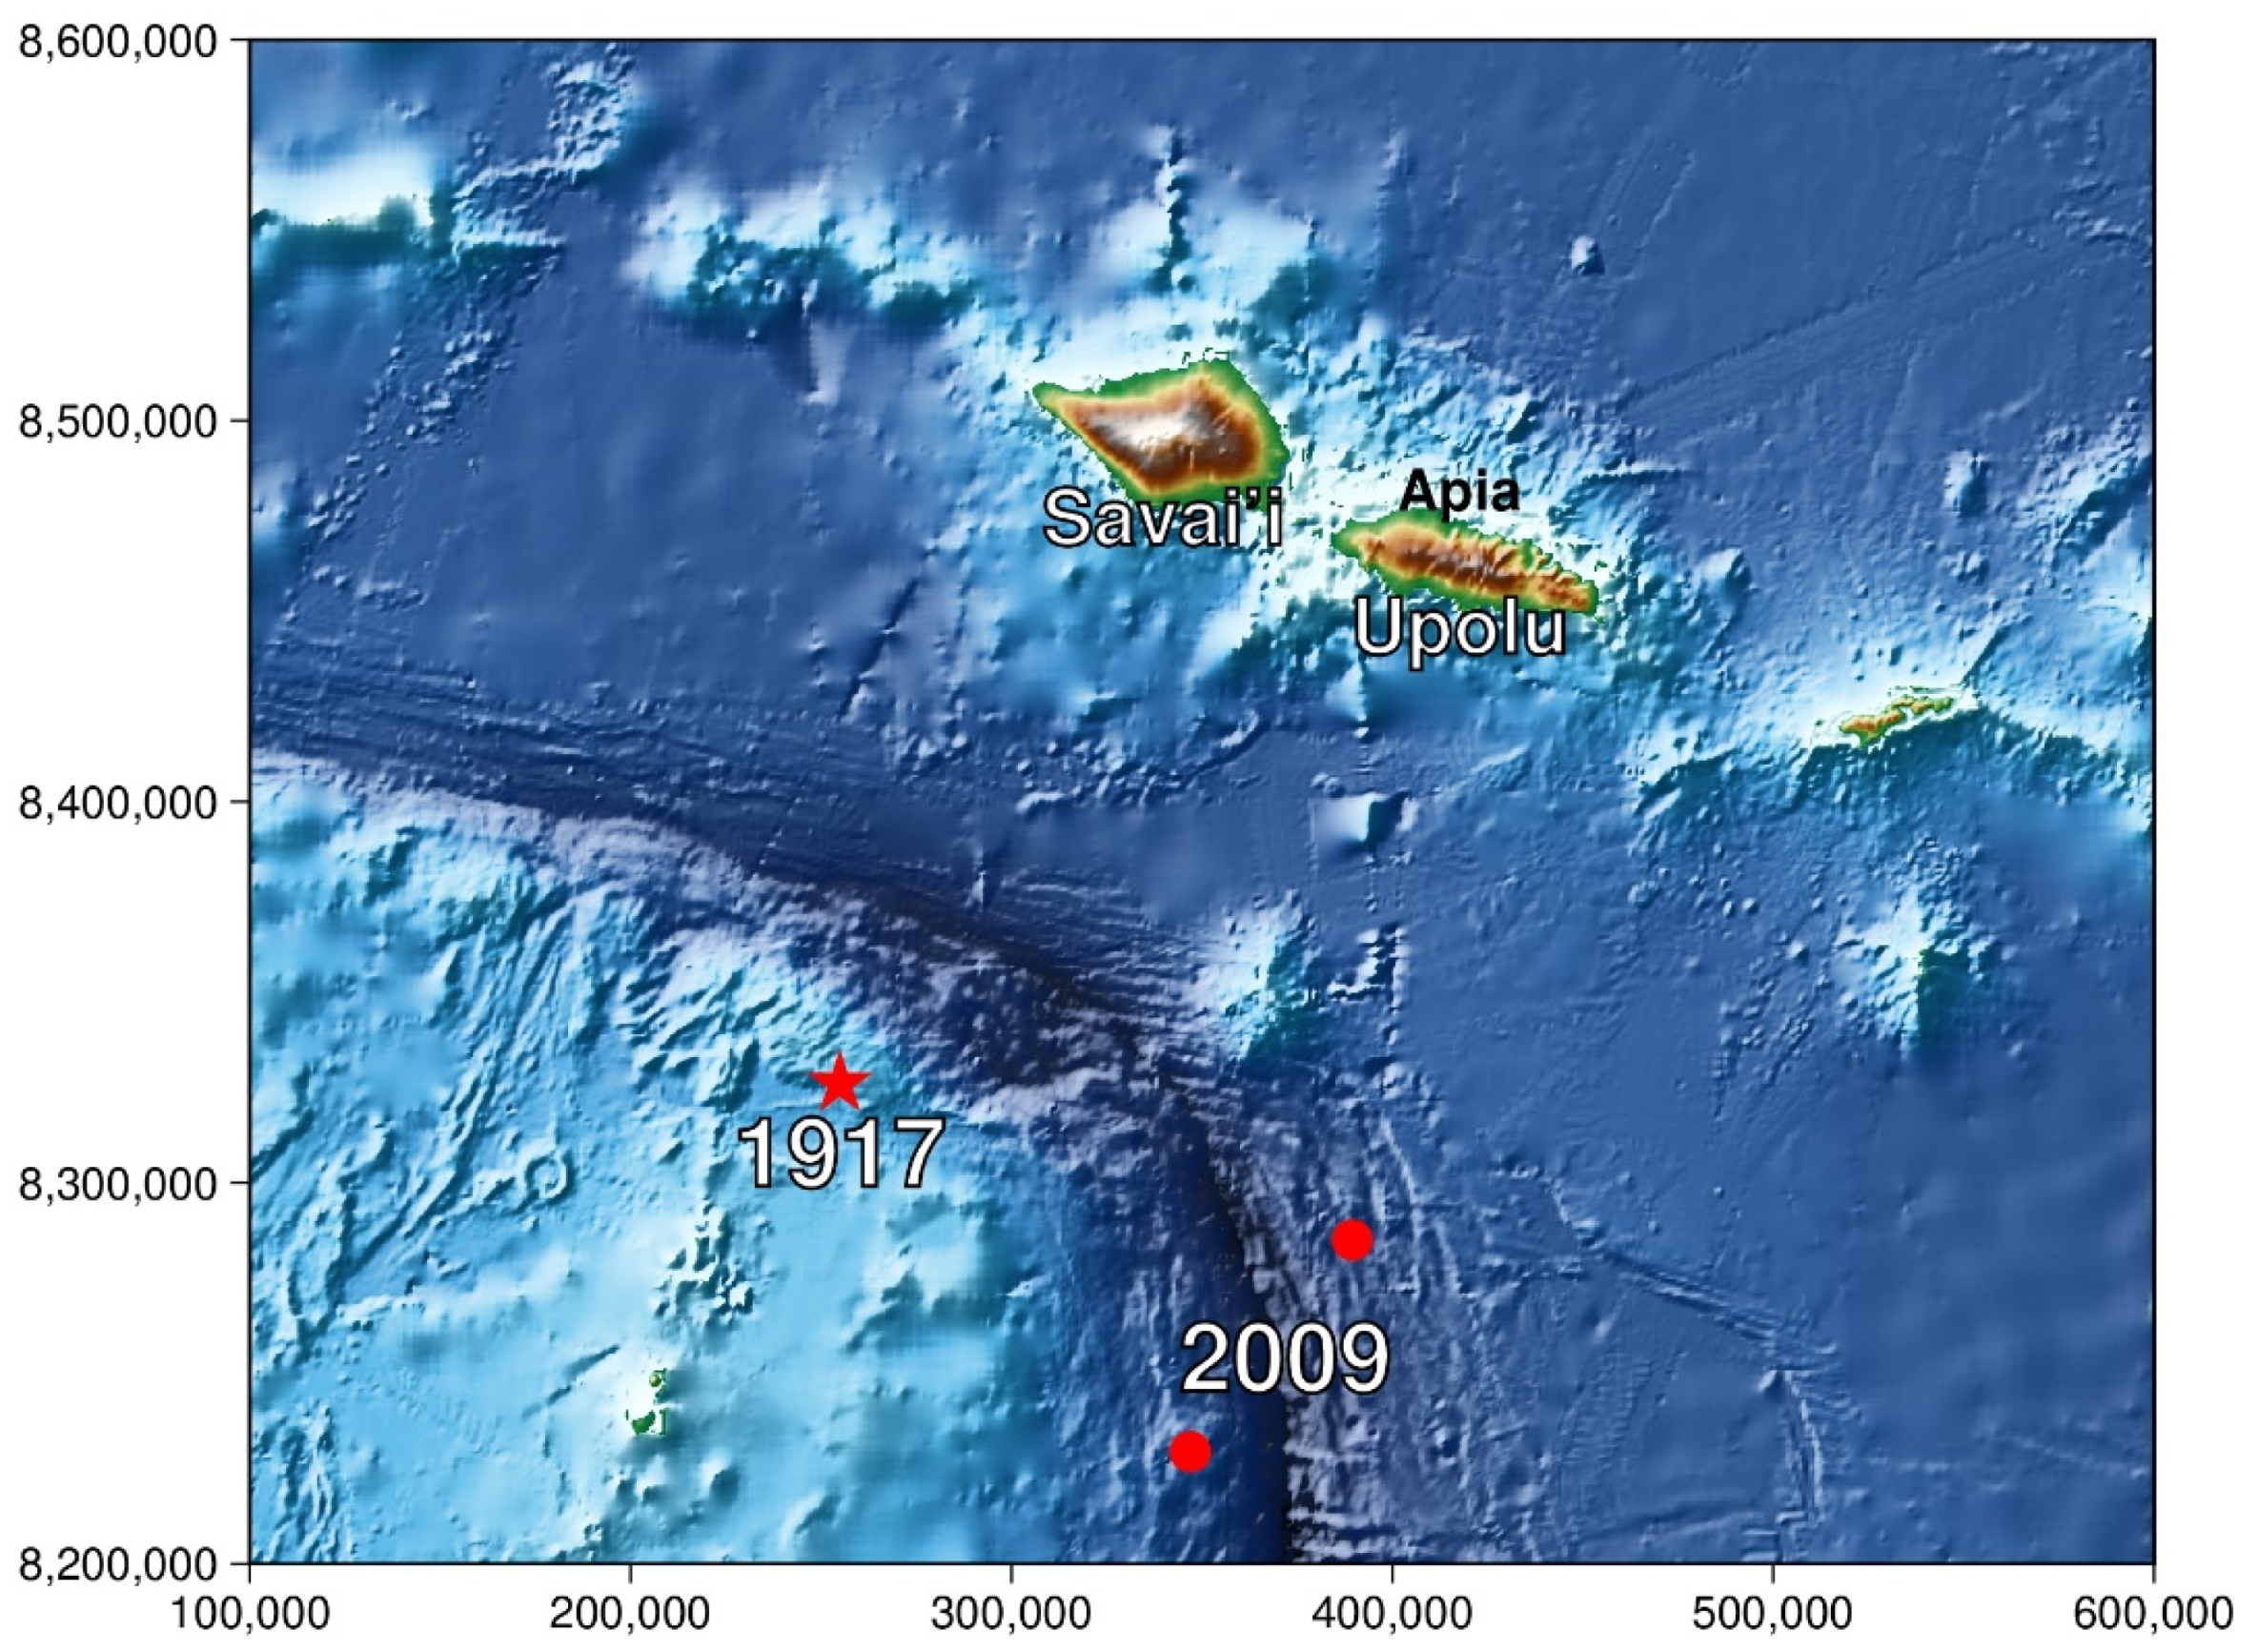
2. Geographical and Historical Context

Samoa consists of two main islands, Upolu and Savai’i, with several smaller inhabited and uninhabited islands between them (e.g., Manono and Apolima), as well as east and south of Upolu (e.g., Fanuatapu, Namu’a, Nu’utele, Nu’ulua, and Nu’usafe’e) (Figure 1). Comprising part of a larger archipelago encompassing the geologically younger islands of American Samoa to the east, the island chain originated from hotspot volcanic activity and is fringed by coral reefs [15,16,17]. The geology of Samoa largely consists of mafic material (e.g., basalt and gabbro), due to its oceanic intraplate volcanic hotspot origins [18]. Savai’i is the bigger island with an area of 1820 km², whereas Upolu has an area of 1114 km² and accommodates over 67% of the total population of approximately 200,000 people [19]. Apia, the capital of Samoa, is located in the central north of Upolu.
In 1902, a temporary geophysical observatory was established in Apia on the then-German administered island of Upolu, whereby it was initially set up to obtain baseline earth observations to compare with the British and German south polar expeditions of 1902–1903. Meteorological instruments and seismographs were installed in 1902 and magnetic instruments in 1905. These enabled studies in geomagnetism, seismology, meteorology, tidal variations, and atmospheric electricity and were so productive that in 1908 the observatory was established on a permanent basis.
In August 1914, troops of the New Zealand Expeditionary Force seized control of German-controlled Samoa and the observatory. Its operations were much curtailed during the World War 1 (WW1) years, but the German Director (G. Angenheister) continued observatory operations until it was formerly taken over by the New Zealand government in 1921 [20,21,22]. New Zealand administration of the observatory continued until the handover in 1963, shortly after Samoa achieved political independence and control of the observatory.
Between 1917 to 1919, four tidal waves were recorded by the observatory on continuously recording tidal gauges that correlated with four earthquakes recorded by the seismograph installed at the observatory, with observations reported in [23].
Situated approximately 100 km north of the Tonga Trench, Samoa is exposed to a range of local geophysical hazards (e.g., earthquakes, volcanoes, landslides, tsunami). For example, the subaerial volcanic eruption from 1905 to 1911 on northeast Savai’i caused displacement/relocation of affected villagers to neighbouring Upolu [24] and generated several small tsunamis during this period, with the most damaging occurring in 1907 [4]. Indeed, the recent 2009 complex earthquake sequence [25] and consequent tsunami that resulted in severe casualties and livelihood destruction in southeast Upolu reinforces this vulnerability [26,27].
The lesser known predecessor to the 2009 event, the 26 June 1917 UTC (local time in 1917 = UTC-11) earthquake and tsunami that originated in a proximal source region northwest of the 2009 epicentre (Figure 1), is arguably considered the largest earthquake to have occurred in this region in terms of magnitude (i.e., Mw 8.3 compared with Mw 8.1 for the 2009 earthquake sequence) [11,28]. However, the scale of impacts from the resulting tsunami appear to have paled in comparison with the devastation observed in the 2009 event (e.g., [12,29,30]). Although anecdotal records indicate that the 1917 tsunami inundation had flooded several villages and caused damage to buildings and infrastructure (e.g., Satupaitea in southeast Savai’i and Lotofaga in southeast Upolu) [4,31,32], there are virtually no accounts of any casualties. Available modern interpretations assume at least two people lost their lives based on generic descriptions of damage recorded after the event (e.g., [32]). Here, we use our inundation model for the 1917 tsunami along with present-day patterns of inundation exposure as a proxy to discuss and offer alternative views to help elucidate this enigma.

3. Methods and Data

The methods used in this study are described in two sections: (1) tsunami modelling, which describes the process from the initial earthquake to the benchmarking process and inundation on land; and (2) tsunami exposure and damage analysis used in quantifying the hazard exposure on present-day buildings and population.

3.1. Tsunami Modelling

3.1.1. Model Setup and Configuration

This tsunami modelling analysis adapts a similar approach used by Bosserelle et al. (2020) [27] to model the inundation of the 2009 event. For generation of the tsunami from the initial earthquake through to propagation and inundation, the BG-Flood software was used. BG Flood (Block-adaptive on Graphics processing unit Flood model) is suited for the simulation of flooding and/or inundation caused by rivers, rain, tides, or tsunamis. It is based on the formulation of Basilisk as well as on the memory structure on the GPU of block uniform quadtree of Vacondio et al. (2017) [33]. The block uniform quadtree structure enables various resolutions with the same memory size but with different physical sizes [33].
For tsunami initialization, we used the earthquake parameters for the 1917 event presented by [12] to configure the source model. To start generating the initial earthquake, the following values were needed: fault parameters (strike, dip, rake, slip), the dimensions of the rupture (length and width), the hypocenter of the earthquake (coordinates and depth), and the timing of the rupture. The rupture length was 150 km with a rupture width of 50 km. The earthquake epicentre was located at 15.13° S and 173.28° W on 26 June 1917 at 05:49 UTC (i.e., 25 June 1917 at 18:49 local time) at a depth of 10 km. After applying vertical deformation to the fault, the initial water displacement was calculated as a theoretical visco-elastic fault displacement using the formulation of [34].
Figure 2 displays the water displacement after the 1917 earthquake. For the tsunami modelling, a fault length of 150 km was used to match the runup observations. As the model uses an adaptive grid (more than one resolution), three output NetCDF files were created with resolutions of 10 m, 20 m, and 40 m.

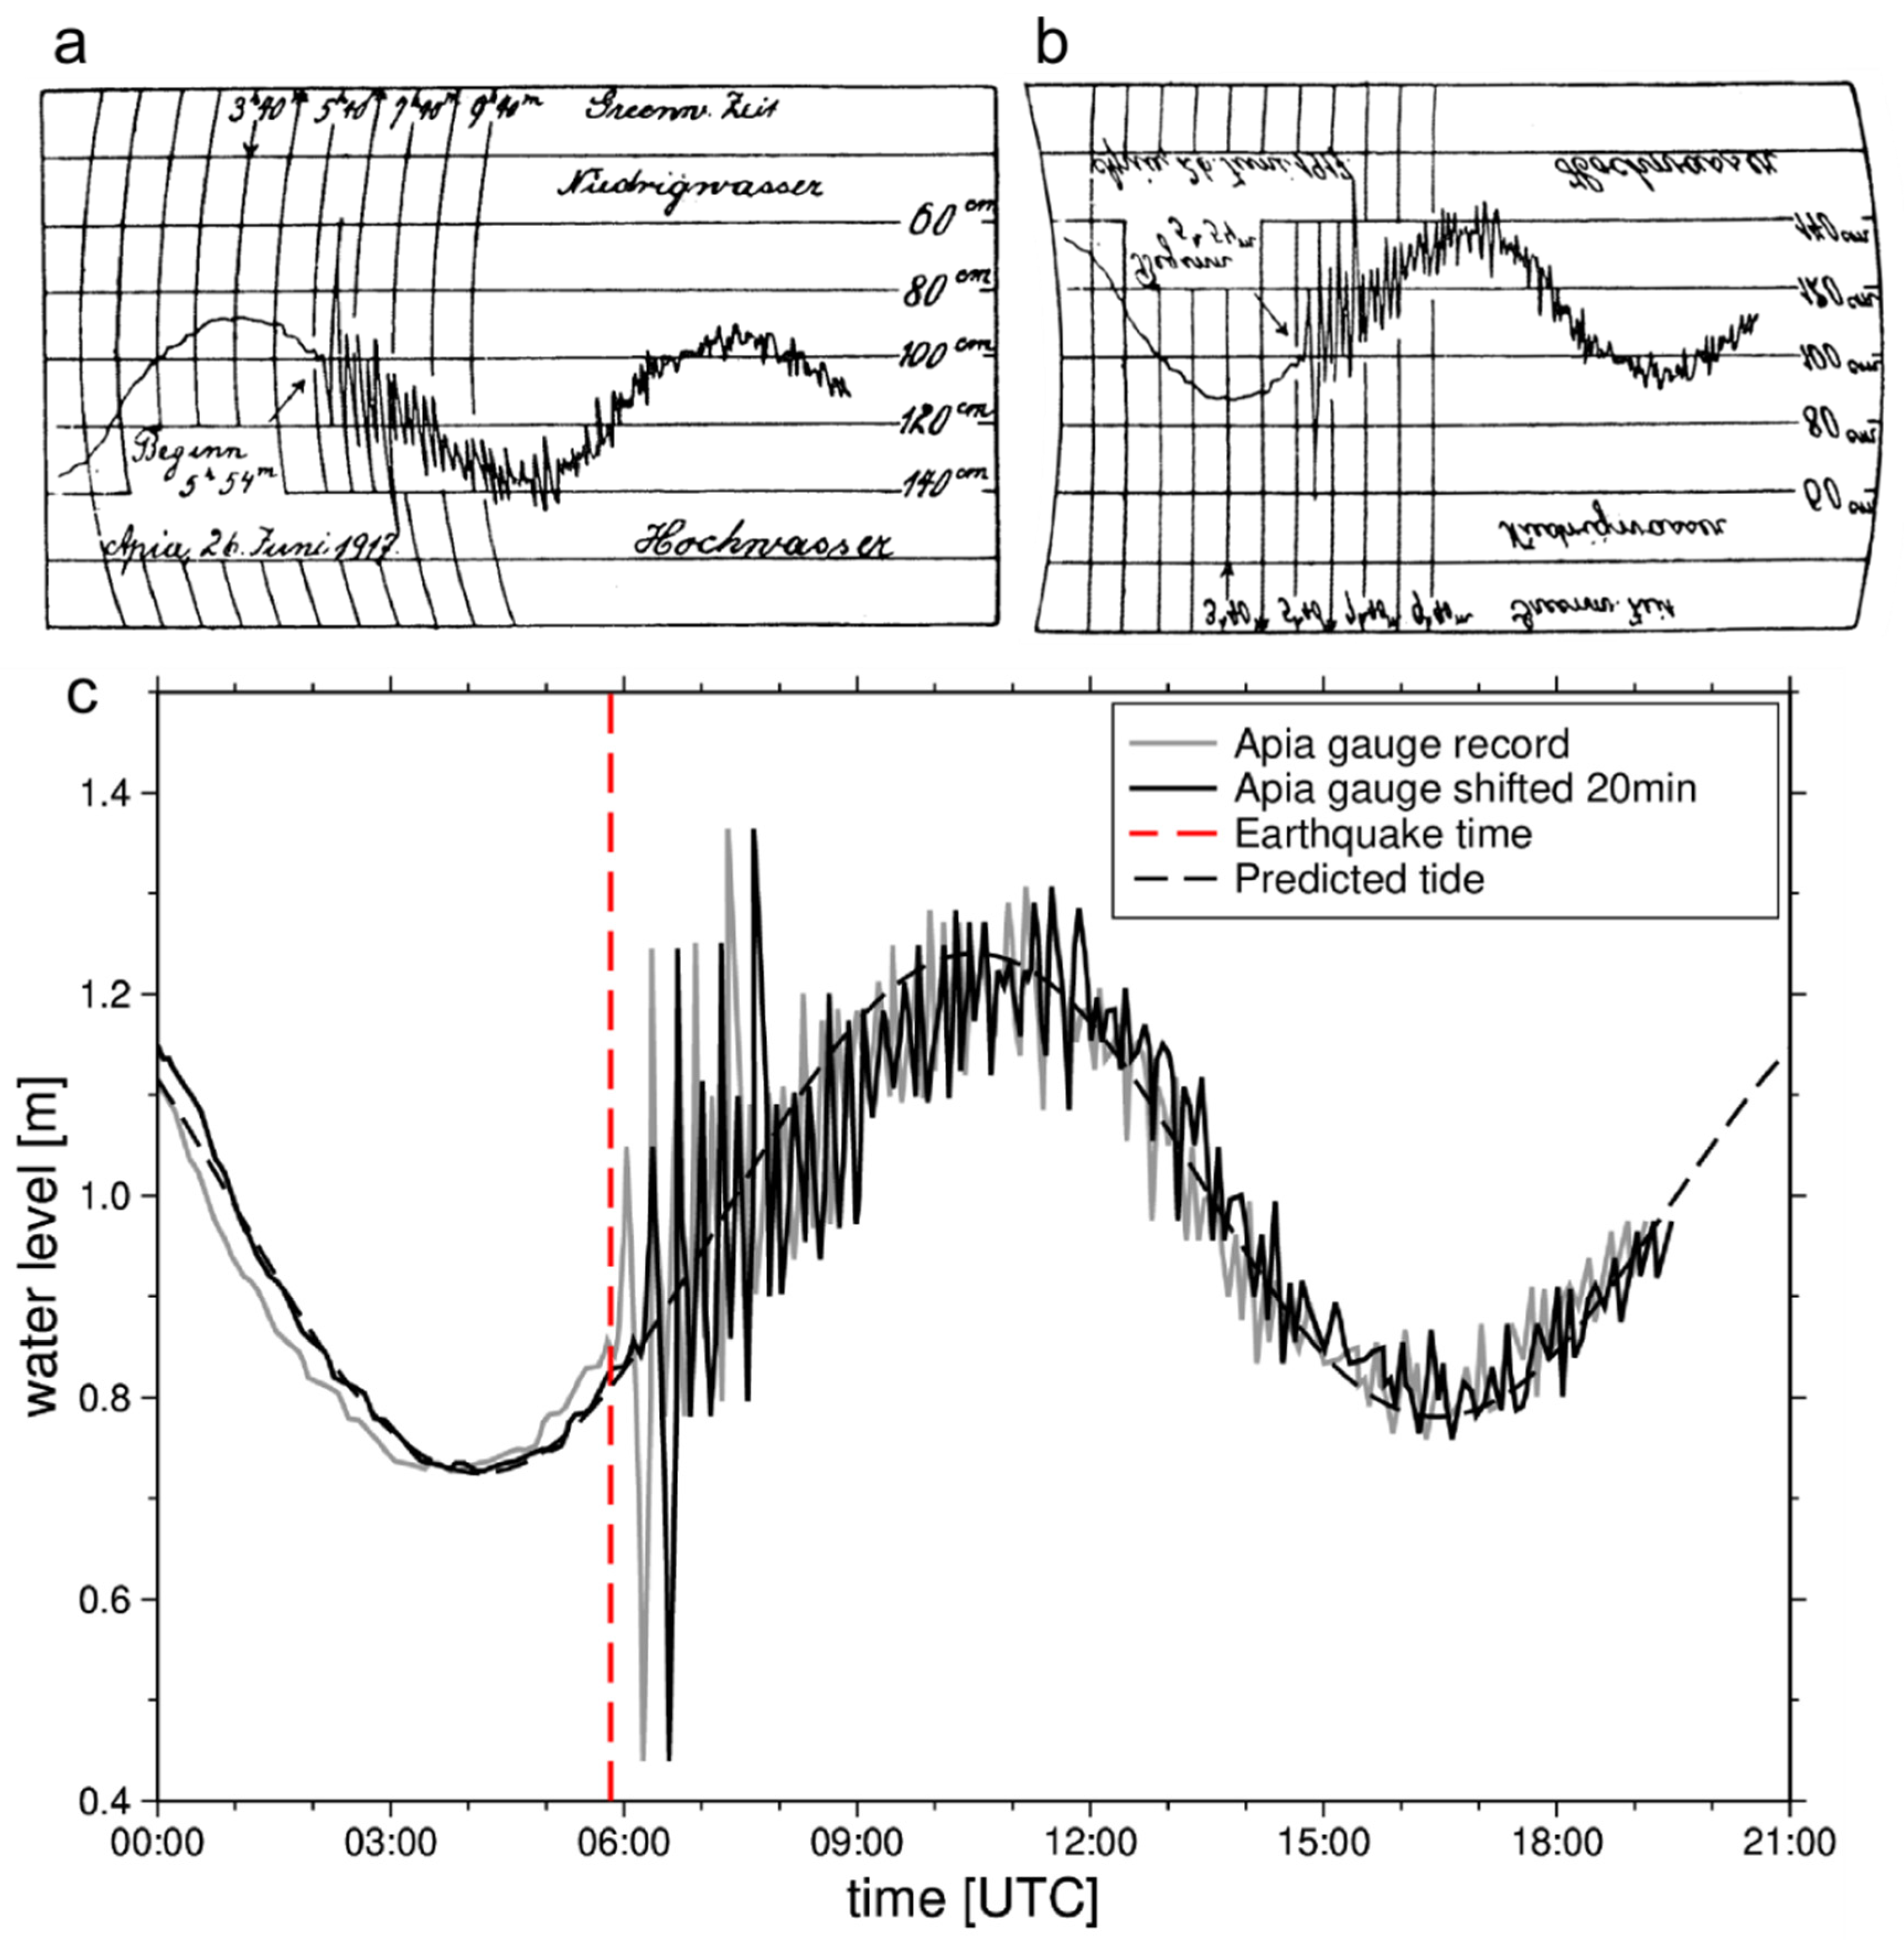
3.1.2. Tide Gauge and Runup Observations

Available tide gauge records from Apia harbour as well as runup observations from different parts of Upolu and Savai’i were used to validate the inundation modelling and subsequent assessment of present-day exposure and impacts in the runup zone. Tide gauge readings for the 1917 event measured in Apia harbour were digitized using the analog maregraph provided in [23]. The maregram in Figure 2 shows the fluctuations of the tsunami waves within the harbour. The digitized maregram generally matches the predicted tide at Apia (predicted by analyzing tide constituent from recent tide record). However, the tide time reference given in [23] cannot be reconciled with an expected 30–40 min travel time for the tsunami to reach Apia. Therefore, either the tide time reference or earthquake time/location is inaccurate. Moving the tide time reference given in [23] to 20 min later improves the correlation between predicted and measured tide and resolves the arrival time inconsistency. Although there is no clear evidence that the tide time reference from [23] is incorrect, it appears to be the simplest explanation of the inconsistency, and it still provides the first indication of the likely tsunami arrival time in Apia.
Runup observations derived from historical records of eyewitness accounts documented in [4,30,31] provided benchmarks to infer the extent of wave runup onto land. These observations were digitized to help validate the tsunami runup modelling.

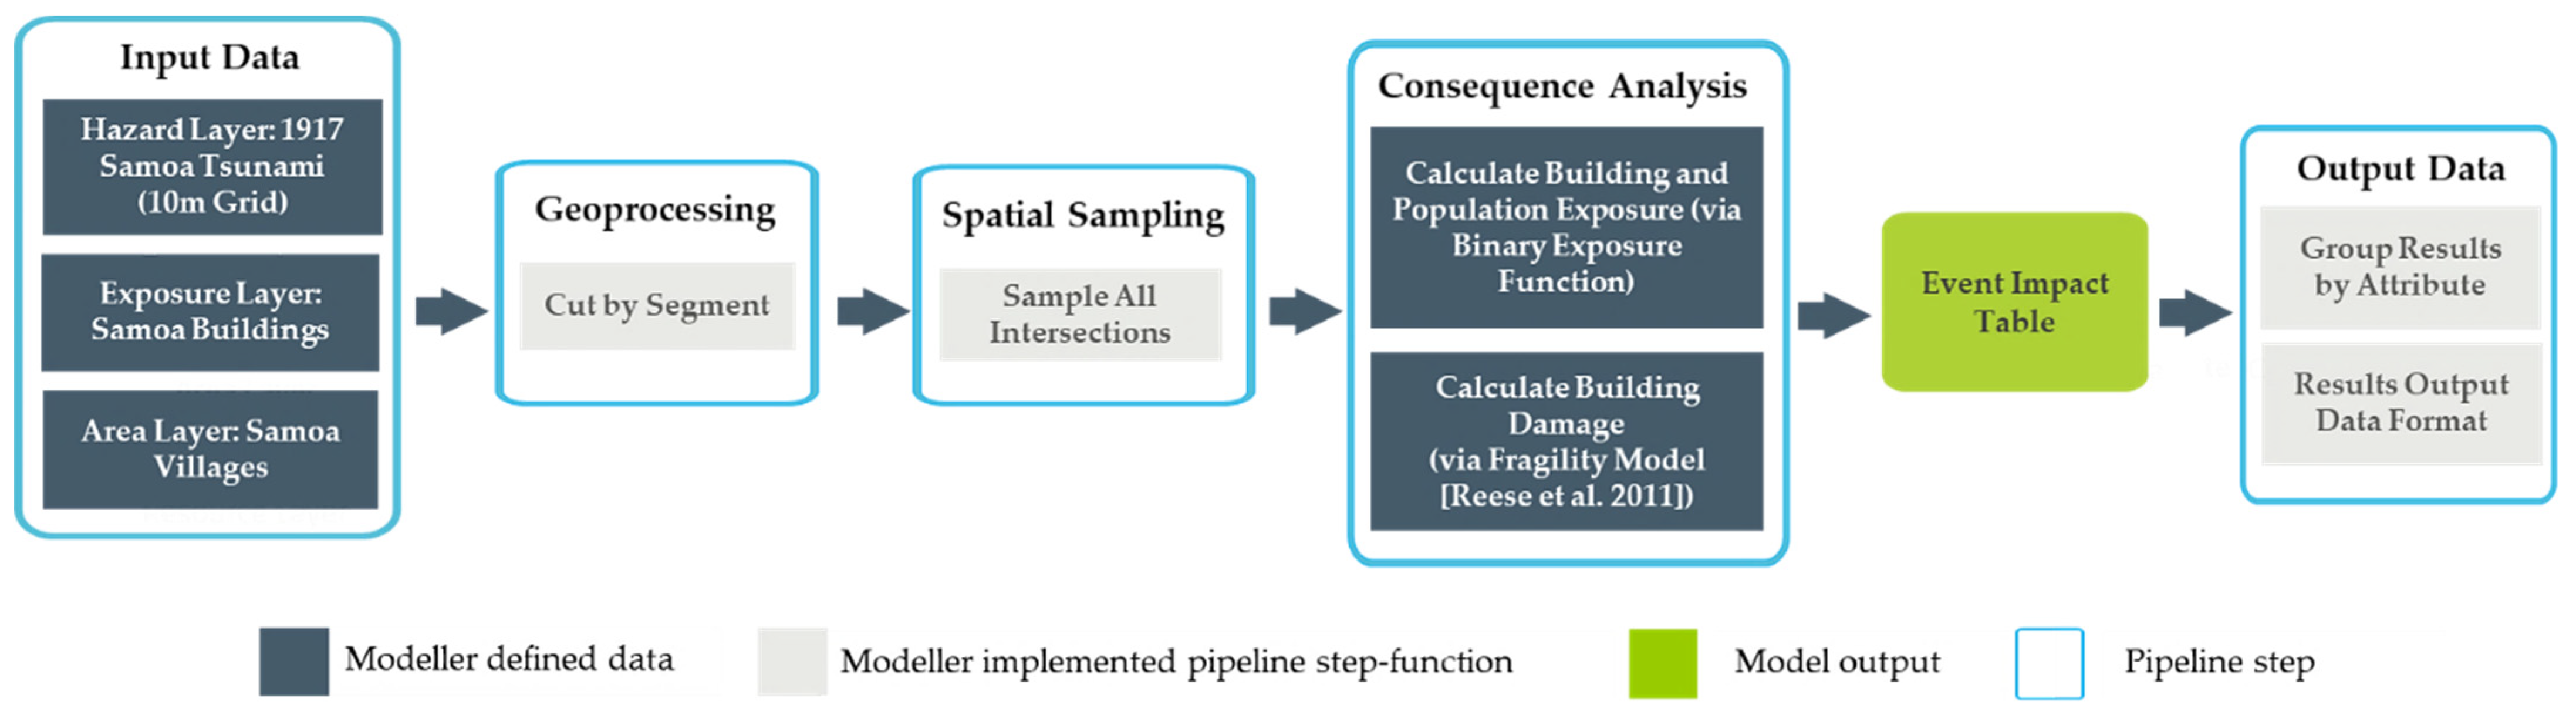
3.2. Tsunami Exposure and Damage Analysis

3.2.1. Building and Population Exposure Data

Buildings on Savaii and Upolu that were located within the maximum tsunami inundation extent were remotely digitized from aerial and Google satellite imagery captured between 2016 and 2020. Buildings were manually digitized in GIS software, using roof outlines to create a vector polygon layer. Physical and non-physical attributes including use category and construction frame were assigned to each building object (Table 1). Samoan building construction frame typologies defined by [9] were attributed to features based on their size (i.e., outline area), roof shape, and use category. In the absence of resources such as Google street view to visually validate use category and construction frame, these attributes were confirmed by local engineers and disaster risk management experts. The outline area (m2) for confirmed buildings was calculated in GIS software (Esri, Redlands, CA, USA).
Samoa’s usually resident population was obtained from the 2016 national census [13]. Descriptive statistics for ‘usually-resident population’ at their residence on census day are aggregated and publicly available at national, district, and village levels. Here, we apply usually resident population at village levels (VPop) to determine a residential building-object population rate (BPRate) as follows:
V B a r e a = j = 1 n i B A i
V B P R a t e = V P j   / V B a r e a
B P R a t e = V B P R a t e   / B A i
where BAi is the outline area (m2) for a residential building located in village j, with ni, the number of residential buildings within village j. The variable VBarea is the total residential building outline area within village j. Residential building-object VBPRate is the per m2 residential building population based on the usually resident population (VP) of village j.

3.2.2. Building Fragility Model

Fragility functions relate tsunami hazard intensity (e.g., flow depth) to the conditional probability of a building reaching or exceeding a given damage state [35]. Here, physical building damage is measured from empirical fragility curves representing Samoan buildings damaged in the 2009 SPT [9]. The fragility curves apply a cumulative lognormal function for ‘timber’, ‘masonry’, and ‘reinforced concrete’ construction frame buildings to determine the conditional probability (0–1) of “light”, “minor”, “moderate”, “severe”, and “collapse” damage states (DS) being reached or exceeded for a maximum tsunami inundation depth (Table 2). In the absence of representative fragility curves for some building typologies, ‘masonry’ curves are applied for ‘steel’ construction frame buildings, and DS1 and DS2 fragility curves are applied for timber and reinforced concrete building typologies.

3.2.3. Tsunami Inundation Exposure and Damage Model

A deterministic model is applied to quantify the present-day building and population exposure as well as damage from tsunami inundation. To this end, we use RiskScape, an open-source software that provides a multi-hazard risk modelling framework for deterministic analysis of tsunami impacts [36]. Here, a deterministic model ‘pipeline’ is developed to analyze the exposure and damage based on the tsunami model, exposure inventory, and fragility model components described in Section 3.2.1 and Section 3.2.2. These components formed the ‘input data’ for the model pipeline used, which sequences a series of steps and step-functions to sample and analyze deterministic tsunami impacts (Figure 3).
The 1917 event input hazard data layer represented at the adaptive grid resolutions 10 m, 20 m, and 40 m were segmented using a geoprocessing step-function (i.e., ‘cut by segment’) to extract all tsunami inundation grid cells within the exposure data layer (building outlines). Extracted grid cells were then spatially sampled (i.e., ‘all intersections’) to determine the maximum inundation flow depth (MaxD) at each building location. The consequence analysis applies MaxD to determine: (1) building and population exposure to tsunami inundation; and (2) building damage state. Individual building exposure (Bldexp) to inundation is quantified using a simple binary function:
B l d e x p = { 1 ,   M a x D < 0   m 0 ,   M a x D 0   m
When inundation is present or not at a building location, the corresponding binary value is assigned to the building in the ‘event impact table’ (EIT). Where inundation is not present (i.e., ‘0’), no damage (DS0) is assumed. Where inundation is present (i.e., ‘1’), conditional probability (i.e., 0–1) of damage states DS1 to DS5 based on fragility curves from [9] is calculated in response to the independent variable MaxD. Fragility curves scripted in Python using nested statements apply a lognormal function for each curve based on the dependant variables shown in Table 2 for the corresponding building construction frame in Table 1. The conditional probability determined from each fragility curve is then reported in the EIT for each building exposed to tsunami inundation.
The resulting EIT contains tsunami exposure and damage information for model output reporting. In this study, the EIT includes attributes, hazard intensity (i.e., MaxD), exposure (i.e., Bldexp), and damage state information for each building object. The ‘output data’ pipeline step-function ‘group results by attribute’ is applied here to report descriptive statistics of model results. Building ‘count’ and population ‘sum’ exposure to tsunami inundation is enumerated and reported at national and village scales and by hazard intensity (flow depth) bins of 0.5 m. Building damage states are also reported by building count for 0.1 conditional probability bins between 0 and 1. The step-function ‘results output file format’ outputs this information as spatial file formats (e.g., GIS shapefile, comma-separated value) for national and sub-national spatial analyses of present-day building and population exposure, as well as damage from the 1917 tsunami event.

4. Results

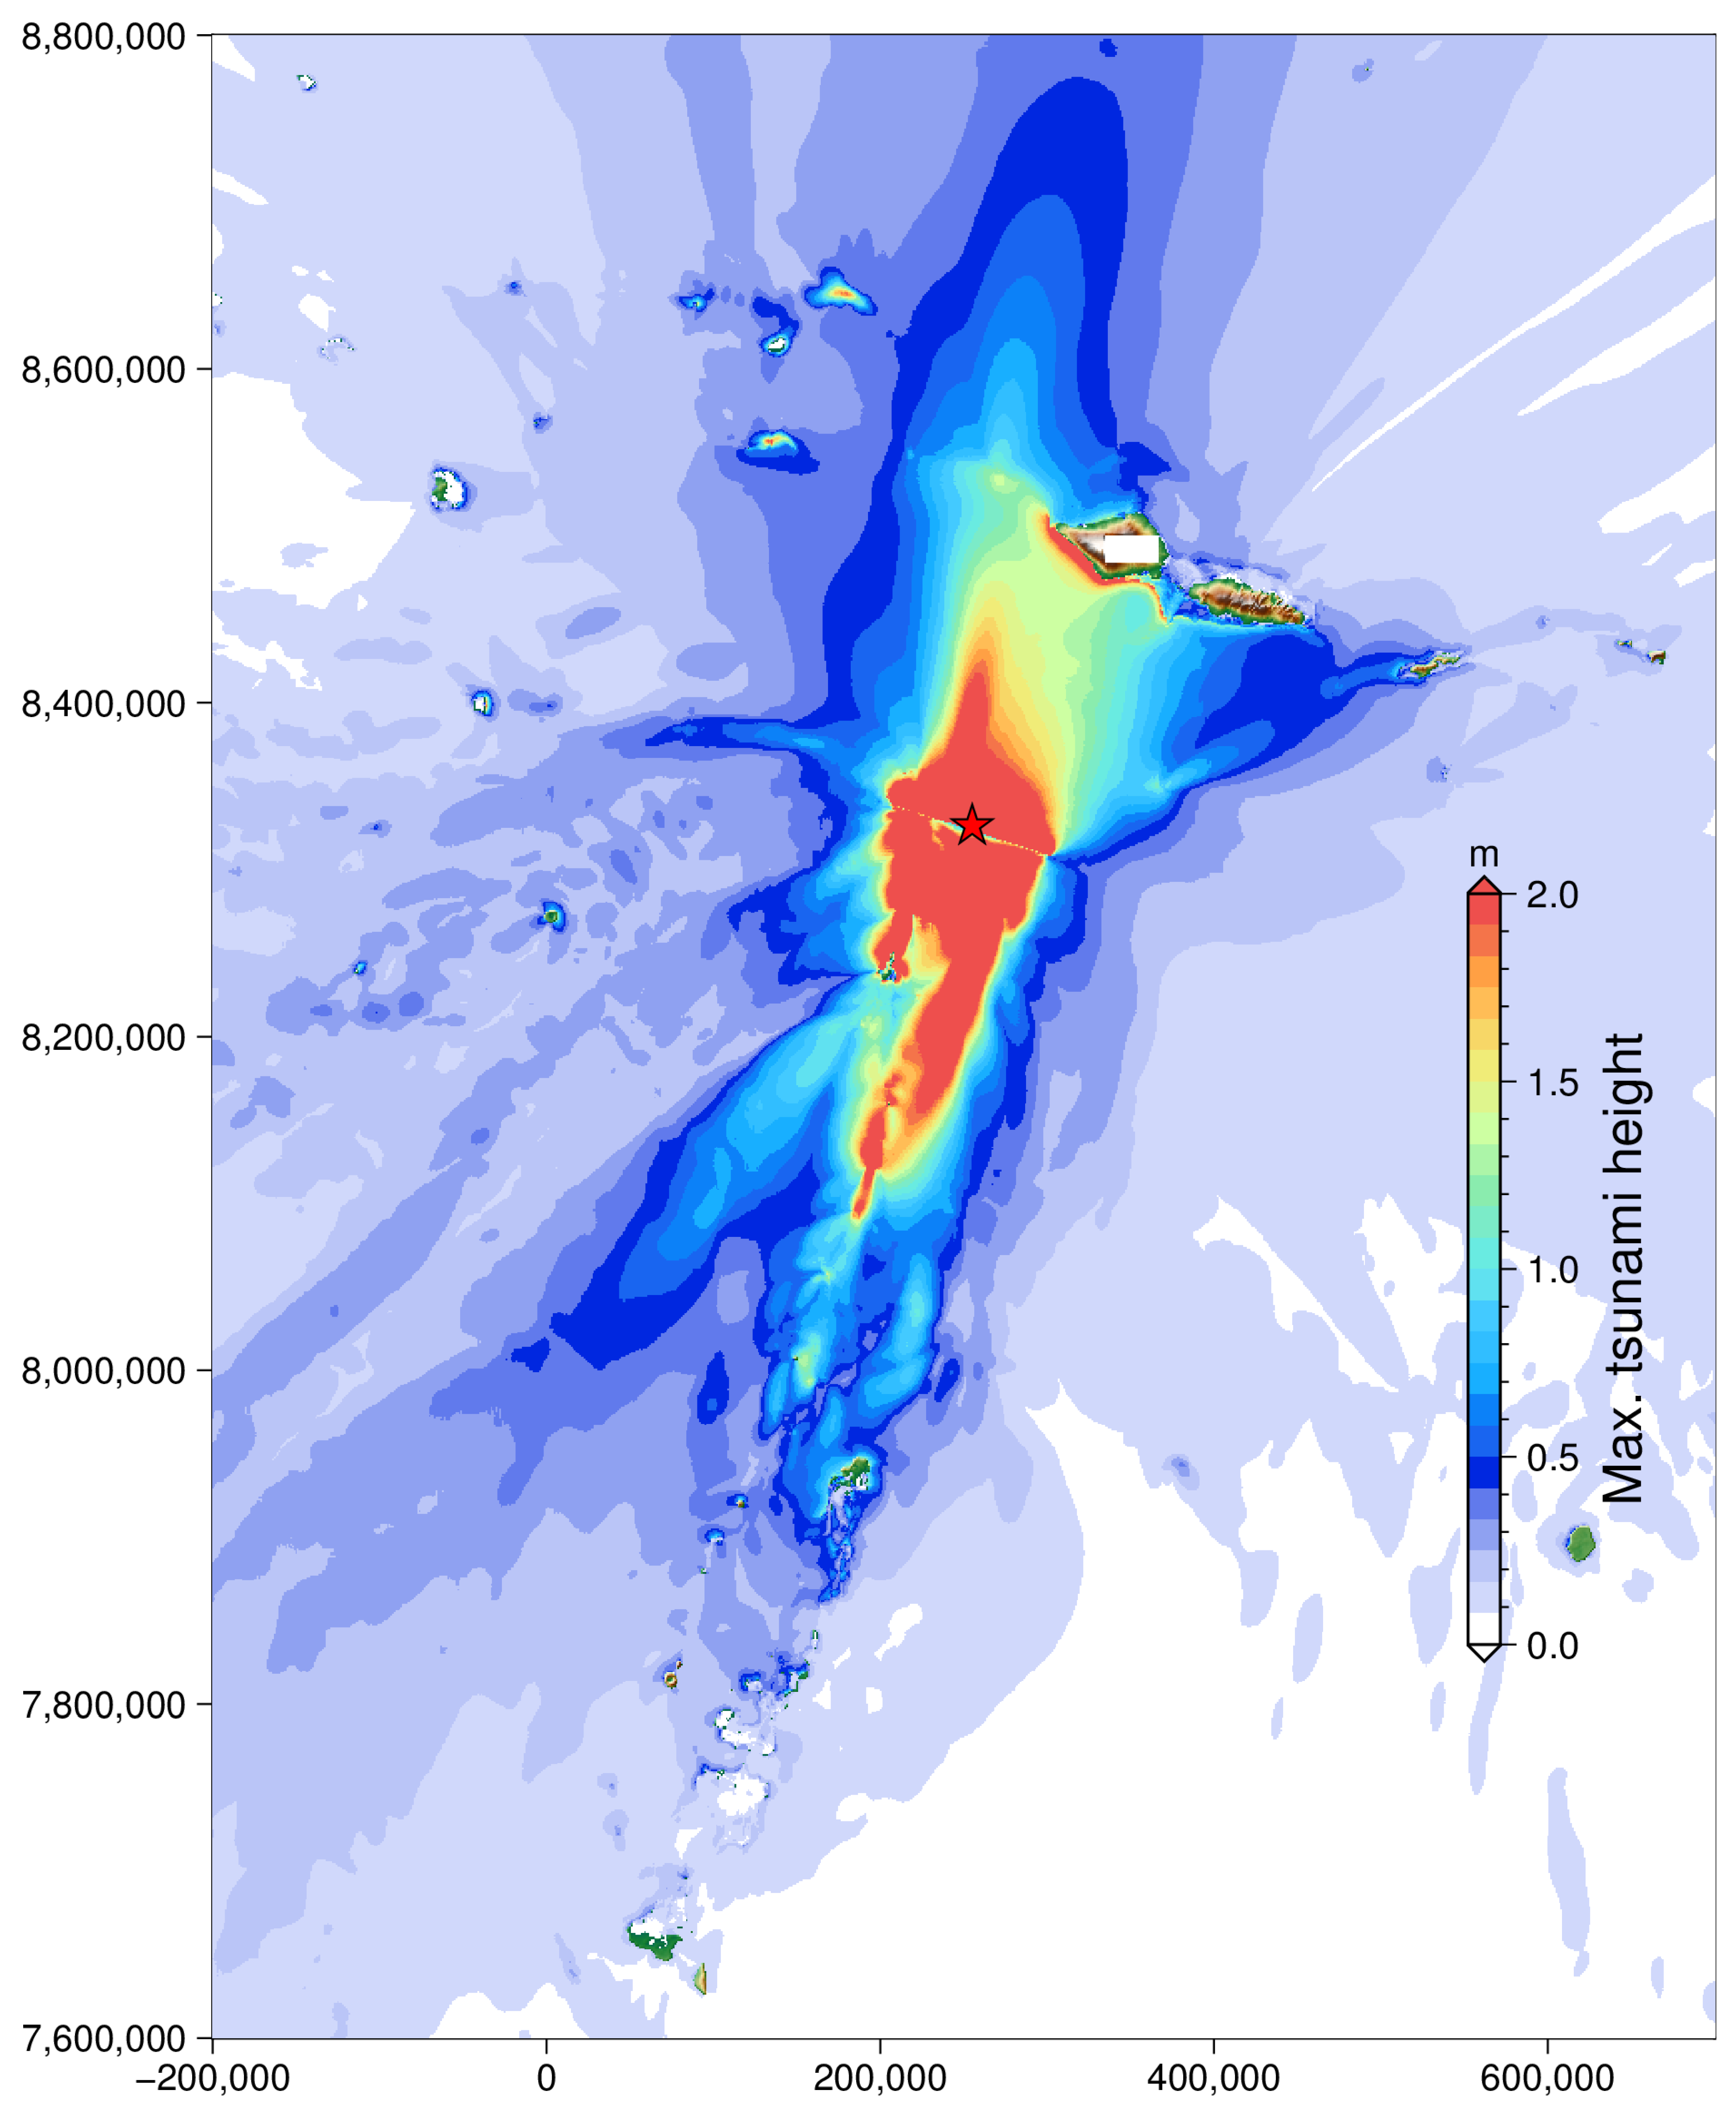
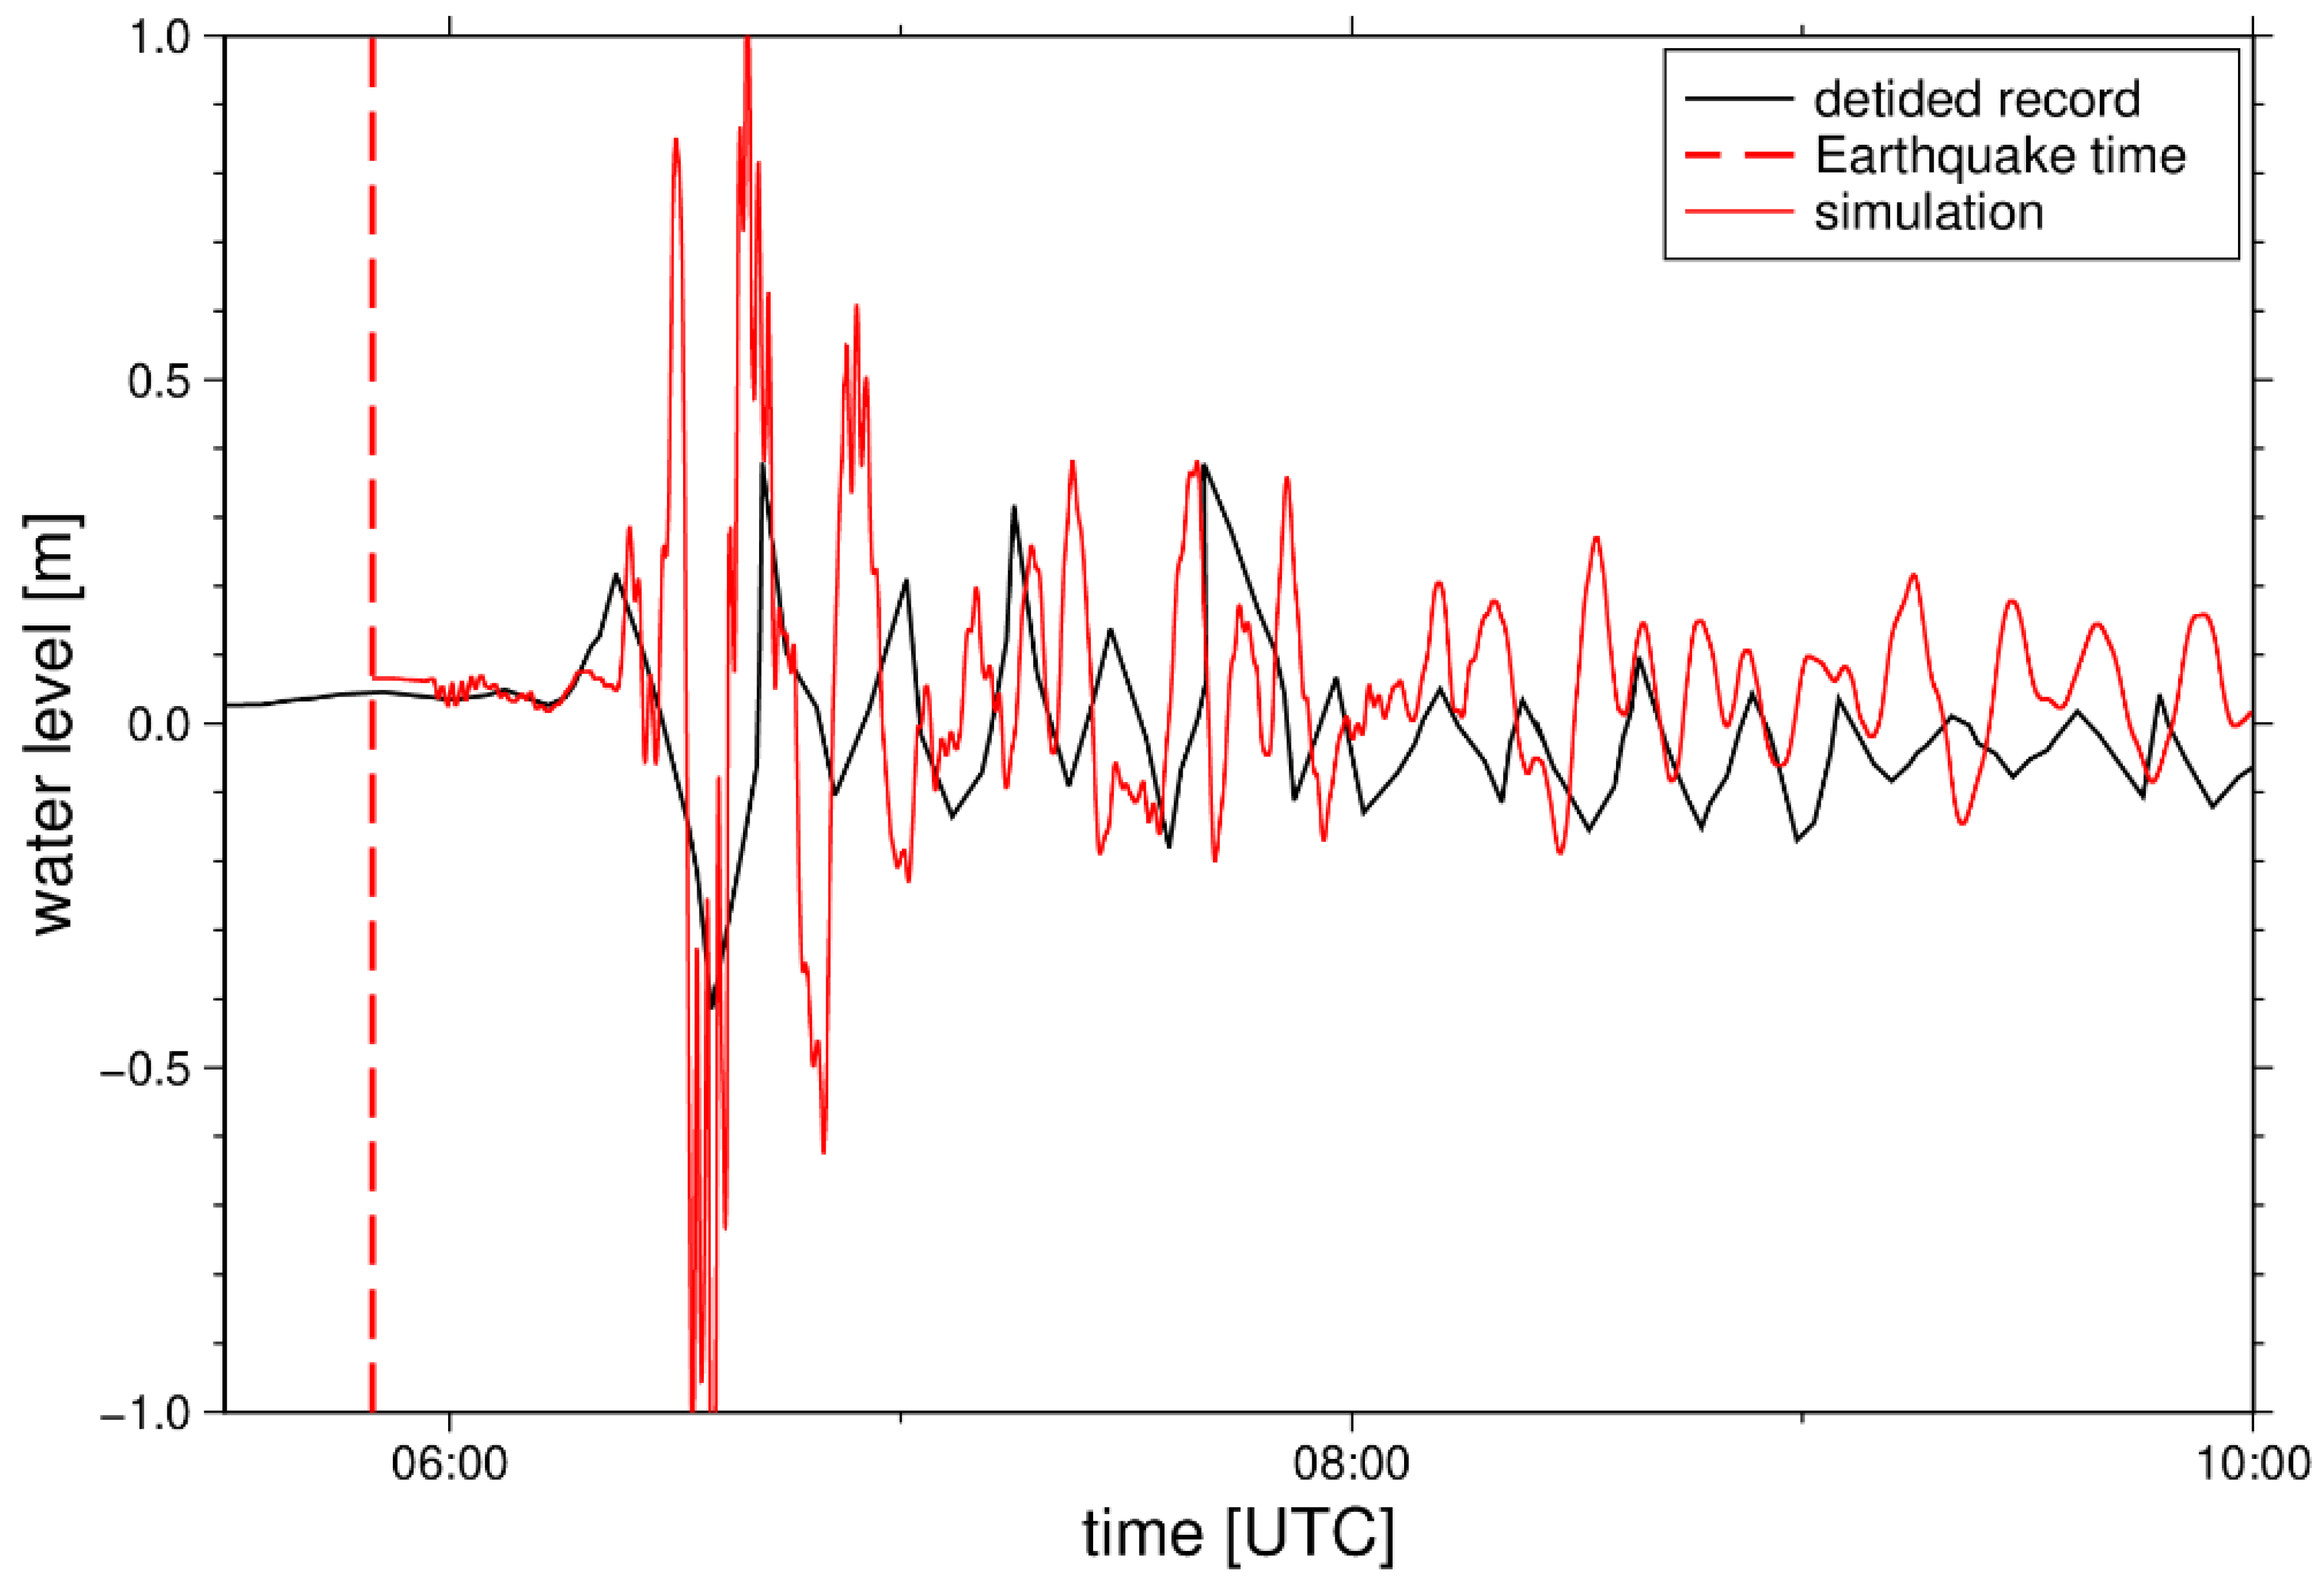
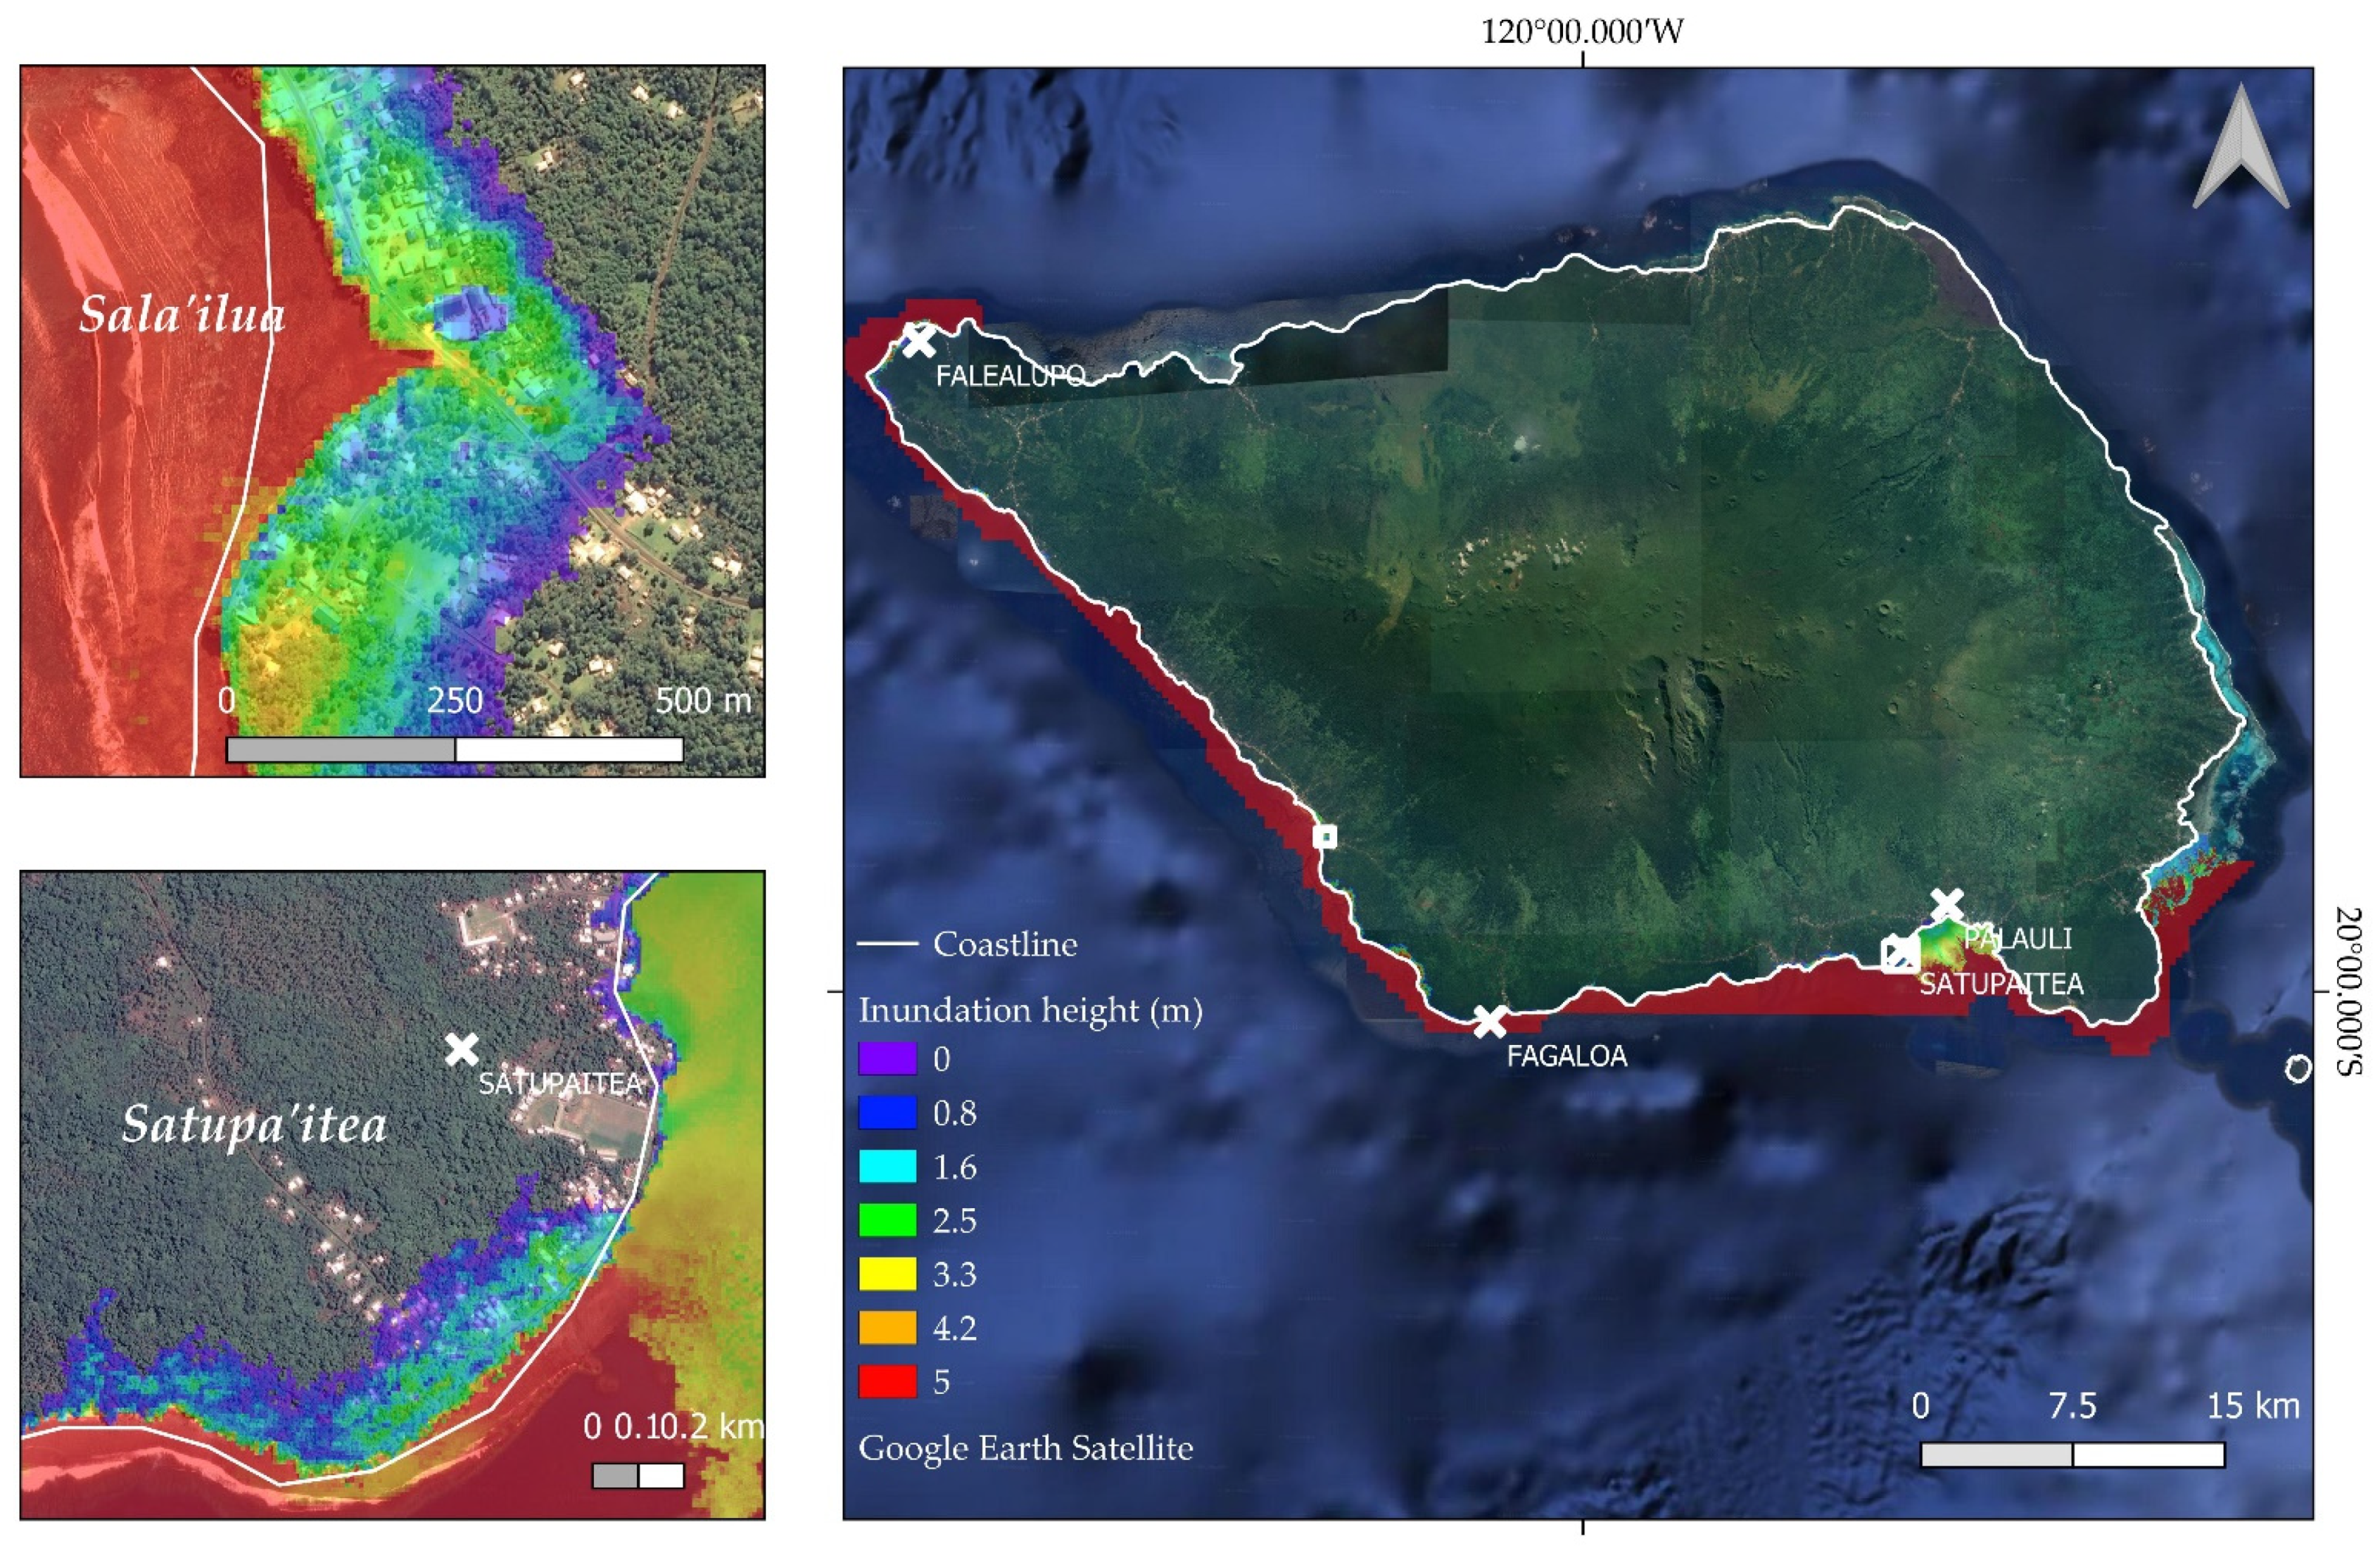
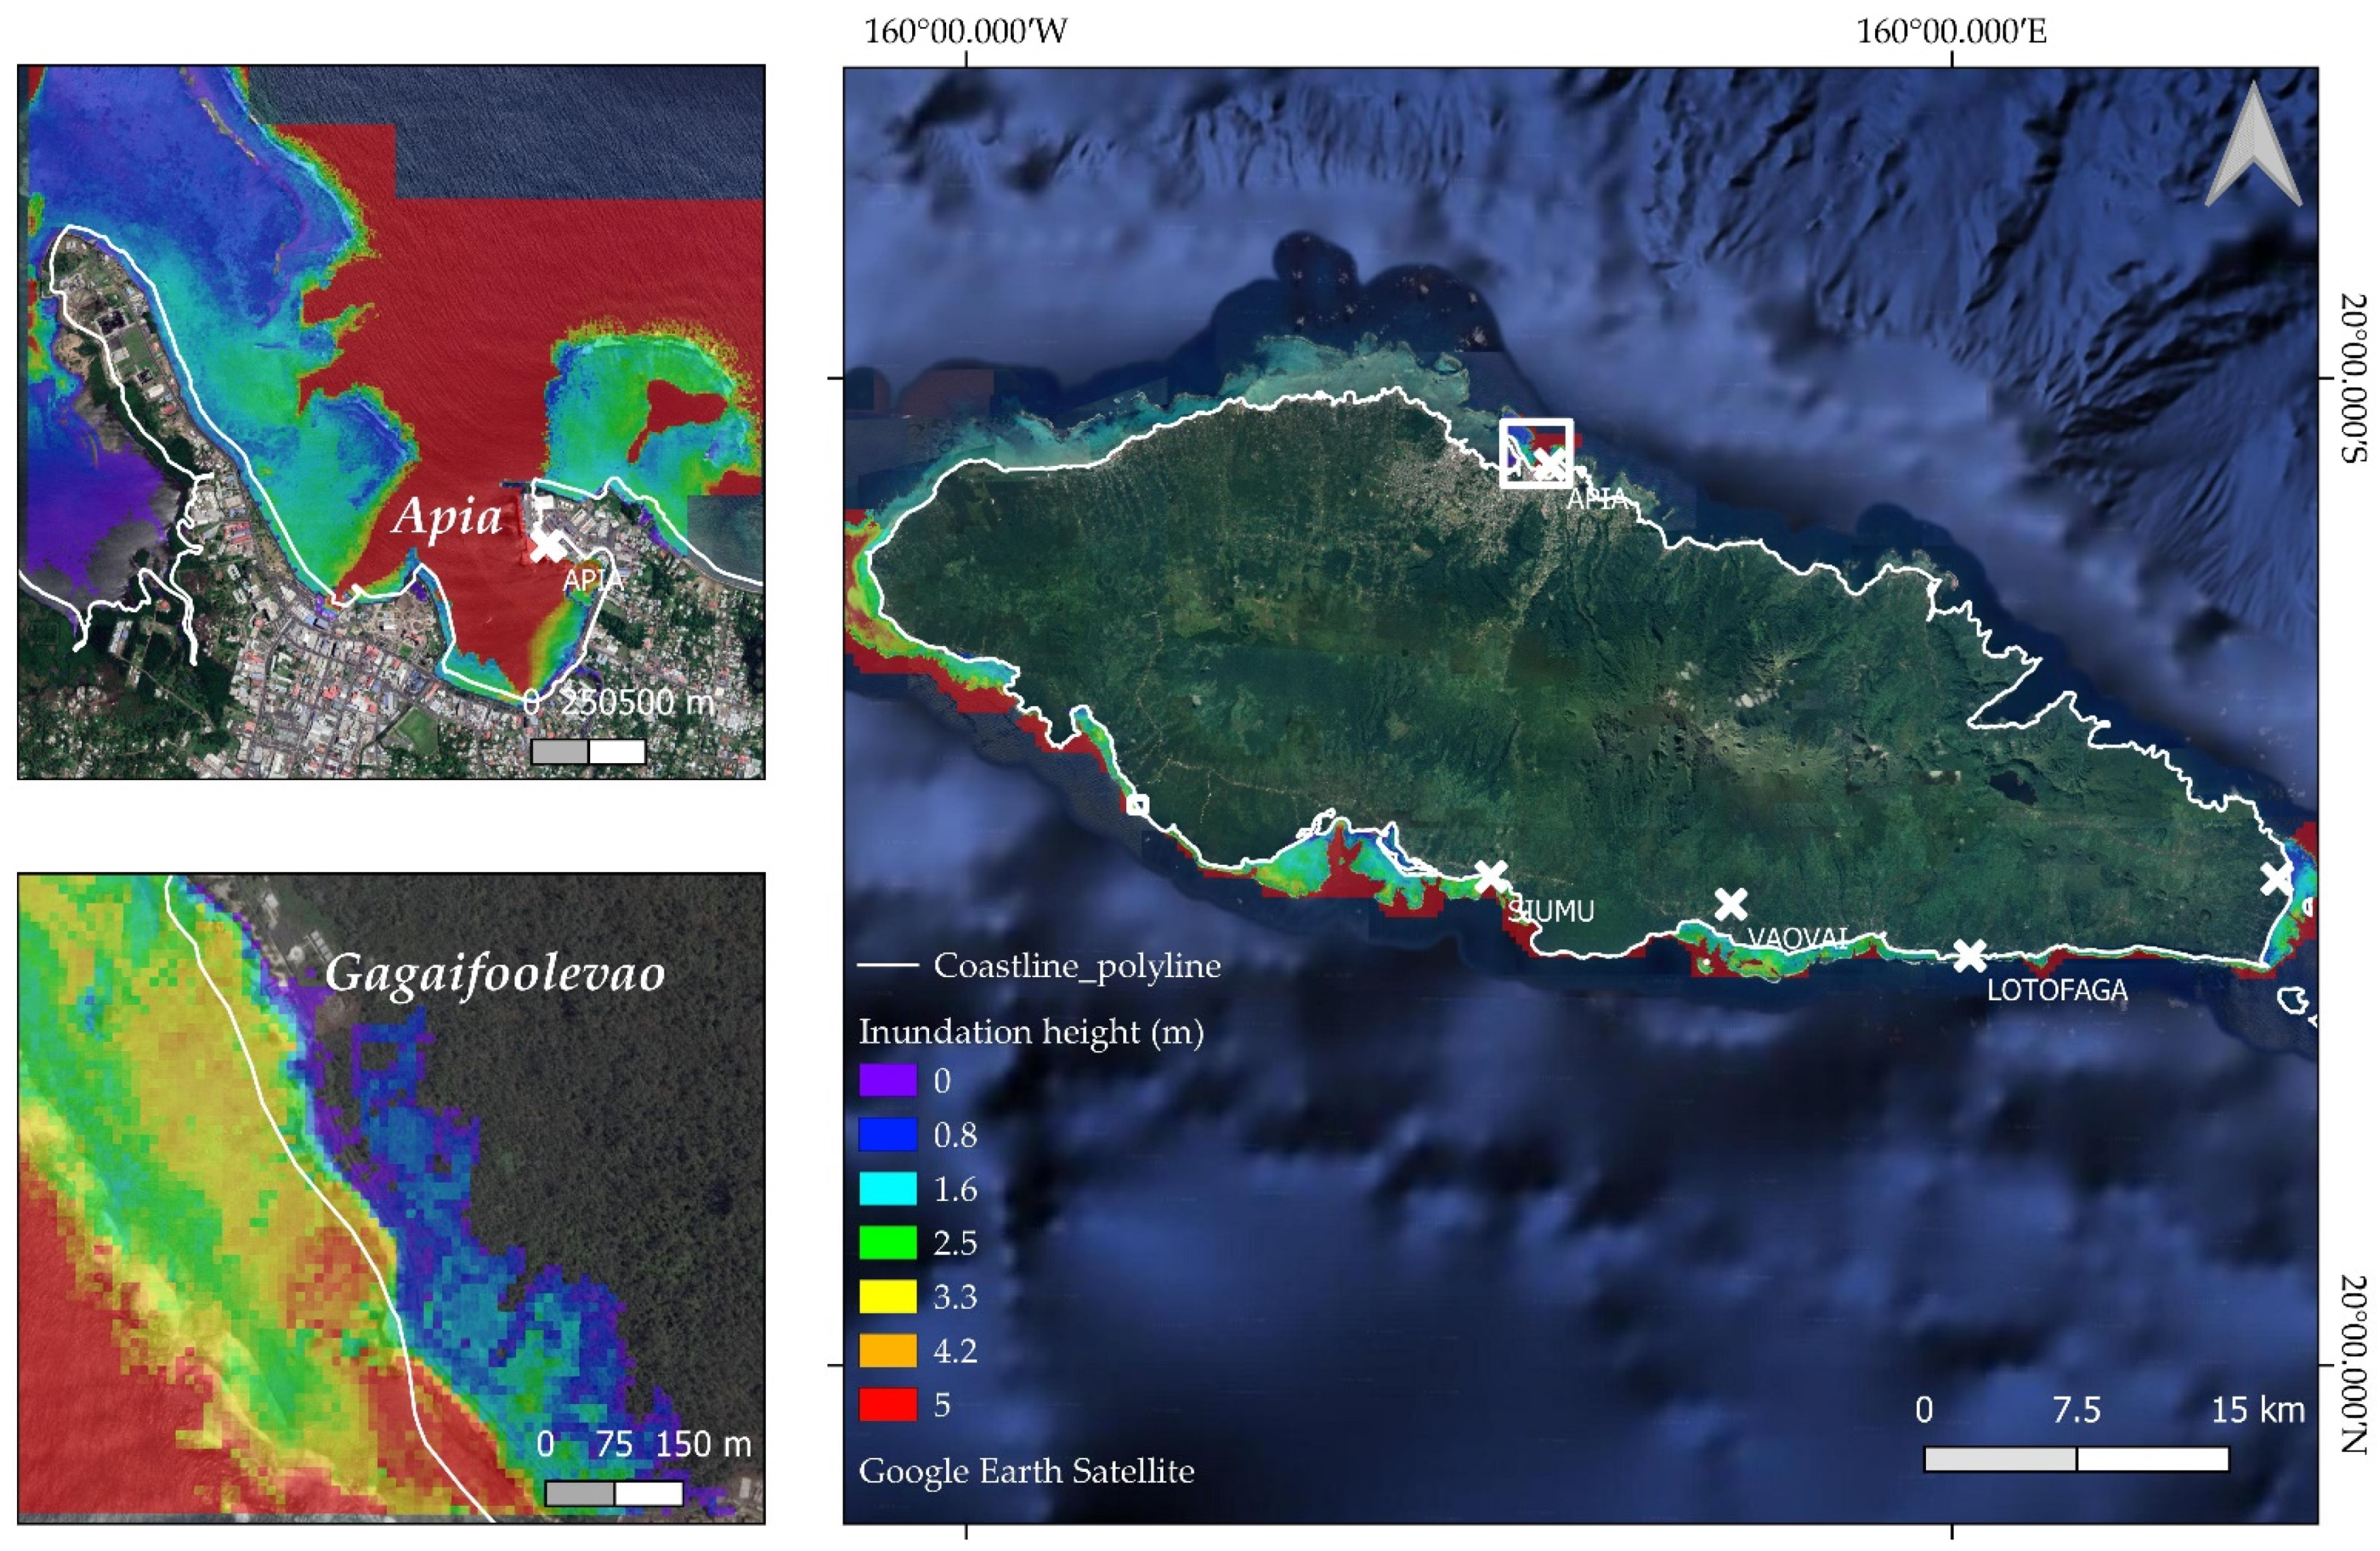
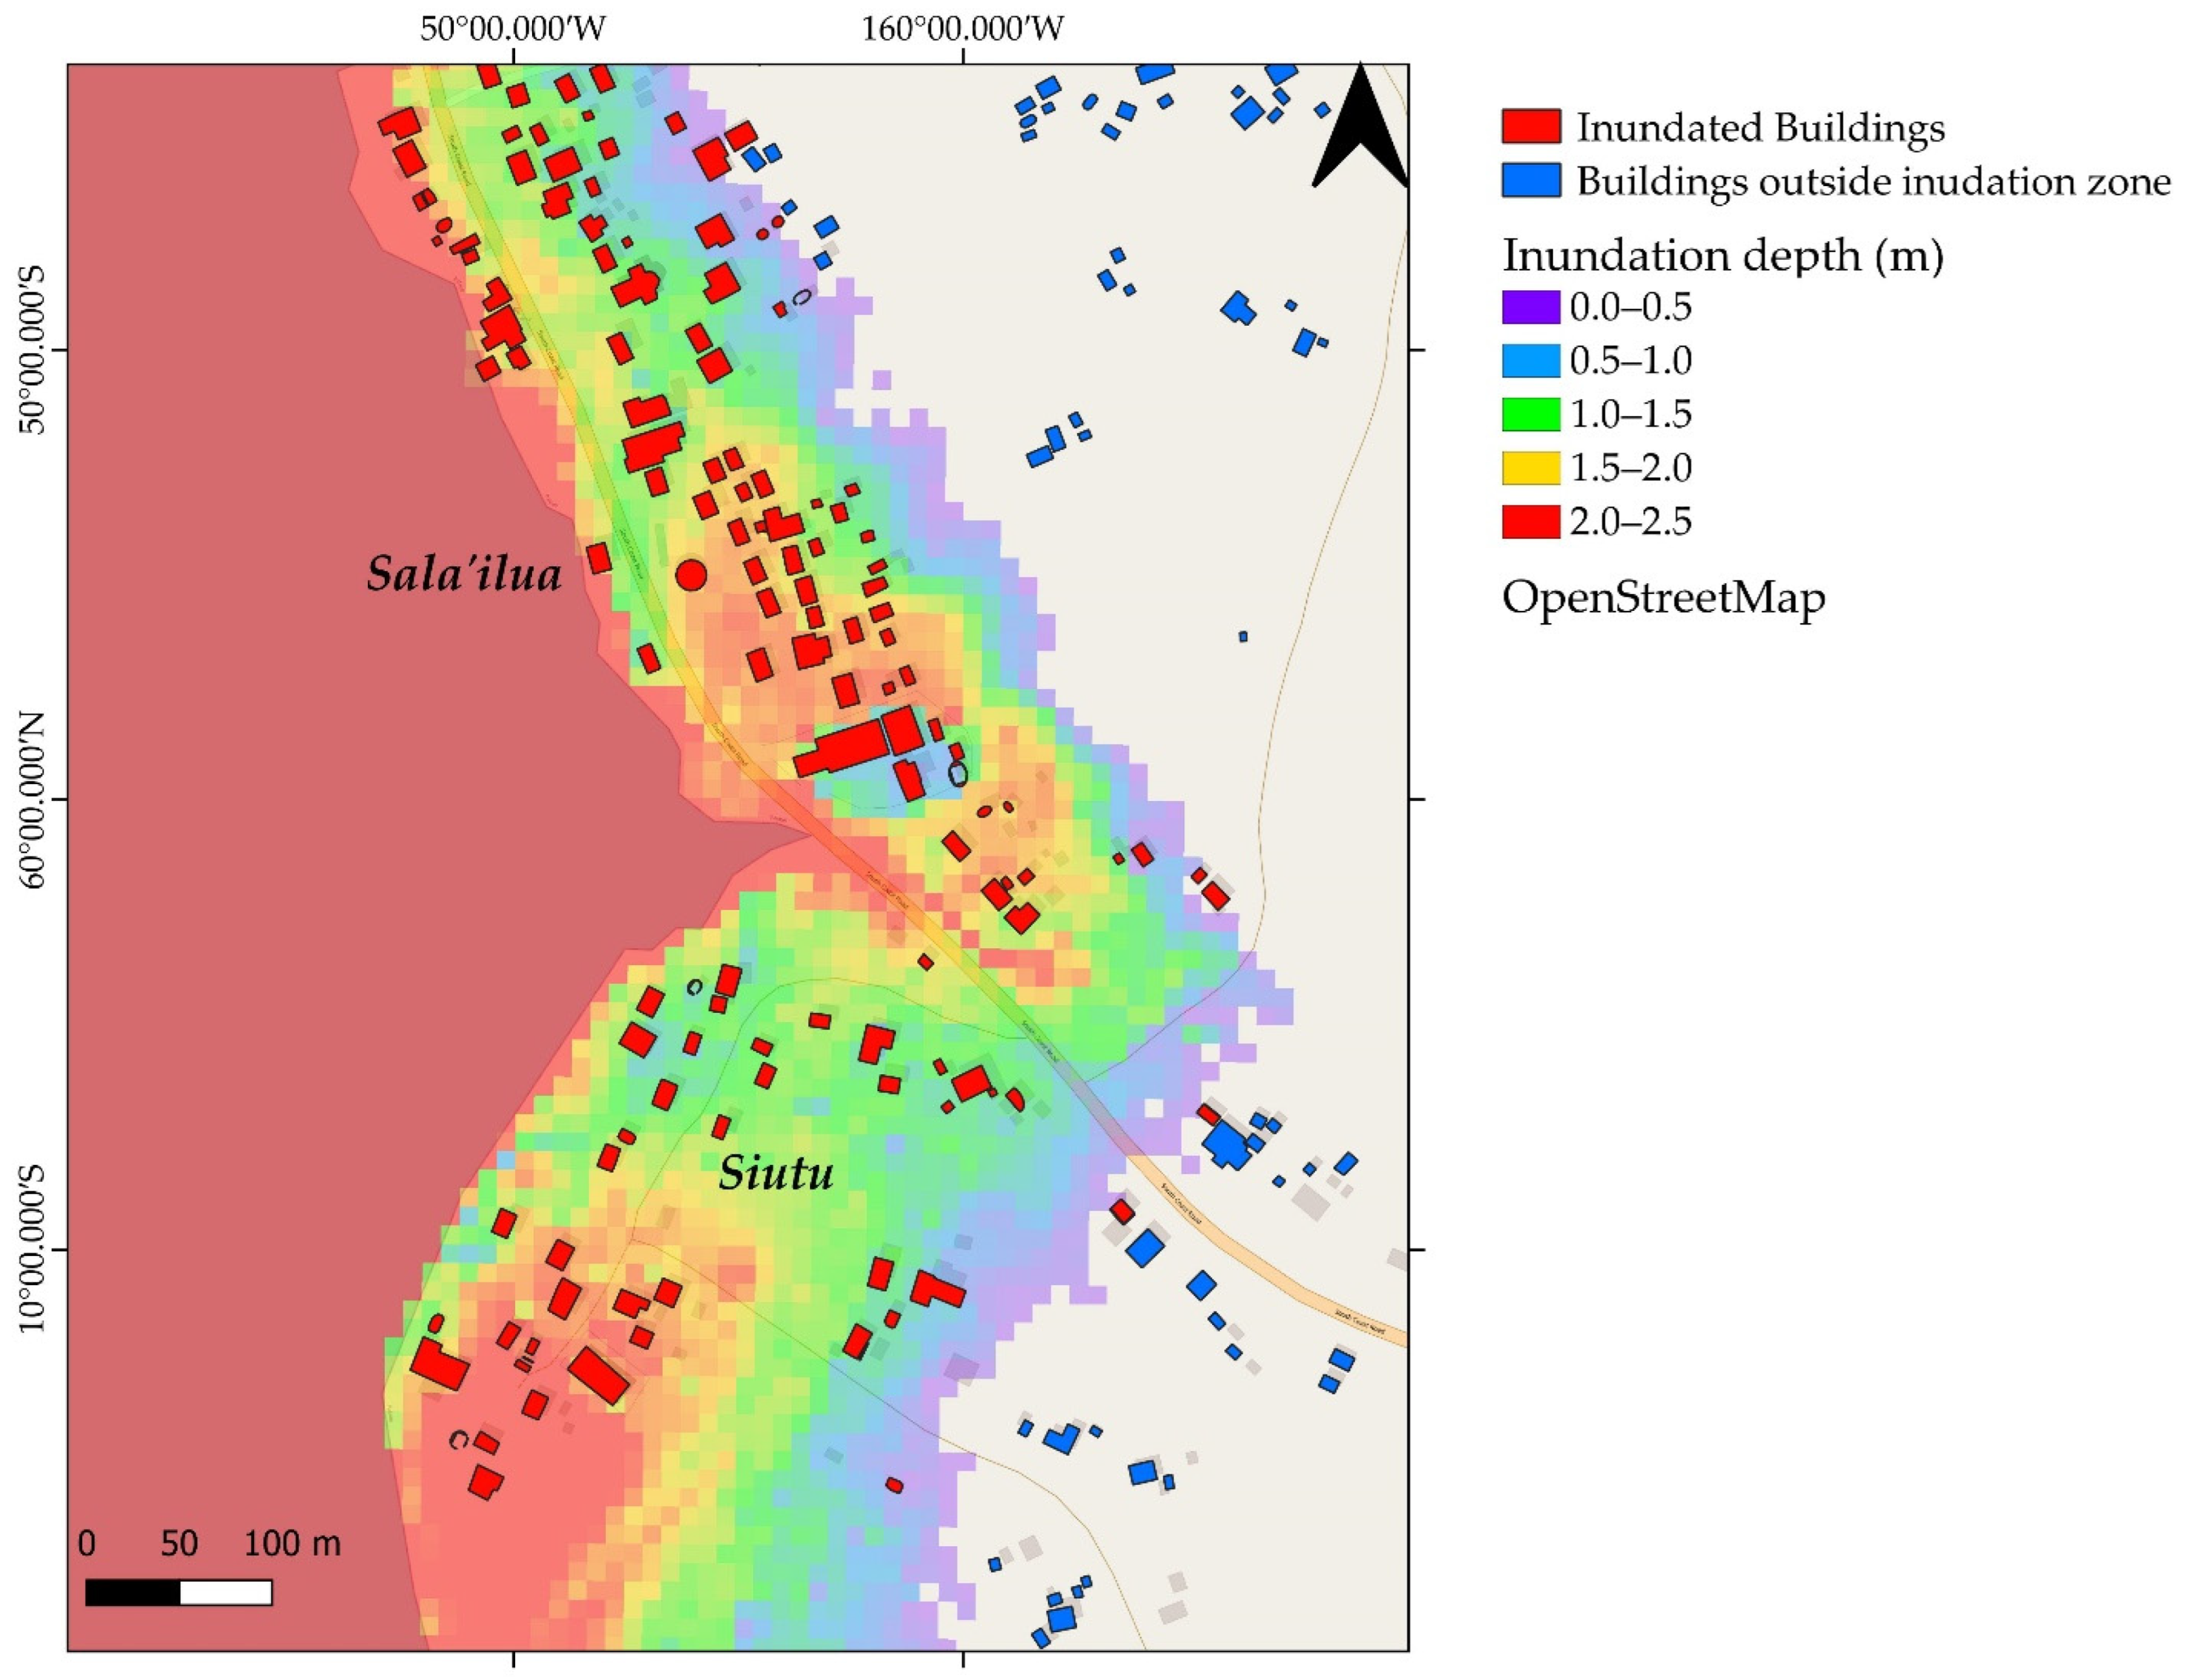
4.1. Tsunami Inundation and Validation

Figure 4 shows the modelled maximum tsunami wave heights for the 1917 tsunami event. Of particular note is that the southwest side of Savai’i is mostly affected where wave heights of 2 m appear to have impacted the coast. Interestingly, the arrival of the simulated wave in Apia harbour suggests that it took approximately 34 min travel time to this location. This is consistent with the observed tide gauge record (Figure 5) when using a 20 min shift in the reference time.
Figure 6 and Figure 7 show which parts of Upolu and Savai’i were most affected by the tsunami, which are generally consistent with available runup observations [4,31] as well as sedimentary evidence presented in [30]. Inundation on Savai’i mostly affects the south western side of the island with much higher flow depths compared with eastern parts of the island including Upolu. Northern Upolu appears unaffected except in areas near Apia. Observed runup points derived from historical records identified in Savai’i (Figure 6) and Upolu (Figure 7) highlight the limited runup observations available for this event.

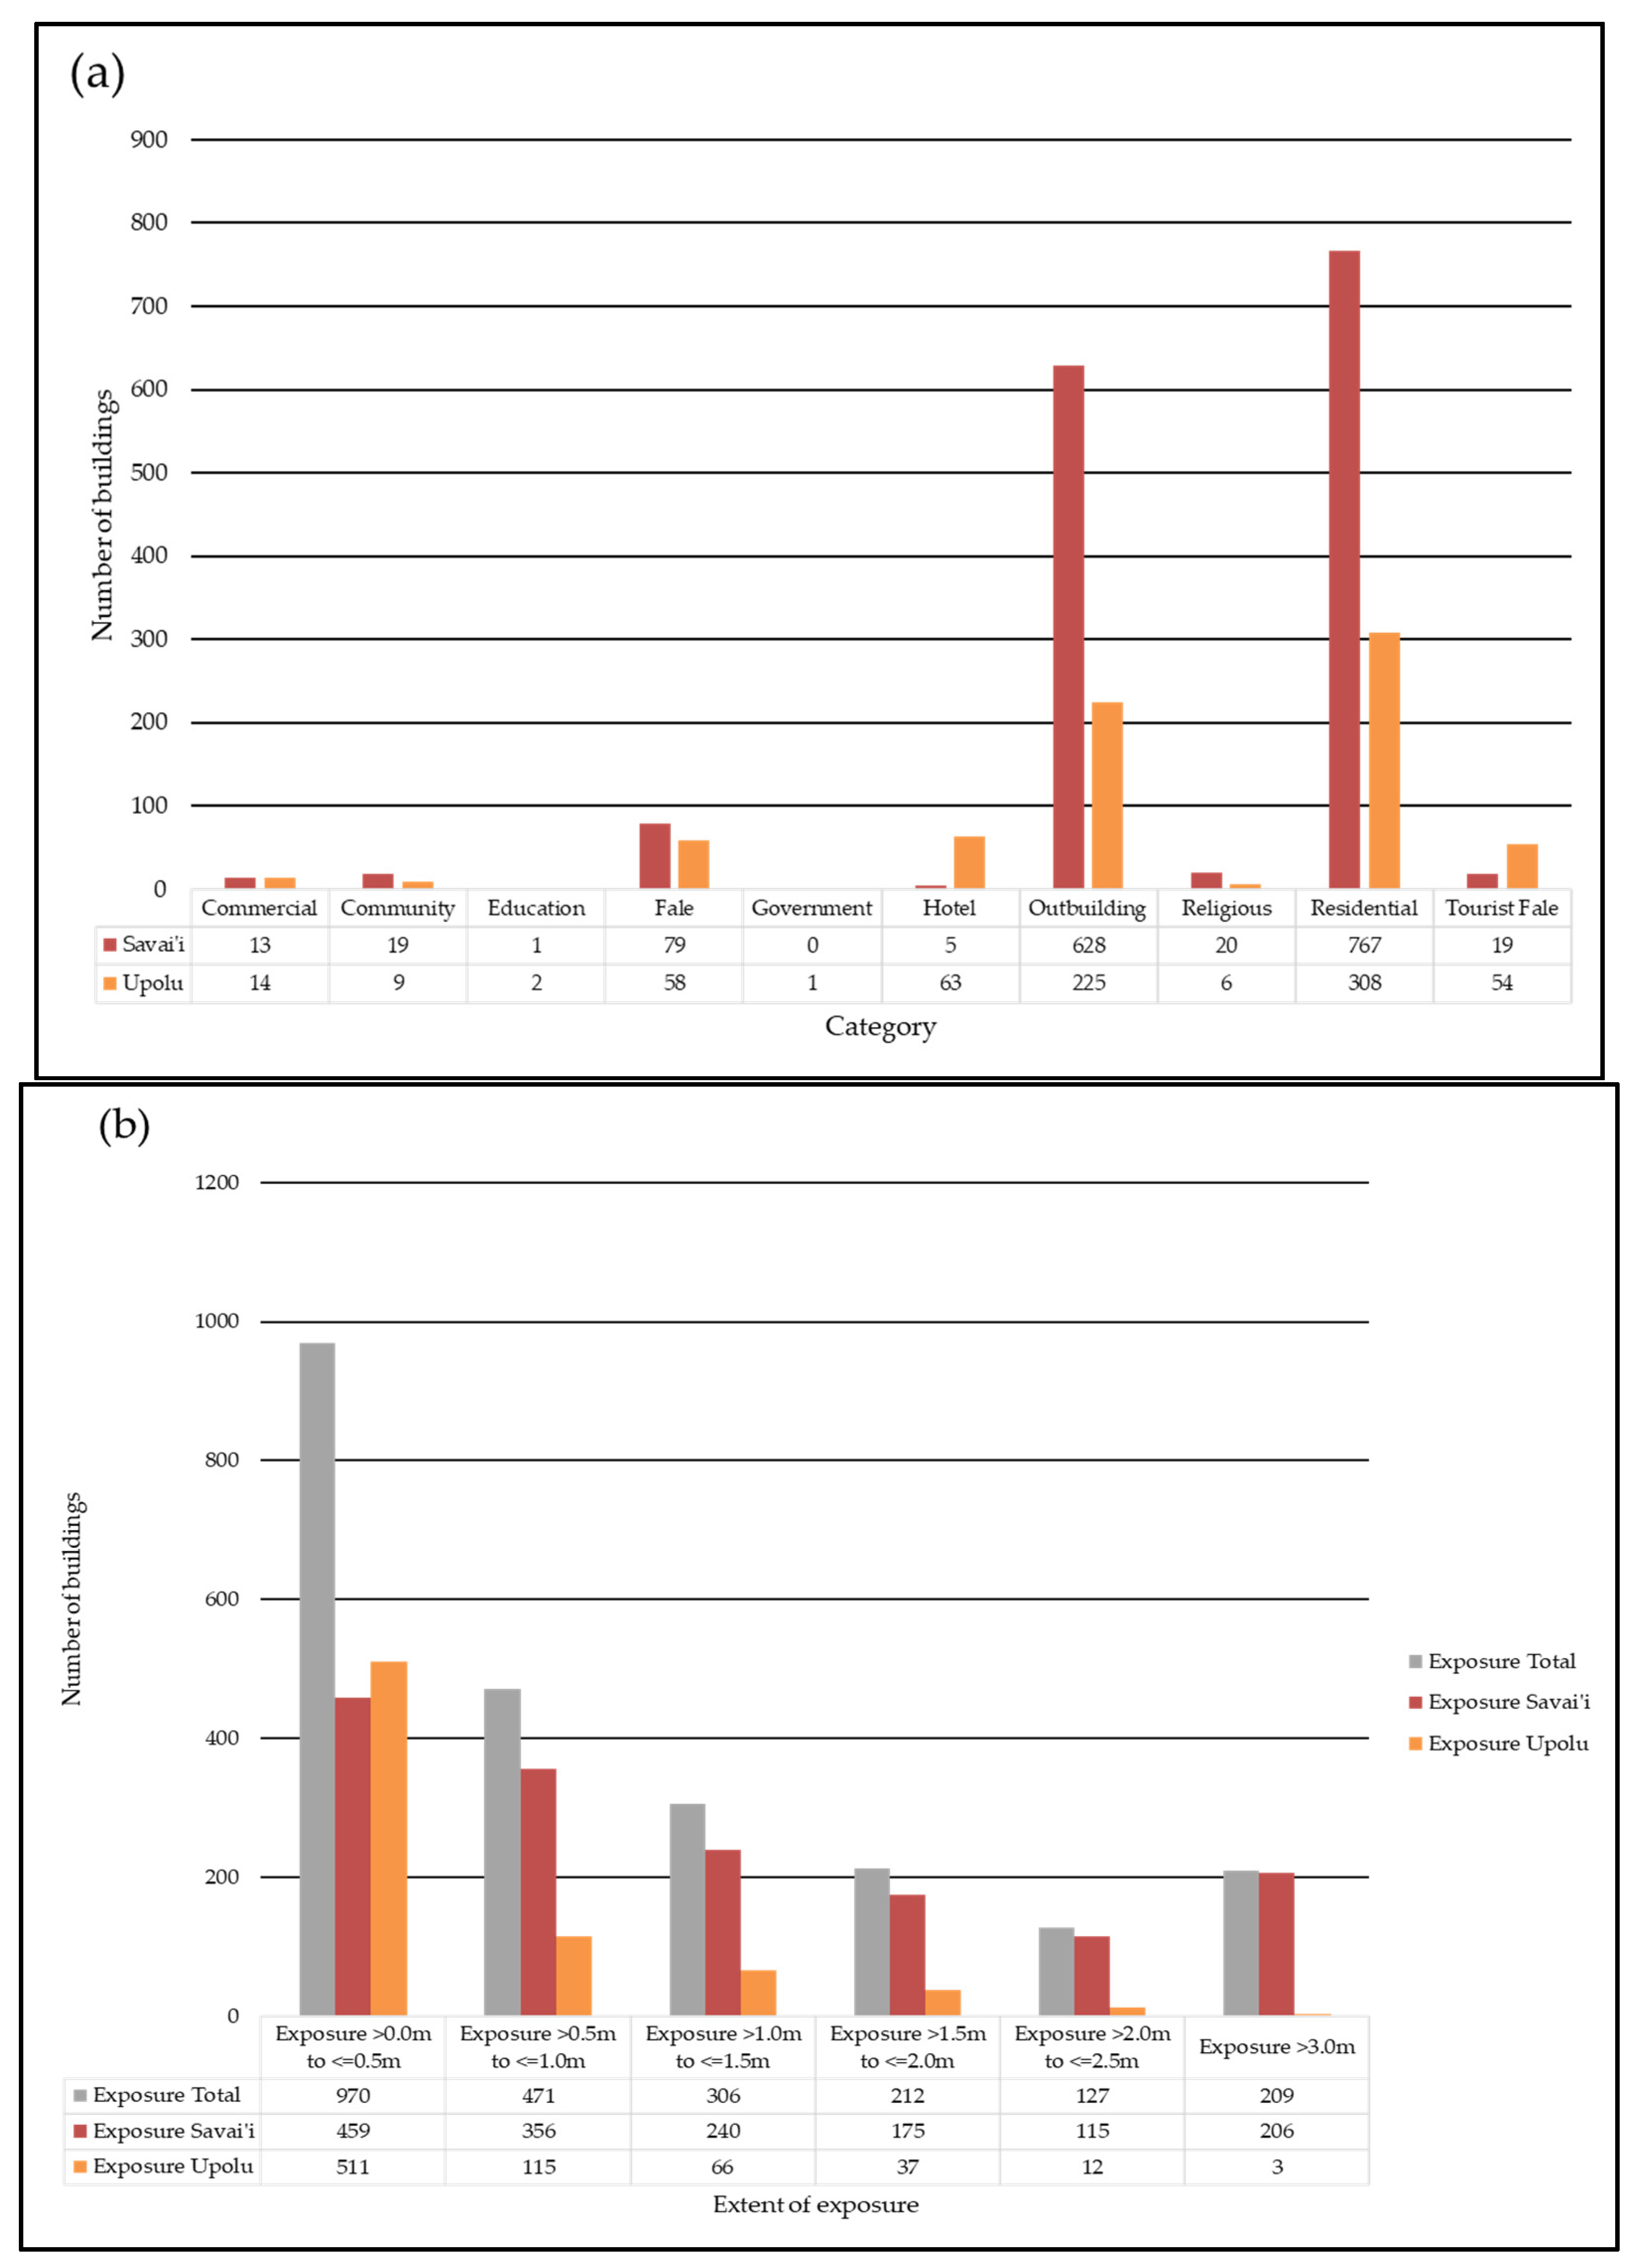
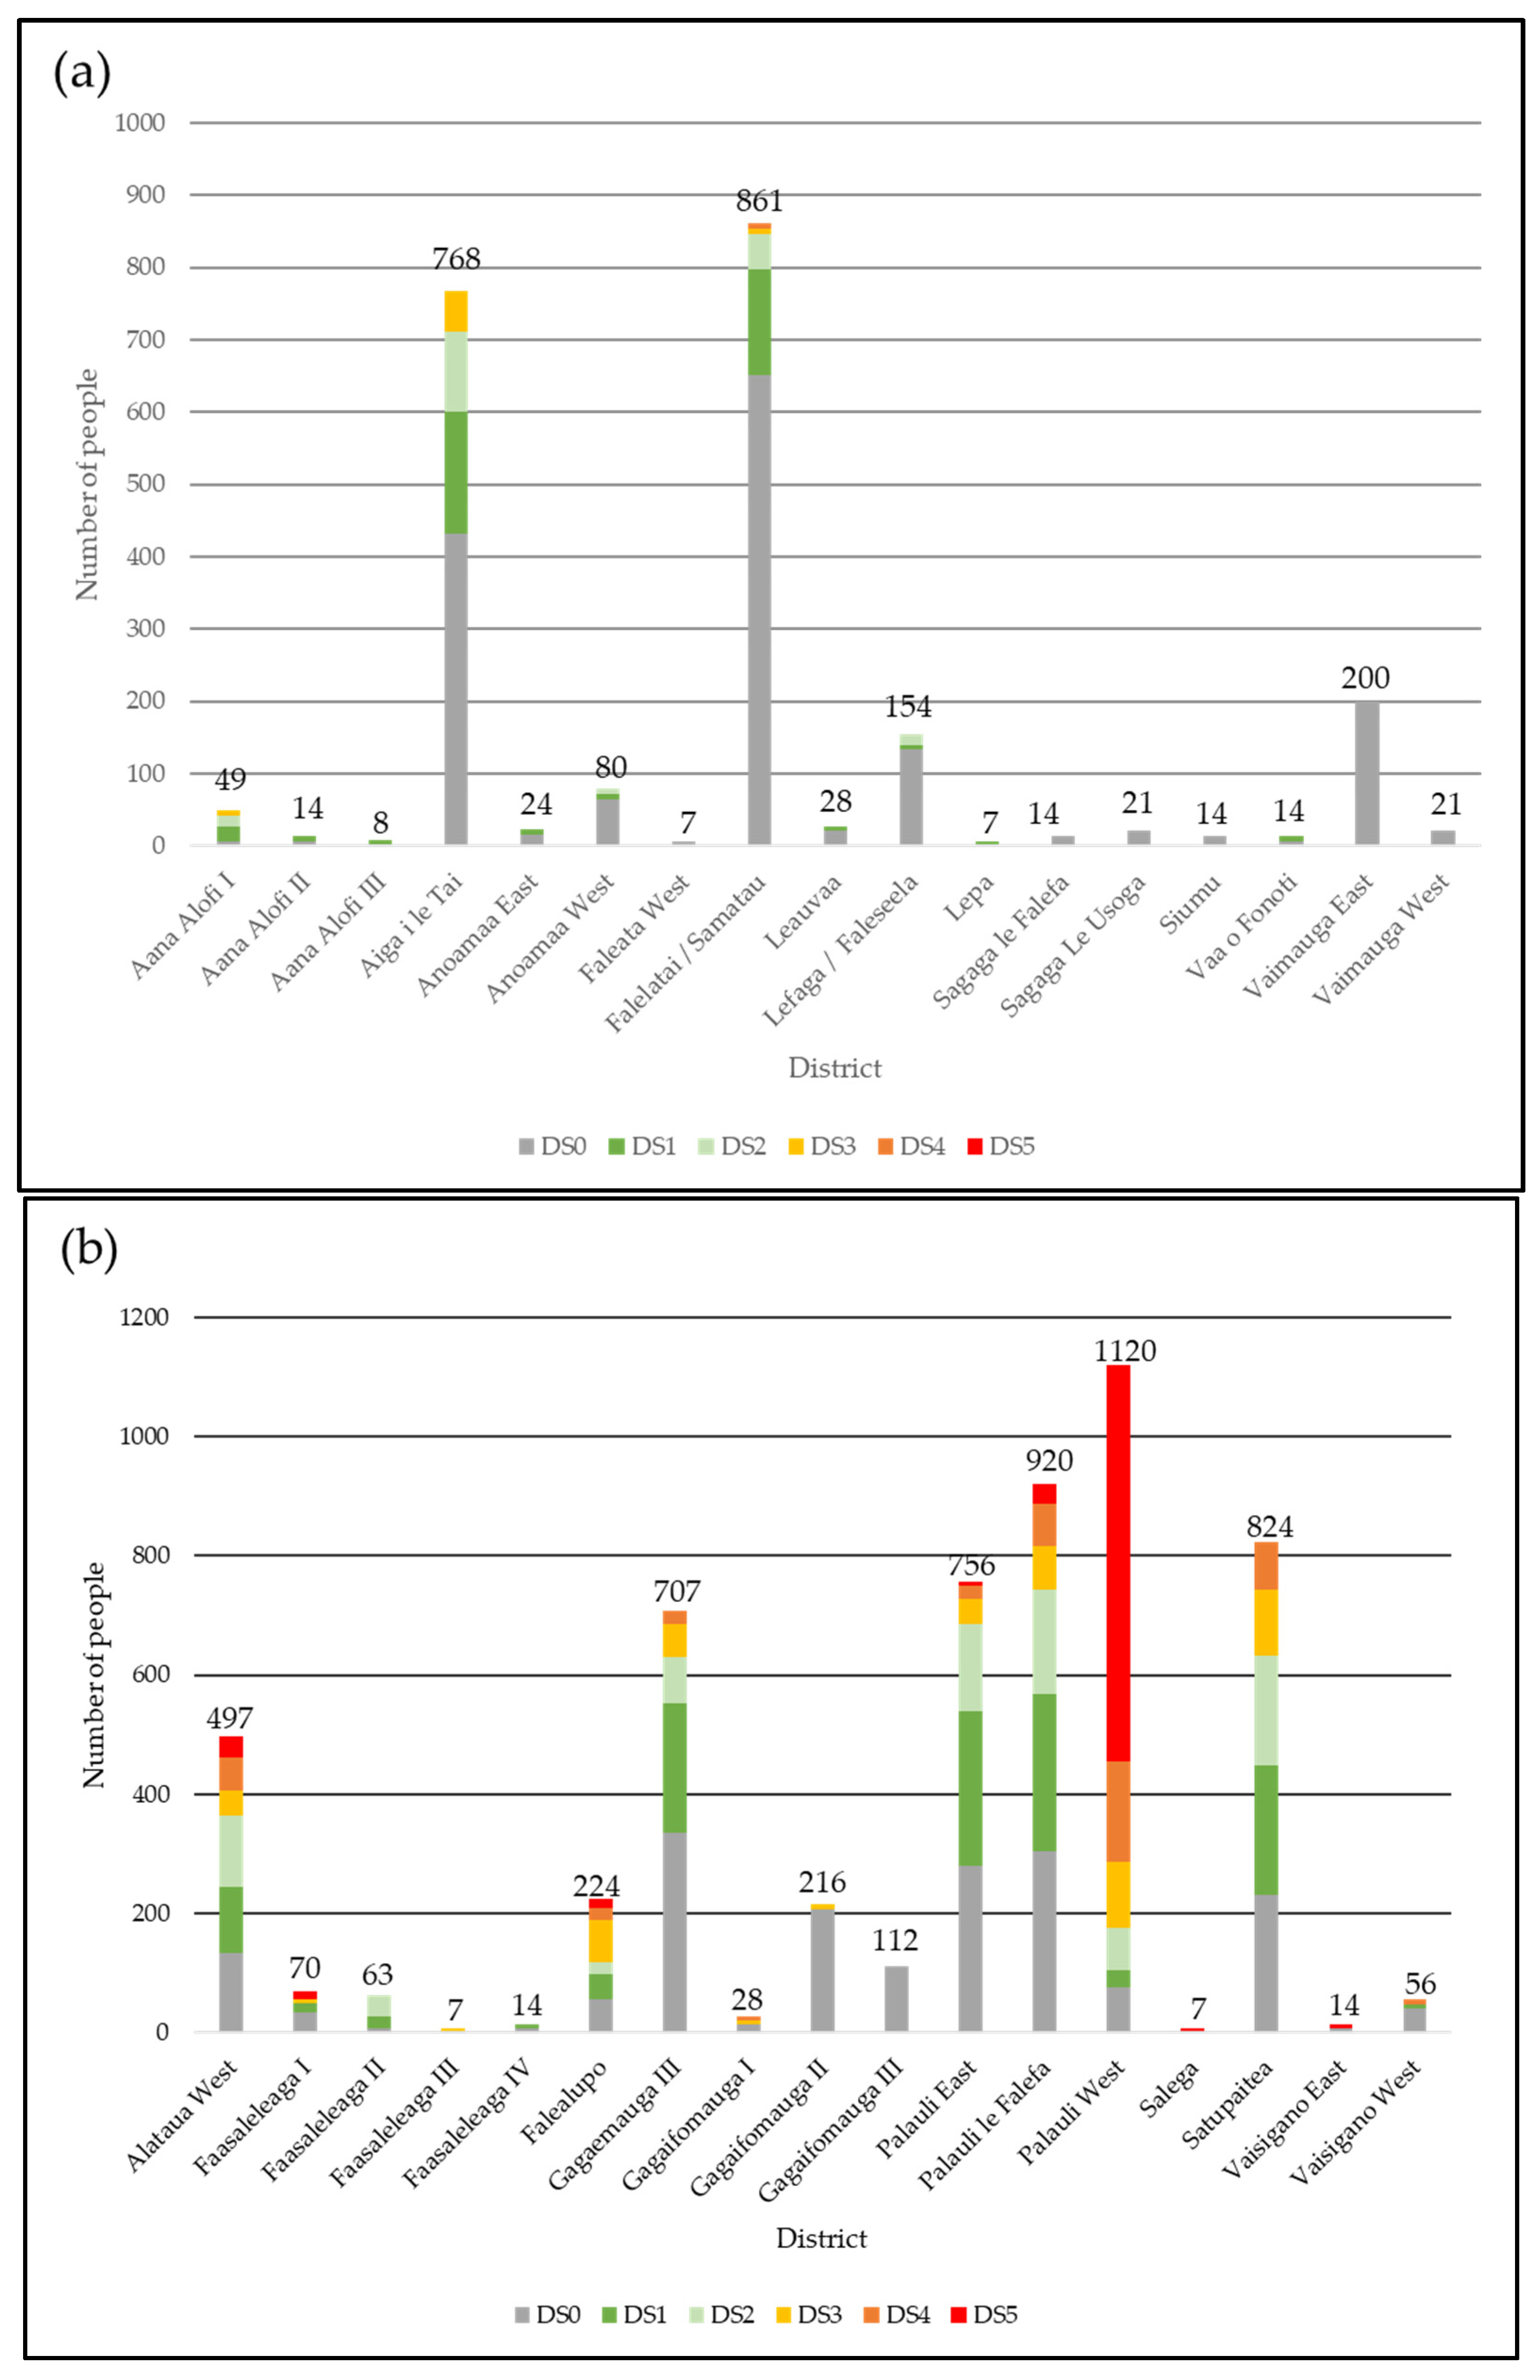
4.2. Damage to Present-Day Buildings and Population Exposure

If a characteristic 1917-tsunami event scenario were to occur in the near future, we estimate that approximately 2295 buildings would be affected by the inundation (based on present-day building stock). Most exposed buildings on both Savai’i and Upolu are subjected to flow depths >0.0 m to ≤0.5 m (Figure 8). As flow depth increases, the number of buildings in each category decreases. However, it is worth noting that 206 buildings on Savai’i are exposed to flow depths >3.0 m, which generally means these buildings are most likely to experience moderate to severe damage. Construction frames made of timber have a higher probability of suffering from severe damage or undergoing complete collapse (Figure 8b).
The total number of people living in residential buildings within the modelled 1917 tsunami inundation zone are exhibited in Figure 9. In total, approximately 7919 people across 1074 residential buildings (71% of which are in Savai’i) would be affected by the tsunami, which amounts to approximately 4% of the total population in 2016 [37].
It is worth noting that on Savai’i, 13% of the affected inhabitants live in buildings that are estimated to sustain damage states of DS5 (i.e., complete building collapse). This is particularly the case for the district of Palauli West. On Upolu, more than half of the affected population live in buildings estimated to sustain damage states DS0 (i.e., no damage). The more inundated part of Upolu in the west of the island exposes approximately 77 people who live in buildings likely to sustain damage state DS3 or greater.

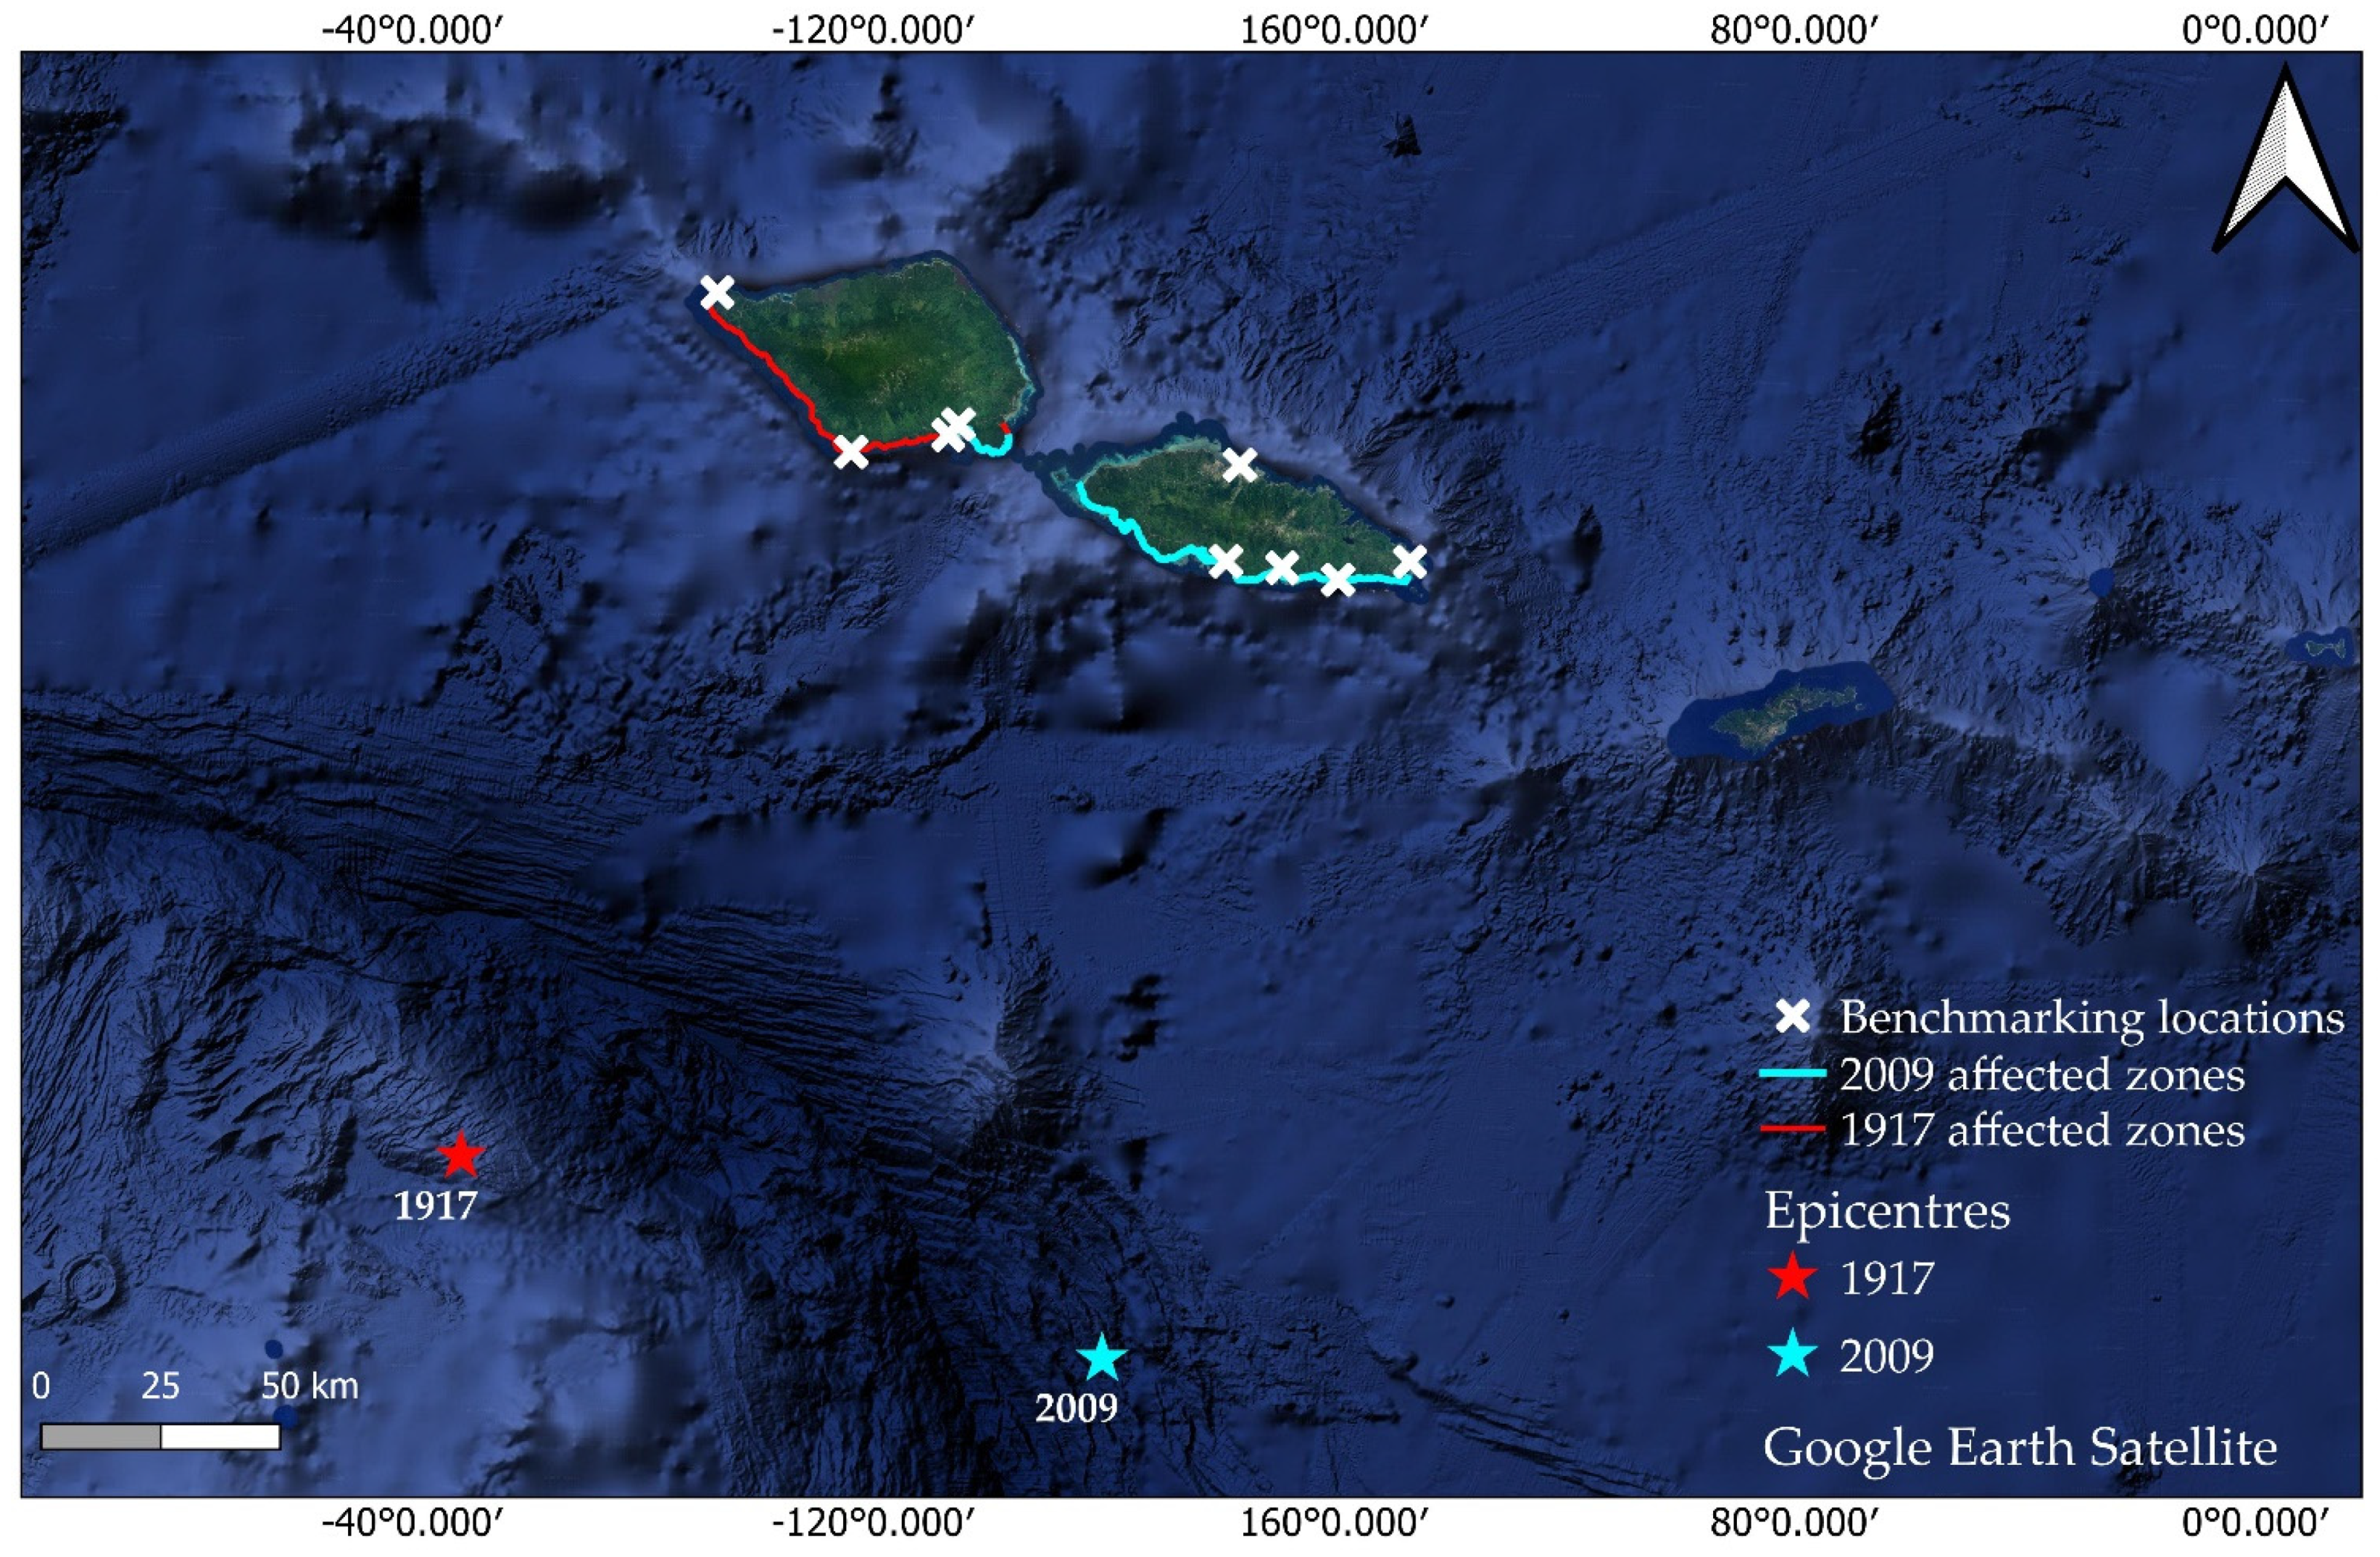
4.3. Comparison with the 2009 Tsunami

The 2009 event is the most devastating tsunami to have affected Samoa in recent history. Occurring on 29 September, at 06:48 a.m. local time, two earthquakes only minutes apart shook the ground and caused large waves to travel quickly through the ocean, which caused major destruction and loss of life in less than 30 min after the earthquake rupture [26,38,39]. As the 1917 event can be considered a historical predecessor to the 2009 event in terms of source region [12], a comparison between the two events is made.
Apart from the obvious differences in instrumental monitoring quality in 1917 compared with 2009 [26,40], the main differences between the two events in terms of the distribution of affected coast are highlighted in Figure 10. The main energy beam for the 1917 tsunami was focused towards west and south Savai’i, whereas for the 2009 event, energy was focused towards American Samoa and southeast Upolu, which reflects the proximal epicentral locations of the generating earthquakes, respectively, which were about 150 km apart.
These hazard characteristics help to explain the observed variations in exposure impact distributions between the modelled 1917 and benchmark 2009 events. A larger proportion of people would be exposed in Savai’i island (71% of the total exposure) compared with Upolu island if a characteristic 1917-type event were to occur. In contrast, coastal areas in southeast and east Upolu were most severely affected in the 2009 event, which reflects the epicentral location of the generating earthquake at the subducting bend of the NTT terminus and main direction of tsunami flux east/northeast towards southeast Upolu. The 1917 epicentre 150 km to the west at the transform segment of the NTT results in the main direction of tsunami flux northward towards Savai’i. This implies that the distribution of the relative exposure of elements at risk to NTT-sourced tsunamis depends on the location of earthquake origin along the subduction zone bend of the NTT.
Notwithstanding the spatial differences in exposure relative to the location of tsunami origin at the NTT, of note is the time of day that each event occurred. Both events struck either in the morning (2009 tsunami) or in the evening (1917 tsunami) during times when the residential population was not at maximum capacity. Had they occurred in the middle of the night, for example, then the scale of human losses might have been significantly greater in each event; this is a key consideration in resilience planning for future NTT sourced tsunamis.

5. Discussion

Our results suggest that the south coast of Savai’i including parts of south Upolu were affected by the 1917 tsunami. A comparison of the historic evidence with the modelled inundation shows some inconsistencies. For example, observations of runup in the village of Lotofaga in southeast Upolu indicate that half of the village was submerged [4,31], which suggests significantly greater inundation extent and flow depth in Lotofaga than what our model reproduces. That is, the modelled inundation suggests that Lotofaga was not severely impacted. This inconsistency likely reflects the simplicity in our tsunami source model in the light of recent evidence of complex behaviour at ‘subduction-zone bends’, as is the case at the northern Tonga Trench [26].
In addition, records of the maregram of Apia harbour indicated initial water level fluctuations only 5–10 min after the earthquake compared with approximately 34 min modelled wave arrival time in Apia. The observed fluctuations of 5–10 min in Apia after earthquake initiation is highly unlikely if considering that the tsunami was generated/influenced by the earthquake source alone, which was located further west of the 2009 epicentre and farther away from Apia. However, the maregram accurately recorded the normal tides at the time of the event, which were within 14 min of tide predictions. This suggests that either the recorded timing of the tsunami or earthquake were inaccurate, or that there is more complexity in the tsunami source mechanism than what is currently captured in our modelling. For example, the possibility of complex near-simultaneous faulting source comparable with that seen for the 2009 event [25,38,39] has not been assessed in this study. It is also probable that the earthquake could have caused co-seismic submarine landsliding close to or along the north coast of Upolu, which might explain the early fluctuations observed in Apia harbour that cannot be accounted for using our current earthquake source mechanism (e.g., [41]). Further investigations are needed to unravel this dilemma.
Of particular note is the comparison in total number of casualties between the two events. In the 2009 tsunami, 146 people lost their lives [26] and several thousand were displaced, compared with only two casualties inferred from damage descriptions in the 1917 event [32]. In contrast, the extent of inundation inferred from our modelling of the 1917 tsunami, particularly on Savai’i, suggests that damage to property, threat to life, and displacement would have been more severe than what is currently inferred from the historical records. It is plausible that loss of life may have been minimal based on the modern analogy presented by the devastating Hunga-Tonga Hunga-Ha’apai volcano-generated tsunami where three casualties along with major destruction to property, homes, and businesses, and displacement of approximately 1500 people were observed [42]. However, it is equally plausible that loss of life and human displacement far exceeded that which has been documented in historical records.
Nevertheless, the hazard risk patterns presented in this study when compared with the 2009 event indicate that the 1917 tsunami would have been more severe on the island of Savai’i compared with Upolu. However, the absence of verifiable records pertaining to loss of life in the 1917 event suggest that either: (1) inundation from the 1917 event, on balance, was less destructive than the inundation caused by the 2009 event; (2) the occurrence of the 1917 tsunami in the evening meant that people who felt the earthquake shaking might have been more aware of the potential tsunami threat and self-evacuated, which helped to minimize/avoid loss of life; or (3) potential casualties from this event were simply not accurately reported and documented in the historical literature. The latter likely reflects a probable association with the 1918 influenza pandemic that overwhelmed Samoa and resulted in the loss of close to 25% of the population, most of them adults and knowledge holders [13,14]. Coupled with the impact of post-WW1 colonialism in Samoa and a shift in political administration could have resulted in the inaccurate reporting of total loses in the event. An example where this is potentially evident is the significant mis-representation of post-colonial population decline in Samoa of up to 80–90% compared with previous estimates of only 20–50% [43].

6. Conclusions

This study aimed to reconstruct the 1917 tsunami in Samoa and assess the impacts of inundation on present-day buildings and population exposure. Our findings show variable consistency between modelled-to-observed event reconstructions, which are exemplified by the inconsistency in the wave arrival time in Apia and underestimation of inundation extent/intensity in southeast Upolu. The observed discrepancies are probably due to: (1) earthquake source model and geometry configuration; (2) instrumental seismic and/or tide gauge record uncertainties for Samoa in 1917 that might explain the 20 min anomaly in the tidal reference time; (3) limited records of runup observations for validation; (4) uncertainties in potential source and/or co-seismic mechanisms that might have exacerbated the observed characteristics of the tsunami (e.g., in Apia harbour). These uncertainties represent areas for further modelling investigation.
Notwithstanding these discrepancies, our modelling provides a first-order estimation to better quantify the magnitude of impacts for the 1917 tsunami inundation in Samoa that can support scenario-based hazard risk assessment. Our modelling suggests that the scale of impacts, in particular on Savai’i and with regards to potential casualties and human displacement, likely exceeded that which was recorded in historical records. However, it is equally plausible that, although the extent of property damage and displaced peoples was likely severe, the casualty rate may have been low comparable to the death toll observed in the January 2022 Hunga-Tonga Hunga-Ha’apai tsunami in Tonga.
Nevertheless, comparison between the 1917 and 2009 events suggests that the extent of present-day exposure distribution around the two main islands of Samoa from local tsunamis originating at the Northern Tonga Trench is highly influenced on the earthquake epicentre and location/orientation of co-seismic displacement. That is, Savai’i Island is more exposed to tsunamis originating along the western segment of the NTT (e.g., 1917 event), compared with Upolu in the east, which exhibits greater exposure to outer-rise events originating along the east NTT segment.

Author Contributions

Conceptualization, L.S., C.B., S.W., R.P., J.C.T., M.W., L.T. and P.V.; methodology, C.B., S.W., R.P. and L.S.; software, C.B., R.P., L.S., S.W. and M.W.; validation, L.S., C.B., S.W., R.P., J.C.T., M.W., L.T. and P.V.; formal analysis, L.S., C.B., S.W., R.P., J.C.T., M.W., L.T. and P.V.; investigation, L.S., C.B., S.W., R.P. and P.V.; resources, S.W. and M.W.; data curation, L.S., C.B., S.W., M.W., J.C.T. and L.T.; writing—original draft preparation, L.S., S.W., C.B., R.P., M.W. and P.V.; writing—review and editing, L.S., C.B., S.W., R.P., J.C.T., M.W., L.T. and P.V.; visualization, L.S., C.B. and R.P.; supervision, S.W., M.W. and J.C.T.; project administration, L.S., S.W. and M.W.; funding acquisition, S.W., L.S., M.W., P.V., J.C.T. and L.T. All authors have read and agreed to the published version of the manuscript.

Funding

The APC was funded by NIWA Taihoro Nukurangi Project No: CARH2206.

Institutional Review Board Statement

Not applicable.

Informed Consent Statement

Not applicable.

Data Availability Statement

Baseline topography, bathymetry, and exposure datasets used in this study as well as raw results are accessible via formal request to the Samoa Ministry of Natural Resources and Environment. The BG-Flood hydrodynamics modelling software is available on the GitHub: https://github.com/CyprienBosserelle/BG_Flood (accessed on 1 June 2021), and the RiskScape multi-hazard impacts modelling software is available at: https://riskscape.org.nz/ (accessed on 28 June 2021).

Acknowledgments

This research was supported via collaboration between NIWA Taihoro Nukurangi Natural Hazards National Science Centre (S.W.; C.B. and R.P.), the University of Portsmouth (L.S. and M.W.), the Samoa Ministry of Natural Resources and Environment (J.C.T. and L.T.) and GNS Te Pu Ao National Earthquake Information Database (P.V.). Three anonymous reviewers are thanked for the helpful comments which significantly improved the paper.

Conflicts of Interest

The authors declare no conflict of interest.

References

  1. Shultz, J.M.; Cohen, M.A.; Hermosilla, S.; Espinel, Z.; McLean, A. Disaster Risk Reduction and Sustainable Development for Small Island Developing States. Disaster Health 2016, 3, 32–44. [Google Scholar] [CrossRef] [PubMed] [Green Version]
  2. Martyr-Koller, R.; Thomas, A.; Schleussner, C.-F.; Nauels, A.; Lissner, T. Loss and damage implications of sea-level rise on Small Island Developing States. Curr. Opin. Environ. Sustain. 2021, 50, 245–259. [Google Scholar] [CrossRef]
  3. Williams, S.; Paulik, R.; Weaving, R.; Bosserelle, C.; Chan Ting, J.; Wall, K.; Simi, T.; Scheele, F. Multiscale Quantification of Tsunami Hazard Exposure in a Pacific Small Island Developing State: The Case of Samoa. GeoHazards 2021, 2, 63–79. [Google Scholar] [CrossRef]
  4. Pararas-Carayannis, G.; Dong, B. Catalog of Tsunamis in the Samoan Islands; International Tsunami Information Center: Honolulu, HI, USA, 1980. [Google Scholar]
  5. Goff, J.; Dominey-Howes, D. The 2009 South Pacific Tsunami. Earth-Sci. Rev. 2011, 107, 5–7. [Google Scholar] [CrossRef]
  6. Gusman, A.R.; Roger, J. Hunga Tonga—Hunga Ha’apai Volcano-Induced Sea Level Oscillations and Tsunami Simulations. GNS Sci. Webpage 2022. [Google Scholar] [CrossRef]
  7. Klein, A. Tongan volcano erupts. New Sci. 2022, 253, 7. [Google Scholar] [CrossRef]
  8. Lavigne, F.; Morin, J.; Wassmer, P.; Weller, O.; Kula, T.; Maea, A.V.; Kelfoun, K.; Mokadem, F.; Paris, R.; Malawani, M.N.; et al. Bridging Legends and Science: Field Evidence of a Large Tsunami that Affected the Kingdom of Tonga in the 15th Century. Front. Earth Sci. 2021, 9, 748755. [Google Scholar] [CrossRef]
  9. Reese, S.; Bradley, B.A.; Bind, J.; Smart, G.; Power, W.; Sturman, J. Empirical building fragilities from observed damage in the 2009 South Pacific tsunami. Earth-Sci. Rev. 2011, 107, 156–173. [Google Scholar] [CrossRef]
  10. Paulik, R.; Williams, S.; Simi, T.; Bosserelle, C.; Ting, J.C.; Simanu, L. Evaluating building exposure and economic loss changes after the 2009 South Pacific Tsunami. Int. J. Disaster Risk Reduct. 2021, 56, 102131. [Google Scholar] [CrossRef]
  11. Kanamori, H. Importance of Historical Seismograms for Geophysical Research. In Historical Seismograms and Earthquakes of the World; Lee, W.H.K., Meyers, H., Shimazaki, K., Eds.; Academic Press: San Diego, CA, USA, 1988; pp. 16–33. ISBN 9780124408708. Available online: https://resolver.caltech.edu/CaltechAUTHORS:20141216-125156671 (accessed on 10 November 2021).
  12. Okal, E.A.; Borrero, J.C.; Chagué-Goff, C. Tsunamigenic predecessors to the 2009 Samoa earthquake. Earth-Sci. Rev. 2011, 107, 128–140. [Google Scholar] [CrossRef]
  13. Tomkins, S.M. The Influenza Epidemic of 1918-19 in Western Samoa. J. Pac. Hist. 1992, 27, 181–197. Available online: https://www.jstor.org/stable/25169127 (accessed on 27 November 2021). [CrossRef]
  14. Alofaituli, B.T. The 1918 Influenza Epidemic in Sāmoa and the Sāmoa Chruch (LMS). J. Samoan Stud. 2018, 8, 34–44. Available online: https://journal.samoanstudies.ws/2019/05/23/the-1918-influenza-epidemic-in-samoa-and-the-samoa-church-lms/ (accessed on 8 August 2021).
  15. Hart, S.R.; Coetzee, M.; Workman, R.K.; Blusztajn, J.; Johnson, K.T.M.; Sinton, J.M.; Steinberger, B.; Hawkins, J.W. Genesis of the Western Samoa seamount province: Age, geochemical fingerprint and tectonics. Earth Planet. Sci. Lett. 2004, 227, 37–56. [Google Scholar] [CrossRef]
  16. Koppers, A.A.P.; Russell, J.; Jackson, M.G.; Konter, J.; Staudigel, H.; Hart, S.R. Samoa reinstated as a primary hotspot trail. Geology 2008, 36, 435–438. [Google Scholar] [CrossRef]
  17. Koppers, A.A.P.; Russell, J.A.; Roberts, J.; Jackson, M.G.; Konter, J.G.; Wright, D.J.; Staudigel, H.; Hart, S.R. Age systematics of two young en-echelon Samoan volcanic trails. Geochem. Geophys. Geosyst. 2011, 12, Q07025. [Google Scholar] [CrossRef] [Green Version]
  18. Kear, D.; Wood, B.L. The Geology and Hydrology of Western Samoa. In New Zealand Geological Survey Bulletin No. 63; New Zealand Depart of Scientific and Industrial Research: Wellington, New Zealand, 1959. [Google Scholar]
  19. Samoa Bureau of Statistics. Population & Demographic Indicator Summary. Available online: https://www.sbs.gov.ws/population (accessed on 28 October 2021).
  20. Angenheister, G.G. Geschichte des Samoa-Observatoriums von 1902 bis 1921. In Zur Geschichte der Geophysik; Springer: Berlin, Germany, 1974; pp. 43–66. [Google Scholar]
  21. Hatherton, T. Geophysics Division, DSIR 1951–1976: An Account of Geophysical Studies in the Department of Scientific and Industrial Research; Department of Scientific and Industrial Research: Wellington, New Zealand, 1980; p. 45.
  22. Tomlinson, L.A. Observatories in New Zealand and The South Pacific. In Encyclopedia of Geomagnetism and Paleomagnetism; Gubbins, D., Herrero-Bervera, E., Eds.; Springer: Dordrecht, The Netherlands, 2007. [Google Scholar] [CrossRef]
  23. Angenheister, G. Vier Erdbeben und Flutwellen im Pazifischen Ozean, beobachtet am Samoa-Observatorium, 1917–1919. Nachr. Königlichen Ges. Wiss. Göttingen Math. Phys. Kl. 1920, 1920, 201–204. Available online: https://eudml.org/doc/59086 (accessed on 30 May 2021).
  24. Németh, K.; Cronin, S.J. Volcanic structures and oral traditions of volcanism of Western Samoa (SW Pacific) and their implications for hazard education. J. Volcanol. Geotherm. Res. 2009, 186, 223–237. [Google Scholar] [CrossRef]
  25. Lay, T.; Ye, L.; Wu, Z.; Kanamori, H. Macrofracturing of Oceanic Lithosphere in Complex Large Earthquake Sequences. J. Geophys. Res. Solid Earth 2020, 125, e2020JB020137. [Google Scholar] [CrossRef]
  26. Okal, E.A.; Fritz, H.M.; Synolakis, C.E.; Borrero, J.C.; Weiss, R.; Lynett, P.J.; Titov, V.V.; Foteinis, S.; Jaffe, B.E.; Liu, P.L.-F.; et al. Field Survey of the Samoa Tsunami of 29 September 2009. Seism. Res. Lett. 2010, 81, 577–591. [Google Scholar] [CrossRef]
  27. Bosserelle, C.; Williams, S.; Cheung, K.F.; Lay, T.; Yamazaki, Y.; Simi, T.; Roeber, V.; Lane, E.; Paulik, R.; Simanu, L. Effects of Source Faulting and Fringing Reefs on the 2009 South Pacific Tsunami Inundation in Southeast Upolu, Samoa. J. Geophys. Res. Oceans 2020, 125, e2020JC016537. [Google Scholar] [CrossRef]
  28. Engdahl, E.; Villasenor, A. 41 Global seismicity: 1900–1999. Int. Geophys. 2002, 81, S0074–S6142. [Google Scholar]
  29. NCEI/WDS Global Significant Earthquake Database, 2150 BC to Present. Available online: https://www.ncei.noaa.gov/access/metadata/landing-page/bin/iso?id=gov.noaa.ngdc.mgg.hazards:G012153;view=iso (accessed on 20 January 2021).
  30. Williams, S.; Titimaea, A.; Bosserelle, C.; Simanu, L.; Prasetya, G. Reassessment of Long-Term Tsunami Hazards in Samoa Based on Sedimentary Signatures. Geosciences 2020, 10, 481. [Google Scholar] [CrossRef]
  31. Samoa 1917 Earthquake, Search Results. Available online: https://paperspast.natlib.govt.nz/newspapers?items_per_page=10&snippet=true&query=earthquake+samoa (accessed on 1 December 2021).
  32. Significant Earthquake Information, 1917 Earthquake—Samoa Islands. Available online: https://www.ngdc.noaa.gov/hazel/view/hazards/earthquake/event-more-info/3087 (accessed on 13 December 2021).
  33. Vacondio, R.; Palù, A.; Ferrari, A.; Mignosa, P.; Aureli, F.; Dazzi, S. A non-uniform efficient grid type for GPU-parallel Shallow Water Equations models. Environ. Modell. Softw. 2017, 88, 119–137. [Google Scholar] [CrossRef]
  34. Okada, Y. Surface deformation due to shear and tensile faults in a half space. Bull. Seismol. Soc. Am. 1985, 75, 1135–1154. [Google Scholar] [CrossRef]
  35. Tarbotton, C.; Dall’Osso, F.; Dominey-Howes, D.; Goff, J. The use of empirical vulnerability functions to assess the response of buildings to tsunami impact: Comparative review and summary of best practice. Earth-Sci. Rev. 2015, 142, 120–134. [Google Scholar] [CrossRef]
  36. Paulik, R.; Horspool, N.; Woods, R.; Griffiths, N.; Beale, T.; Magill, C.; Wild, A.; Popovich, B.; Walbran, G.; Garlick, R. RiskScape: A flexible multi-hazard risk modelling engine. Res. Sq. 2022, Vers. 1. 22, preprint. [Google Scholar] [CrossRef]
  37. World Bank. Population, Total—Samoa. Available online: https://data.worldbank.org/indicator/SP.POP.TOTL?locations=WS (accessed on 10 December 2021).
  38. Beavan J, Wang X, Holden C, Wilson K, Power W, Prasetya G, Bevis M, Kautoke R Near-simultaneous great earthquakes at Tongan megathrust and outer rise in September 2009. Nature 2010, 466, 959–963. [CrossRef]
  39. Lay, T.; Ammon, C.J.; Kanamori, H.; Rivera, L.; Koper, K.D. The 2009 Samoa-Tonga great earthquake triggered doublet. Nature 2010, 466, 964–968. [Google Scholar] [CrossRef] [Green Version]
  40. Eiby, G.A. Seismograms made before 1963 at stations in the South-west Pacific. In Historical Seismograms and Earthquakes of the World; Lee, W.H.K., Meyers, H., Shimazaki, K., Eds.; Academic Press: San Diego, CA, USA, 1988; pp. 455–461. ISBN 9780124408708. Available online: https://catalogue.nla.gov.au/Record/191994 (accessed on 10 November 2021).
  41. Rahiman, T.; Pettinga, J.; Watts, P. The source mechanism and numerical modelling of the 1953 Suva tsunami, Fiji. Mar. Geol. 2007, 237, 55–70. [Google Scholar] [CrossRef]
  42. World Bank. The 15 January 2022 Hunga Tonga-Hunga Ha’apai Eruption and Tsunami, Tonga: Global Rapid Post Disaster Damage Estimation (GRADE) Report. Available online: https://thedocs.worldbank.org/en/doc/b69af83e486aa652d4232276ad698c7b-0070062022/original/GRADE-Report-Tonga-Volcanic-Eruption.pdf (accessed on 10 February 2022).
  43. Code, B. A Secret Pyramid Consumed by the Jungle. January 2020. Available online: https://www.bbc.com/travel/article/20200109-a-secret-pyramid-consumed-by-the-jungle (accessed on 24 September 2021).
Figure 1. Location of the 1917 earthquake epicentre (star) and 2009 earthquakes (circles) relative to Samoa.
Applsci 12 03389 g001
Figure 2. Tide gauge records for the 1917 tsunami in Apia harbour. (a) Original maregram taken from Angenheister (1920) [23]; (b) inverted and reprojected maregram for digitization; (c) digitized tide record (grey solid line) and predicted tide (black dashed line). The maregram shows the fluctuations of the sea in Apia harbour arriving only a few minutes after the earthquake. The earthquake occurred at 05:49 UTC (dashed red line), with the first noticeable sea level peak at 06:03 UTC. The maregram record prior to the earthquake better matched the predicted tide when shifting the record by 20 min (black solid line), which also produces more consistent arrival time for the tsunami.
Applsci 12 03389 g002
Figure 3. A schematic representation of the RiskScape model pipeline steps and functions applied in this study.
Applsci 12 03389 g003
Figure 4. Maximum wave height offshore for the modelled 1917 tsunami.
Applsci 12 03389 g004
Figure 5. Detided water level recorded in Apia (black line) and simulated (red line). Earthquake time is also given.
Applsci 12 03389 g005
Figure 6. Inundation on Savai’i in close-ups (10 m horizontal resolution). The map shows the 10 m resolution run-up on Savai’i (a) and close-up of inundation in Satuiatua (b), and in Palauli and Satupa’itea (c).
Applsci 12 03389 g006
Figure 7. Inundation on Upolu in close-ups (10 m res.). The map shows the 10 m resolution run-up on Upolu (a) and in Apia (b), with the most severe inundation in Upolu close to Gagaifo’olevao (c).
Applsci 12 03389 g007
Figure 8. (a) Present-day buildings categories on Savai’i and Upolu. (b) Exposure of buildings in Savai’i and Upolu to the 1917 modelled scenario event. (c) Close up of Sala’ilua village on southwest Savai’i showing the modelled tsunami inundation and exposed buildings.
Applsci 12 03389 g008aApplsci 12 03389 g008b
Figure 9. Number of people affected in residential buildings in the six damage states on: (a) Upolu, and (b) Savai’i.
Applsci 12 03389 g009
Figure 10. Epicentres of the 1917 and 2009 earthquakes and corresponding extents at the coast that were predominantly affected by each respective tsunami according to the models. The red crosses indicate the 1917 runup benchmarks shown in Figure 5 and Figure 6 showing locations that should be inundated.
Applsci 12 03389 g010
Table 1. Summary of attributes represented in the building exposure data.
Primary AttributeSecondary AttributeMetric or Value
Construction FrameMasonry, Steel, Reinforced Concrete, TimberText
Usually Resident Population-Floating
Outline Area-m2
Use CategoryCommercial; Community; Education; Fale; Hotel, Resort; Industrial; Outbuilding; Religious; Residential Dwelling; Tourist FaleText
Table 2. Building fragility model parameters applied in this study.
Damage State (DS)Construction FrameDamage Description
TimberMasonryReinforced Concrete
μσμσμσ
DS0None-None
DS1Light-0.290.46-Non-structural damage only
DS2Minor-0.460.4-Significant non-structural and minor structural damage
DS3Moderate1.150.381.280.351.380.56Significant structural and non-structural damage
DS4Severe1.260.41.860.413.450.54Irreparable structural damage, will require demolition
DS5Collapse1.620.282.490.47.30.94Complete structural collapse
Publisher’s Note: MDPI stays neutral with regard to jurisdictional claims in published maps and institutional affiliations.

