
A Model for the Assessment of the Economic Benefits Associated with Energy Retrofit Interventions: An Application to Existing Buildings in the Italian Territory


Abstract
:1. Introduction
2. Background
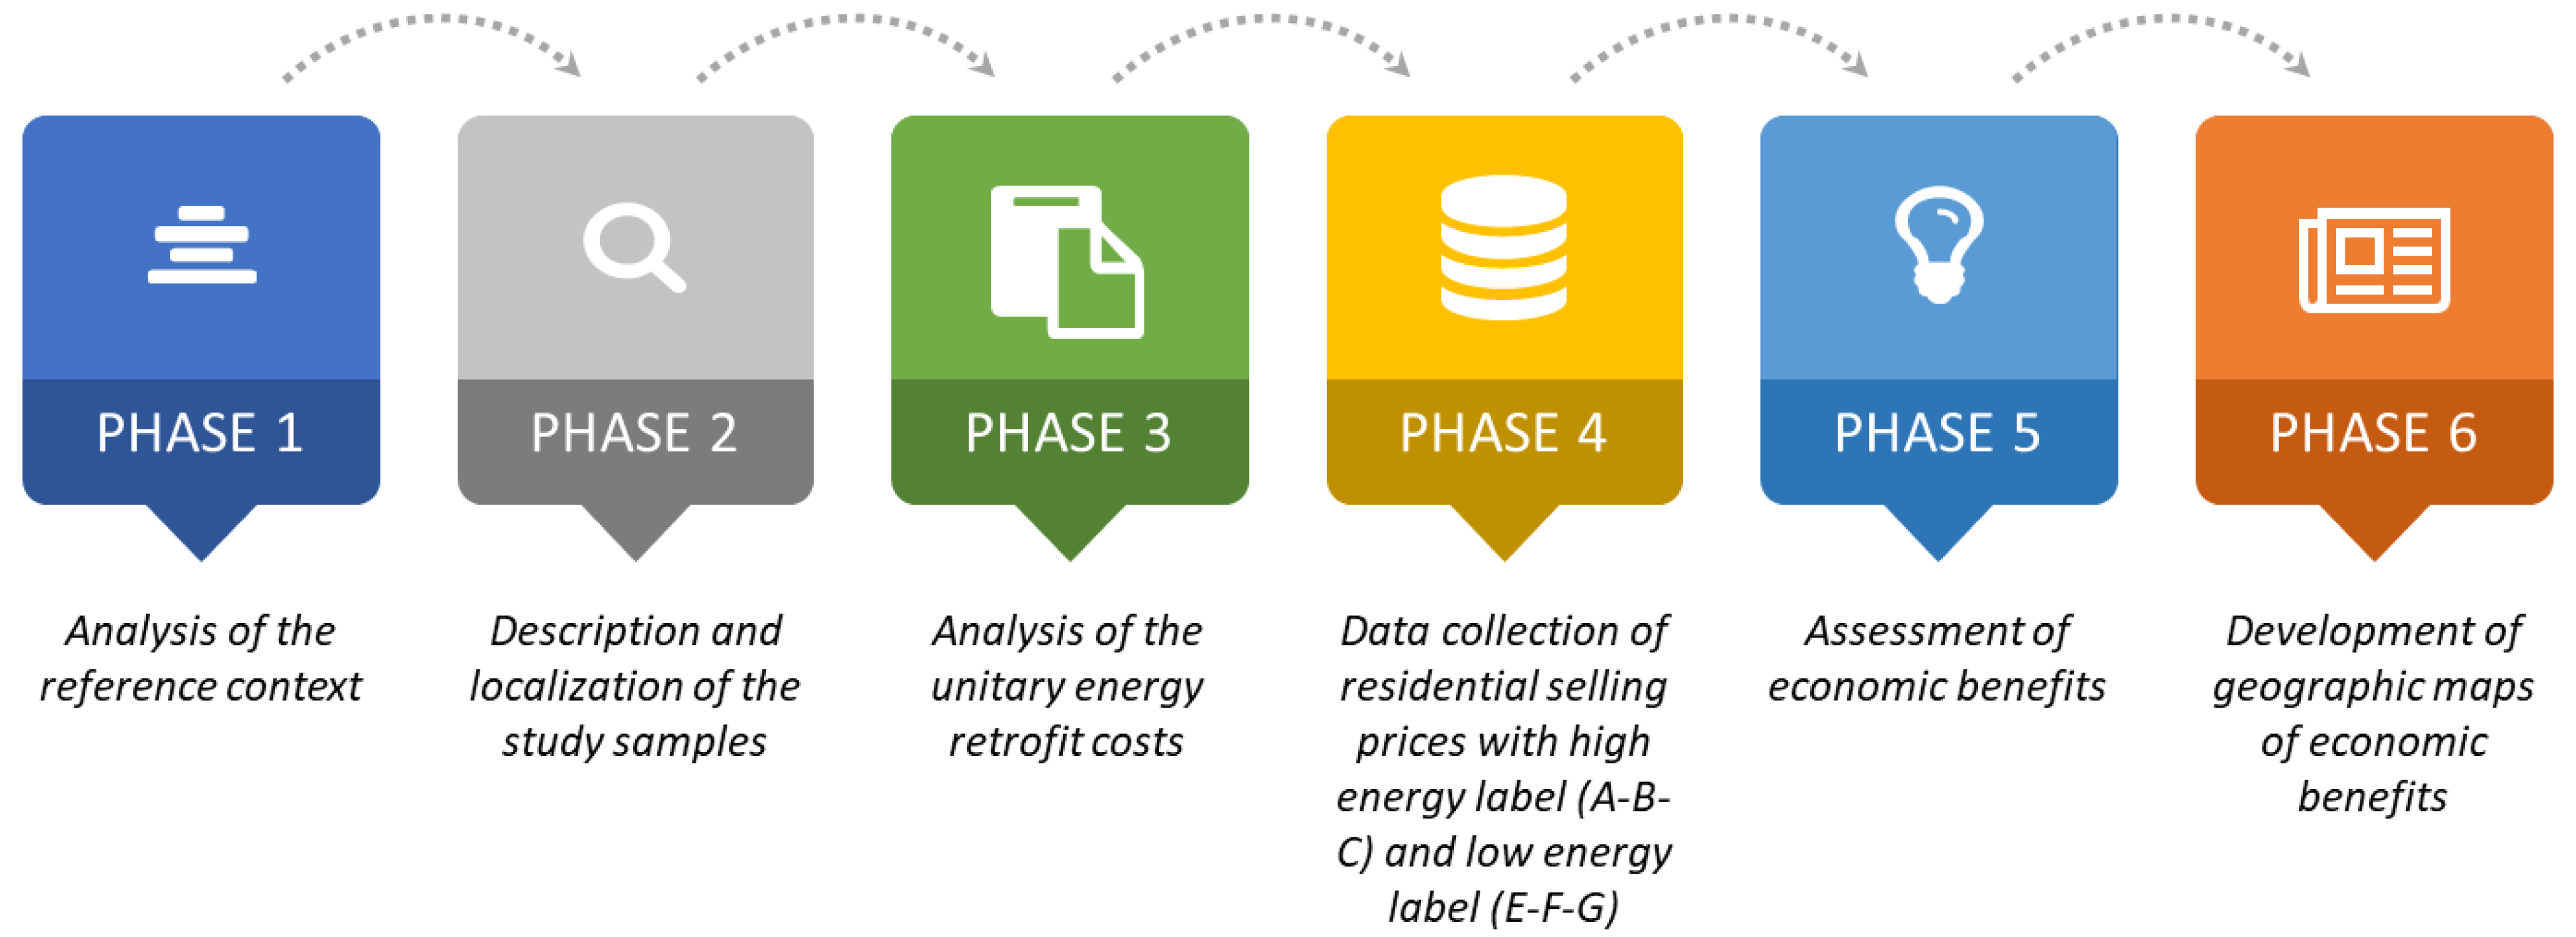
3. Methodology
- Phase 1—Analysis of the reference context
- Definition of the most frequent/common building typology;
- Identification of the average property internal area;
- Definition of the property constructive and functional factors.
- Phase 2—Description and localization of the study samples
- Determination of the urban areas (central, semi-central, and peripheral).
- Phase 3—Analysis of the unit energy retrofit costs
- Phase 4—Data collection of selling prices of properties with high energy label (“A”, “B”, and “C”) and low energy label (“E”, “F”, and “G”)
- Phase 5—Assessment of economic benefits
- Determination of the value differential between the post-energy intervention situation and ante-energy intervention situation;
- Evaluation of the break-even incentive.
- Phase 6—Development of geographical maps of economic benefits
- Convenience maps;
- Isoprofit maps.
4. Results and Discussion
4.1. Phase 1—Analysis of the Reference Context
4.1.1. Definition of the Most Common Building Typology
4.1.2. Identification of the Average Property Internal Area
4.1.3. Definition of the Property Constructive and Functional Factors
4.2. Phase 2—Description and Localization of the Study Samples
Determination of the Urban Areas (Central, Semi-Central, and Peripheral)
4.3. Phase 3—Analysis of the Unit Energy Retrofit Costs
4.4. Phase 4—Data Collection of Properties Selling Prices with High Energy Label (“A”, “B”, and “C”) and Low Energy Label (“E”, “F”, and “G”)
4.5. Phase 5—Assessment of Economic Benefits
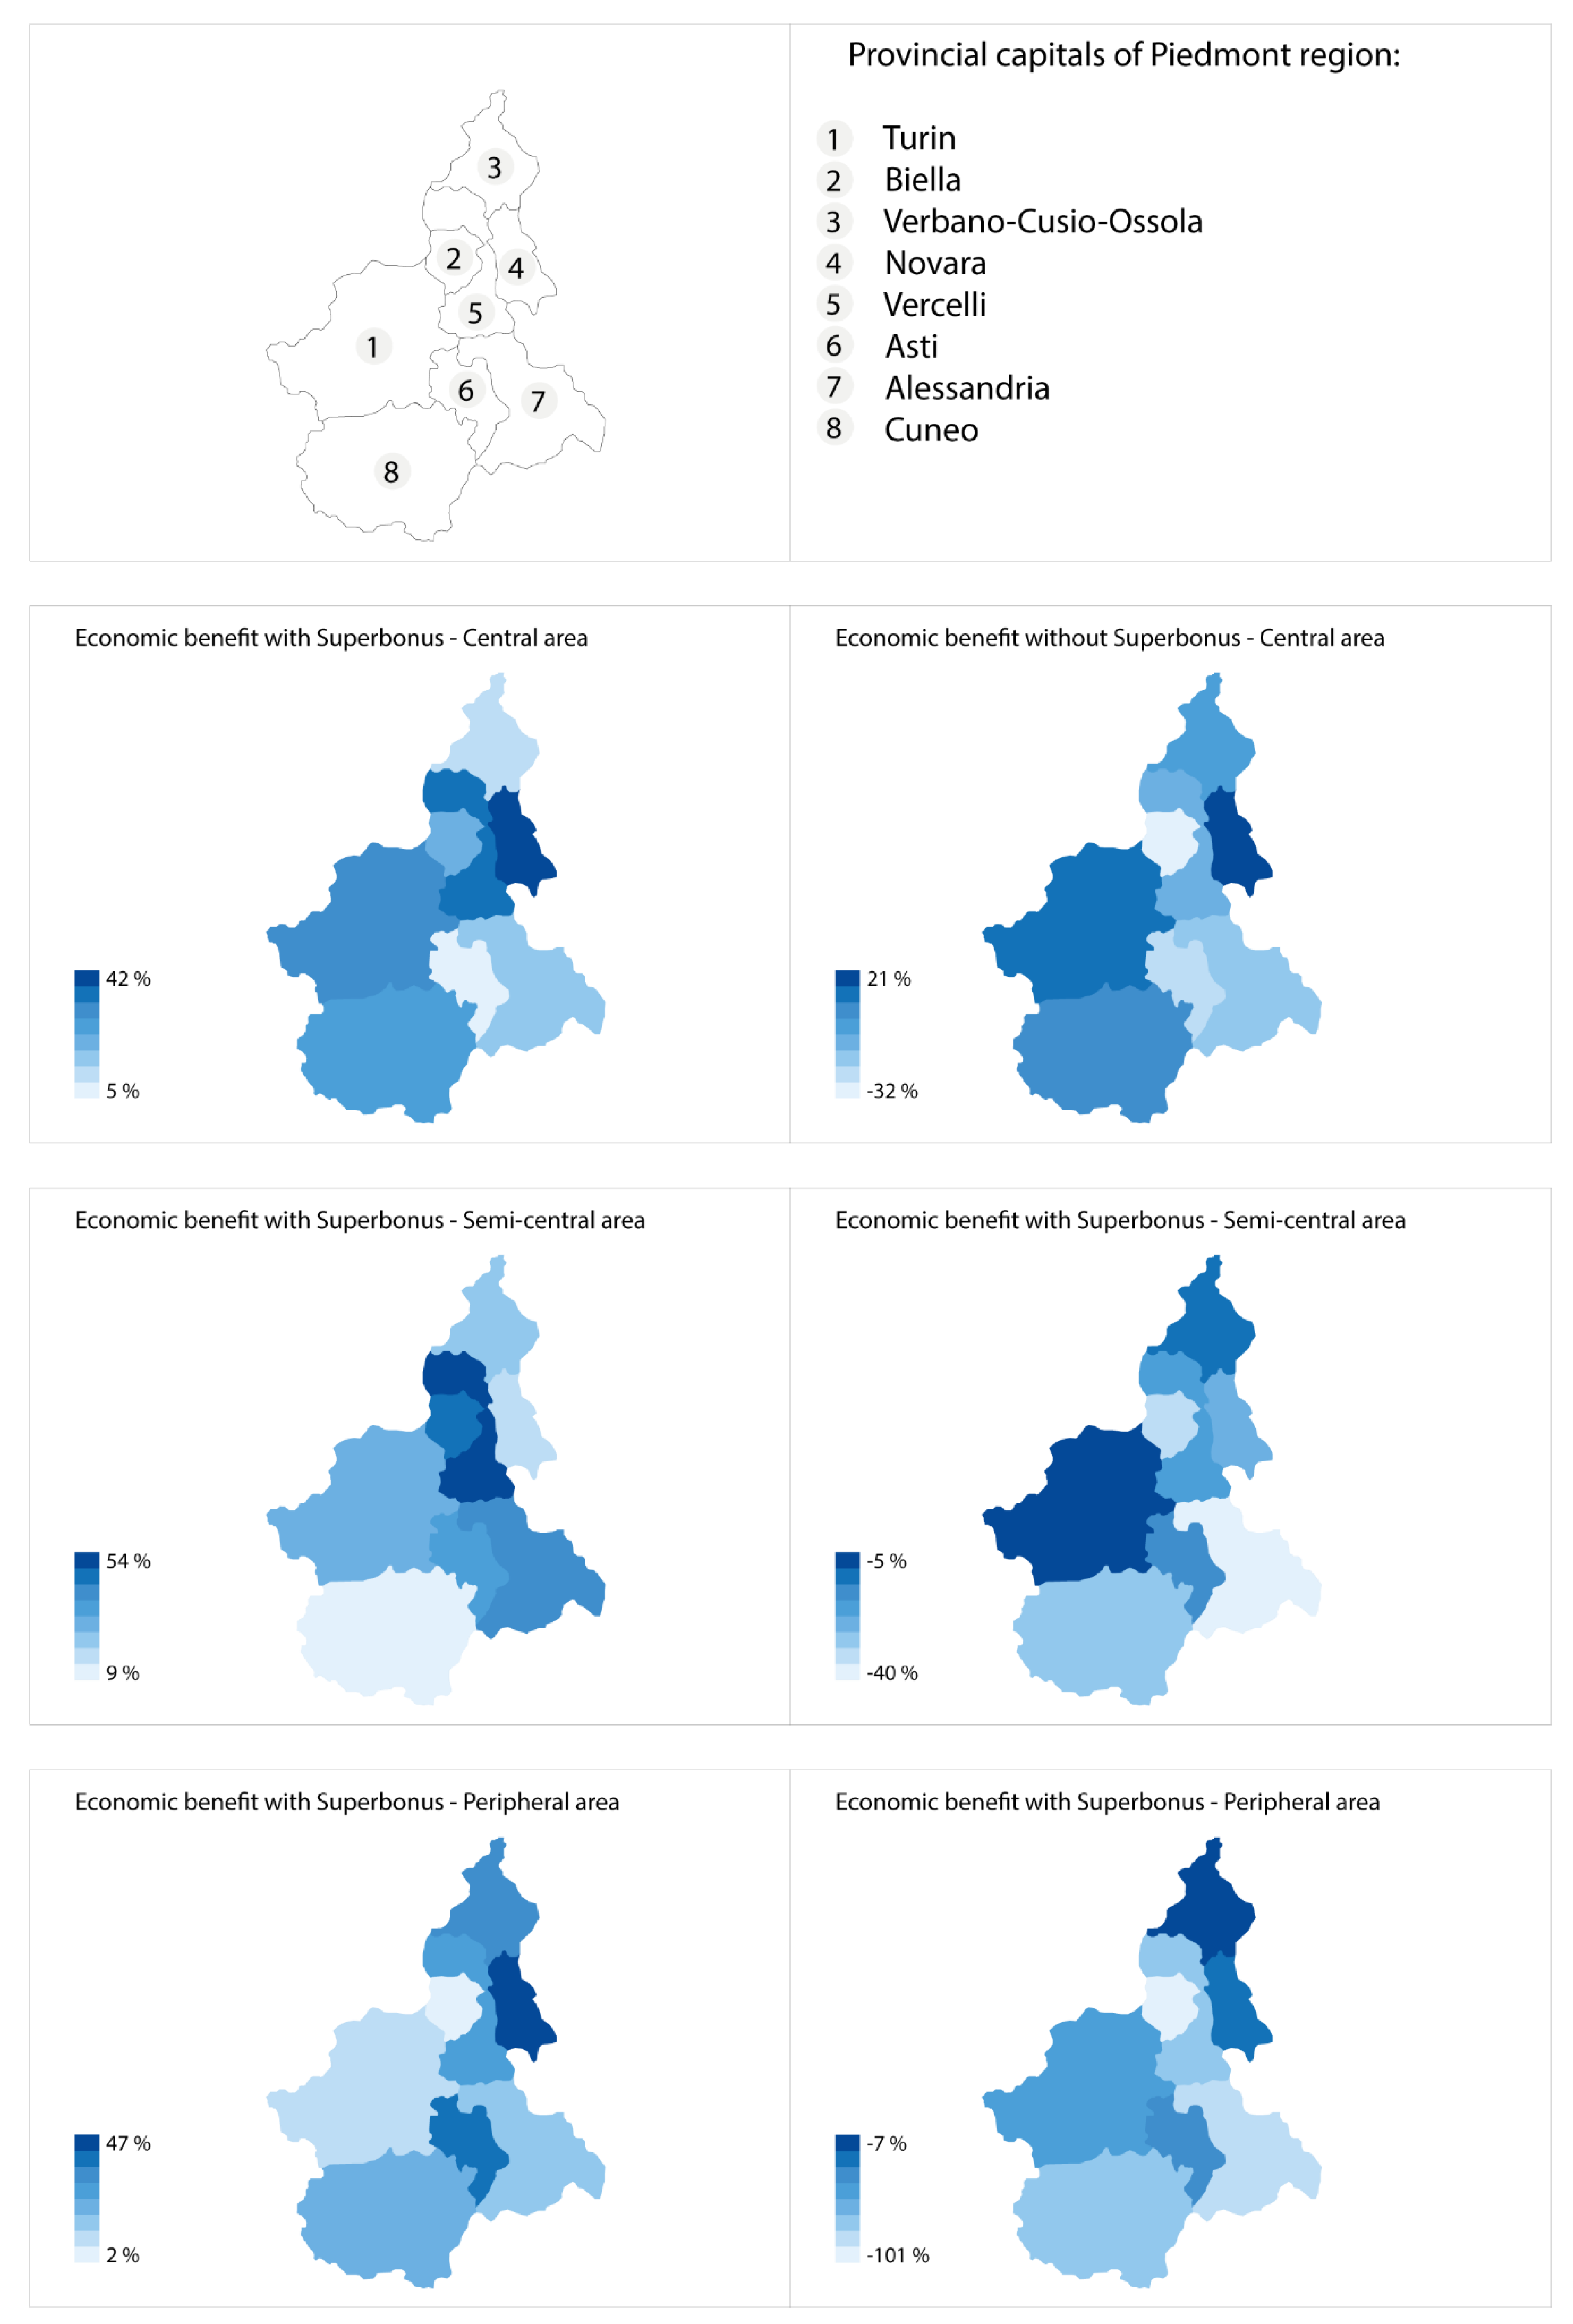
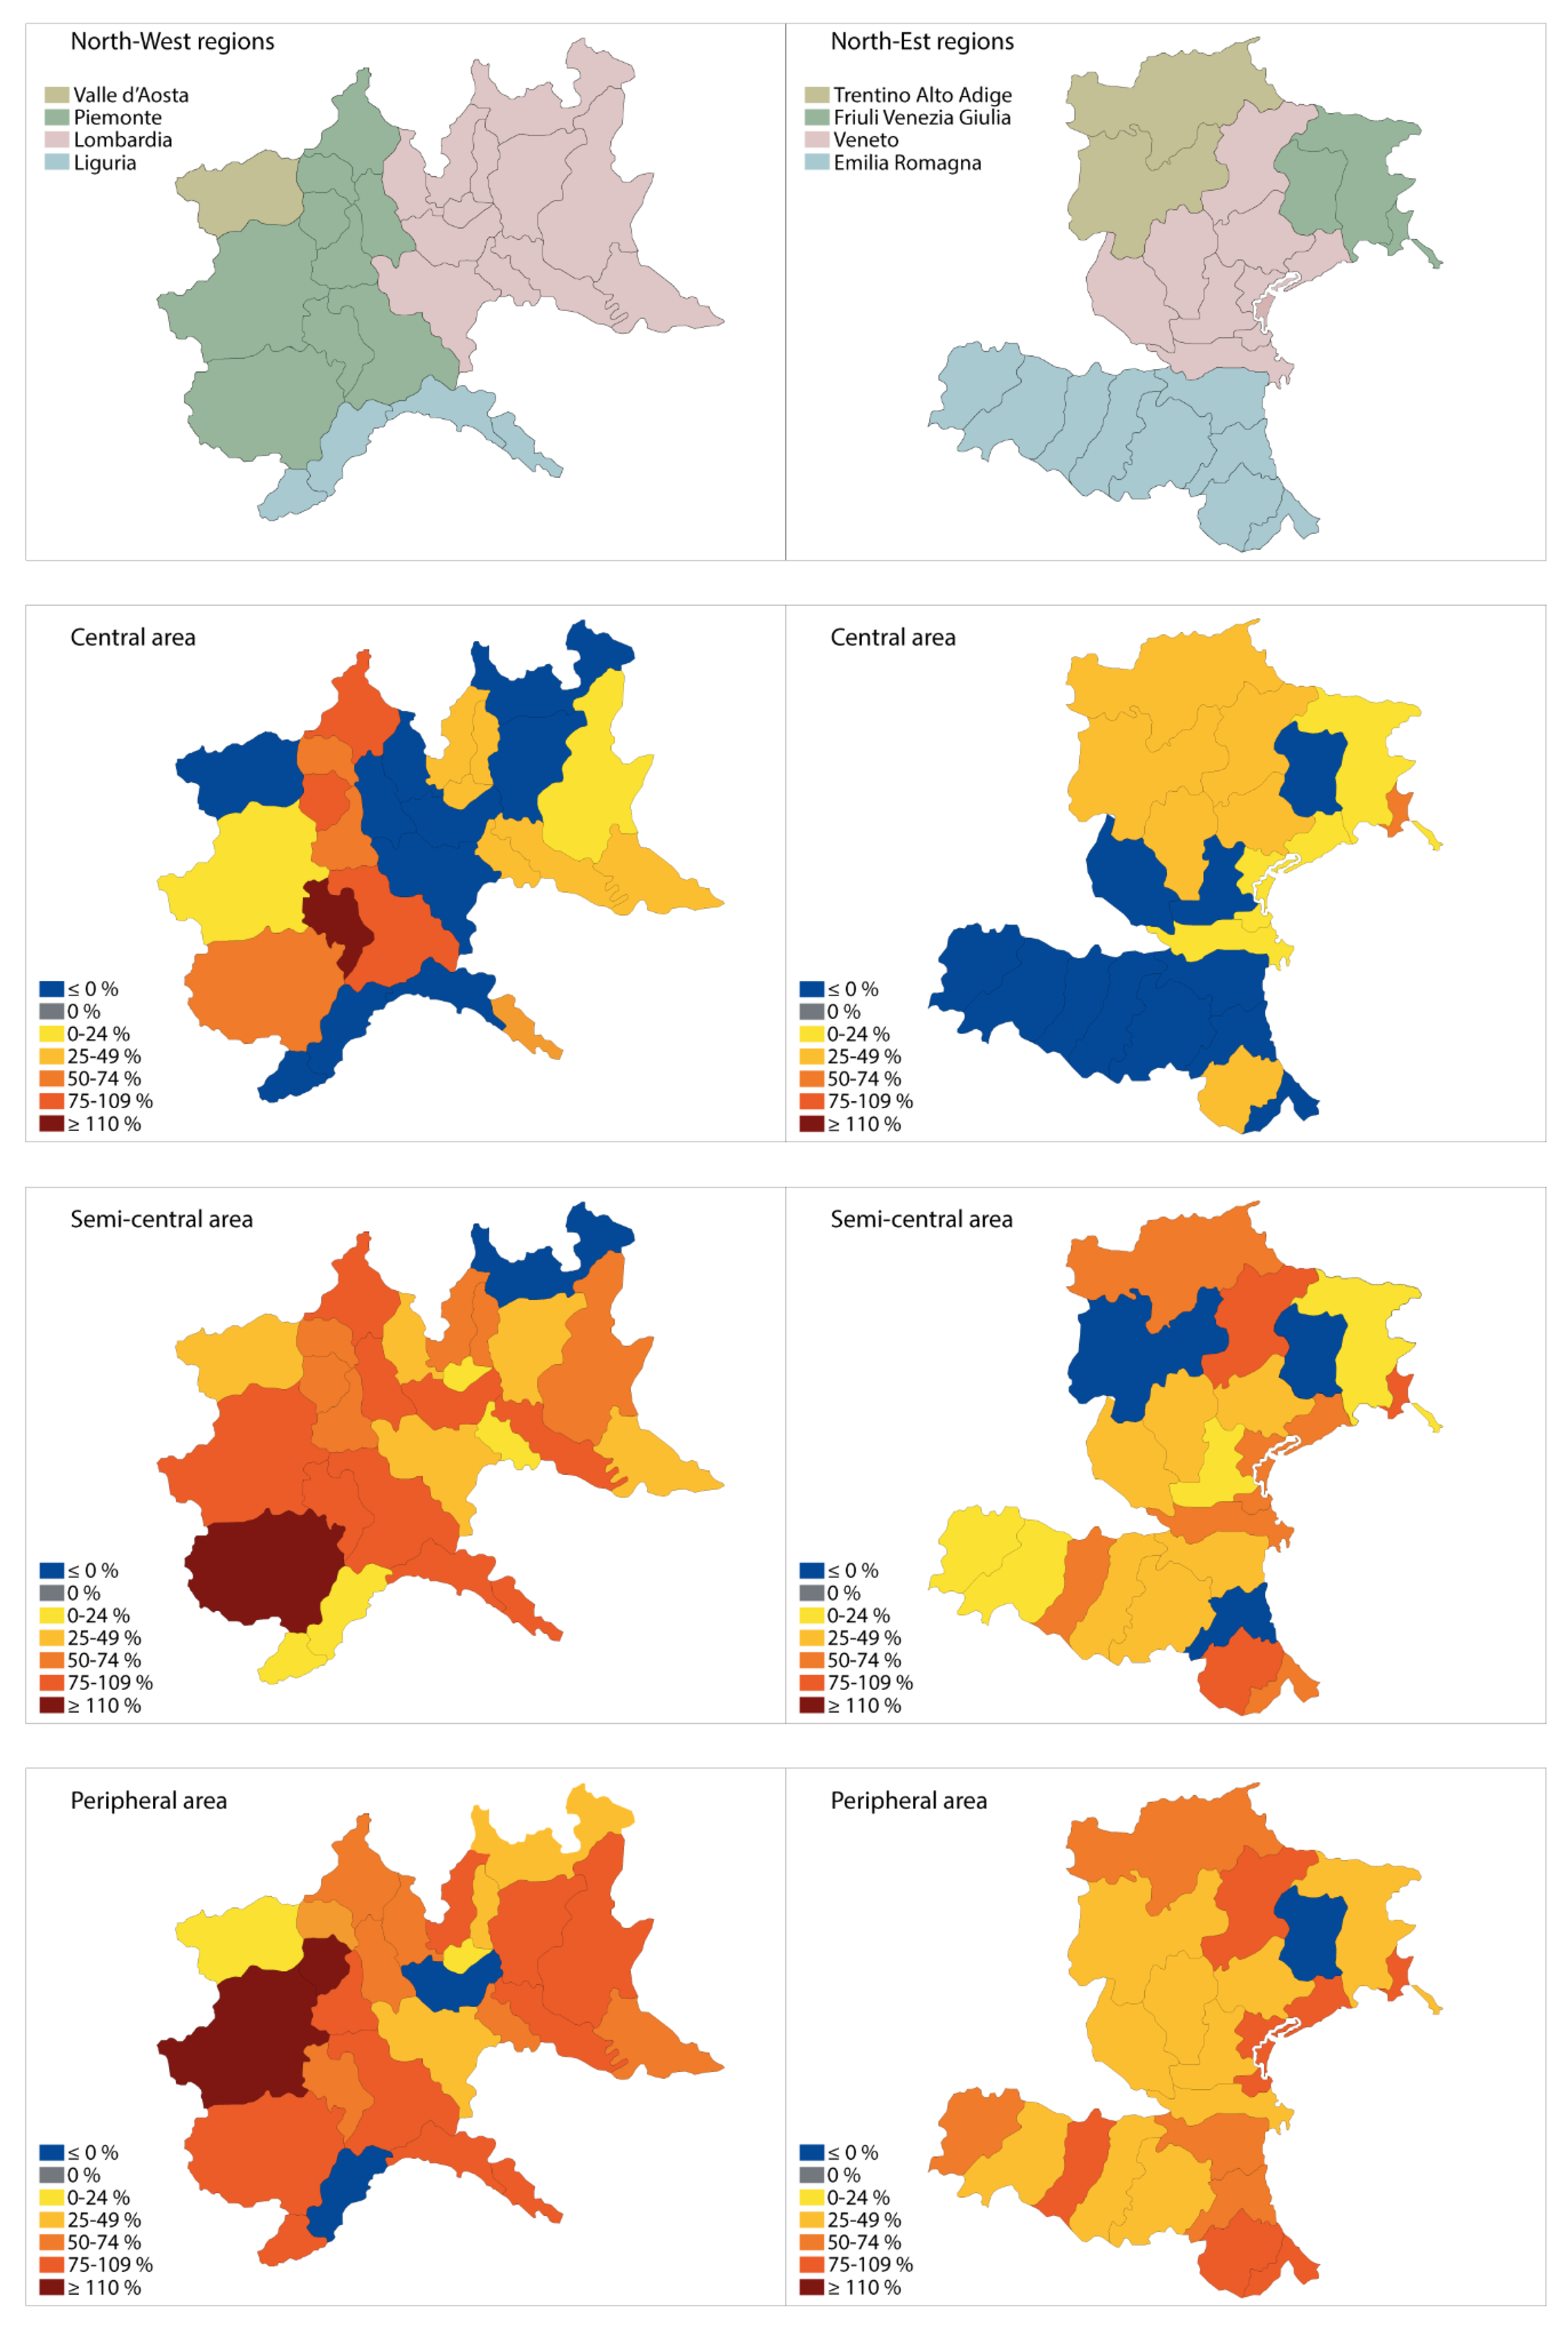
4.6. Phase 6—Development of Geographical Maps of Economic Benefits
4.6.1. Convenience Maps
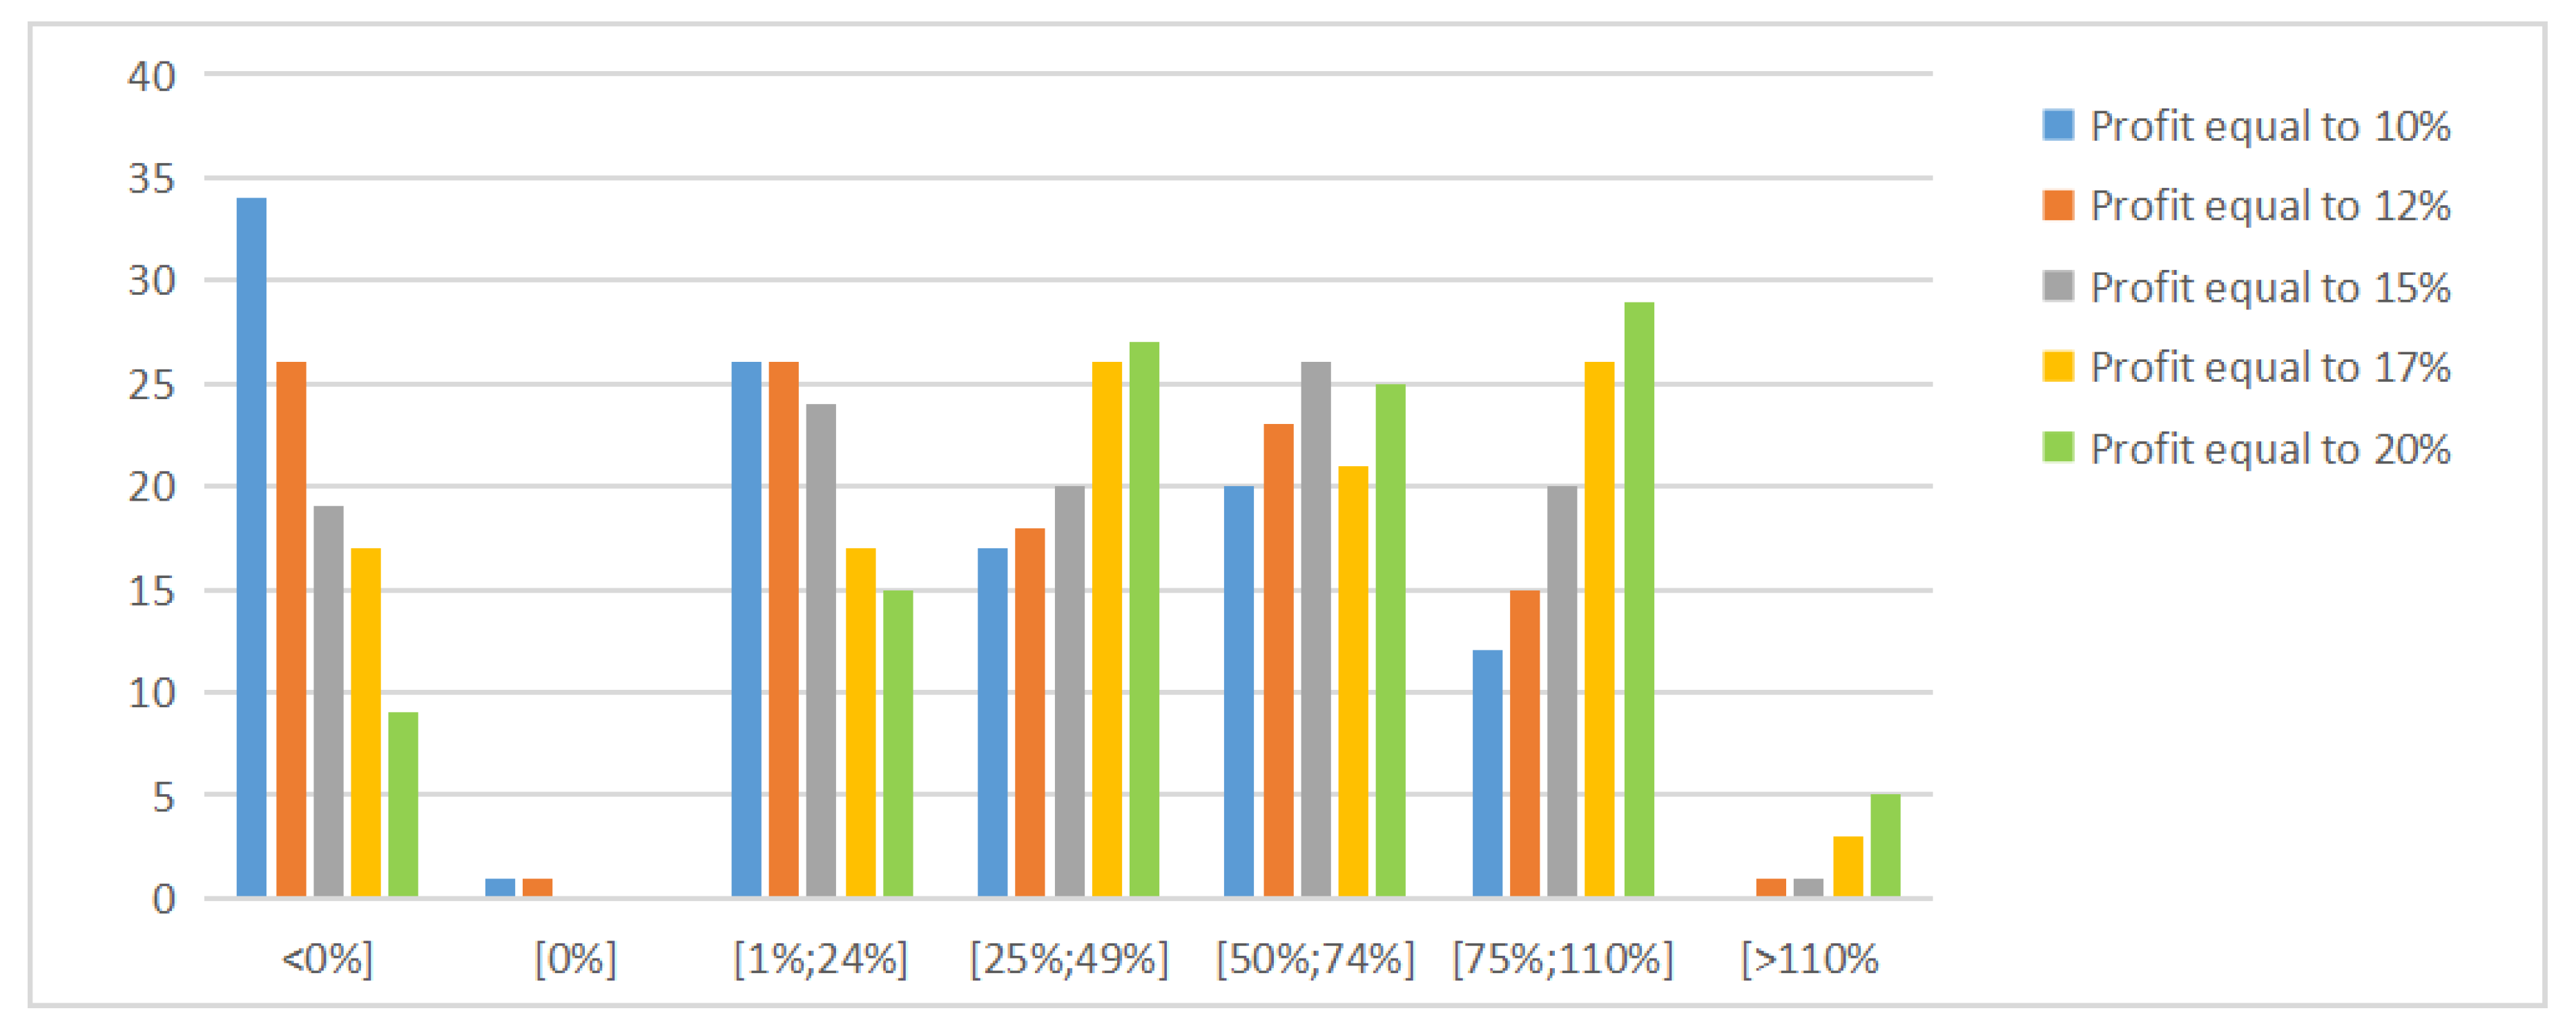
4.6.2. Isoprofit Maps
5. Conclusions
Supplementary Materials
Author Contributions
Funding
Institutional Review Board Statement
Informed Consent Statement
Conflicts of Interest
References
- National Statistics Institute (ISTAT). Available online: https://www.istat.it/ (accessed on 7 June 2021).
- European Environment Agency—EEA Trends and Projections in Europe 2020. Tracking Progress Towards Europe’s Climate and Energy Targets. 2020. Available online: https://www.eea.europa.eu/themes/climate/trends-and-projections-in-europe (accessed on 27 February 2021).
- European Commission. Directive 2002/91/EC of the European Parliament and of the Council of 16 December 2002 on the Energy Performance of Buildings. Off. J. Eur. Communities 2002, 12, 168–174. [Google Scholar]
- Morano, P.; Rosato, P.; Tajani, F.; Liddo, F.D. An analysis of the energy efficiency impacts on the residential property prices in the city of Bari (Italy). In Values and Functions for Future Cities; Springer: Cham, Switzerland, 2020; pp. 73–88. [Google Scholar]
- European Commission (EC). Financial Support for Energy Efficiency in Buildings. 2013. Available online: https://eur-lex.europa.eu/legal-content/EN/TXT/?uri=CELEX:52013SC0143 (accessed on 5 September 2021).
- United Nations. Agenda 2030. 2015. Available online: https://unric.org/it/agenda-2030/ (accessed on 12 March 2021).
- European Commission. Green Deal. Available online: https://ec.europa.eu/info/strategy/priorities-2019-2024/european-green-deal_it (accessed on 12 June 2021).
- Agenzia Nazionale per le Nuove Tecnologie, L’energia e lo Sviluppo Economico Sostenibile ENEA. Available online: https://www.enea.it (accessed on 2 March 2021).
- Camera dei Deputati. Il Recupero e la Riqualificazione Energetica del Patrimonio Edilizio: Una Stima Dell’impatto delle Misure di Incentivazione—Rapporto 2020; Associazione Nazionale Costruttori di Impianti: Rome, Italy, 2020; No. 32. [Google Scholar]
- Centro Ricerche Economiche, Sociologiche e di Mercato Nell’edilizia CRESME. Available online: http://www.cresme.it (accessed on 12 June 2021).
- Istituto Nazionale di Urbanistica. Available online: https://inu.it (accessed on 12 September 2021).
- Lavori Pubblici. Available online: https://lavoripubblici.it (accessed on 5 June 2021).
- Law Decree No. 34/2020. Misure Urgenti in Materia di Salute, Sostegno al Lavoro e All’economia, Nonché di Politiche Sociali Connesse All’emergenza Epidemiologica da COVID-19. Available online: https://www.gazzettaufficiale.it/eli/id/2020/05/19/20G00052/sg (accessed on 14 June 2021).
- Law Decree No. 296/2006. Disposizioni per la Formazione del Bilancio Annuale e Pluriennale Dello STATO (Legge Finanziaria 2007). Available online: https://www.gazzettaufficiale.it/eli/id/2007/01/11/07A00183/sg (accessed on 5 September 2021).
- Law Decree No. 1/2013. Incentivazione Della Produzione di Energia Termica da Fonti Rinnovabili ed Interventi di Efficienza Energetica di Piccole Dimensioni. Available online: https://www.gazzettaufficiale.it/eli/id/2013/01/02/12A13721/sg (accessed on 25 June 2021).
- Law Decree No. 192/2005. Attuazione della direttiva 2002/91/CE relativa al rendimento energetico nell’edilizia. Available online: https://www.gazzettaufficiale.it/eli/id/2005/09/23/005G0219/sg (accessed on 5 July 2021).
- Law Decree No.102/2014. Attuazione Della Direttiva 2012/27/UE Sull’efficienza Energetica, che Modifica le Direttive 2009/125/CE e 2010/30/UE e Abroga le Direttive 2004/8/CE e 2006/32/CE. Available online: https://www.gazzettaufficiale.it/eli/id/2014/07/18/14G00113/sg (accessed on 21 July 2021).
- Law Decree No.128/2016. Aggiornamento Della Disciplina per L’incentivazione di Interventi di Piccole Dimensioni per L’incremento Dell’efficienza Energetica e per la Produzione di Energia Termica da Fonti Rinnovabili. Available online: https://www.gazzettaufficiale.it/eli/id/2016/03/02/16A01548/sg (accessed on 18 July 2021).
- Law Decree No.104/2020. Misure Urgenti per il Sostegno e il Rilancio Dell’economia. Available online: https://www.gazzettaufficiale.it/eli/id/2020/08/14/20G00122/sg (accessed on 28 June 2021).
- Law Decree No. 246/2020. Requisiti Delle Asseverazioni per L’accesso alle Detrazioni Fiscali per la Riqualificazione Energetica degli Edifici—Cd. Ecobonus. Available online: https://www.gazzettaufficiale.it/eli/id/2020/10/05/20A05395/sg (accessed on 16 June 2021).
- Law Decree No. 178/2020. Bilancio di Previsione dello Stato per L’anno Finanziario 2021 e Bilancio Pluriennale per il Triennio 2021–2023. Available online: https://www.gazzettaufficiale.it/eli/id/2020/12/30/20G00202/sg (accessed on 5 May 2021).
- Law Decree No.63/2013. Disposizioni Urgenti per il Recepimento della Direttiva 2010/31/UE del Parlamento Europeo e del Consiglio del 19 Maggio 2010, Sulla Prestazione Energetica Nell’edilizia per la Definizione delle Procedure D’infrazione Avviate Dalla Commissione Europea, Nonché’ Altre Disposizioni in Materia di Coesione Sociale. Available online: https://www.gazzettaufficiale.it/eli/id/2013/06/05/13G00107/sg (accessed on 23 May 2021).
- Brounen, D.; Kok, N. On the economics of energy labels in the housing market. J. Environ. Econ. Manag. 2011, 62, 166–179. [Google Scholar] [CrossRef] [Green Version]
- Bloom, B.; Nobe, M.C.; Nobe, M.D. Valuing green home designs: A study of ENERGY STAR homes. J. Sustain. Real Estate 2011, 3, 109–126. [Google Scholar] [CrossRef]
- Kahn, M.; Kok, N. The capitalization of green labels in the California housing market. Reg. Sci. Urban Econ. 2014, 47, 25–34. [Google Scholar] [CrossRef]
- Deng, Y.; Li, Z.; Quigley, J.M. Economic Returns to Energy-Efficient Investments in the Housing Market: Evidence from Singapore. Reg. Sci. Urban Econ. 2012, 42, 506–515. [Google Scholar] [CrossRef] [Green Version]
- Walls, M.; Palmer, K.; Gerarden, T.; Bak, X.F. Is Energy Efficiency Capitalized into Home Prices? Evidence from Three US Cities. J. Environ. Econ. Manag. 2017, 82, 104–124. [Google Scholar] [CrossRef]
- Hyland, M.; Lyons, R.C.; Lyons, S. The value of domestic building energy efficiency—Evidence from Ireland. Energy Econ. 2013, 40, 943–952. [Google Scholar] [CrossRef] [Green Version]
- Laquatra, J.; Dacquisto, D.J.; Emrath, P.; Laitner, J.A. Housing market capitalization of energy efficiency revisited. In Summer Study on Energy Efficiency in Buildings; American Council for an Energy-Efficient Economy: Washington, DC, USA, 2002. [Google Scholar]
- Manganelli, B.; Mastroberti, M.; Vona, M. Evaluation of benefits for integrated seismic and energy retrofitting for the existing buildings. In International Symposium on New Metropolitan Perspectives; Springer: Cham, Switzerland, 2018; pp. 654–662. [Google Scholar]
- Manganelli, B.; Morano, P.; Tajani, F.; Salvo, F. Affordability assessment of energy-efficient building construction in Italy. Sustainability 2019, 11, 249. [Google Scholar] [CrossRef] [Green Version]
- Moschella, A.; Gagliano, A.; Lo Faro, A.; Mondello, A.; Salemi, A.; Sanfilippo, G. A methodology for an integrated approach for seismic and energy refurbishment of historic buildings in mediterranean area. Sustainability 2018, 10, 2448. [Google Scholar] [CrossRef] [Green Version]
- La Greca, P.; Margani, G. Seismic and Energy Renovation Measures for Sustainable Cities: A Critical Analysis of the Italian Scenario. Sustainability 2018, 10, 254. [Google Scholar] [CrossRef] [Green Version]
- Fregonara, E.; Giordano, R.; Rolando, D.; Tulliani, J.M. Integrating Environmental and Economic Sustainability in New Building Construction and retrofits. J. Urban Technol. 2016, 23, 3–28. [Google Scholar] [CrossRef]
- Roberts, S. Altering existing buildings in the UK. Energy Policy 2008, 36, 4482–4486. [Google Scholar] [CrossRef]
- Nair, G.; Gustavsson, L.; Mahapatra, K. Factors influencing energy efficiency investments in existing Swedish residential buildings. Energy Policy 2010, 38, 2956–2963. [Google Scholar] [CrossRef]
- Soares, N.; Bastos, J.; Pereira, L.D.; Gaspar, A. A review on current advances in the energy and environmental performance of buildings towards a more sustainable built environment. Renew. Sustain. Energy Rev. 2017, 77, 845–860. [Google Scholar] [CrossRef]
- Fuerst, F.; McAllister, P.; Nanda, A.; Wyatt, P. Energy performance ratings and house prices in Wales: An empirical study. Energy Policy 2016, 92, 20–33. [Google Scholar] [CrossRef]
- Schleich, J.; Gruber, E. Beyond case studies: Barriers to energy efficiency in commerce and the services sector. Energy Econ. 2008, 30, 449–464. [Google Scholar] [CrossRef]
- Bardhan, A.; Jaffee, D.; Kroll, C.; Wallace, N. Energy efficiency retrofits for U.S. housing: Removing the bottlenecks. Reg. Sci. Urban Econ. 2014, 47, 45–60. [Google Scholar] [CrossRef] [Green Version]
- Cirami, S.; Evola, G.; Gagliano, A.; Margani, G. Thermal and Economic Analysis of Renovation Strategies for a Historic Building in Mediterranean Area. Buildings 2017, 7, 60. [Google Scholar] [CrossRef]
- Eichholtz, P.; Nils, M.A.; Kok, N.; Quigley, J.M. Doing Well by Doing Good: Green Office Buildings. Am. Econ. Rev. 2010, 100, 2492–2509. [Google Scholar] [CrossRef] [Green Version]
- Eichholtz, P.; Kok, N.; Quigley, J.M. The economics of green building. Rev. Econ. Stat. 2013, 95, 50–63. [Google Scholar] [CrossRef]
- Fuerst, F.; McAllister, P. Green Noise or Green Value? Measuring the Effects of Environmental Certification on Office Values. Real Estate Econ. 2011, 39, 45–69. [Google Scholar] [CrossRef]
- International Energy Agency—IEA Report: Building Energy Performance Metrics. 2019. Available online: https://iea.org (accessed on 14 June 2021).
- Johnson, R.C.; Kaserman, D.L. Housing Market Capitalization of Energy-Saving Durable Good Investments. Econ. Inq. 1983, 21, 374–386. [Google Scholar] [CrossRef]
- Dinan, T.M.; Miranowski, J.A. Estimating the Implicit Price of Energy Efficiency Improvements in the Residential Housing Market: A Hedonic Approach. J. Urban Econ. 1989, 25, 52–67. [Google Scholar] [CrossRef]
- Nevin, R.; Watson, G. Evidence of rational market valuations for home energy efficiency. Apprais. J. 1998, 4, 401–409. [Google Scholar]
- Kholodilin, K.A.; Mense, A.; Michelsen, C. The market value of energy efficiency in buildings and the mode of tenure. Urban Stud. 2017, 54, 3218–3238. [Google Scholar] [CrossRef]
- Benzar, B.E.; Park, M.; Lee, H.S.; Yoon, I.; Cho, J. Determining retrofit technologies for building energy performance. J. Asian Archit. Build. Eng. 2020, 19, 367–383. [Google Scholar] [CrossRef] [Green Version]
- Bramono, N.T.; Kim, A.; Berawi, M.A. A preliminary framework for expediting energy efficiency retrofits (EERs) using alternative financing in Indonesian cities. CSID J. Infrastruct. Dev. 2018, 2, 50. [Google Scholar] [CrossRef] [Green Version]
- Choi, J.; Shin, J.; Kim, M.; Kim, I. Development of openBIM-based energy analysis software to improve the interoperability of energy performance assessment. Autom. Constr. 2016, 72, 52–64. [Google Scholar] [CrossRef]
- Seek, N.H. Adjusting housing consumption: Improve or Move. Urban Stud. 1983, 20, 455–469. [Google Scholar] [CrossRef]
- Knigh, J.R.; Miceli, T.; Sirmans, C.F. Repair expenses, selling contracts, and house prices. J. Real Estate Res. 2000, 20, 323–336. [Google Scholar] [CrossRef]
- Bogin, A.; Doerner, W.; Larson, W.D. Local house price dynamics: New indices and stylized facts. Real Estate Econ. 2019, 47, 365–398. [Google Scholar] [CrossRef] [Green Version]
- Kaklauskas, A.; Zavadskas, E.; Raslanas, S. Multivariant design and multiple criteria analysis of building refurbishments. Energy Build. 2005, 37, 361–372. [Google Scholar] [CrossRef]
- Mudgal, S.; Lyons, L.; Cochen, F. Energy Performance Certificates in Buildings and Their Impact on Transaction Prices and Rents in Selected EU Countries. Bio Intelligence Service Working Paper. 2013. Available online: https://ec.europa.eu/energy/sites/ener/files/documents/20130619-energy_performance_certificates_in_buildings.pdf (accessed on 15 June 2021).
- Cajias, M.; Piazolo, D. Green performs better: Energy efficiency and financial return on buildings. J. Corp. Real Estate 2013, 15, 53–72. [Google Scholar] [CrossRef]
- Fuerst, F.; McAllister, P.; Nanda, A.; Wyatt, P. Does energy efficiency matter to home-buyers? An investigation of EPC ratings and transaction prices in England. Energy Econ. 2015, 48, 145–156. [Google Scholar] [CrossRef] [Green Version]
- Banfi, S.; Farsi, M.; Filippini, M.; Jakob, M. Willingness to pay for energy saving measures in residential buildings. Energy Econ. 2008, 30, 503–516. [Google Scholar] [CrossRef] [Green Version]
- Evangelista, R.; Ramalho, E.A.; Silva, J.A. On the use of hedonic regression models to measure the effect of energy efficiency on residential property transaction prices: Evidence for Portugal and selected data issues. Energy Econ. 2020, 86, 104699. [Google Scholar] [CrossRef] [Green Version]
- Bottero, M.; Bravi, M. Valuing benefits from building energy saving: An econometric approach, GEAM. Geoing. Ambient. E Min. 2014, 143, 15–24. [Google Scholar]
- Morano, P.; Tajani, F.; Di Liddo, F.; Guarnaccia, C. The value of the energy retrofit in the Italian housing market: Two case-studies compared. WSEAS Trans. Bus. Econ. 2018, 15, 249–258. [Google Scholar]
- Australian Bureau of Statistics. Energy Efficiency Rating and House Prices in the ACT, Report; Department of the Environment, Water, Heritage and Arts: Canberra, Australia, 2008.
- Kahn, M.E.; Kok, N. The Value of Green Labels in the Californian Housing Market; Working Paper; U.S. Green Building Council: Washington, DC, USA, 2012. [Google Scholar]
- Addae-Dapaah, K.; Chieh, S.J. Green mark certification: Does the market understand? J. Sustain. Real Estate 2011, 3, 162–191. [Google Scholar] [CrossRef]
- Cresme Riscerche SpA; CNAPPC. Chi ha Progettato L’italia? Ruolo Dell’architettura Nella Qualità del Paesaggio Edilizio Italiano; CNAPPC: Genoa, Italy, 2017. [Google Scholar]
- 8milaCensus—ISTAT. Available online: https://ottomilacensus.istat.it (accessed on 14 June 2021).
- Italian Revenue Agency. Available online: https://agenziaentrate.gov.it (accessed on 5 June 2021).
- Italian Revenue Agency; Real Estate Market Observatory (OMI). Rapporto immobiliare 2019. Il Settore Residenziale. Available online: https://www.agenziaentrate.gov.it/portale/documents/20143/263076/rapporto+immobiliare2019+ri_RI2019_Residenziale_20190523.pdf/a175f856-2363-dda7-da64-b1c0e544eb12 (accessed on 19 July 2021).
- Italian Revenue Agency; Real Estate Market Observatory (OMI). OMI—Agenzia delle Entrate (2020). Rapporto Immobiliare 2020. Il Settore Residenziale. Available online: https://www.agenziaentrate.gov.it/portale/documents/20143/263076/RI2020_20200521_Residenziale.pdf/40fee96c-49ad-6edb-e36b-1f54ff623b12 (accessed on 2 July 2021).
- Anelli, D.; Sica, F. The financial feasibility analysis of urban transformation projects: An application of a quick assessment model. In International Symposium on New Metropolitan Perspectives; Springer: Cham, Switzerland, 2020; pp. 462–474. [Google Scholar]
- Locurcio, M.; Tajani, F.; Morano, P.; Anelli, D. A multi-criteria decision analysis for the assessment of the real estate credit risks. In Appraisal and Valuation; Springer: Cham, Switzerland, 2021; pp. 327–337. [Google Scholar]


| Prototype Constructive and Functional Factors | |
|---|---|
| Building typology | Multi-story residential building |
| Construction typology | Reinforced concrete |
| Floor levels | Four |
| Presence of elevator | YES |
| Build quality | Medium |
| Presence of basement | NO |
| Accessibility | Normal |
| Maximum and Miminum Value Differentials | ||||||
|---|---|---|---|---|---|---|
| Macro-Area | Central Area | Semi-Central Area | Peripheral Area | |||
| Maximum Value | Minimum Value | Maximum Value | Minimum Value | Maximum Value | Minimum Value | |
| North-Western Italy | Imperia 56% | Biella −32% | Sondrio 33% | Alessandria −40% | Milan 37% | Biella −101% |
| North-East Italy | Pordenone 45% | Gorizia −18% | Pordenone 49% | Gorizia −41% | Pordenone 29% | Gorizia −56% |
| Central Italy | Macerata 59% | Ascoli Piceno −5% | Macerata 69% | Ascoli Piceno −6% | Pesaro e Urbino 43% | Rieti −47% |
| Southern Italy | Taranto 55% | Catanzaro −36% | Bari 43% | Vibo Valentia −31% | Bari 26% | Chieti −42% |
| Islands | Nuoro 52% | Ragusa −37% | Cagliari 38% | Trapani −47% | Palermo 23% | Medio Campidano −66% |
| Minimum and Maximum Positive Break-Even Incentive Value | ||||||
|---|---|---|---|---|---|---|
| Macro-Area | Central Area | Semi-Central Area | Peripheral Area | |||
| Minimum Value | Maximum Value | Minimum Value | Maximum Value | Minimum Value | Maximum Value | |
| North-Western Italy | La Spezia 15% | Asti 125% | Imperia 13% | Cuneo 119% | Monza e Brianza 11% | Turin 113% |
| North-East Italy | Venice 4% | Gorizia 65% | Piacenza 2% | Belluno 89% | Treviso 26% | Reggio Emilia 96% |
| Central Italy | Fermo 1% | Ascoli Piceno 78% | Fermo 4% | Ascoli Piceno 61% | ROME 10% | Rieti 97% |
| Southern Italy | Salerno 7% | Catanzaro 111% | Brindisi 21% | Vibo Valentia 90% | Lecce 3% | Vibo Valentia 91% |
| Islands | Olbia-Tempio 14% | Sassari 77% | Nuoro 7% | Trapani 102% | Agrigento 12% | Caltanissetta 122% |
Publisher’s Note: MDPI stays neutral with regard to jurisdictional claims in published maps and institutional affiliations. |
© 2022 by the authors. Licensee MDPI, Basel, Switzerland. This article is an open access article distributed under the terms and conditions of the Creative Commons Attribution (CC BY) license (https://creativecommons.org/licenses/by/4.0/).
Share and Cite
Tajani, F.; Morano, P.; Di Liddo, F.; Doko, E. A Model for the Assessment of the Economic Benefits Associated with Energy Retrofit Interventions: An Application to Existing Buildings in the Italian Territory. Appl. Sci. 2022, 12, 3385. https://doi.org/10.3390/app12073385
Tajani F, Morano P, Di Liddo F, Doko E. A Model for the Assessment of the Economic Benefits Associated with Energy Retrofit Interventions: An Application to Existing Buildings in the Italian Territory. Applied Sciences. 2022; 12(7):3385. https://doi.org/10.3390/app12073385
Chicago/Turabian StyleTajani, Francesco, Pierluigi Morano, Felicia Di Liddo, and Endriol Doko. 2022. "A Model for the Assessment of the Economic Benefits Associated with Energy Retrofit Interventions: An Application to Existing Buildings in the Italian Territory" Applied Sciences 12, no. 7: 3385. https://doi.org/10.3390/app12073385
APA StyleTajani, F., Morano, P., Di Liddo, F., & Doko, E. (2022). A Model for the Assessment of the Economic Benefits Associated with Energy Retrofit Interventions: An Application to Existing Buildings in the Italian Territory. Applied Sciences, 12(7), 3385. https://doi.org/10.3390/app12073385