Article

Risk Assessment of Artifact Degradation in a Museum, Based on Indoor Climate Monitoring—Case Study of “Poni-Cernătescu” Museum from Iași City

1
Doctoral School of Geosciences, Faculty of Geography and Geology, “Alexandru Ioan Cuza” University, 22 Carol I Bulevard, 700506 Iași, Romania
2
Department of Geography, Faculty of Geography and Geology, “Alexandru Ioan Cuza” University, 22 Carol I Bulevard, 700506 Iași, Romania
3
Faculty of Architecture G. M. Cantacuzino, “Gheorghe Asachi” Technical University of Iași, Prof. Dr. D. Mangeron Street, 700050 Iași, Romania
4
Academy of Romanian Scientists (AORS), 54 Splaiul Independenței St., Sector 5, 050094 Bucharest, Romania
5
National Institute for Research and Development in Environmental Protection, 294 Splaiul Independenței, 6th District, 060031 Bucharest, Romania
6
Science Departament, Interdisciplinary Research Institute, “Alexandru Ioan Cuza” University, 11 Carol I Bulevard, 700506 Iași, Romania
7
Romanian Inventors Forum, 3 Sf. PetruMovilă St., L11, III/3, 700089 Iași, Romania
8
“Ștefan Procopiu” Museum of Science and Technology Director, “Moldova” National Museums Complex, 1 Piața Ștefancel Mare și Sfânt, 700028 Iași, Romania
*
Authors to whom correspondence should be addressed.
Appl. Sci. 2022, 12(7), 3313; https://doi.org/10.3390/app12073313
Submission received: 24 February 2022 / Revised: 17 March 2022 / Accepted: 21 March 2022 / Published: 24 March 2022
(This article belongs to the Section Materials Science and Engineering)

Abstract

:

Featured Application

The study presents a methodology to assess the risk of degradation for artifacts in a museum using indoor meteorological observations.

Abstract

Preservation of the cultural heritage of museums includes measures to prevent degrading effects induced by air temperature and humidity factors which are difficult to control. The present paper includes a synopsis of values of air temperature and relative humidity characterizing the indoor climate of the “Poni-Cernătescu” Museum of Iași, Romania for a period of one year. The objective of this research was to describe the museum microclimate and to identify and analyze the degradation risk of museum artifacts in order to study the impact of hygrothermal indoor and outdoor loads on indoor microclimate parameters. To achieve the objective, the following activities were carried out: acquisition of data on the relative humidity and the temperature of indoor and outdoor air; analysis of data with climate analysis tools and statistical methods; and transformation of data into quantitative and qualitative numerical measures of collection decay risks. The collected data enabled us to accurately describe the indoor climate conditions of the analyzed building. The main conclusions of the assessment were that the May–July period represented the interval with the highest degradation risk for all types of cultural assets (wood, leather, photos and paintings); this occurred because of the combination of a high amount of water vapor and high air temperature conditions. Based on charts and tabular data, this study presents the evolution of two parameters of internal microclimate, air temperature and relative humidity, and their correlation with external climate factors. The structural and functional parameters of the museum, the working levels of heating and air conditioning systems, the arrangement, the load, and the typological complexity of the artifacts displayed, were also considered in the analysis. The results obtained enabled us to develop useful recommendations to stabilize climate conditions inside the museum. Specific measures to mitigate the detrimental impact of the analyzed environmental factors are proposed. The results obtained show that in the basement, favorable conditions for mycelium growth occurred. In the summer months, across the entire museum space, the preservation indices were the lowest, from 20 to 25, so suitable conditions for storing the artifacts were not met.

1. Introduction

Preventive preservation of cultural assets in museums represents an important topic in the field of integrative scientific conservation [1,2,3,4,5] and incorporates indirect actions on the environment around cultural objects in order to avoid damaging processes and to increase their lifespan [6,7]. The main environmental factor in museums is the museum’s indoor microclimate, which consists of all changes in air temperature and moisture characteristics, natural and artificial lighting, gas, and particles of matter present in rooms [8,9,10,11]. These elements can have a great impact on the optimal maintenance of cultural assets over an extended period. However, Verticchio et al. consider that pollutants do not generally represent a significant threat to the overall rate of chemical degradation, as their concentrations are small” [12] in museums or libraries, and that temperature and moisture contribute the most to the deterioration of the materials from which the cultural artifacts are made. The monitoring of indoor and outdoor climate conditions in a museum to reduce the environmental risk [13] can facilitate the accomplishment of the three important roles of a museum: providing public access to cultural assets, preserving them, and restoring the cultural assets in order to make them available for research [11,12]. Many studies have been carried out to establish the peculiarities of the museum microclimate, with a view to ameliorating their indoor microclimatic conditions [14,15,16,17,18,19].
Fabbri [9] proposed that a monitoring campaign to study historic climate should take a minimum of 12 months, or a shorter period if monitoring is used to calibrate building simulation.
For preservation purposes, air temperature (T) is highly important since increase in molecular vibrations is considered the cause of the exponential increase in decomposition reaction processes according to the theory of chemical kinetics. Change in air temperature also determines phase modifications of materials since atoms reorganize their relative positions in order to adapt to higher vibrations at higher temperature [15]. A wider temperature range of various materials causes shearing stress on objects made from laminated materials, such as paintings, veneered furniture and film [15,19,20,21]. Air moisture is also known as hygroscopic moisture since it is adsorbed by organic or inorganic materials until a balance is reached. Hygroscopic moisture represents the amount of water vapor in a volume of air, and is also referred to as absolute humidity [13,19].
Relative humidity (RH) is expressed as a percentage and represents the ratio between the absolute humidity in the air and the maximum possible amount for the observed temperature. For several classes of objects which contain hygroscopic material (such as canvas, textiles, ethnographical objects or animal glue), a stable RH is needed (40–60%), and a stable air temperature (16–25 °C), with fluctuations of no more than ±10% RH over 24 h [22].
More sensitive objects need more specific and closer RH control depending on the composing materials, the state and the age of the cultural object [23,24]. Atmospheric pollutants, such as nitrogen or sulfur oxides, are absorbed in the structure of artifacts, reacting with humidity, leading to in situ formation of acids [25,26,27]. Generally, for most materials, a climate with lower RH (but not below 40%), moderate air temperature and lower lighting are ideal.
Saraiva et al. [28] performed a simulation of the hygrothermal behavior of a historic building in Portugal using EnergyPlus, which they validated with data obtained from a campaign to monitor the conditions of the microclimate. They analyzed fluctuations in the temperature and humidity of the indoor air relative to a performance index with the aim of making recommendations for the climate control system. Zarzo et al. [15] analyzed the temperature fluctuations with IoT (Internet of Things) technology to assess the potential risk for the preservation of cultural artifacts.
Grygierek et al., in their work [23], focused on assessing the impact of variable outdoor and indoor loads on the T and RH of indoor air in three museums from a temperate climate. They found that T and RH values were both above and below the recommended range. Bienvenido-Huertas et al. [24] analyzed the internal climate of a historical building located in a warm climate. The authors used artificial intelligence (multilayer perceptrons) to predict the influence of climate change on the indoor microclimate. For the characterization of the internal climate, they used a performance index (PI) complemented with a variance indicator. The results showed that the most suitable preservation strategies were the dehumidification and cooling of the space where the cultural artifacts were exhibited. The energy efficiency of the air conditioning system in heritage buildings is of particular importance and has been studied by a number of authors, of which we particularly mention Asfahan et al. [29] and Țurcanu et al. [30]. In Table 1 we present references for different types of artifacts.
The Romanian national cultural heritage generally consists of cultural assets displayed by temporary or permanent exhibitions in adequate museum spaces [11] that are considered to respect environmental parameters specific to a museum climate (infra-climate). To preserve historical buildings and their cultural assets, the optimal values of the main parameters characterizing the indoor climate—air temperature and relative humidity—are presented in the Environmental Guidelines ICOM-CC and IIC Declaration [19], Law No. 182/2000 regarding the protection of the movable national cultural heritage, republished in 2008, and Law No. 311 of July 2003 (republished), Romania being a signatory to the international conventions in this regard. Law No. 182/2000 was completed by Governmental Decision No. 886/2008 for the approval of the classification norms of movable cultural assets, and by Governmental Decision No. 1546/2008 for the approval of the rules for preservation and restoration of classified movable cultural assets.
The dynamics of the most important parameters for the preservation of cultural assets (i.e., relative air humidity, absolute humidity and air temperature) depend on the situation and the environment of the object or monument. The actions taken to protect the artifacts include air conditioning in rooms, and monitoring of temperature and relative humidity parameters [20].
The aim of this paper is to not only provide a quantitative description but also an analysis of the indoor climate of the “Poni-Cernătescu” Museum, an assessment of the influence of the external climate on the internal climate, an analysis of indoor hygrothermal loads, and a risk degradation assessment related to the collection, to inform proposals for interventions on the microclimate to preserve the museum collections in the long run. The research questions posed are ‘What is the impact of hygrothermal indoor and outdoor loads on indoor microclimate parameters?’ and ‘What are the risks of degradation of museum artifacts?’

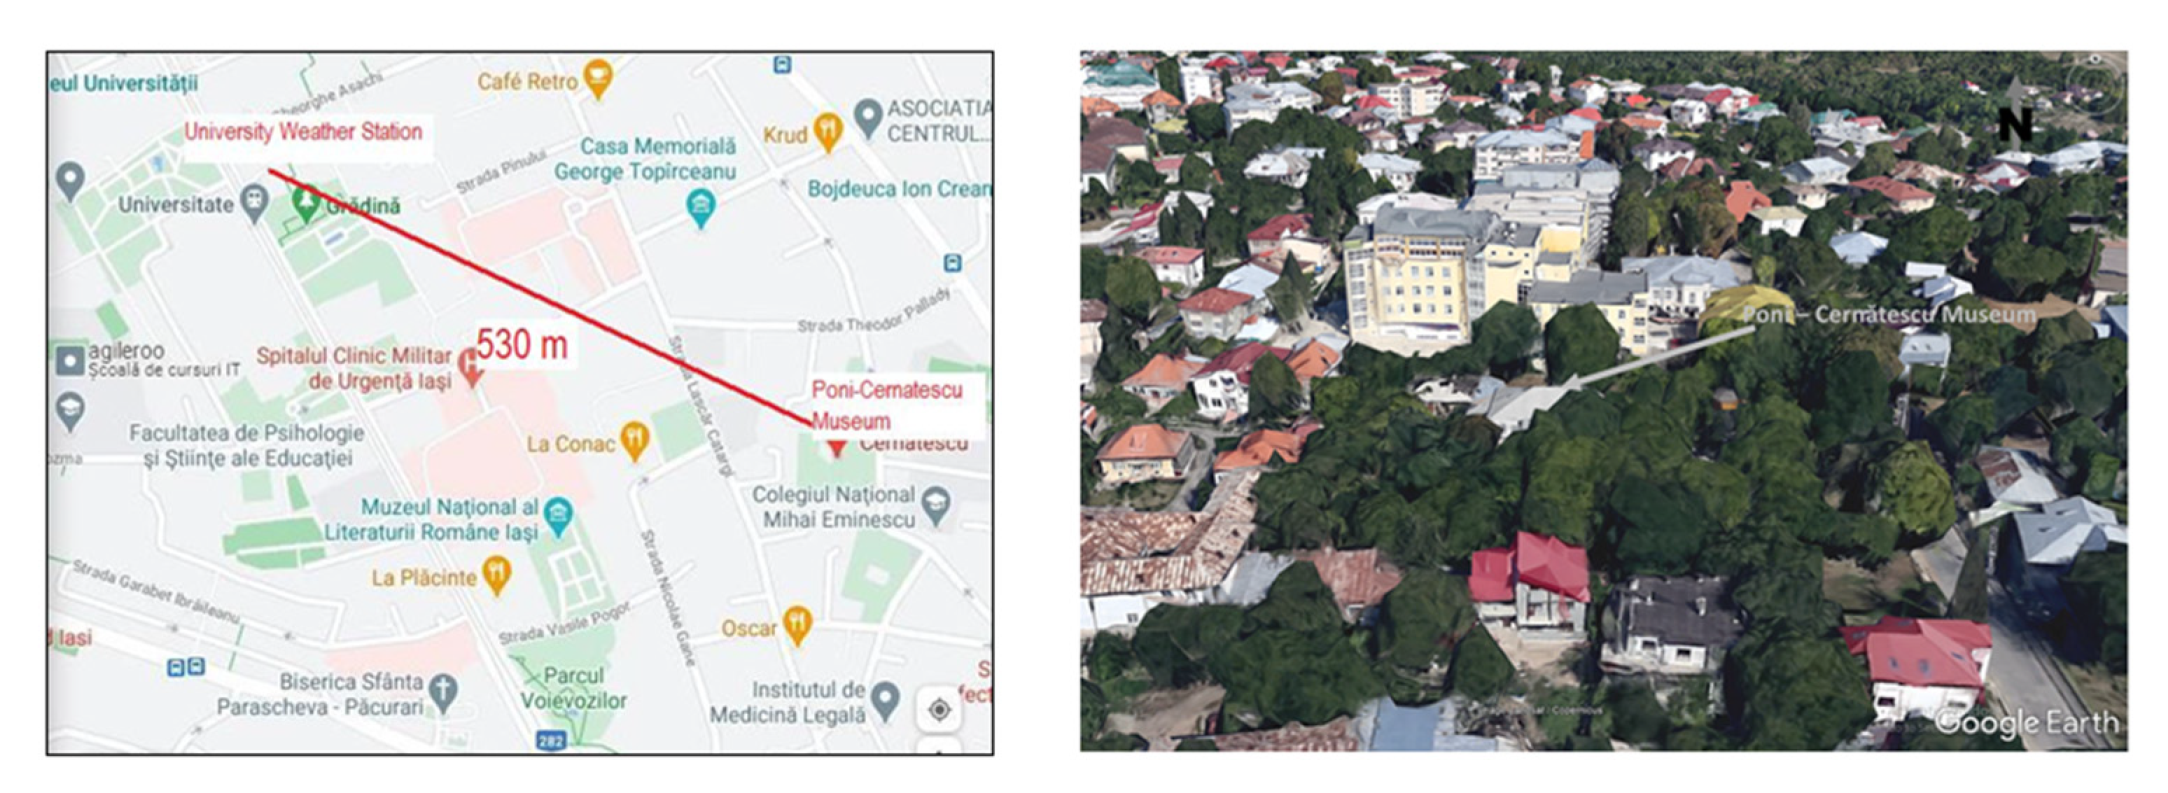
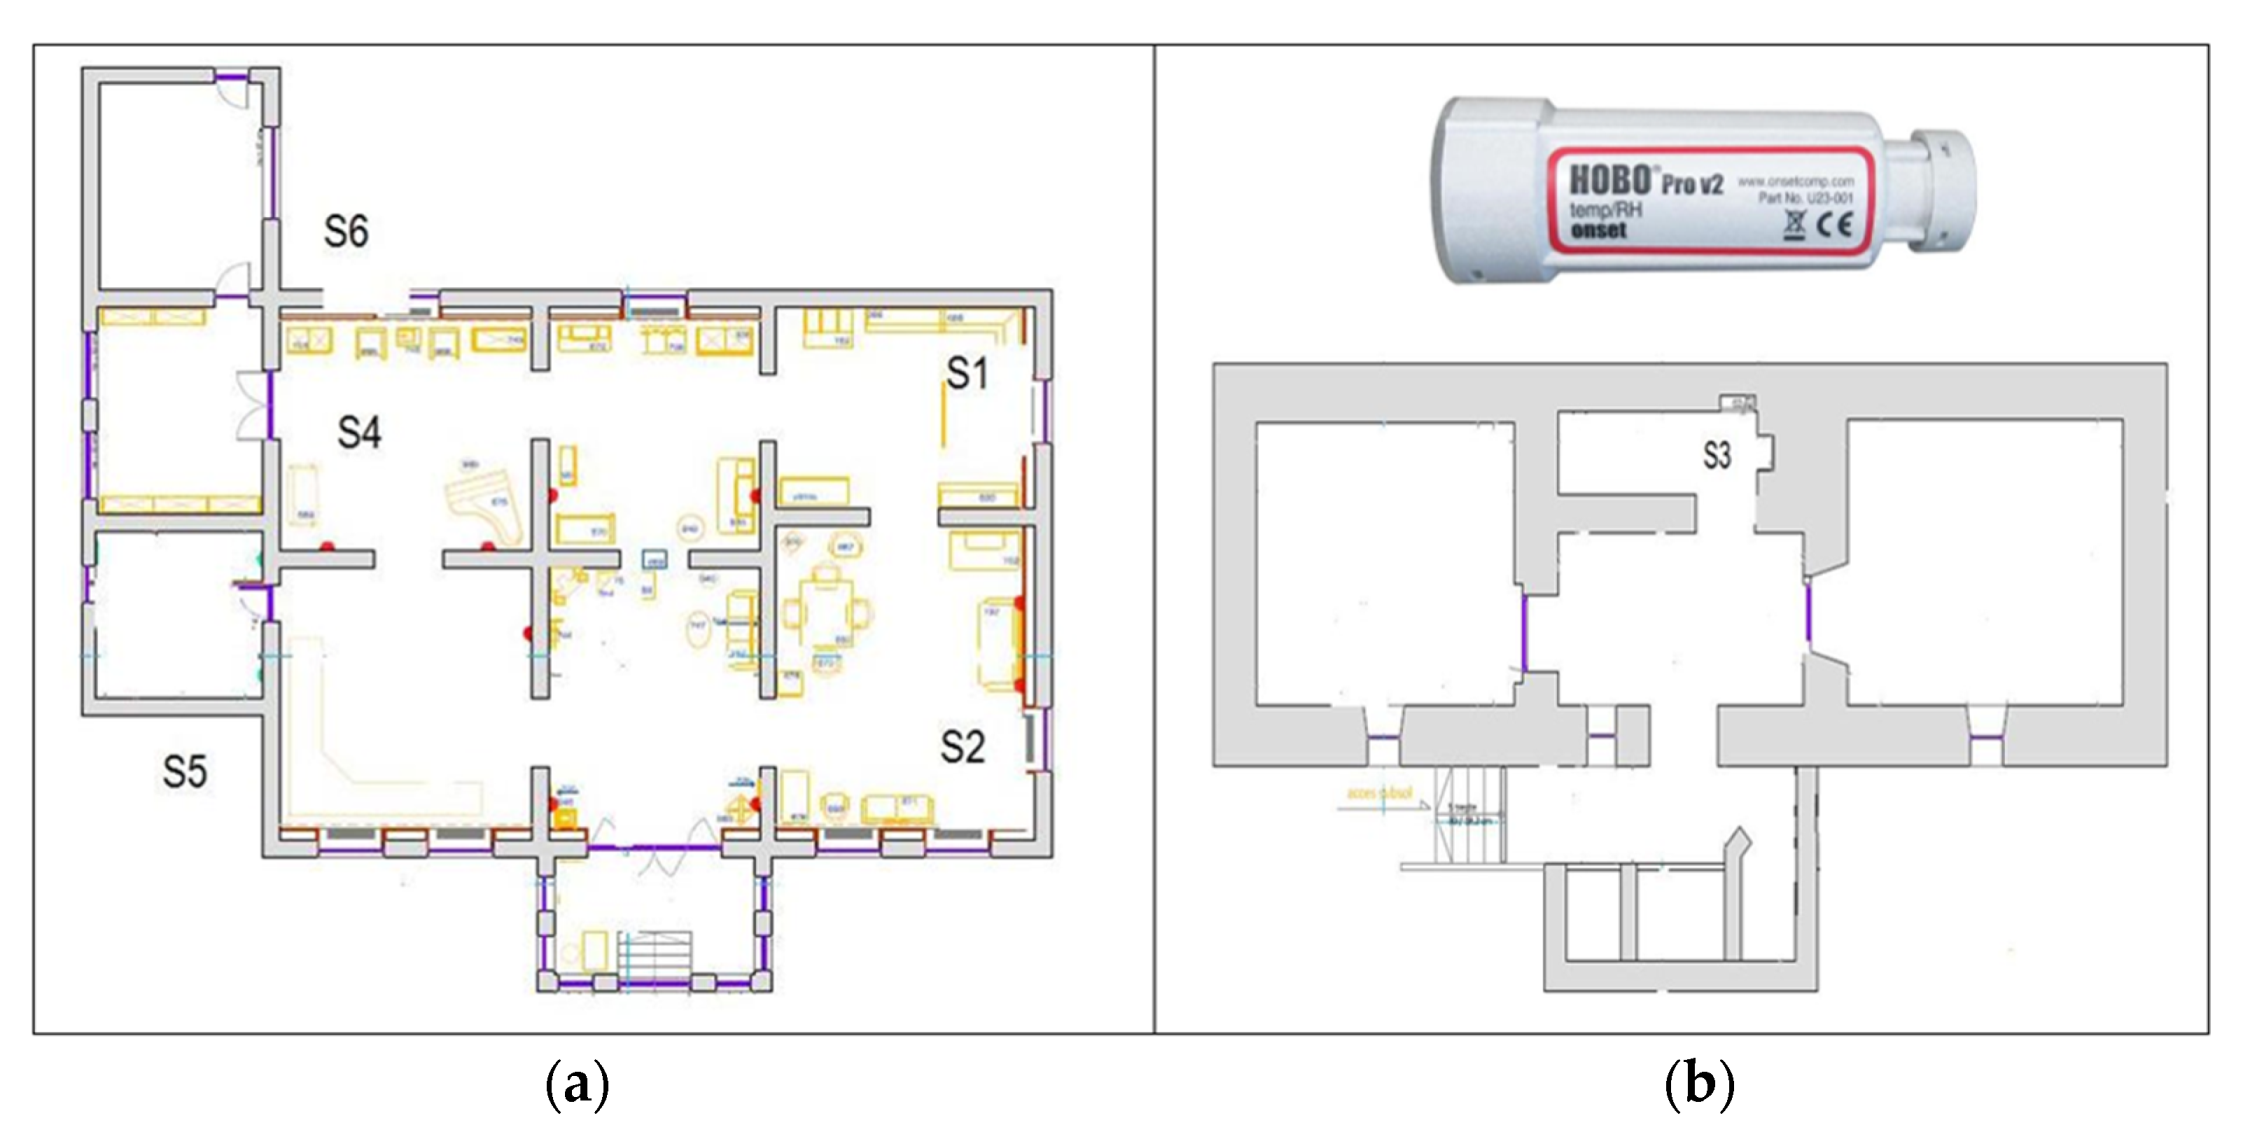
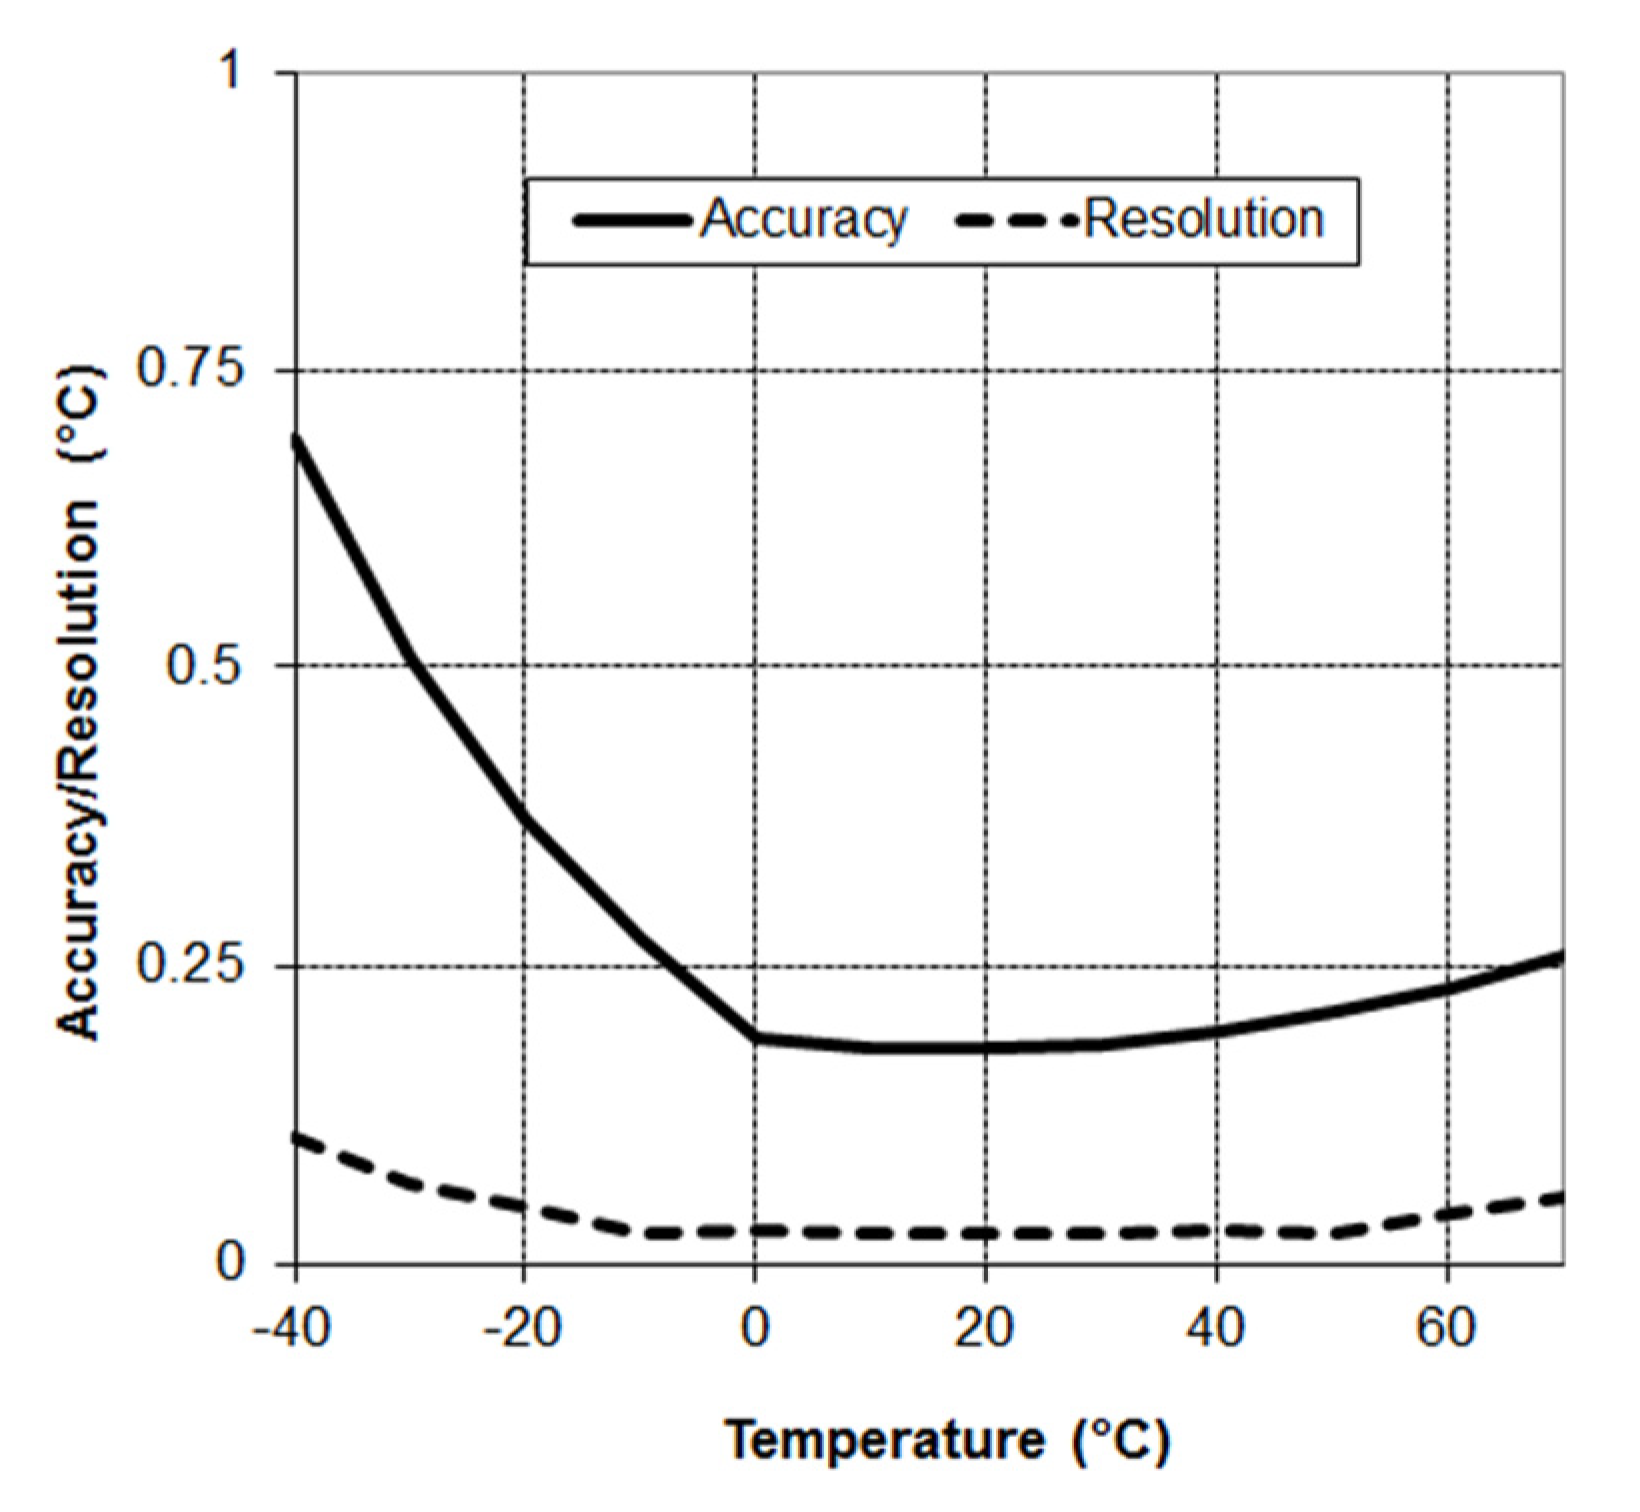
2. Materials and Methods

The house in which the chemist Petru Poni lived is on Romania’s list of historical monuments under code IS-II-m-B-03918 and, following a significant reorganization in 1994, nowadays hosts the “Poni-Cernătescu” Museum, an important cultural site of the historical architectural heritage of Iași City (Figure 1). The museum is open to visitors from Tuesday to Saturday, between 10:00 am and 05:00 pm. The museum collection contains original objects of the Poni family, such as furniture, photos, paintings, decorative artworks and clocks.
The building was originally built in 1839 and functioned as a house until 1991 when it was changed and transformed into a museum. The building has two levels, one of which is underground, and a small attic with no designated function. Both architecture and construction techniques are specific to that period and are based on brick masonry (Figure 2a—exposed brick).
Changing the Poni family house to a museum occurred over a considerable period—about 15 years—the house restoration being completed in 1990. Subsequently, the building has undergone different stages of renovation, the last occurred between 2010–2012 with no structural interventions, but intensive interior renovations. All the exterior and interior walls were covered with gypsum boards and tapestry. The floors were also refurbished, and the ceiling was slightly lowered with a decorative gypsum board (Figure 3).
In Figure 3, it can be seen that the windows were sandblasted so that the objects contained are not subjected to the direct rays of the sun.
Another important intervention was made to the lower level, the mineralogy section, where all walls and ceiling were covered with carved painted decorative Styrofoam, to resemble stone in a cave (Figure 2).
The museum artifacts are openly exposed as they were at the time when the Poni family members lived there and some of them are displayed in showcases. The thermal behavior of the building’s envelope is characteristic of brick masonry buildings with no insulation. This is because the bricks are efficient building materials with low conductivity, but also, partially, due to plastering of the walls and ceiling with gypsum boards which created unventilated air cavities, which act as an effective insulating layer within the envelope.
Based on graphs and tabular data, this study presents the evolution of two parameters of internal microclimate, air temperature and relative humidity, and their correlation with external climatic factors. In addition, the structural functional parameters of the museum, the heating and air conditioning systems with their working levels, and the arrangement, the load, and the typological complexity of the artifacts displayed, were considered in the analysis.
Hygrothermal loads in museums are produced by visitors, lights [23], and in periods of time when the outdoor air temperature and/or humidity are higher than the indoor. During the research, due to the pandemic situation, only a few visitors went through the permanent museum exhibition, so no research could be carried out in this regard. Usually, the light generated by the LED bulbs is turned on upon the arrival of visitors and turned off immediately after their departure from the room.
To describe the internal climate of the building, air temperature and moisture were monitored at hourly time steps for a period of one year, beginning on 17 January 2020, at 01:00 PM. Data were obtained both outside and inside the museum building. This information was used to better describe the influence of external conditions on the internal climate [11].
The data were collected with certified devices recording air temperature and relative humidity, namely six HOBO data-loggers mounted as follows (Figure 4a,b):
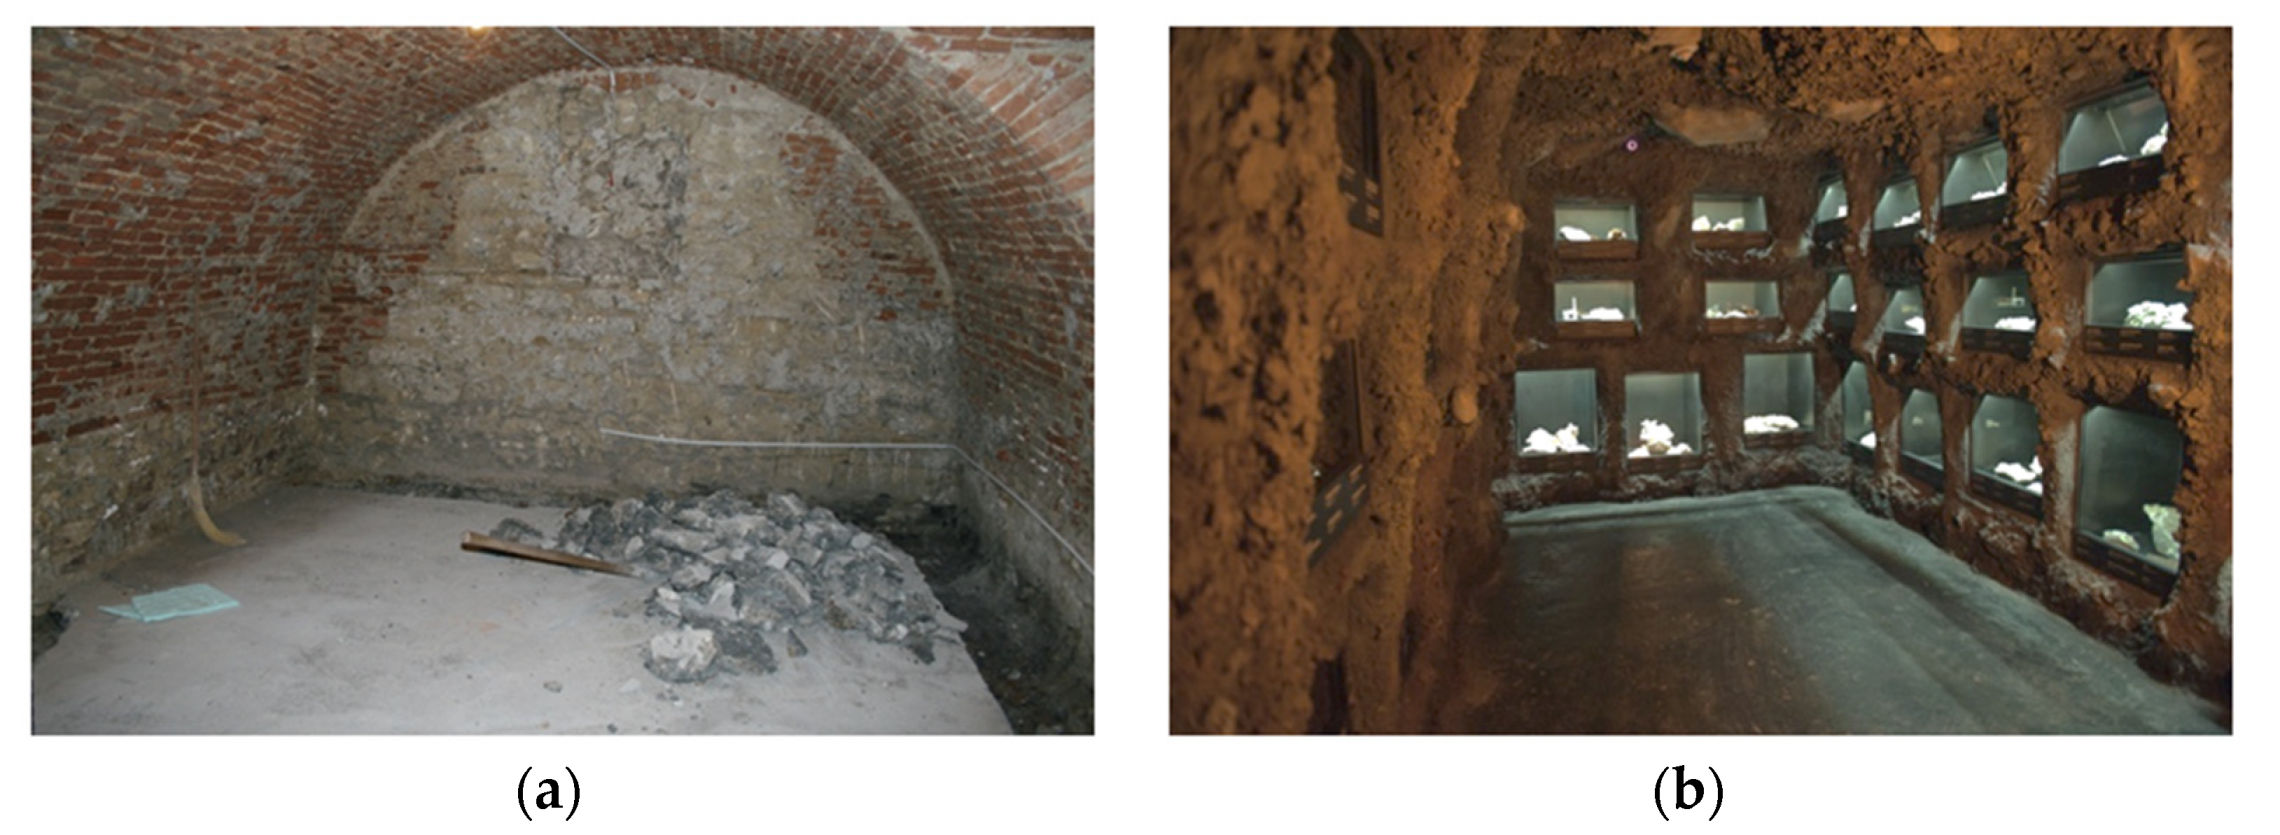
  • four sensors mounted in the exhibition circuit halls at 1.5 m above the floor, near the walls, as follows: one in the north-east room—library (S1), one in the south-east room—living room (S2), one in the north-west room—Radu Cernătescu room (S4), and the last one in the basement (S3);
  • two sensors were mounted on the external walls of the museum, one to the northern (S6) wall and the other on the southern (S5) wall, at 2 m above ground level.
The data loggers used for measurements have very good accuracy and resolution for indoor observations as its is shown in Table A1 from Appendix A. The HOBO U23-001A Pro v2 data logger has an operating range for temperature of −40/+70 °C with 12-bit (002 °C to +25 °C) resolution, ±0.2 °C from 0 to +50 °C accuracy, and for relative humidity 0/100% with 12-bit (0.03%), ±2.5% from 10 to 90% accuracy.
All events connected to the internal climate fluctuation (e.g., window opening for airing the museum, entry of visitors, use of air conditioner, room heating, etc.) were recorded daily. The Museum has gas central heating with fan coils that provide heating in winter (via a boiler) and ventilation during summer (via a chiller). Table 2 describes the air conditioning system and its operating parameters. Curtains are used to stop direct light.
External measurements were correlated with weather data recorded at the “Alexandru Ioan Cuza” University of Iași, located at almost 500 m in a green area similar to the surrounding area of the “Poni-Cernătescu” Museum (Figure 1).
The analysis of the collected data was used to identify the degradation risks of materials, to compare the preservation quality of one environmental space to another, and to analyze the museum’s heating and ventilation systems.
Since the exhibited cultural assets were made of various, organic and inorganic materials [11], an estimation of degradation risks can be made based on knowledge of the biological, chemical and mechanical damaging mechanisms. Firstly, mildew development must be avoided as it causes museum buildings to be inadequate for the preservation of cultural assets and for living. Causes of mildew occurrence are related to specific conditions with respect to air temperature and relative humidity [21]. Recommended temperatures to avoid mildew are up to 15 °C, but they must be controlled. Fluctuations are acceptable within a very low range (during summer months) and not outside extremes (±5% RH, ±2 K) [22].
To assess the risk of degradation of heritage objects, we used Martens’ methodology [37] for the assessment of biological, mechanical, and chemical risks of degradation of collections according to ASHRAE norms [34,37], which refer to the optimal intervals for the conservation of heritage objects as applied to the “Poni-Cernătescu “Museum in Iași.
We utilized climate evaluation charts obtained with climate analysis tools (www.monumenten.bwk.tue.nl, accessed on 23 February 2022) to develop a simplified interpretation of the temperature and humidity data.
The ASHRAE quality classes for conservation range from Class D (which prevents dampness) to Class AA (which is associated with no risk of mechanical damage to most artifacts). Class B is considered the reference standard for museums [24,38,39,40,41].
Temperature and relative humidity data were transformed into quantitative and qualitative numerical measures of the collection decay risk. These numerical values describe the space in which cultural artifacts are preserved and explain the type of deterioration of cultural artifacts. Thus, the authors referred to the following: the preservation index (PI) and the time-weighted preservation index (TWPI) to assess the risk for chemical decay for organic materials; the equilibrium moisture content (EMC) and dimensional change (DC) to assess the risk for physical/mechanical decay; and the mold risk factor (MRF) to assess the risk for biological decay for all types of materials [42]. PI values were calculated in years, representing life expectancy values under the existing storage conditions. TWPI was calculated as an average value for PI values obtained at regular periods of time. MRF measures the risk for growth on objects of mold species. Lower values for MRF are preferable. EMC was measured as a percentage.
Based on temperature and relative humidity data, we utilized a dew point calculator [43] which was utilized to obtain numerical values, as for PI, EMC, and MRF, which were input into the analysis of the indoor microclimate. These measurements were used to compare the environmental conditions in the museum spaces during the analyzed period, and then to compare the environmental conditions in the museum with those of the following year.

3. Results and Discussions

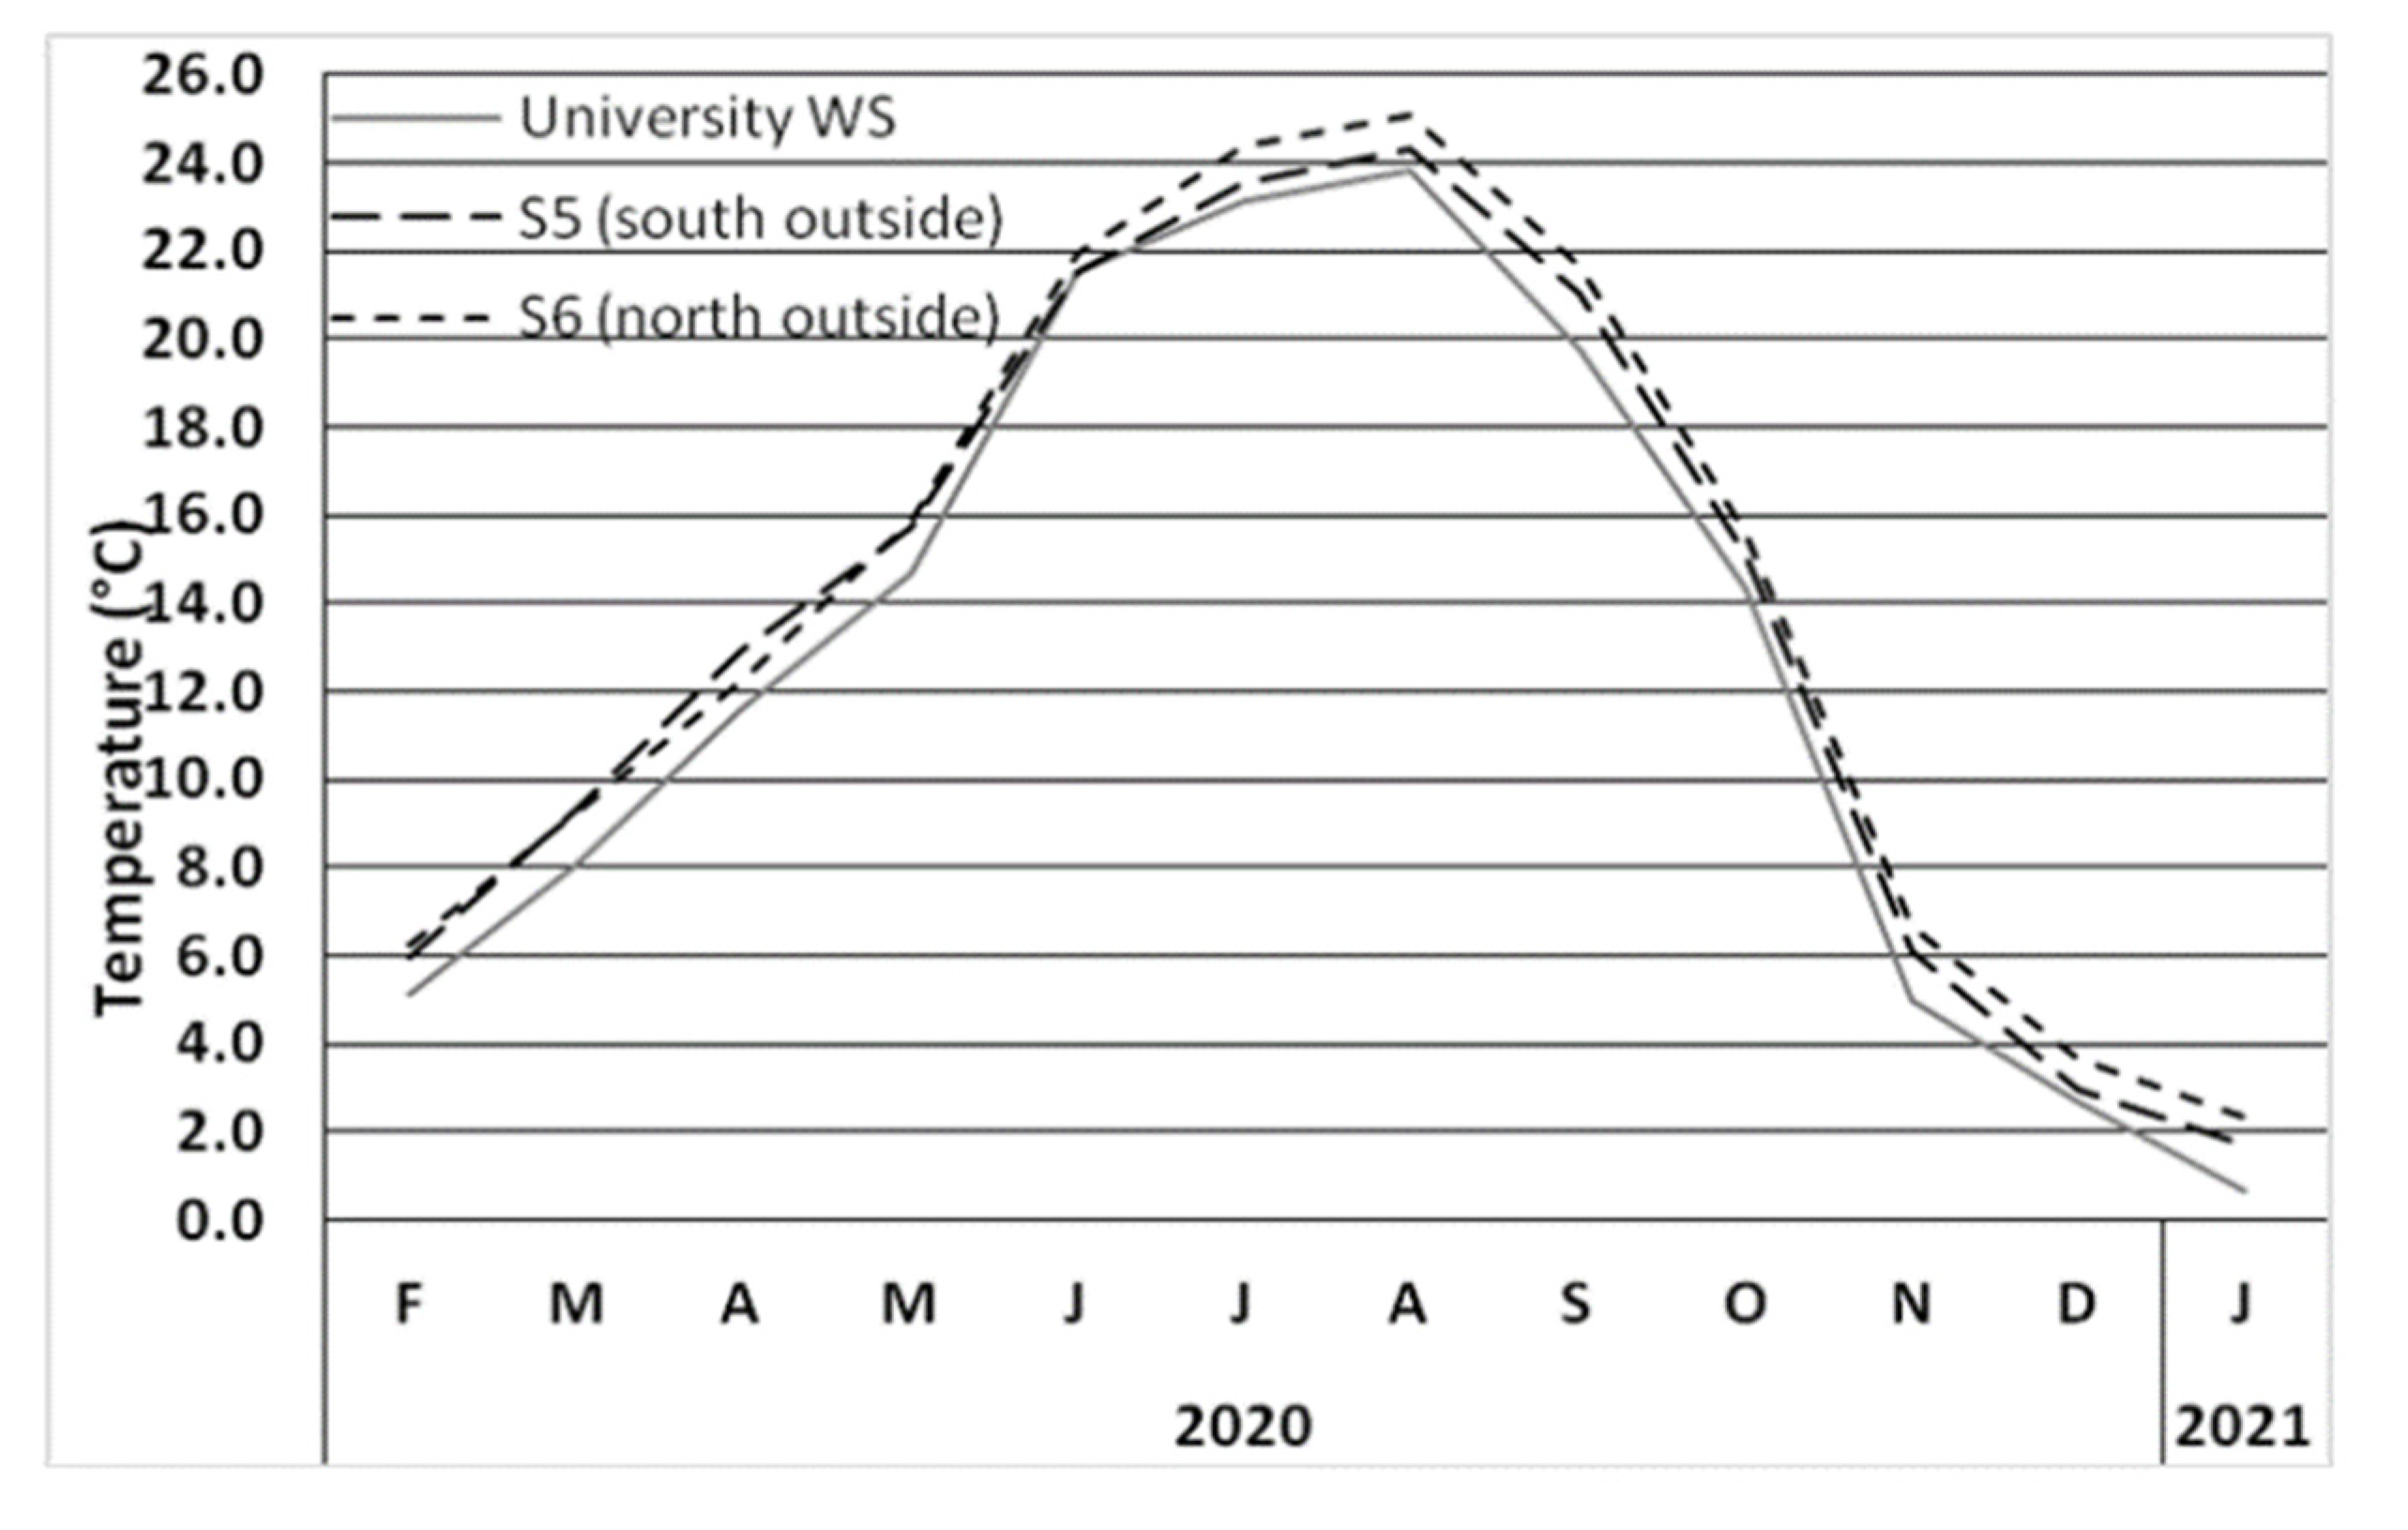
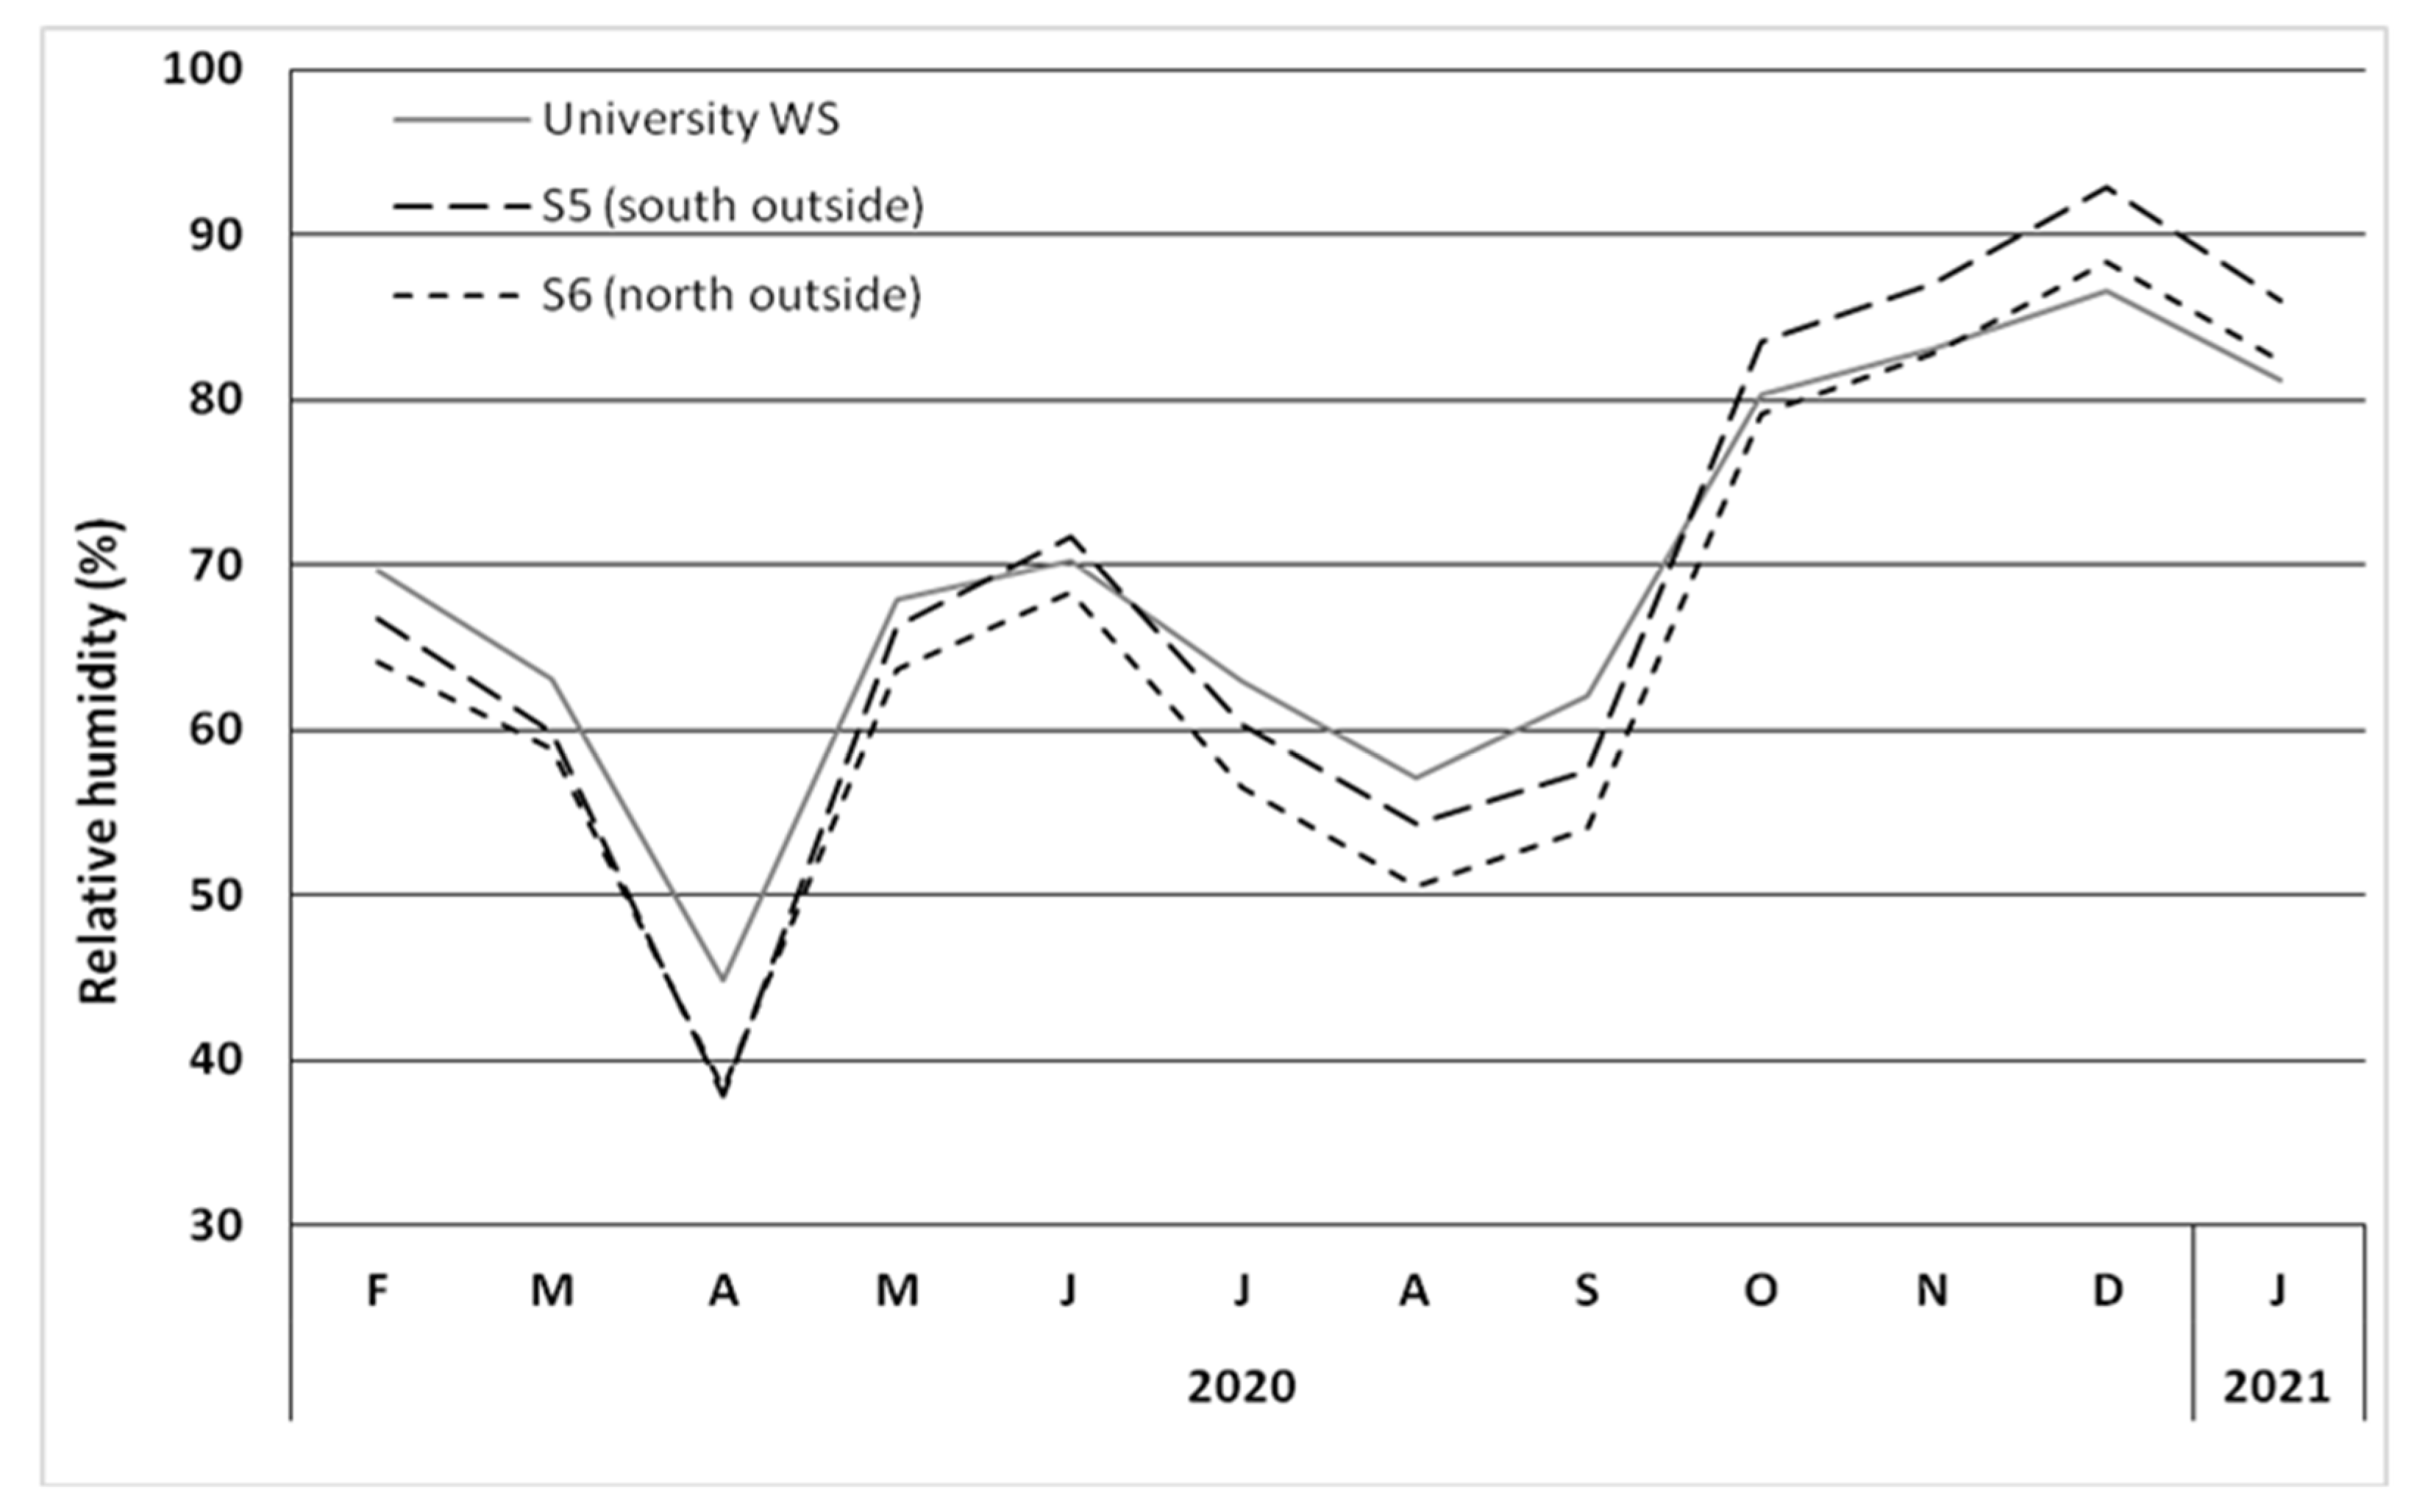
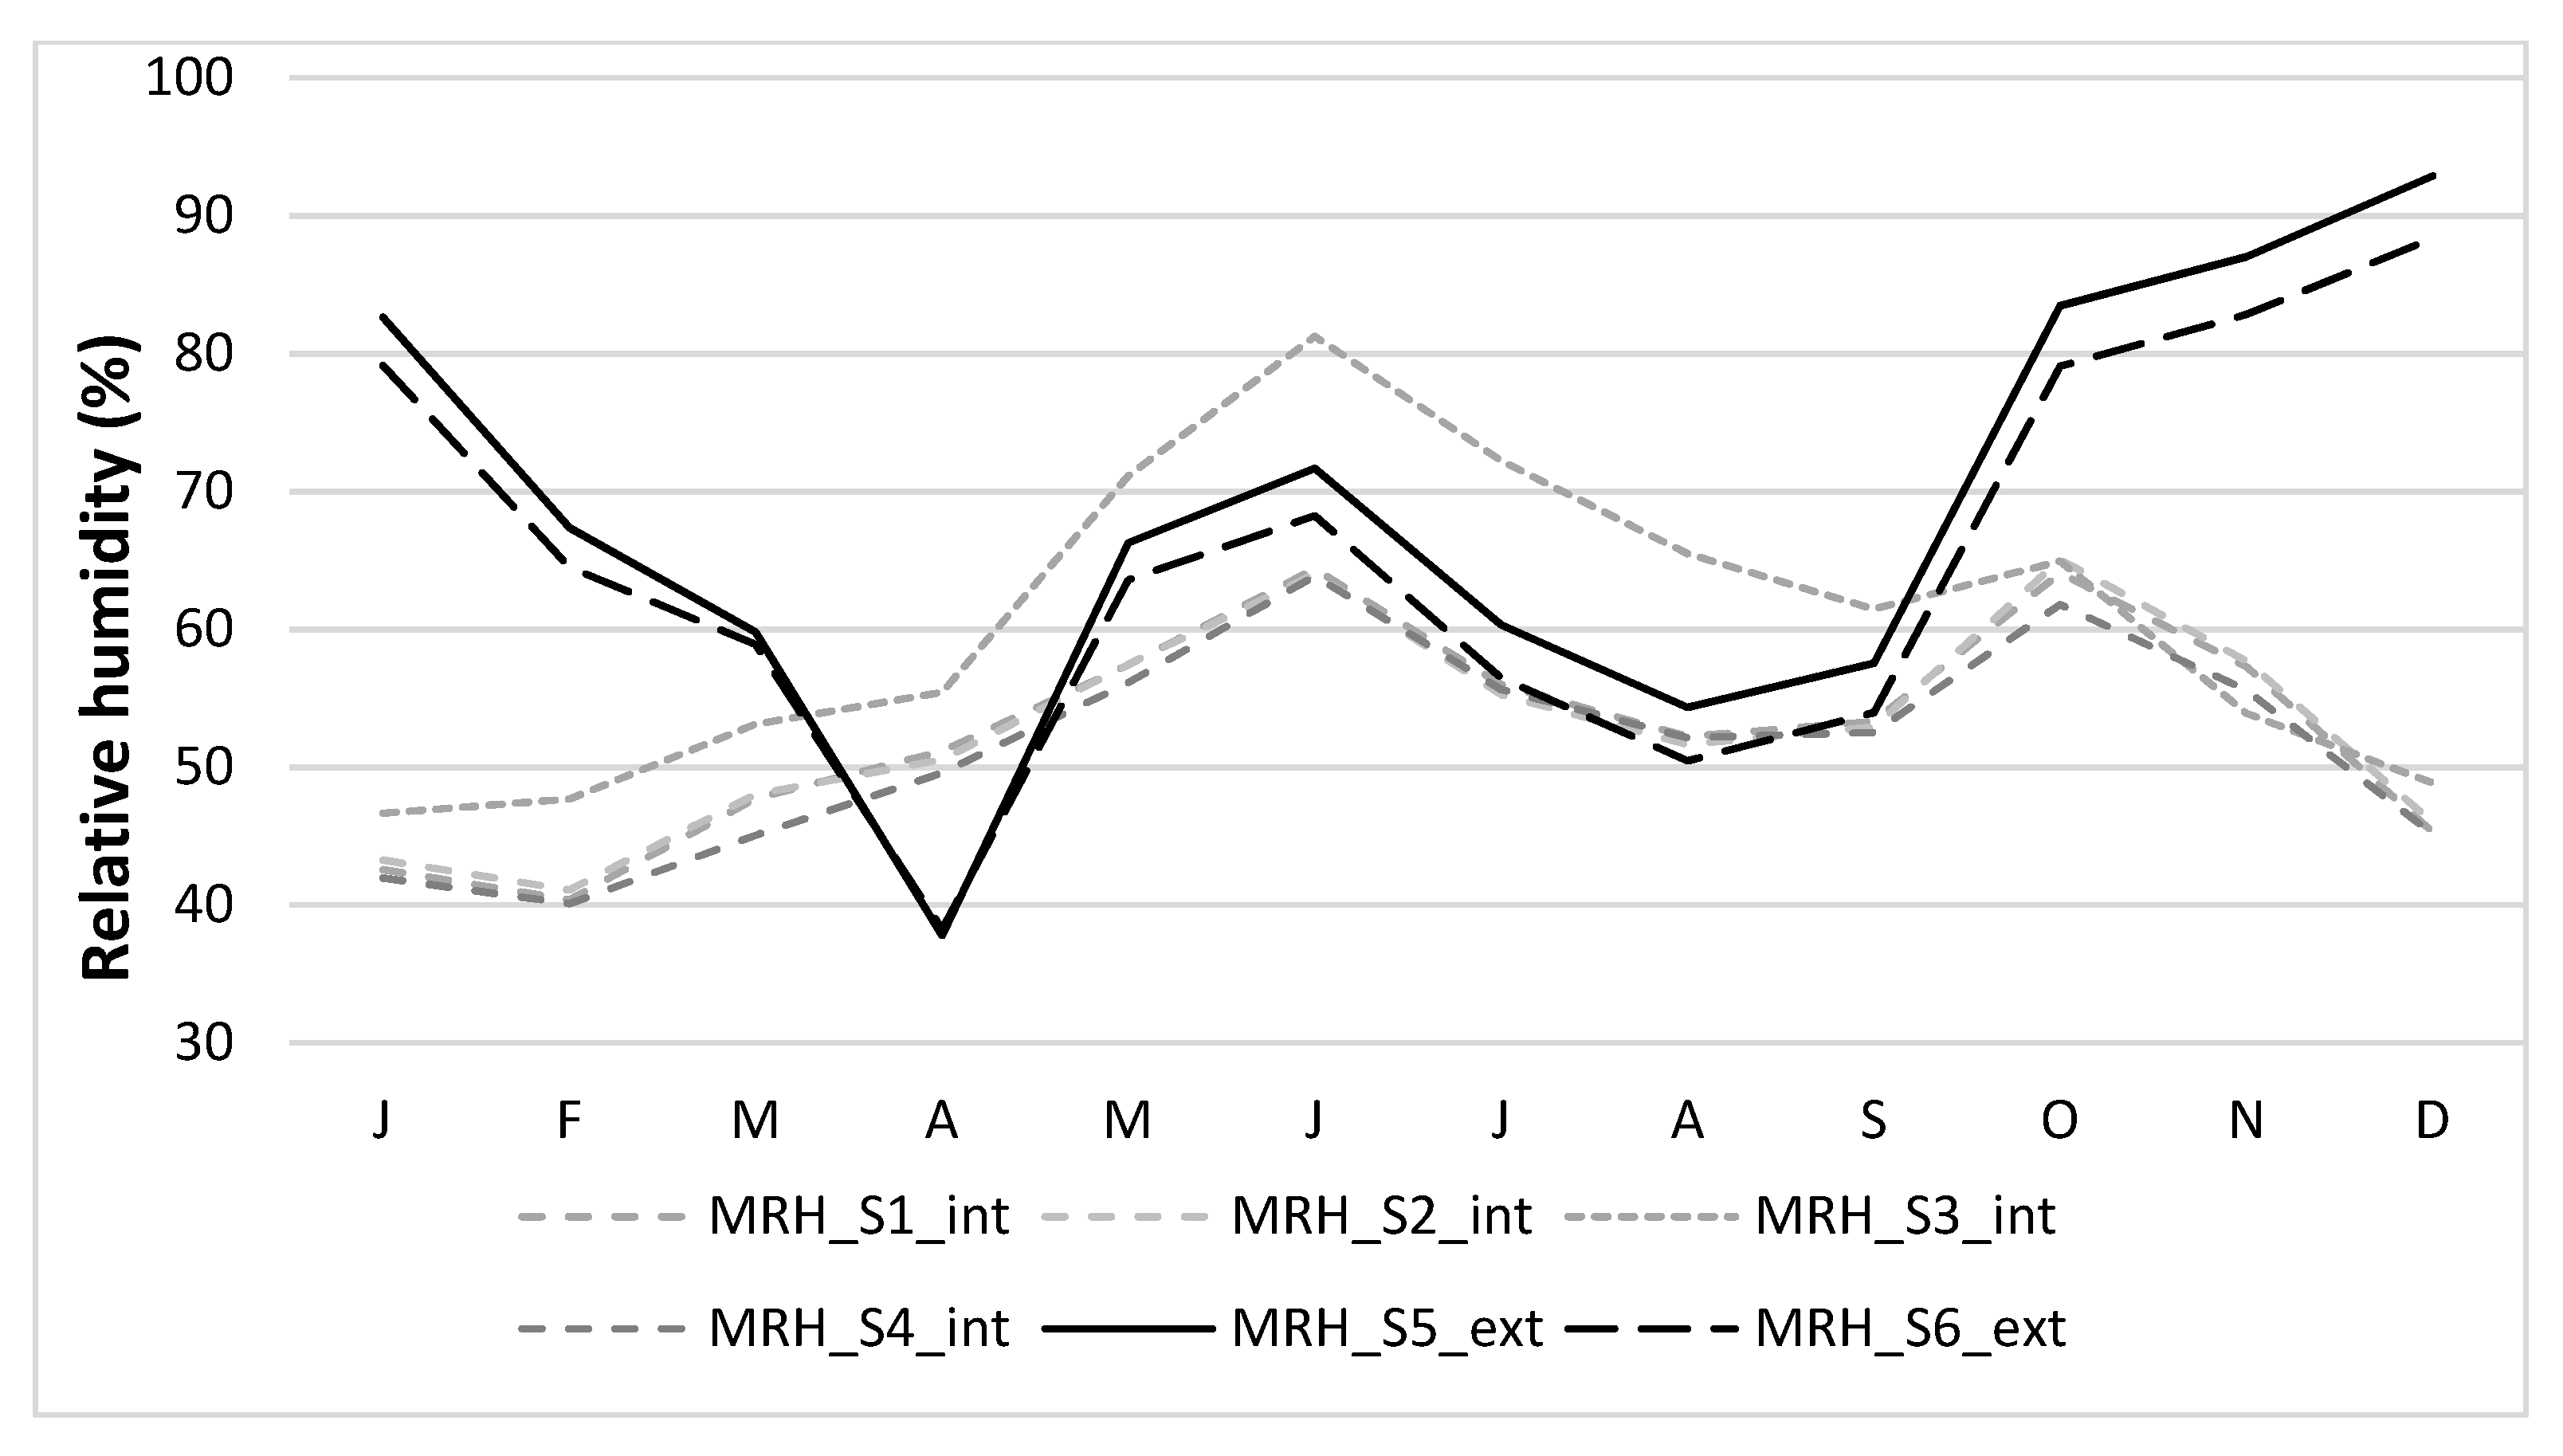
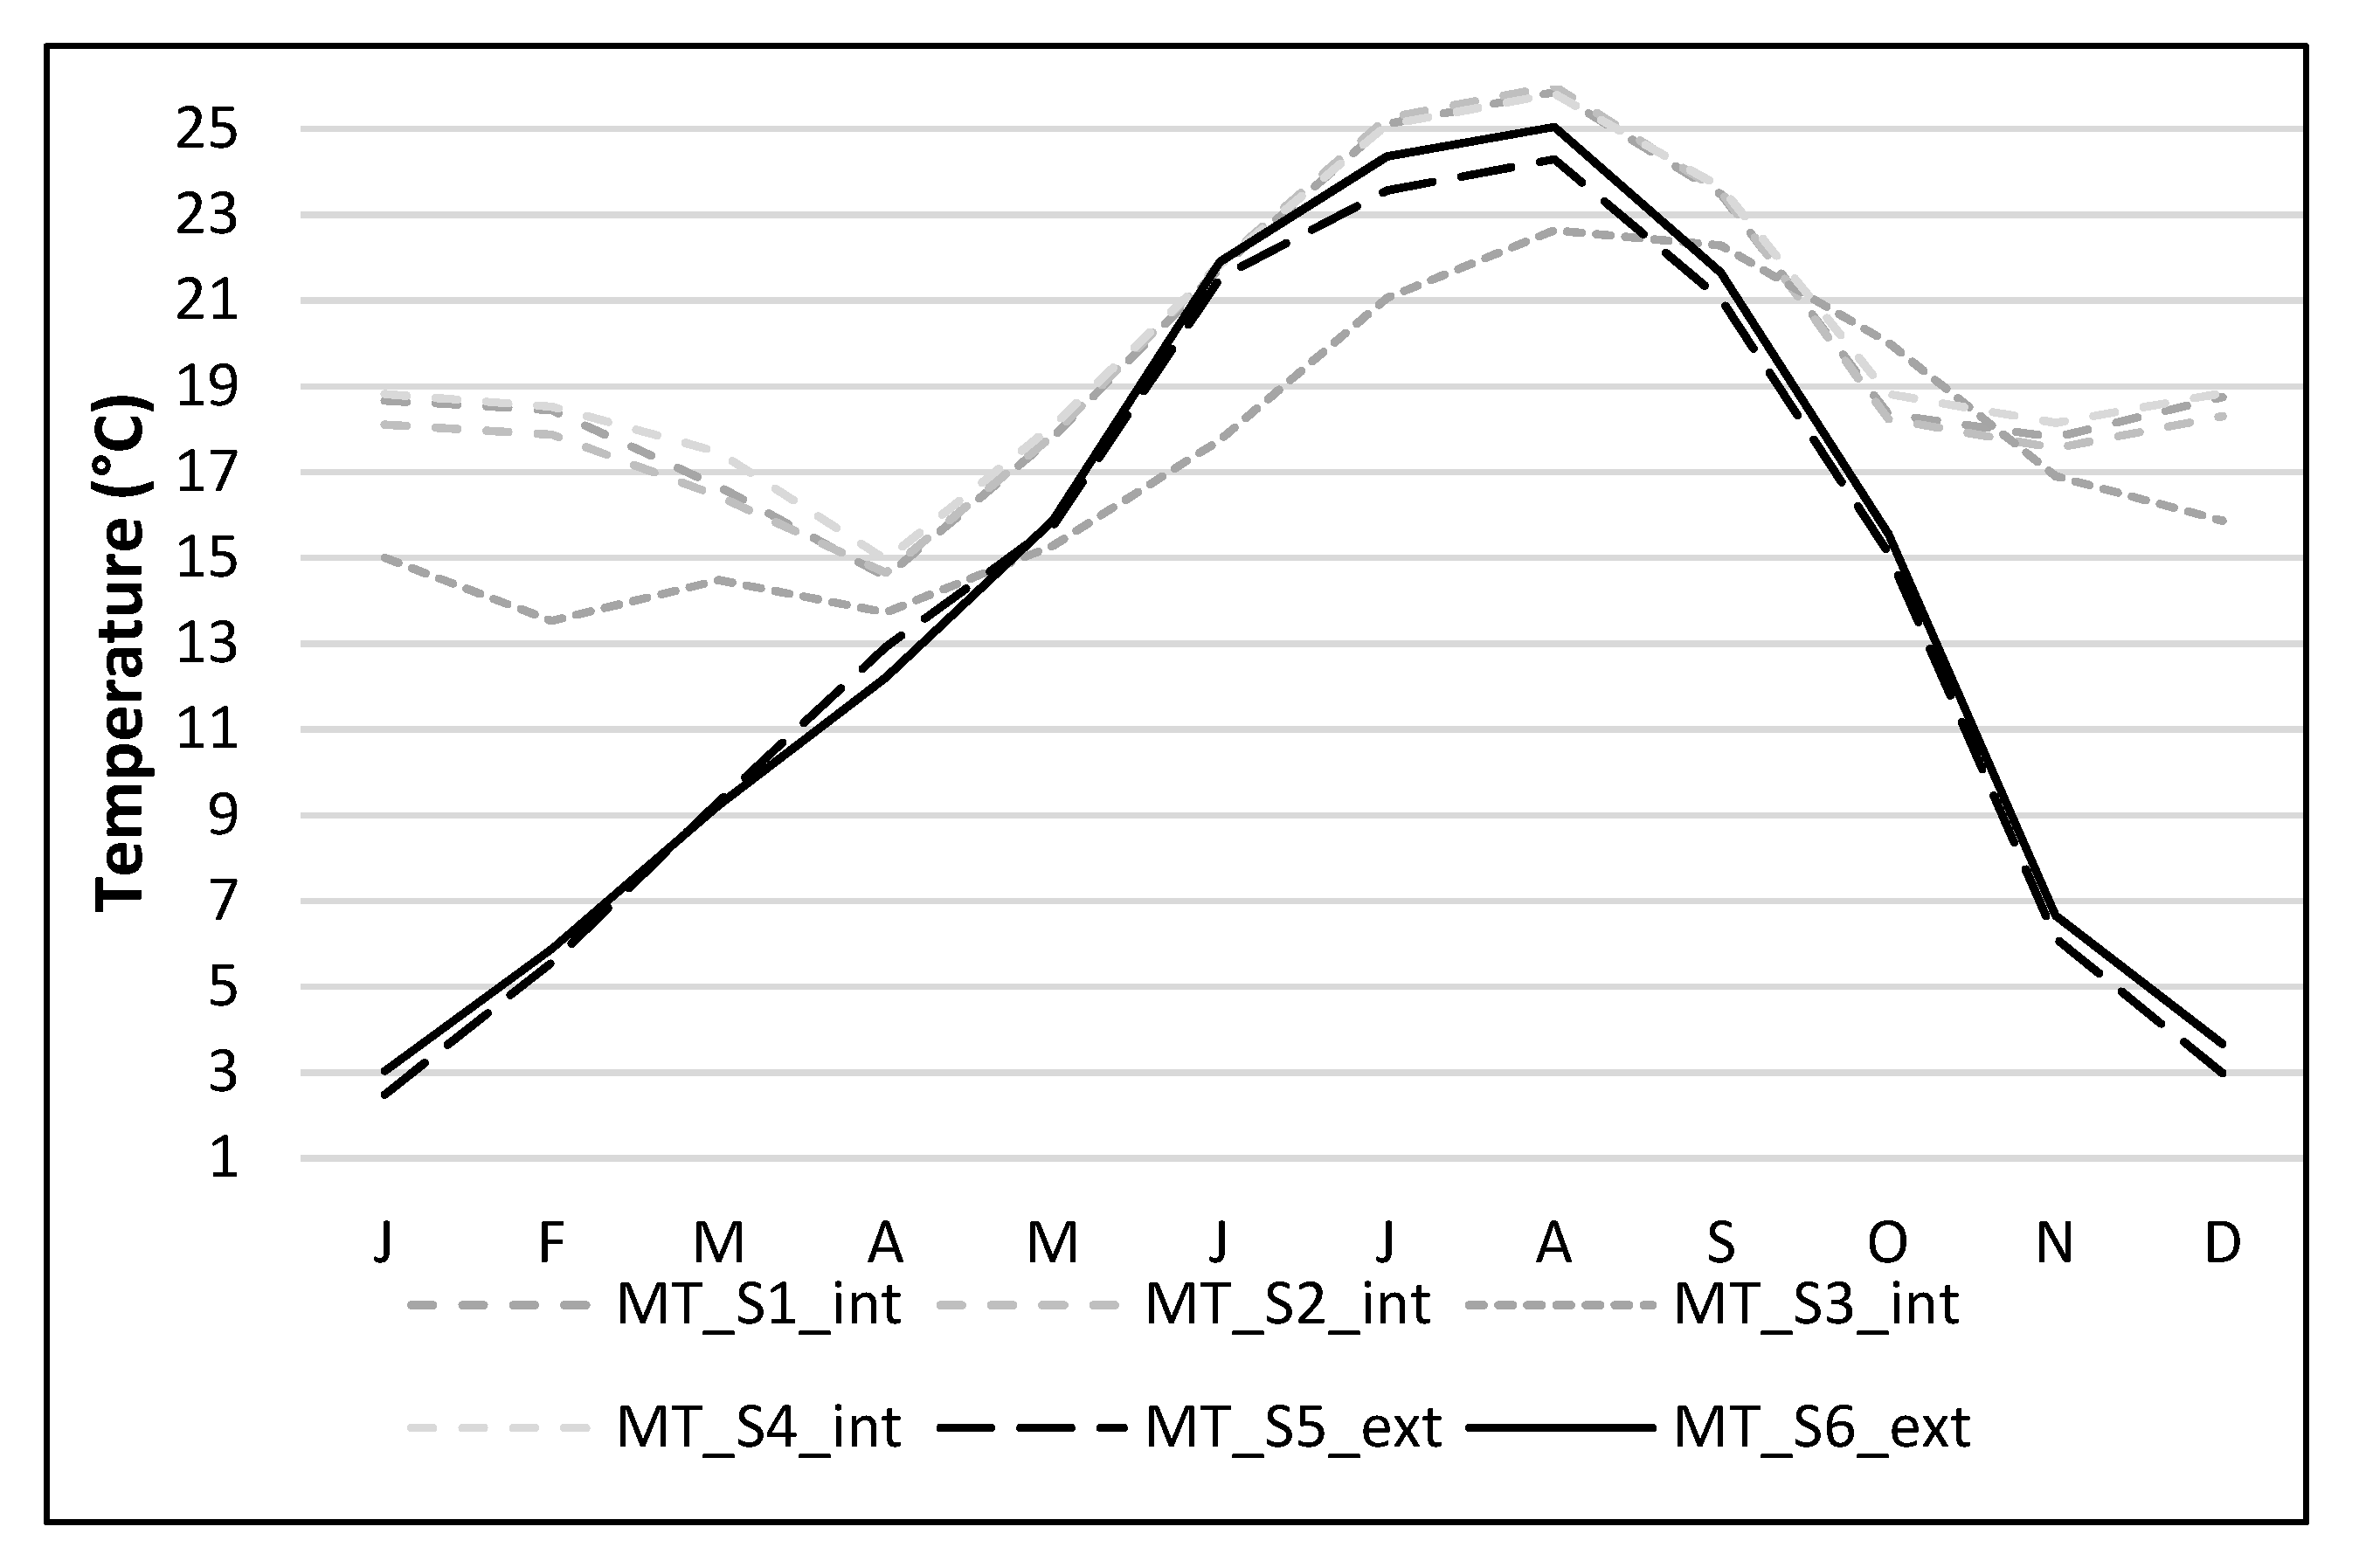
3.1. Outdoor Hygrothermal Characteristics in the Museum Microclimate

The city of Iași is located in a temperate warm climate, with uniform annual distribution of precipitation (Cf) according to the Köppen climate classification. This climate can also be framed as a temperate continental climate with a long warm season according to Trewartha’s climate classification (Dc) [44]. In recent years, a warming trend has been observed for the mean air temperature from 9.7 °C in the 1961–2010 period [45], to 10.9 °C [46] and 11.2 °C for the period December 2012–November 2019 [47]. In recent years, a series of studies have been conducted on urban climate variability. Broadly speaking, these studies show an increase in the frequency of thermal discomfort intervals represented by simultaneous high values of air temperature and humidity. In the case of the city of Iași, an urban heat island intensity of approximately 1 °C was observed, with peaks occurring during summer nights when this reached 2–3 °C (Figure 5) [48,49,50].
The mean air temperature values recorded on the exterior walls of the Museum in the analyzed interval were 0.8 °C (southern wall) and 1.2 °C (northern wall) higher than the mean temperature recorded (Table 3) for the same interval at the university weather station. Following measurements taken outside the building, it was observed that the temperature recorded (Table 3) on the northern wall (13.7 °C) was 0.3 °C higher than on the southern wall (13.4 °C). The higher temperature values recorded on the northern wall seem atypical since, theoretically, the southern exposure areas should be warmer. The north-south asymmetry is the result of local air movements which favored the warming of the northern wall. A major role, in this regard, is played by the fact that the museum building is flanked on the northern side by a tall glass building that reflects infrared light toward the northern wall of the museum, especially during the summer.
As a result of the temperature characteristics, the recorded values of the air relative humidity recorded were higher on the southern wall (Table 4) almost throughout the entire interval, except for April, when a minimum relative humidity value was recorded (Figure 6). Over the long term, the annual evolution has followed a single minimum during April and a maximum during the cold season. In contrast, during the analyzed period, a two-shoulders peak evolution was observed, caused by the fact that May and June 2020 recorded very humid conditions with a high amount of precipitation in the area of Iași City.

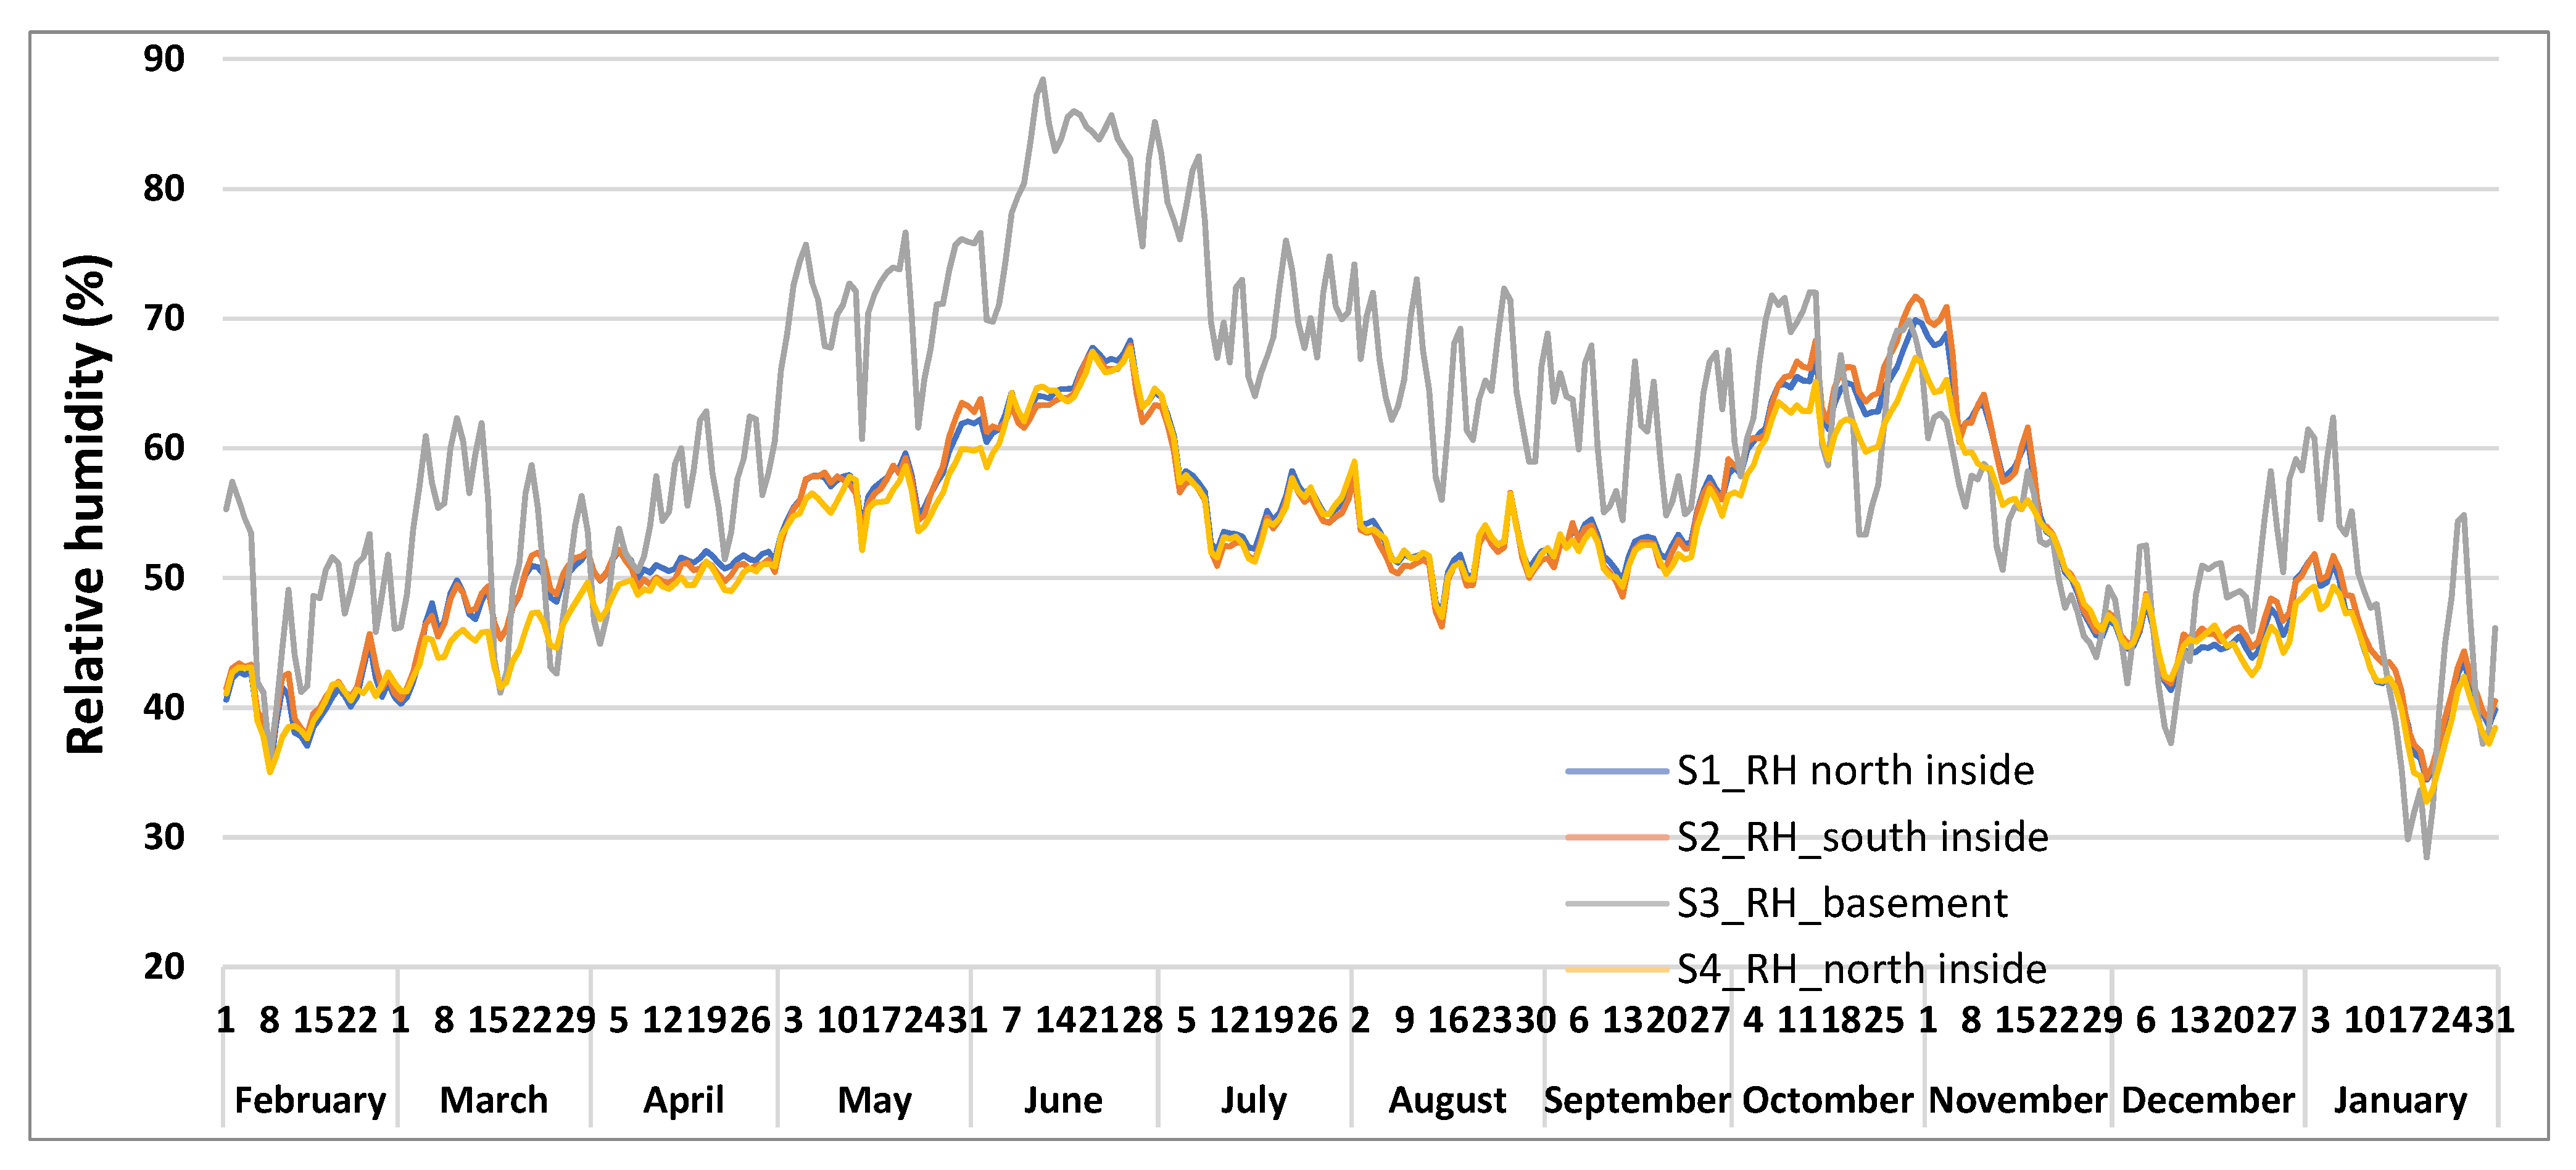
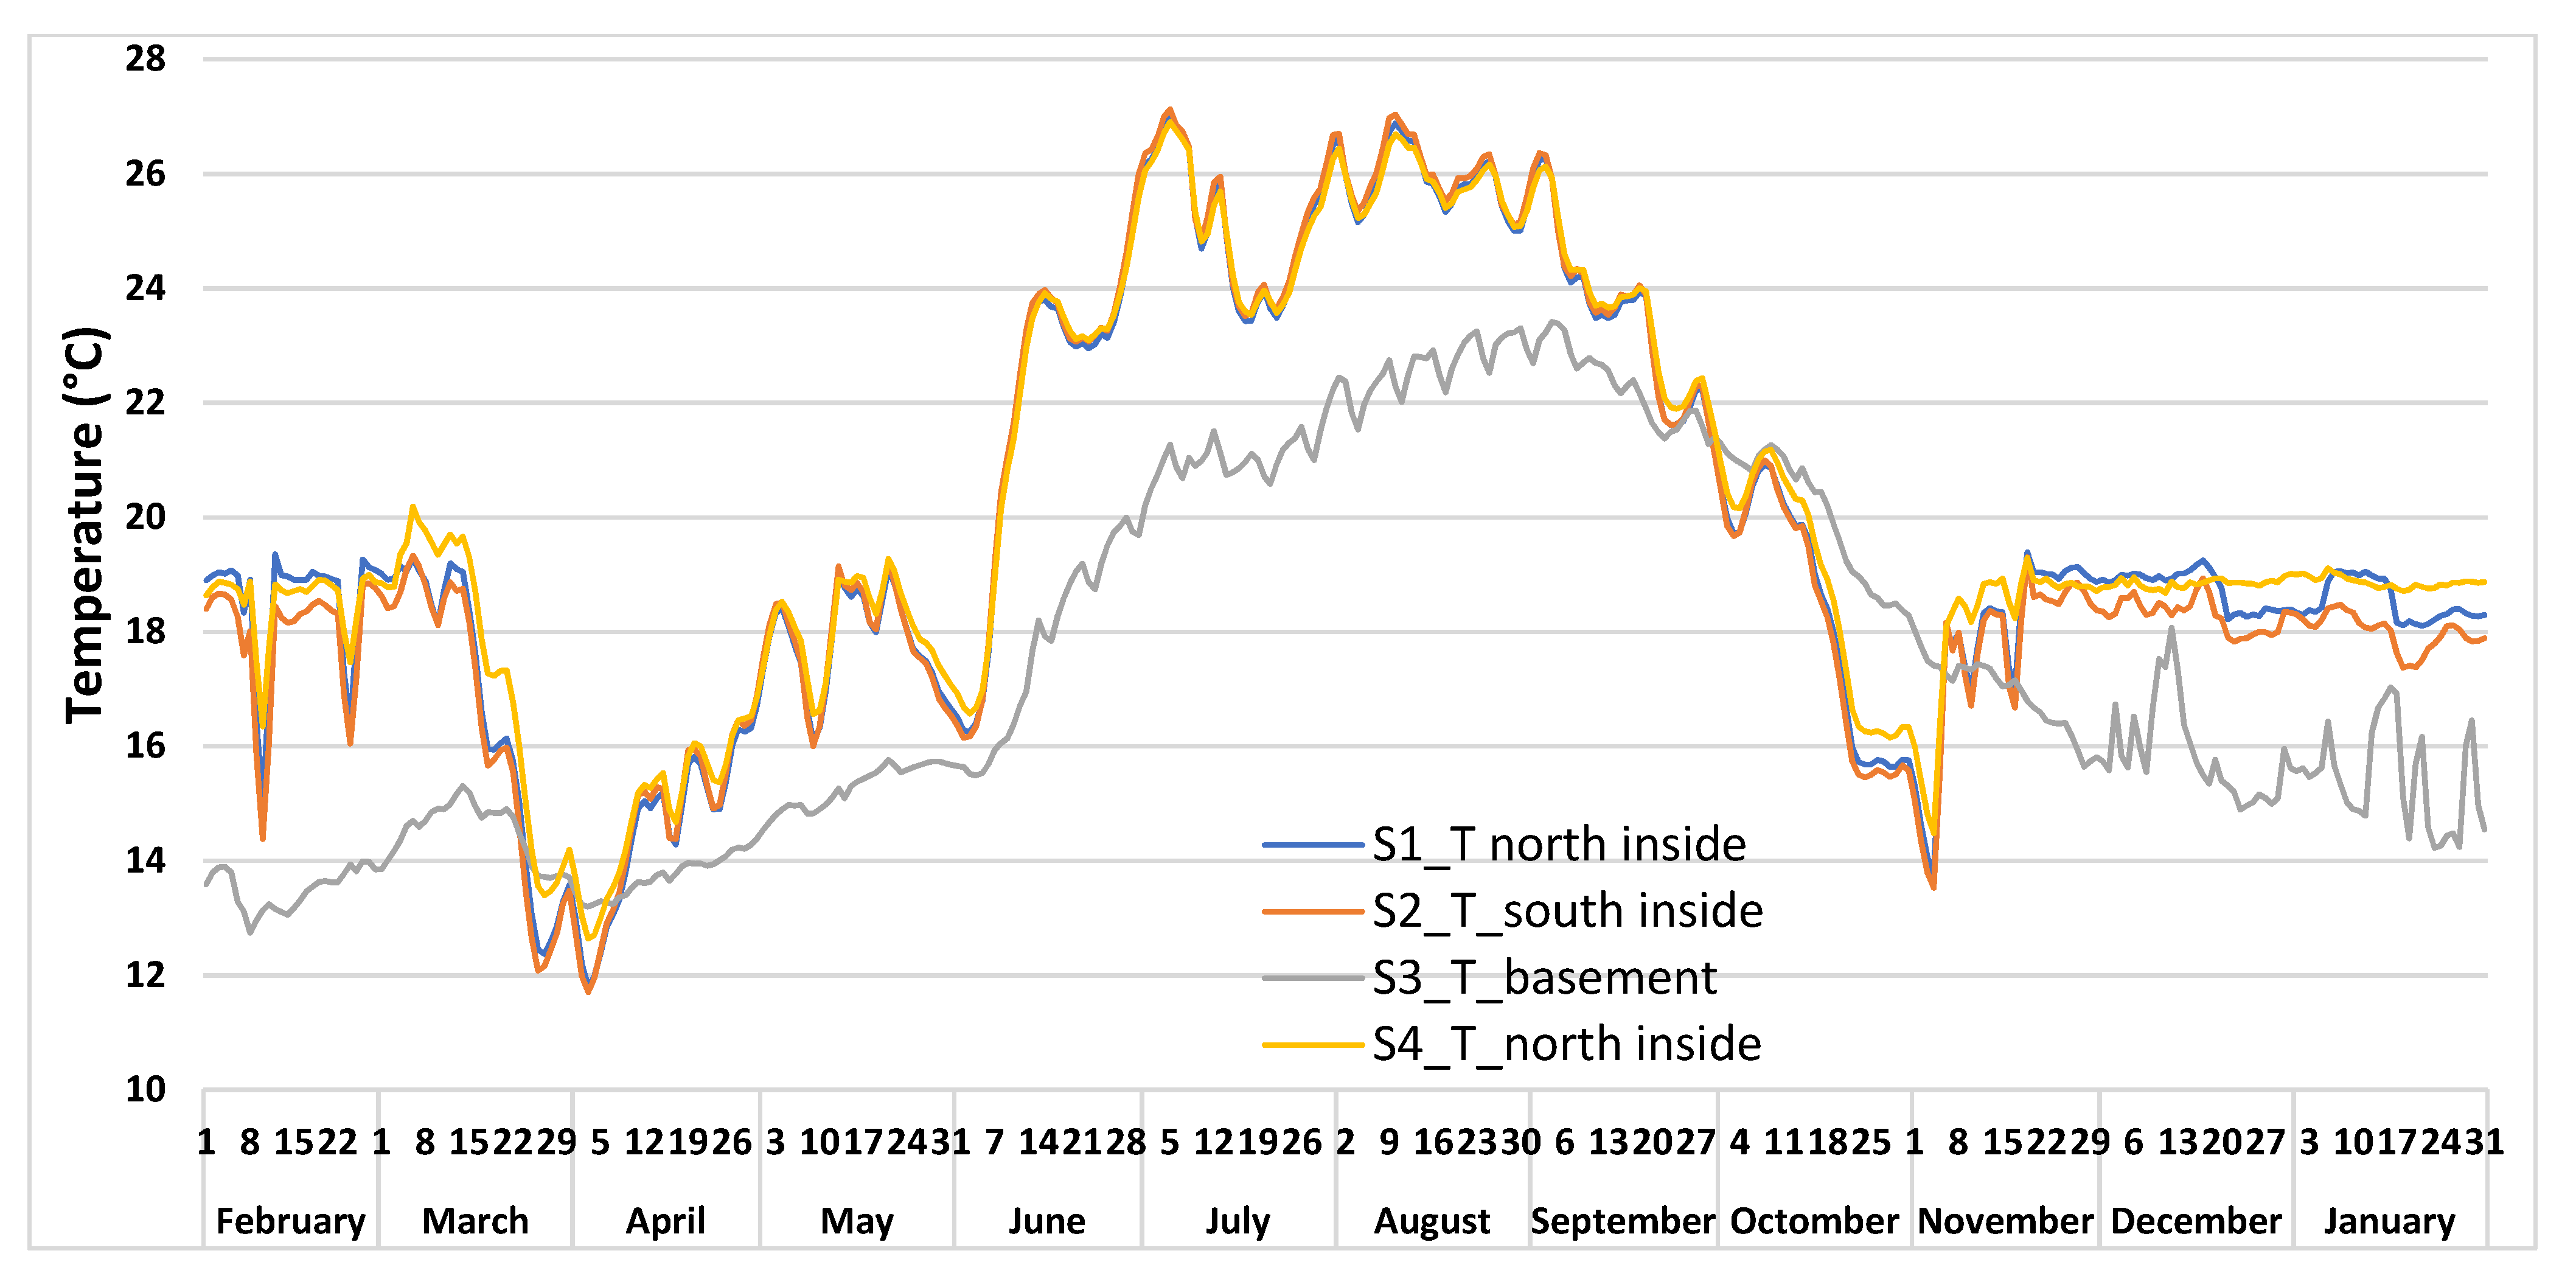
3.2. Annual Variations in the Indoor Air Temperature and Relative Humidity

Variations in air temperature and humidity act cumulatively on cultural assets and, in the long term, determine their aging. Large variations create stresses on the internal structure of the components of artifacts. From a microclimatic viewpoint, for the entire analyzed interval, the museum building fell within the normal thermal and humidity intervals for the conservation of cultural goods. Thus, the mean temperature inside the building was 19.8 °C, and the mean relative humidity level was 52.4% (Table 4), for the period February 2020 to January 2021. Regarding the microclimatic variations inside the building, the variations were approximately similar to the thermal and humidity variations recorded outside.
Under these conditions, the data loggers located in the northern rooms were 0.3 °C warmer (Table 5) and 0.6% less humid (Table 6) than the sensors installed in the southern part of the building. The most important feature of the air temperature distribution inside the museum was the higher air temperature in the rooms situated in the northern part of the building. This was an effect of the thermal efficiency of the building which was designed with smaller rooms on its northern flank, that could more easily be kept warm during winter, and larger rooms in the southern flank which could benefit from insolation, even during winter. Thus, the dimensions of the rooms represent a key element of the building infra-climatic stability.
According to the data recorded in the museum rooms, the lowest mean monthly air temperature was recorded in April (14.8 °C in the northern rooms and 14.7 °C in the southern room), and the highest mean monthly air temperature was recorded in August (25.8 °C in the northern rooms and 26.0 °C in the southern room). The minimum air temperature recorded in April represented a consequence of stopping the central heating system of the Museum combined with the lower temperature outside. The differences between the indoor (14.7 °C) and outdoor (12.6 °C) mean air temperatures in April were extremely low compared to the rest of the year (12.6 °C).
In Figure 7, it is apparent that the lack of central heating at the beginning of March 2020 caused a rapid decrease in temperature until April followed by a constant increase in the temperature until August. The temperature increases during the summer were correlated with increased values for the outdoor temperature. The basement recorded a clear inertial effect, with an annual maximum at the beginning of September, even though the maximum air temperature in the museum rooms was recorded at the beginning of July. The difference in the annual daily maximum temperature between rooms and basement was almost 4 °C.
Stopping the central heating caused an uncontrolled increase in the relative humidity (Figure 8). The increase in air humidity in the museum’s rooms was closely correlated with the humidity recorded in the basement, which propagated through the elevator shaft. Two peaks in the annual evolution of relative humidity occurred, one related to the increase in absolute humidity in June, and the second corresponding to the decrease in temperature in October.
The heating system maintained the relative humidity in optimal condition during winter, but, during very cold conditions outside, the relative humidity decreased below the threshold of 40% which was also detrimental for some cultural artifacts. In turn, the basement humidity was driven by water infiltration from the underground and by the lower temperatures recorded there during the warm season. In these conditions, in June, the relative humidity even exceeded the threshold of 80%, which could have been harmful to some pieces from the rock collection exposed there.
Figure 9 shows the variation in air temperature and humidity obtained by all sensors over a period of one year, by calculating the median, minimum and maximum values, and the corresponding 25th and 75th percentiles.
Table 7 shows that during the warm season (unheated period) median values were higher than those from the cold season (heated period), and that the variation in temperature and humidity were larger (indicated by the percentile values). The same situation was observed by Ferdyn-Grygierek et al. [23] when they analyzed three museums in Poland (temperate climate).
The analysis of external heat and moisture gain impact was carried out in the warm season (March until October), using the mean daily values for air temperature and moisture. During the observations made, the external temperature varied from 9.3 to 24.3 °C and the external humidity from 37.8 to 66.8%. The internal temperature varied in the range 13.7–22.6 °C in the basement and 14.6–25.9 °C in the upper rooms, while air humidity varied from 53.1–81.3% in the basement and 47.8–64.4% in the rest of the rooms. Table 8 shows the correlations between the indoor and outdoor air temperatures illustrating the increase in indoor heat. Only the temperature values in the basement did not follow the general trend.
Figure 10 shows the outdoor impact of temperature values on indoor microclimate.
Table 9 shows the correlations between indoor and outdoor air humidity.
A correlation close to 1 was observed for the S1, S2 and S4 sensors, while a weak correlation obtained for the S5 sensor in relation to the others is explained by the impact of outdoor humidity on indoor air humidity. It was observed that the indoor humidity in the basement had higher values than the outdoor humidity.
Figure 11 shows the impact of the outdoor air humidity on the indoor climate, during the entire period.
Table 10 shows the ASHRAE classification for the NW room, NE room, SE Room and basement. The NW room, NE room, and SE room were designated Class C and D and could easily achieve Class B. The basement could not protect collections from mold, but could achieve Class D.
To avoid physical problems in museum buildings, it is recommended to meet the ASHRAE Class B standard, that requires an indoor temperature between 15 °C and 25 °C, an indoor air relative humidity between 40% and 60%, with maximum hourly and daily temperature fluctuations no more than 5 °C, and maximum hourly and daily relative humidity fluctuations not exceeding 10%. Table 10 shows that, due to the large seasonal fluctuation of relative humidity and temperature, the Class AA criteria had a low value. Class B criteria, in which seasonal and short fluctuations may vary more (Table 3), a similarity of approximately 80.1 and 98.6% of the time was observed. For classes C and D, with the highest values, RH remained below 75% for NV, NE, SE rooms. The risk for objects displayed in these rooms is best described by classes C and D, as the criteria for class C and D have been met 100% of the time.
Figure 12, Figure 13, Figure 14 and Figure 15 show the climate evaluation charts for ASHRAE Class B for indoor climate for the north-east, north-west, and south-east rooms and basement, as developed by Martens et al. [38].
The basis for the charts is a standard psychrometric chart for air. The indoor climate is represented by colors for every season. They also show hourly and daily changes in temperature and relative humidity. These charts can be used to understand indoor climate performance by following the blue lines. As a total distribution, the indoor climate conditions for Class B in the NE room, SE room, and NW room were 51% (performance), 53%, and 56%, respectively, while in the basement, the climate condition value was very low, at 24%.

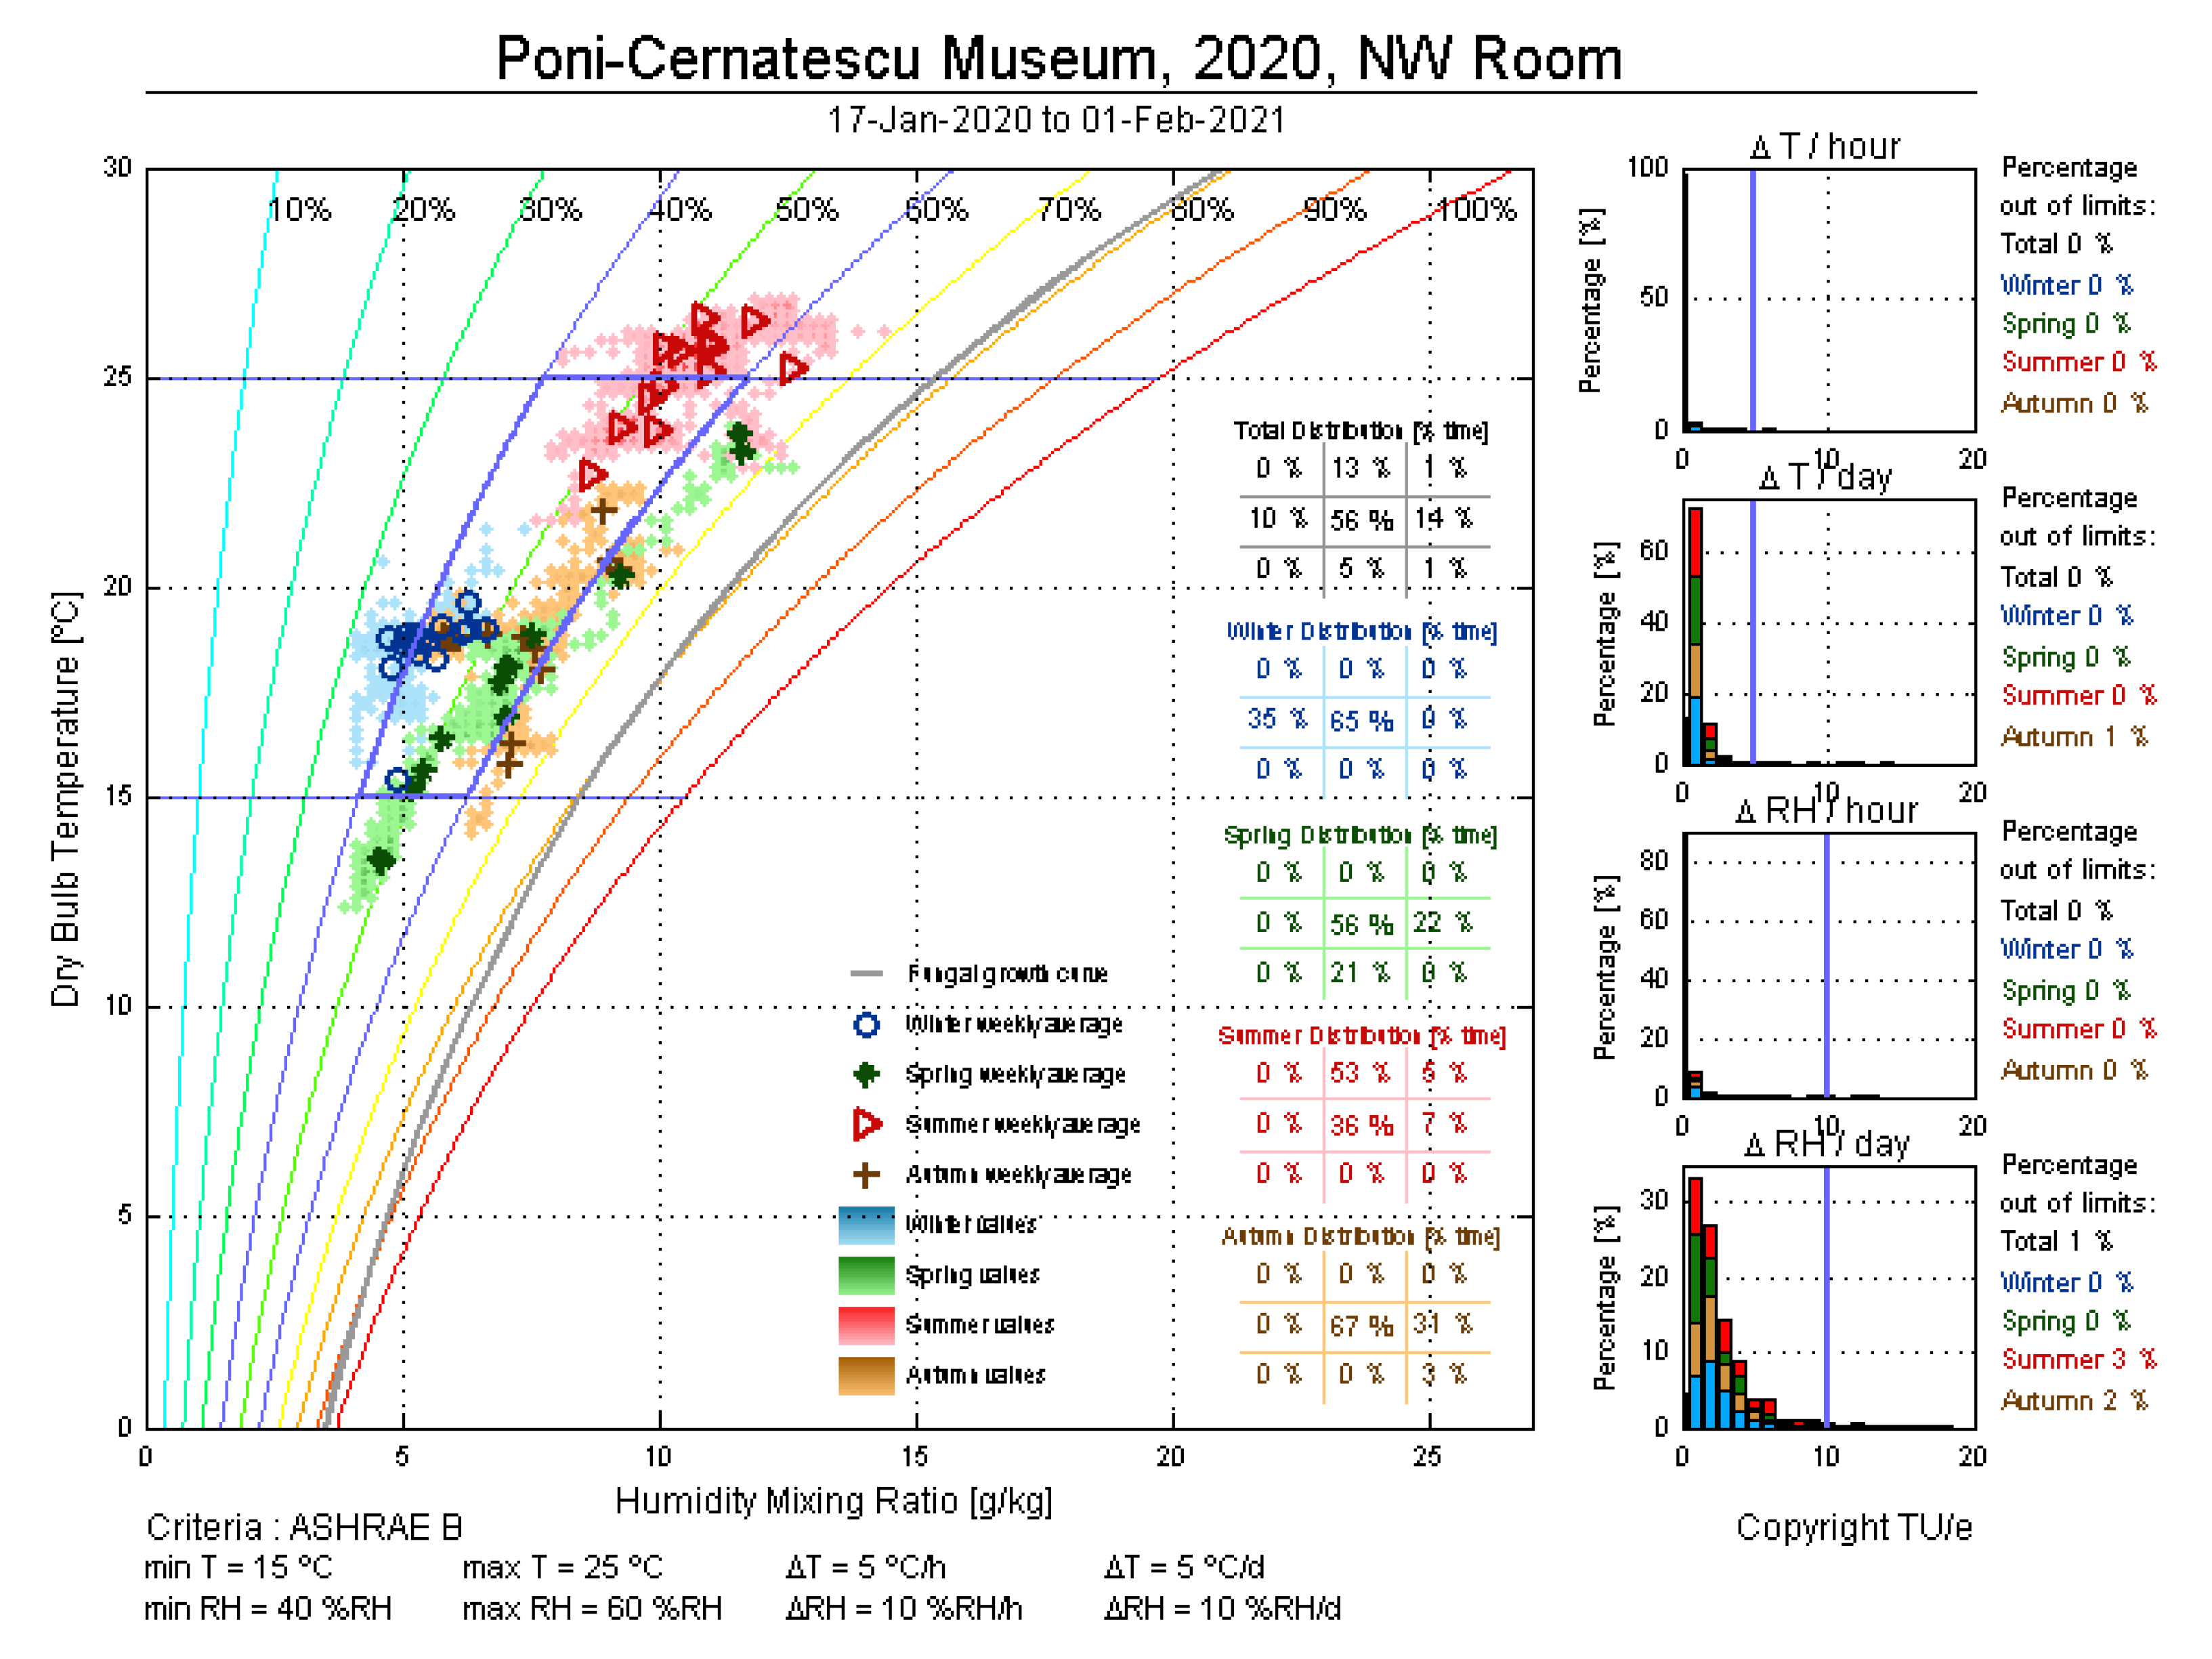
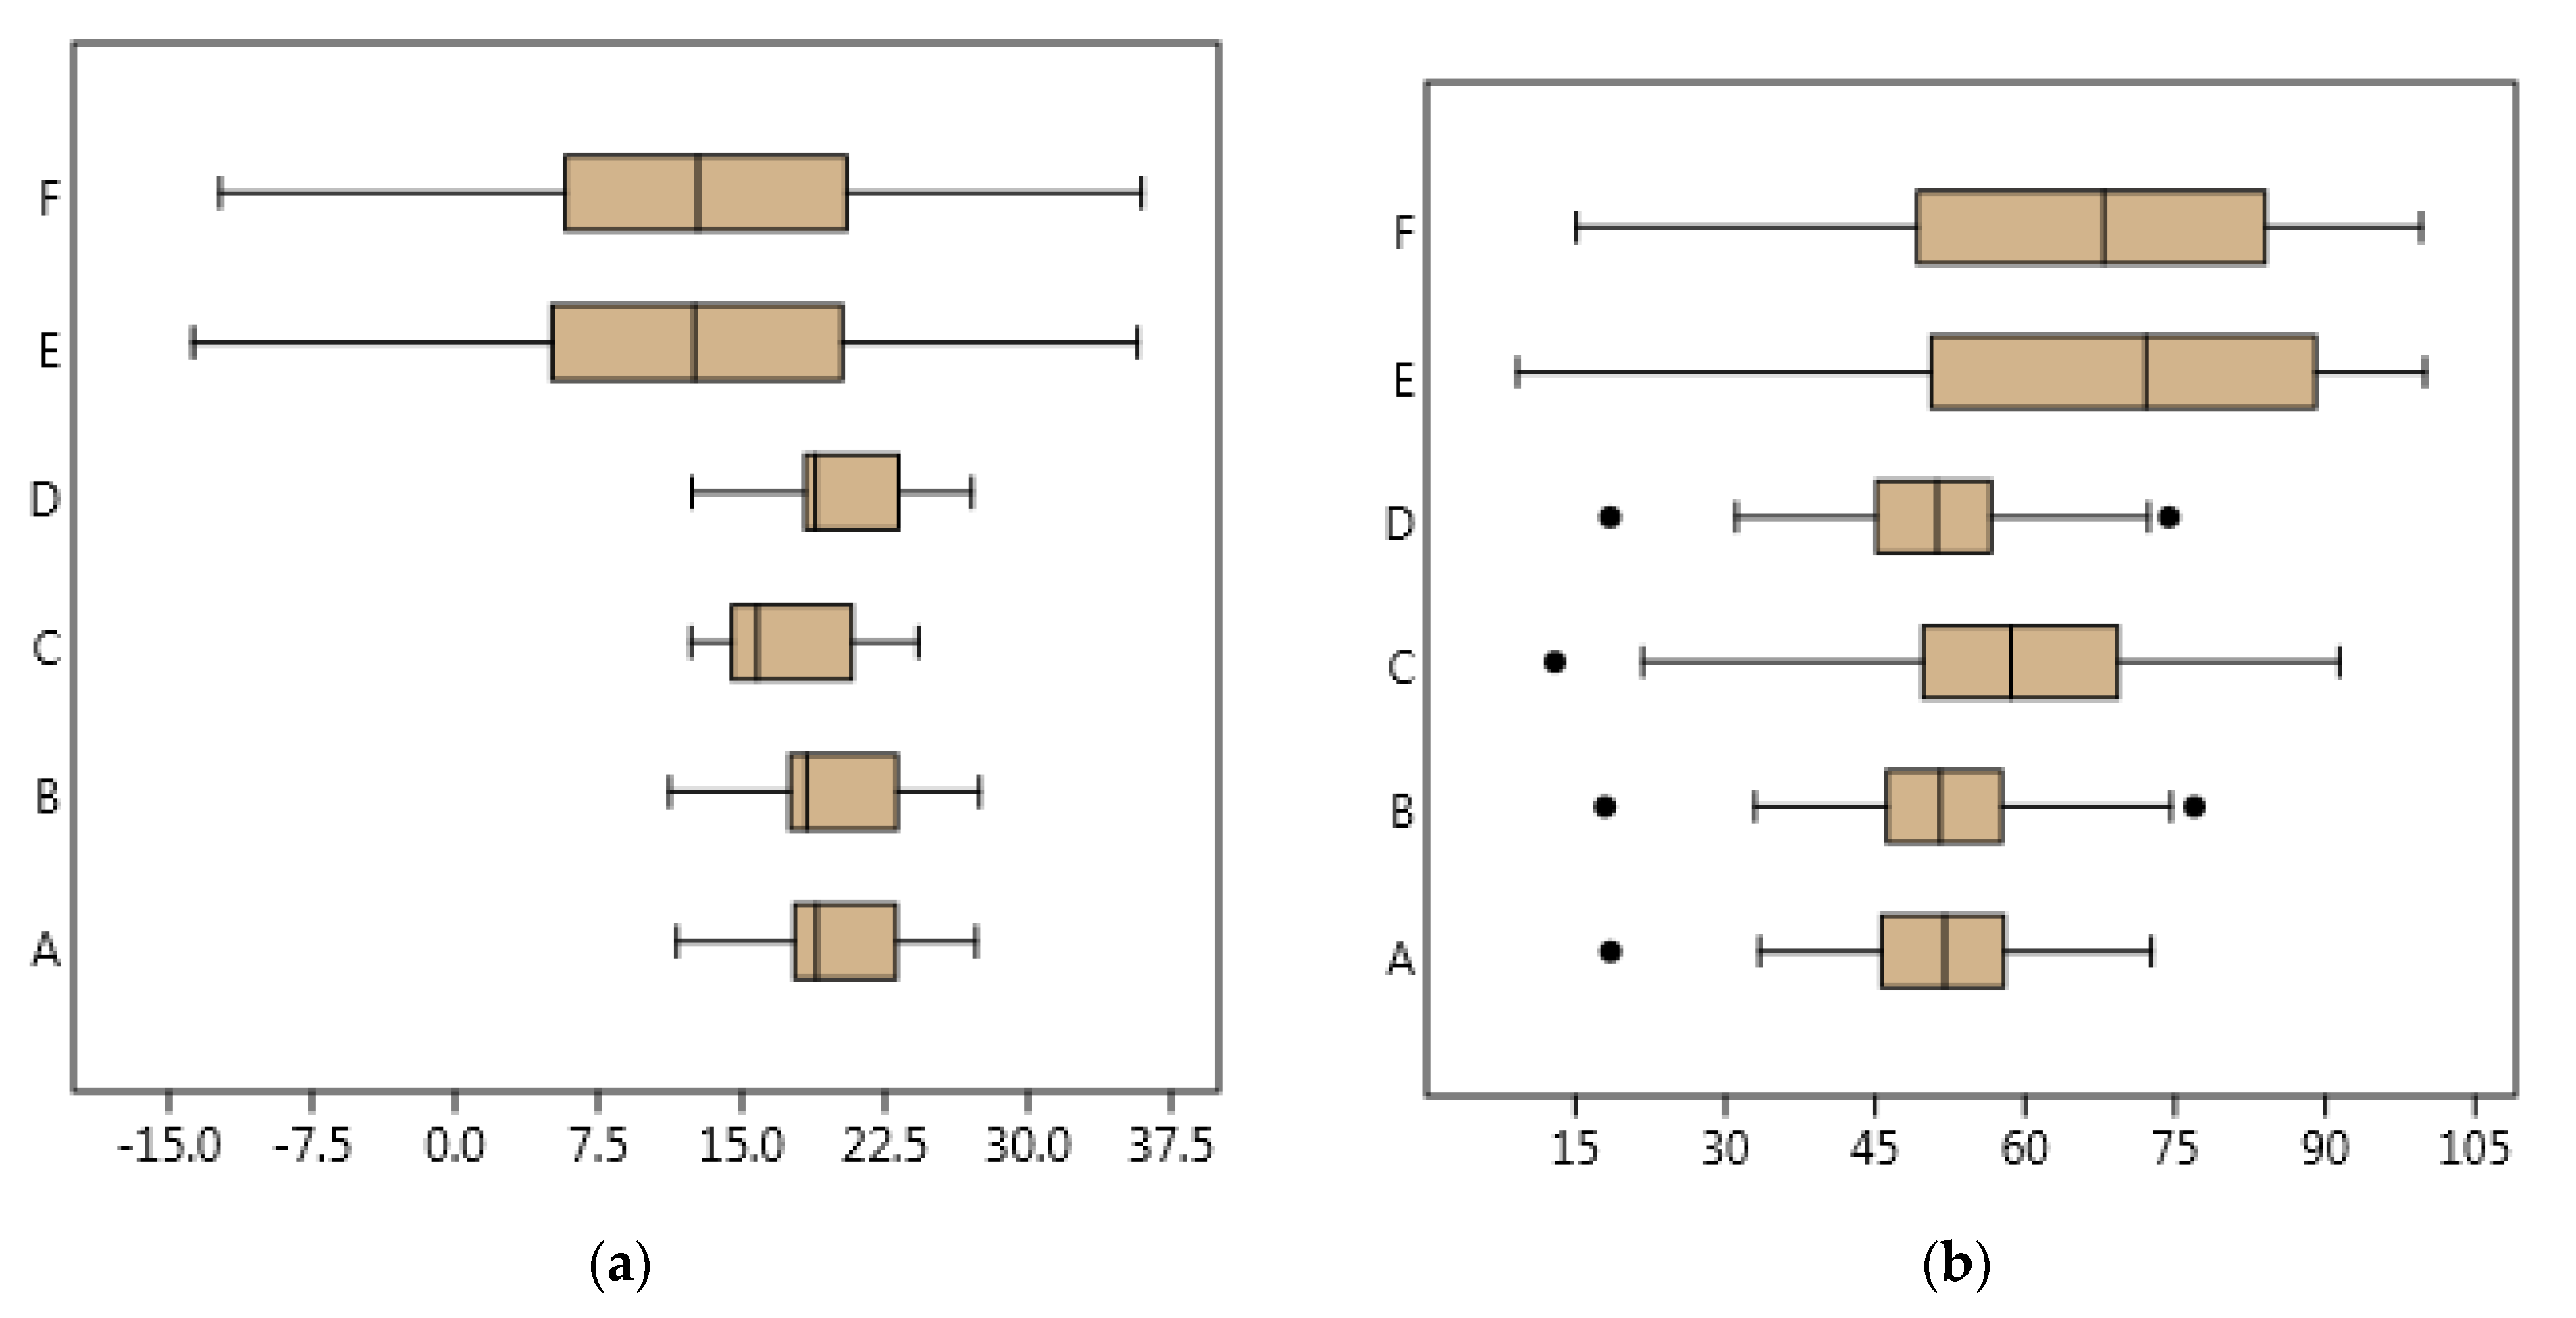
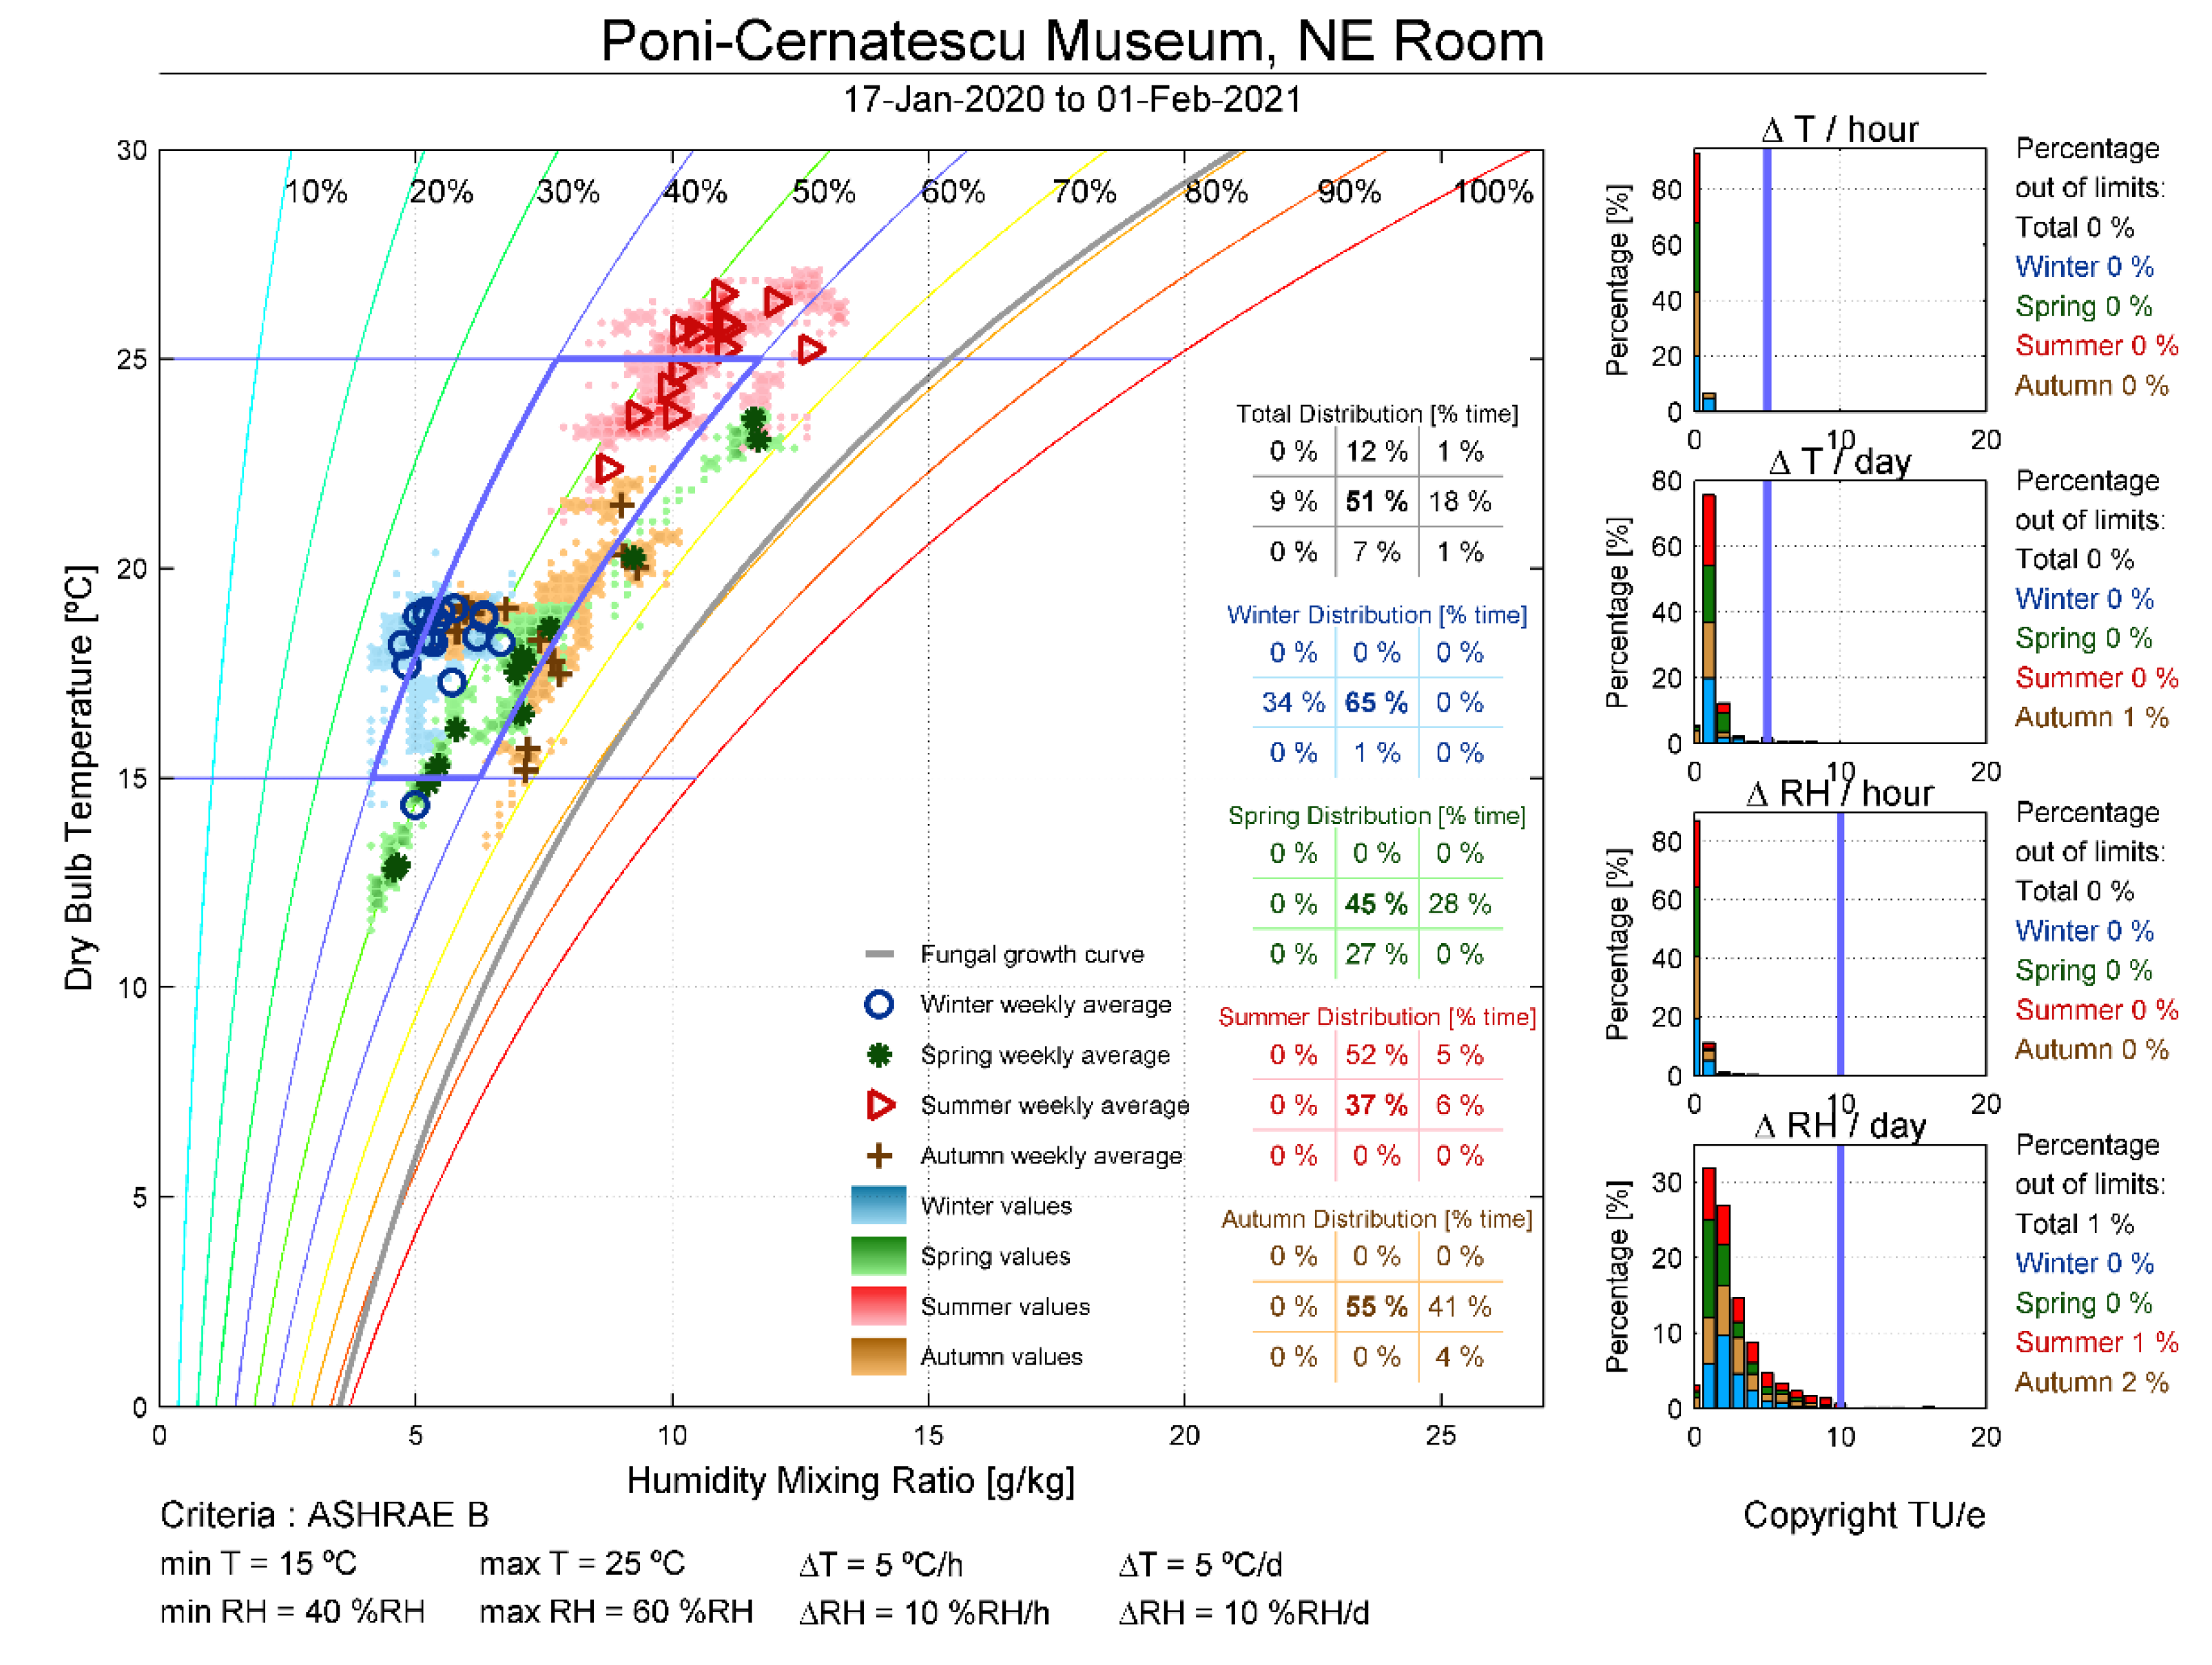
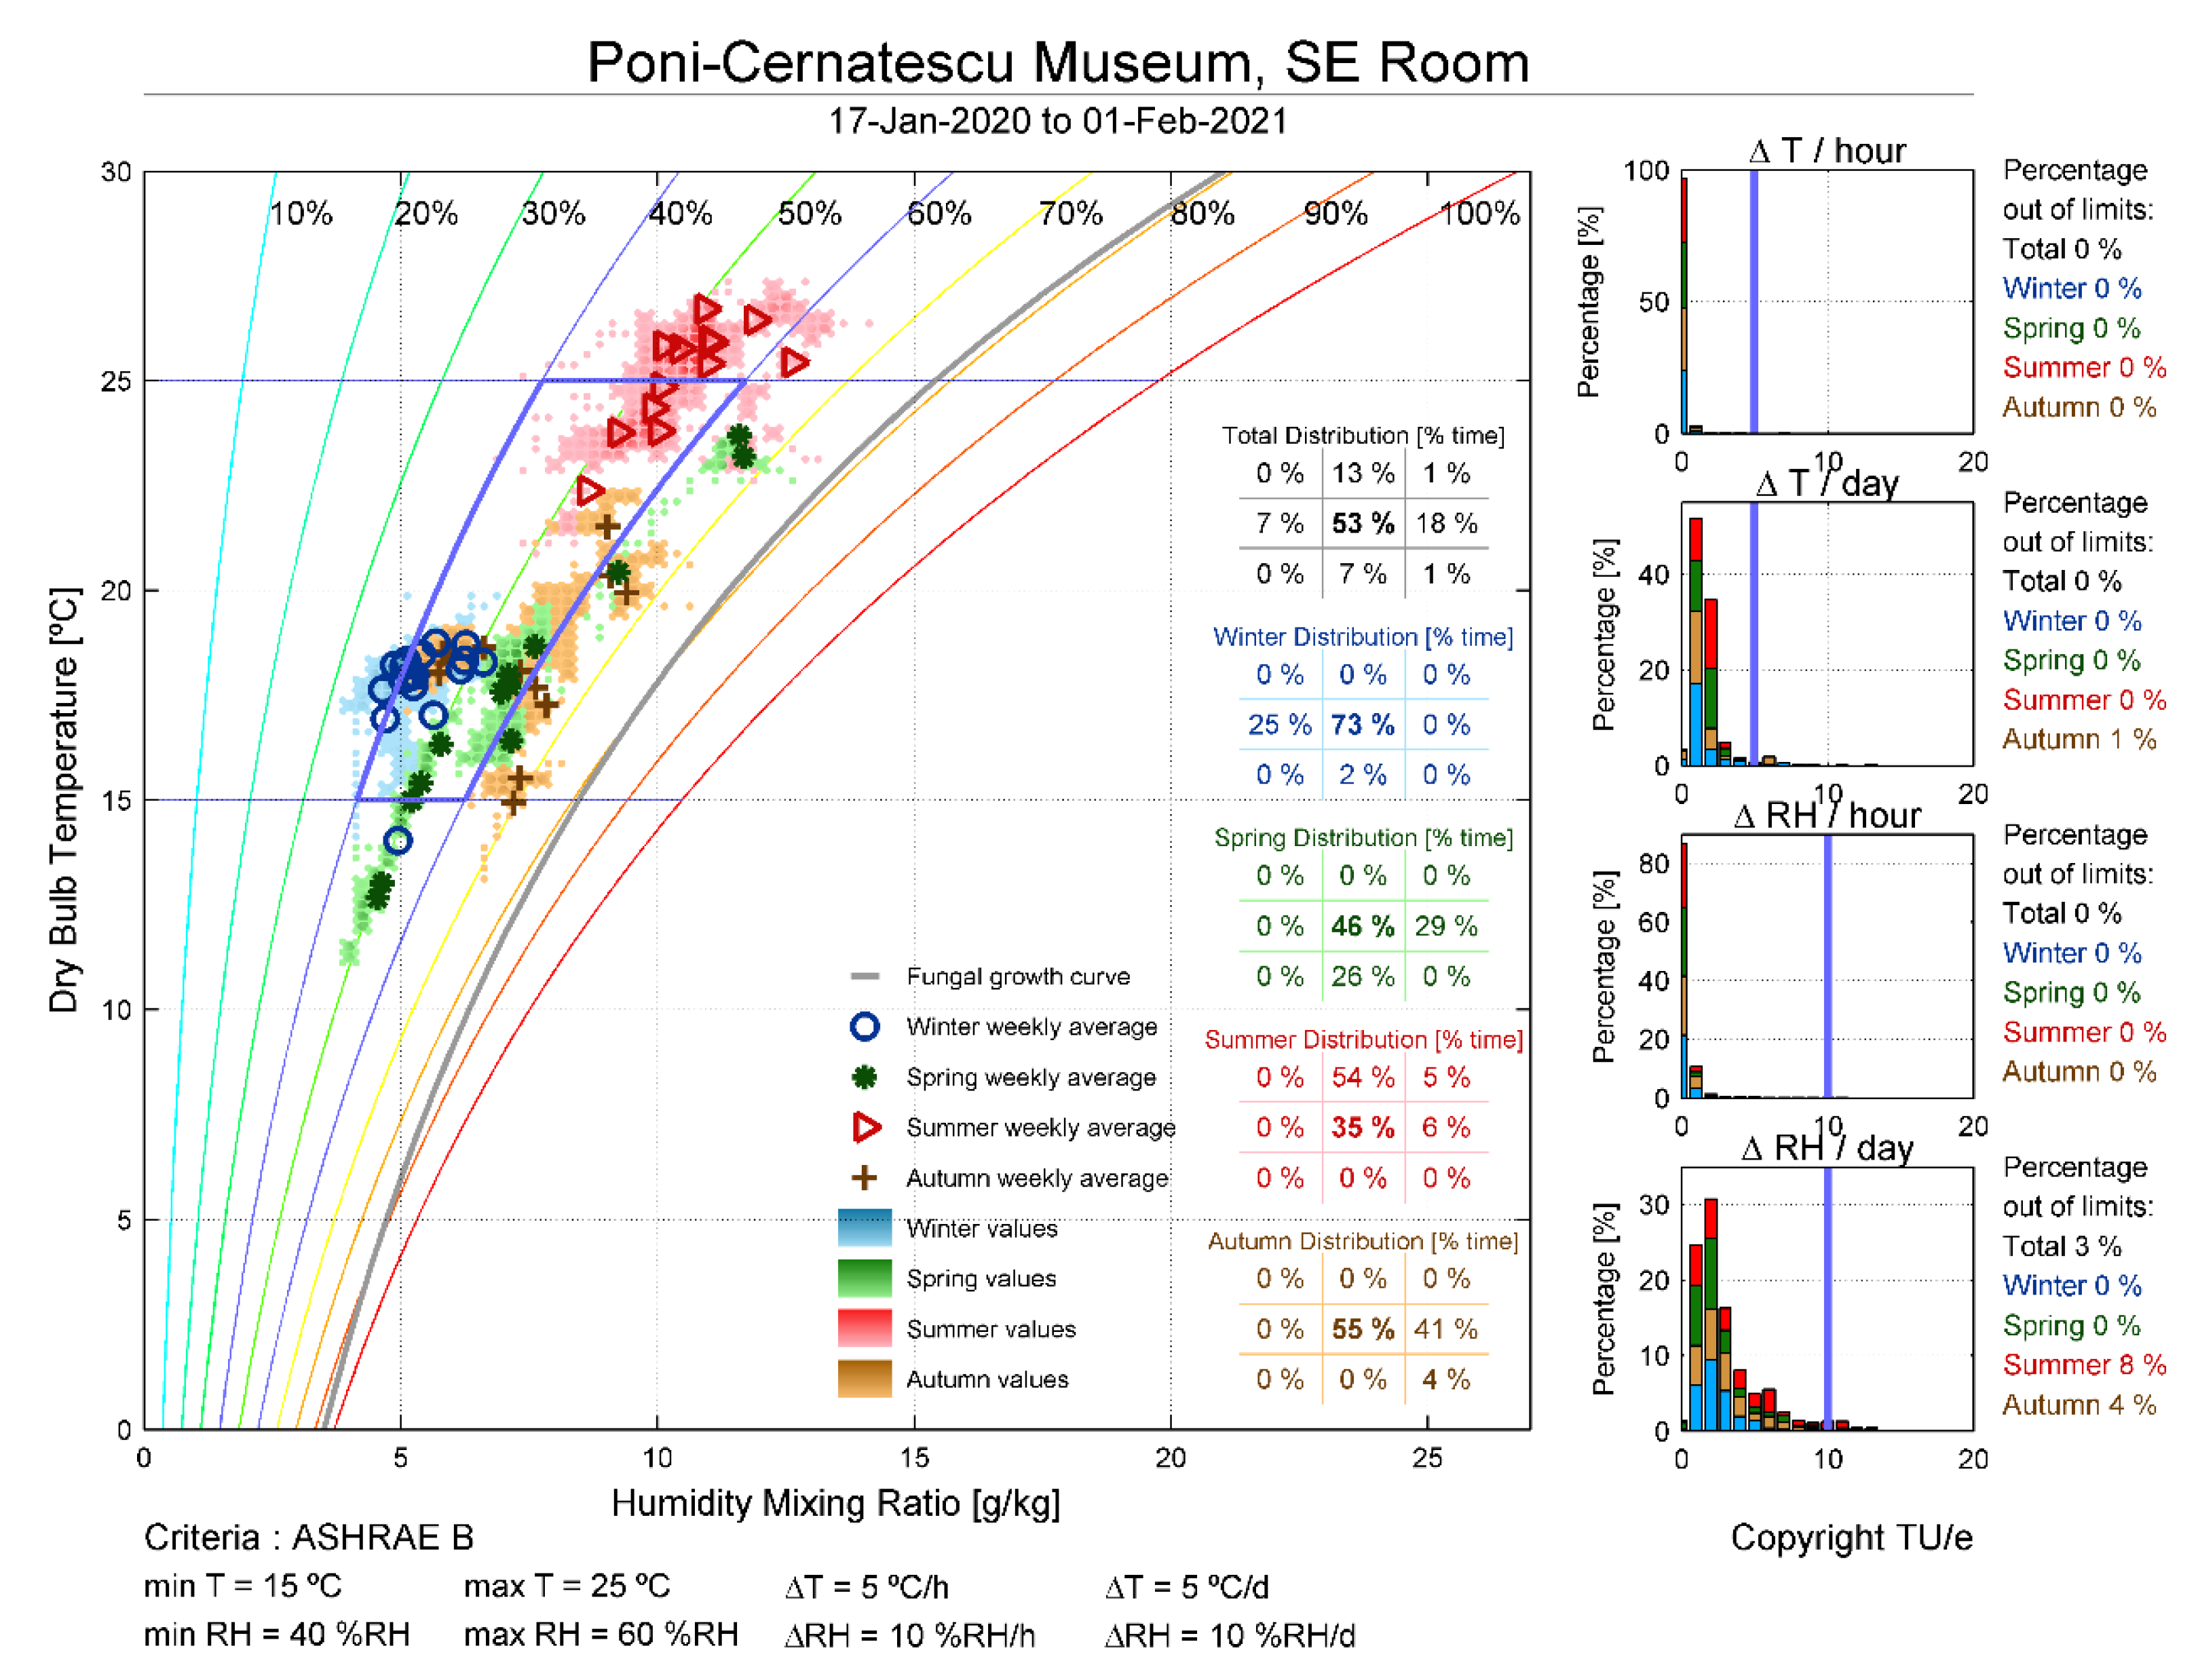
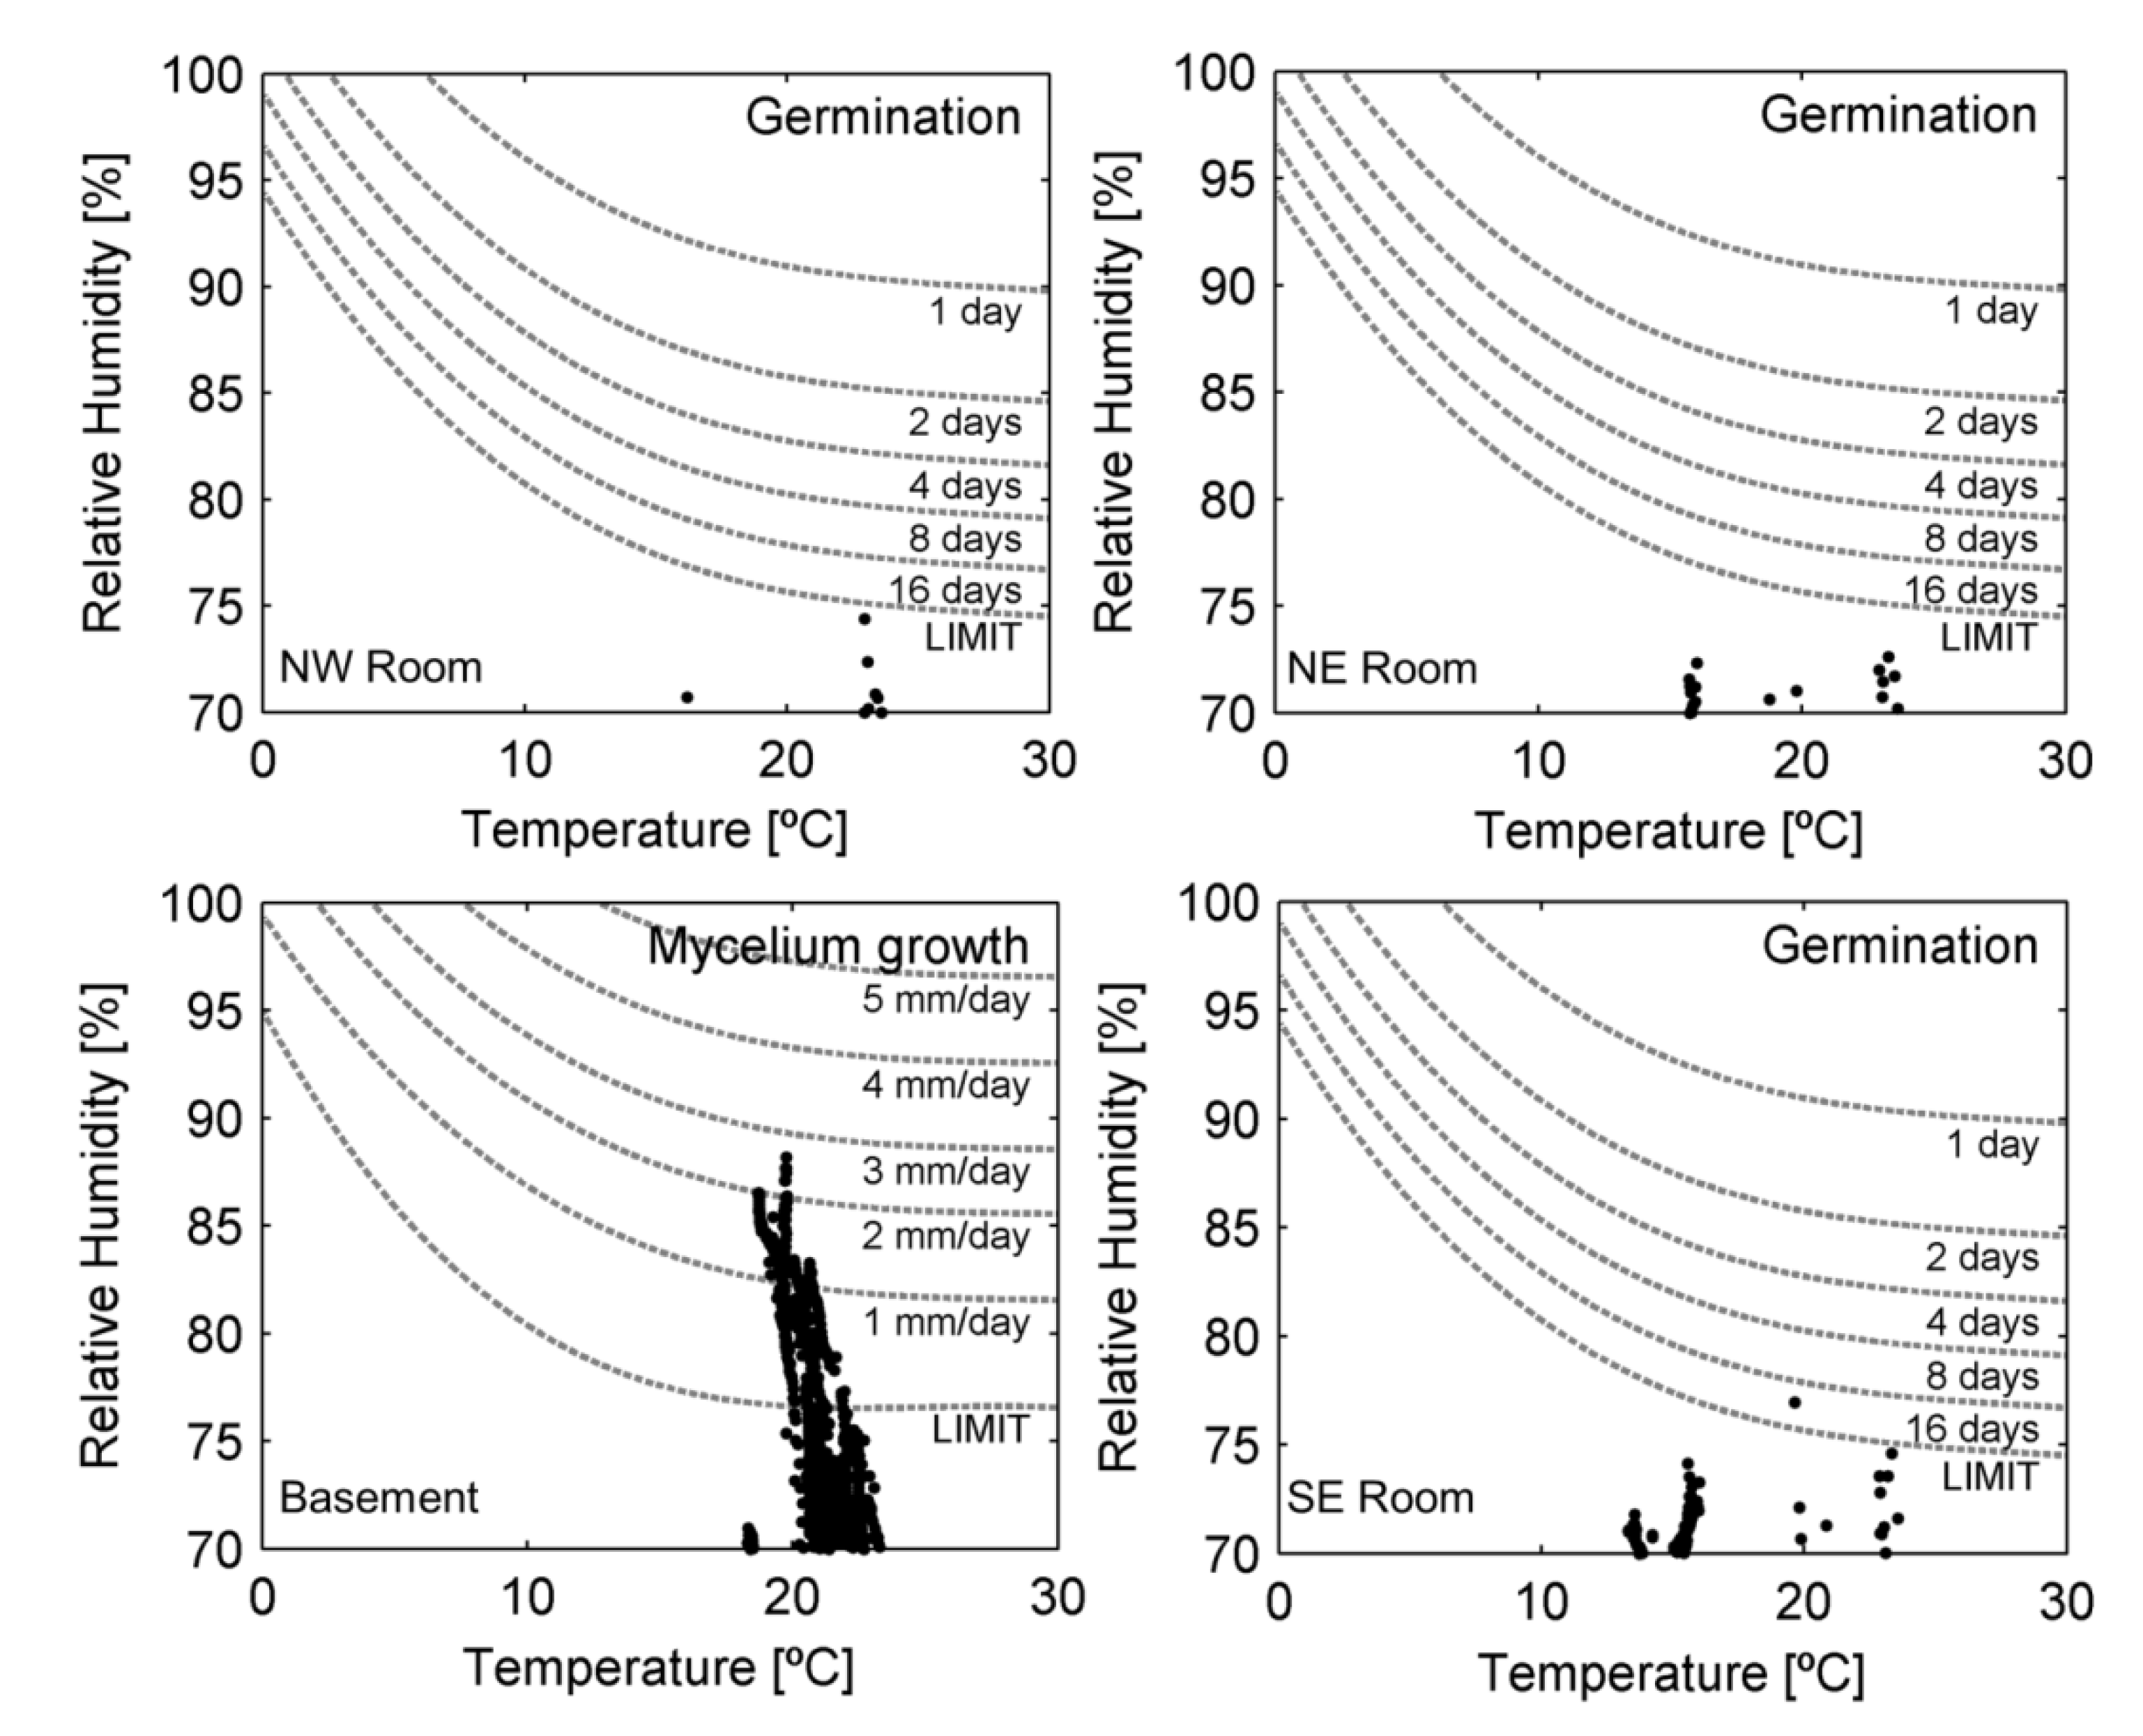
3.3. Specific Climate Risk Assessment Results

A specific climate risk assessment model for museum artifacts has been developed by Martens [38]. This model predicts the risk of biological, chemical, and mechanical degradation for paper objects (books, documents, etc.), panel paintings, wooden furniture and wooden statues, of which museum collections are comprised. The temperature and moisture content of the air are related properties.
Biological processes of damage begin when certain conditions of air temperature and relative humidity are met: the temperature should be between 0 °C and 50 °C and the relative humidity should be higher than 70% [51]. The total growth of active fungi is calculated based on the growth rate. A prediction of mold growth for the NW room, NE room, SE room, and basement, based on the indoor climate conditions, is shown in Figure 16.
It was predicted that no germination would occur in the NW room, NE room and SE room, for which no mold growth was expected, while in the basement, favorable conditions for mycelium growth occurred. Table 11 shows the predicted annual mold growth for each room based on the indoor climate measurements.
Major preservation problems are due to chemical changes that are influenced by storage T (°C) and RH (%). All organic materials in collections deteriorate because of chemical reactions that go faster or slower according to T (°C) and RH (%). Examples of chemical deterioration are the discoloration and embrittlement of paper due to chemical changes at the molecular level through chain scission in cellulose molecules. The rate of attack on cellulose linkages varies over time, depending on the temperature and moisture content of the paper. Higher temperatures cause molecules to move faster, collide more and react more rapidly with each other. With higher humidity more water is available for hydrolysis reactions [52,53,54,55,56]. Table 12 shows the deterioration processes that are related to an incorrect indoor climate.
Mechanical forms of deterioration are warping of paper sheets or wooden panels, splitting of wood veneers, gelatin delaminating of glass plate negatives, shrinkage of textiles, etc. Changes in moisture content of these materials cause them to swell or shrink. When such reversible dimensional changes are uniform and unrestrained, they usually do no harm [57]. Sometimes, however, if layers that swell are bonded to layers that do not, or if one part of an object has more moisture than another, deformations, delamination or cracks will result. Both welling and shrinking can be destructive and such problems can occur at any time in the life of a susceptible object. RH (%) is the principal environmental factor concerned here; as long as the moisture content of the objects remains fairly constant, temperature changes or the absolute level of temperature have relatively little bearing on these problems [58]. The predicted risk of mechanical degradation for each room is shown in Table 13.
Artifact preservation indices are used for quantitative risk analysis. The correct interpretation of the preservation indices facilitates the decision-making process regarding the establishment of the risks of deterioration of the cultural goods.
The preservation index (PI) indicates the effects of a constant amount of temperature and relative humidity on the chemical deterioration of artifacts on a yearly basis [58].
The dew point (DP) is the temperature to which air must be cooled in order for water vapors in it to condense into dew or frost. Knowing the dew point can help achieve the preservation of collections.
The equilibrium moisture content (EMC) of a hygroscopic or organic material represents the moisture content at which the material is neither gaining nor losing moisture.
Table 14 shows the three indices calculated [40] for the monthly mean temperature and for mean humidity in the north-west room and the basement (Table 6 and Table 7). PI and EMC indices are described in Table A1 from Appendix A.
In Table 13, it was evident that, in the summer months, the preservation indices were the lowest, so the favorable conditions required for storing the artifacts were not met. Sharifa et al. [14] calculated the PI values for a period of 18 months for the Bonyad Museum and concluded that these values increased in cold seasons, as seen in Table 11. The decrease in temperature in the hot season, and the decrease in relative humidity in the cold season, will increase the PI values, as concluded by Bienvenido-Huertas et al. [24]. These authors also found that PI values were very low in historic buildings with a deficient indoor climate.

4. Conclusions and Recommendations

Cultural artifacts are affected by the physico-chemical factors that characterize the museum microclimate. These are influenced by the architectural characteristics of the building in which the artifacts are kept, the building materials, as well as the external climate. In this paper, the air humidity and temperature values inside and outside the building of the “Poni-Cernătescu” Museum in Iași were measured and recorded over a period of one full year, with the aim of carrying out an analysis of their impact on museum heritage assets.
Measurements showed that fluctuations in indoor air temperature and humidity were caused by the synergic action of the building’s heating/ventilation system and weather variation outside. The evaluation of the monitored data indicated that the existing climate control system, although designed to ensure conditions for the conservation of the collection, has been able to properly maintain the stability in relation to the relative humidity in the environment of collection. During the cold season, between October 2019 and March 2020, the operation of the heating system created relatively good conditions for the preservation of cultural goods. The ceasing of central heating (March–October 2020) led to higher fluctuations in the two parameters studied, which was driven by the outside weather conditions. One of the problems was related to the low humidity levels in winter. This can be interpreted as a result of the air heating system, the functioning of which was not balanced by a humidifier. These sudden shifts in air humidity and temperature should be avoided, as preventive conservation requires constant values of microclimate parameters in order to avoid the risks of degradation and deterioration of the constituent materials of cultural goods. Therefore, sensors that emit alert signals when normal temperature and relative humidity change would be recommended.
The minimum air temperature recorded in April was a consequence of the shutdown of the central heating system of the Museum and the fact that the warmth from outside was being used to increase the temperature of the brick walls. The increase in humidity in the museum rooms in this period of the year also correlated with the increase in humidity in the basement that propagated through the elevator shaft. The increased humidity of the basement almost throughout the year was a consequence of the infiltration of groundwater that penetrated through the capillaries into the walls of the building. One solution to stop the input of wet air from the basement would be to seal the elevator shaft and use a waterproof barrier for water vapor. Another solution would be the use of appliances to dry the air in the room, or a combination of these recommendations.
In this study, indices that analyze the environment for the preservation of cultural goods in museums were calculated to describe the environmental space and explain the type of deterioration of cultural artifacts. The study provided a climate-induced risk assessment based on the chemical, biological and mechanical risks for the preservation of cultural artifacts in the “Poni-Cernătescu” Museum. It was found that the climate conditions in the Basement were conducive to mold development in the summer months due to high RH values. The lower PI values during summer draw attention to the correction of the microclimatic conditions in the basement as well as in the upper spaces.
The results obtained show that in the basement favorable conditions for mycelium growth occurred. In the summer months, across the entire museum space, the preservation indices were the lowest, from 20 to 25, so favorable conditions for storing the artifacts were not met.

Author Contributions

Conceptualization, P.I., O.F., L.S. and I.S.; methodology, P.I. and L.S.; formal analysis, P.I. and L.S.; data curation, P.I. and O.F.; writing—original draft preparation, P.I., O.F., L.S. and A.-L.K.-A.; writing—review and editing, L.S., O.F. and I.S.; data acquisition, P.I., L.S., O.F., A.-L.K.-A. and M.N.; O.F., P.I. and L.S. are equally the main authors of this paper. All authors have read and agreed to the published version of the manuscript.

Funding

This research received no external funding.

Acknowledgments

Pavel Ichim is supported by the Romanian Young Academy, which is funded by Stiftung Mercator and the Alexander von Humboldt Foundation, for the period 2020–2022.

Conflicts of Interest

The authors declare no conflict of interest.

Appendix A

Figure A1. Measurement accuracy and measurement range for HOBO U23-001A Pro v2 data-loggers (https://www.onsetcomp.com/products/data-loggers/u23-001a/, accessed on 10 October 2021).
Applsci 12 03313 g0a1
Table A1. PI and EMC indices.
MechanismScientific BasisApplicationPreservation MeasureAlgorithmInterpretation
Chemical deteriorationChemical reaction kineticsOrganic materials (paper, fabrics, wood, etc.)Preservation index (PI)Calculated from temperature and humidity dataComparative analysis: when it is higher, it is better
Physical and mechanical deteriorationsTypical wood physical behaviorHygroscopic materials (wood, paper, fabrics, etc.)Moisture content in equilibrium conditions (EMC)Estimating EMC variations over timeRisk in extreme conditions:
max EMC > 12.5%, min EMC < 5%—risk
min EMC > 5%, max EMC < 12.5%—good

References

  1. Spiridon, P.; Sandu, I. Museums in the Life of the Public. Int. J. Conserv. Sci. 2016, 7, 87–92. [Google Scholar]
  2. Sandu, I.C.A.; Spiridon, P.; Sandu, I. Current Studies and Approaches in the Field of Cultural Heritage Conservation Science. Harmonising the Terminology in an Interdisciplinary Context. Int. J. Conserv. Sci. 2016, 7, 591–606. [Google Scholar]
  3. Spiridon, P.; Sandu, I.; Stratulat, L. The Conscious Deterioration and Degradation of the Cultural Heritage. Int. J. Conserv. Sci. 2017, 8, 81–88. [Google Scholar]
  4. Lucchi, E. Review of preventive conservation in museum buildings. J. Cult. Herit. 2018, 29, 180–193. [Google Scholar]
  5. Florescu, O.; Sandu, I.C.A.; Spiridon-Ursu, P.; Sandu, I. Integrative Participatory Conservation of Museum Artefacts. Theoretical and Practical Aspects. Int. J. Conserv. Sci. 2020, 11, 109–116. [Google Scholar]
  6. Pavlogeorgatos, G. Environmental parameters in museums. Build. Environ. 2003, 12, 1062–1457. [Google Scholar]
  7. Romano, F.; Colombo, L.P.M.; Gaudenzi, M.; Joppolo, C.M.; Romano, L.P. Passive control of microclimate in museum display cases: A lumped parameter model and experimental tests. J. Cult. Herit. 2015, 16, 413–418. [Google Scholar]
  8. Camufo, D.; Bernardi, A.; Sturaro, G.; Valentino, A. The microclimate inside the Pollaiolo and Botticelli rooms in the Uffizi Gallery, Florence. J. Cult. Herit. 2002, 3, 155–161. [Google Scholar]
  9. Fabbri, K. Historic climate in heritage building and standard 15757: Proposal for a common nomenclature. Climate 2022, 10, 4. [Google Scholar]
  10. Varas-Muriel, M.J.; Fort, R.; Martinez-Garrigo, M.I.; Zornoza-Indart, A.; Lopez-Arce, P. Fluctuations in the indoor environment in Spanish rural churches and their effects on heritage conservation: Hygro-thermal and CO2 conditions monitoring. Build. Environ. 2014, 82, 97–109. [Google Scholar]
  11. Sandu, I. Deteriorareașidegradareabunurilor de Patrimoniu Cultural. Bunuri Din Material Organice; Universității “AlexandruIoanCuza”: Iași, Romania, 2008; Volume II. [Google Scholar]
  12. Verticchio, E.; Frasca, F.; Bertolin, C.; Siani, A.M. Climate-indiced risk for the preservation of paper collections: Comparative study among three historic libraries in Italy, Build. Environ. 2021, 206, 108394. [Google Scholar]
  13. Pisello, A.L.; Castaldo, V.L.; Castellini, I.; Cotana, F. Experimental evaluation of the indoor thermal environment of an Italian historical subterranean museum space. In Proceedings of the 14th CIRIAF National Congress, Energy, Environment and Sustainable Development, Perugia, Italy, 4–5 April 2014. [Google Scholar]
  14. Sharifa, S.; Zamani Farda, A.; Esmaeili, V. Risk assessment in the field of museum resource management: Objects preventive conservation approach. Uncertain Supply Chain Manag. 2013, 1, 219–230. [Google Scholar]
  15. Zarzo, M.; Perles, A.; Mercado, R.; García-Diego, F.J. Multivariate Characterization of Temperature Fluctuations in a Historical Building Using Energy-Efficient IoT Wireless Sensors. Sensors 2021, 21, 7795. [Google Scholar]
  16. Nawalany, G.; Sokolowski, P.; Michalik, M. Analysis of the Operation of an Unheated Wooden Church to the Shaping of Thermal and Humidity Conditions Using the Numerical Method. Energies 2021, 14, 5200. [Google Scholar]
  17. Scatigno, C.; Martinez, M.P.; Prieto-Taboada, N.; Madariaga, J.M.; Conte, A.M. Petrographic-Mineralogical Characterization of Archaeological Materials from “Casa di Diana” Mithraeum Sited in the Open Museum of Ostia Antica. Crystals 2021, 11, 839. [Google Scholar] [CrossRef]
  18. Gawade, D.R.; Ziemann, S.; Kumar, S.; Iacopino, D.; Belcastro, M.; Alfieri, D.; Schuhmann, K.; Anders, M.; Pigeon, M.; Barton, J.; et al. A Smart Archive Box for Museum Artifact Monitoring Using Battery-Less Temperature and Humidity Sensing. Sensors 2021, 21, 4903. [Google Scholar] [CrossRef]
  19. Palomar, T.; Garcia-Patron, N.; Pastor, P. Spanish Royal glasses with crizzling in historical buildings. The importance of environmental monitoring for their conservation. Build. Environ. 2021, 202, 108054. [Google Scholar]
  20. Environmental Guidelines ICOM-CC, and ICC Declaration. Available online: http://www.icom-cc.org/332/-icom-cc-documents/declaration-on-environmental-guidelines/#.VgnbvM7Bxap (accessed on 13 May 2021).
  21. Ni, Z.J.; Liu, Y.; Karlsson, M.; Gong, S.F. A Sensing System Based on Public Cloud to Monitor Indoor Environment of Historic Buildings. Sensors 2021, 21, 5266. [Google Scholar] [CrossRef]
  22. Moretti, E.; Sciurpi, F.; Stamponi, E.; Fiore, M. Microclimatic monitoring for book heritage preservation in historic buildings: Preliminary investigation on “Sala del Dottotato” in Palazzo Murena, Perugia, Italy, HERITECH 2020. In Proceedings of the IOP Conference Series: Materials Science and Engineering, Chennai, India, 16–17 September 2020; Volume 949. [Google Scholar] [CrossRef]
  23. Ferdyn-Grygierek, J.; Kaczmarczyk, J.; Blaszczok, M.; Lubina, P.; Koper, P.; Bulińska, A. Hygrothermal Risk in Museum Buildings Located in Moderate Climate. Energies 2020, 13, 344. [Google Scholar]
  24. Bienvenido-Huertas, D.; León-Muñoz, M.; Martín-del-Río, J.J.; Rubio-Bellido, C. Analysis of climate change impact on the preservation of heritage elements in historic buildings with a deficient indoor microclimate in warm regions. Build. Environ. 2021, 200, 107959. [Google Scholar]
  25. Verticchio, E.; Frasca, F.; Garcìa-Diego, F.-J.; Siani, A.-M. Investigation on the use of passive microclimate frames in view of the climate change scenario. Climate 2019, 7, 98. [Google Scholar]
  26. Conservation Physics Index. Available online: https://www.conservationphysics.org/intro/fundamentals.html (accessed on 13 May 2021).
  27. Sandu, I.C.A.; Sandu, I.; Popoiu, P.; Donzé van Saanen, A. Aspecte Metodologice Privind Conservarea Științifică a Patrimoniului Cultural; Corson: Iași, Romania, 2001; pp. 165–167. [Google Scholar]
  28. Saraiva, N.F.; Baía da Silva, G.; Adélio, G.; Joaquim da Costa, J. A simulation study to assess the impact of natural ventilation on the hygrothermal behaviour of a historic library using EnergyPlus and its Airflow Network. In Proceedings of the Conference Proceedings in 15th RoomVent 2020 Conference, Turin, Italy, 14–17 February 2021; Politecnico di Torino: Turin, Italy, 2021. [Google Scholar]
  29. Asfahan, H.M.; Sajjad, U.; Sultan, M.; Hussain, I.; Hamid, K.; Ali, M.; Wang, C.-C.; Shamshiri, R.R.; Khan, M.U. Artificial Intelligence for the Prediction of the Thermal Performance of Evaporative Cooling Systems. Energies 2021, 14, 3946. [Google Scholar]
  30. Țurcanu, F.-E.; Popovici, C.-G.; Verdeș, M.; Ciocan, V.; Hudișteanu, S.-V. Indoor Climate Modelling and Economic Analysis Regarding the Energetic Rehabilitation of a Church. Energies 2020, 13, 2815. [Google Scholar]
  31. Ilies, D.C.; Marcu, F.; Caciora, T.; Indrie, L.; Ilies, A.; Albu, A.; Costea, M.; Burta, L.; Baias, S.; Ilies, M.; et al. Investigations of Museum Indoor Microclimate and Air Quality. Case Study from Romania. Atmosphere 2021, 12, 286. [Google Scholar] [CrossRef]
  32. de Rubeis, T.; Falasca, S.; Curci, G.; Paoletti, D.; Ambrosini, D. Sensitivity of heating performance of an energy self-sufficient building to climate zone, climate change and HVAC system solutions. Sustain. Cities Soc. 2020, 61, 102300. [Google Scholar]
  33. Ishikawa, K.; Iba, C.; Ogura, D.; Hokoi, S.; Yokoyama, M. Hygrothermal Analysis of a Museum Storage Room for Metal Cultural Artifacts: Quantification of Factors Influencing High Humidity. Energies 2021, 14, 3309. [Google Scholar] [CrossRef]
  34. Kompatscher, K.; Kramer, R.P.; Ankersmit, B.; Schellen, H.L. Indoor Airflow Distribution in Repository Design: Experimental and Numerical Microclimate Analysis of an Archive. Buildings 2021, 11, 152. [Google Scholar] [CrossRef]
  35. ElAdl, M.; Fathy, F.; Morsi, N.K.; Nessim, A.; Refat, M.; Sabry, H. Managing microclimate challenges for museum buildings in Egypt. Ain Shams Eng. J. 2022, 13, 101529. [Google Scholar]
  36. Efthymiou, C.; Barmparesos, N.; Tasios, P.; Ntouros, V.; Zoulis, V.; Karlessi, T.; Salmerón Lissén, J.M.; Assimakopoulos, M.N. Indoor Environmental Quality Evaluation Strategy as an Upgrade (Renovation) Measure in a Historic Building Located in the Mediterranean Zone (Athens, Greece). Appl. Sci. 2021, 11, 10133. [Google Scholar]
  37. ASHRAE (American Society of Heating, Refrigerating and Air-Conditioning Engineers). Museums, Libraries and Archives. Chapter 21 in 2003 ASHRAE Handbook: Heating, Ventilating and Air-Conditioning Applications; SI Edition, 21.1-21.23; ASHRAE: Atlanta, GA, USA, 2003. [Google Scholar]
  38. Martens, M.H.J. Climate Risk Assessment in Museums: Degradation Risks Determined from Temperature and Relative Humidity Data. Ph.D. Thesis, Technische Universiteit Eindhoven, Eindhoven, The Netherlands, 2012. [Google Scholar] [CrossRef]
  39. Bohm, B.; Ryhl-Svendsen, M. Analysis of the thermal conditions in an unheated museum store in a temperate climate. On the thermal interaction of earth and store. Energy Build. 2011, 43, 3337–3342. [Google Scholar]
  40. Schieweck, A.; Salthammer, T. Indoor air quality in passive-type museum showcases. J. Cult. Herit. 2011, 12, 205–213. [Google Scholar]
  41. Balocco, C.; Vestrucci, S. An Experimental Study of Museum Showcases in Florence Under Real Operating Conditions. Int. J. Conserv. Sci. 2020, 11, 979–996. [Google Scholar]
  42. Nishimura, D.W. Understanding Preservation Metrics; Image Permanence Institute—Rochester Institute of Technology: Rochester, NY, USA, 2011. [Google Scholar]
  43. Dew Point Calculator. Available online: www.dpcalc.org (accessed on 14 October 2021).
  44. Belda, M.; Holtanová, E.; Halenka, T.; Kalvová, J. Climate classification revisited: From Köppen to Trewartha. Clim. Res. 2014, 59, 1–13. [Google Scholar] [CrossRef] [Green Version]
  45. Alexe, C. Some thermic differences in the southern metropolitan area of Iași, AlexandruIoanCuza University Publishing House, Iași, Romania. Present Environ. Sustain. Dev. 2012, 6, 377–393. [Google Scholar]
  46. Sfîcă, L.; Ichim, P.; Apostol, L.; Ursu, A. The extent and intensity of the urban heat island in Iași city, Romania. Theor. Appl. Climatol. 2017, 134, 777–791. [Google Scholar] [CrossRef]
  47. Ichim, P.; Sfîcă, L. The Influence of Urban Climate on Bioclimatic Conditions in the City of Iași, Romania. Sustainability 2020, 12, 9652. [Google Scholar] [CrossRef]
  48. Ichim, P.; Sfîcă, L.; Kadhim-Abid, A.-L.; Ursu, A.; Jitariu, V. Characteristics of nocturnal urban heat island of Iași During a summer heat wave (1–6 of August 2017). Air Water Compon. Environ. Conf. Proc. 2018, 2018, 253–260. [Google Scholar] [CrossRef]
  49. Kadhim-Abid, A.L.; Ichim, P.; Atanasiu, G.M. Seasonal Occurrence of Heat Island Phenomenon in The Urban Built Environment, Environ. Eng. Manag. J. 2019, 18, 1591–1598. [Google Scholar]
  50. Spiridon, P.; Sandu, I. Conservation of cultural heritage: From participation to collaboration. ENCATC J. Cult. Manag. Policy 2015, 5, 43–52. [Google Scholar]
  51. Camuffo, D.; Pagan, E.; Bernardi, A.; Becherini, F. The impact of heating, lighting and people in re-using historical buildings: A case study. J. Cult. Herit. 2004, 5, 409–416. [Google Scholar] [CrossRef]
  52. Lucero-Gomez, P.; Balliana, E.; Izzo, F.C.; Zendri, E. A new methodology to characterize indoor variations of temperature and relative humidity in historical museum buildings for conservation purposes. Build. Environ. 2020, 185, 107147. [Google Scholar] [CrossRef]
  53. Ferdyn-Grygierek, J.; Baranowski, A. Internal environment in the museum building Assessment and improvement of air exchange and its impact on energy demand for heating. Energy Build. 2015, 92, 45–54. [Google Scholar]
  54. Vereecken, E.; Vanoirbeek, K.; Roels, S. A preliminary evaluation of mould prediction models based on laboratory experiments. Energy Procedia 2015, 78, 1407–1412. [Google Scholar]
  55. Michalski, S. The Ideal Climate, Risk Management, the ASHRAE Chapter, Proofed Fluctuations and Toward a Full Risk Analysis Model. In Contribution to the Experts’ Roundtable on Sustainable Climate Management Strategies; Cynthia Godlewski Publisher: Tenerife, Spain, April 2007; pp. 1–17. [Google Scholar]
  56. d’Hont, L.; Ankersmit, B.; Steppers, M. Managing Indoor Climate Risks; Cultural Heritage Agency of the Nederlands: Amersfoort, The Netherlands, 2018. [Google Scholar]
  57. Merritt, J.; Reilly, J. Preventive Conservation for Historic House Museums; Rowman and Littlefield: New York, NY, USA, 2010. [Google Scholar]
  58. Huijbregts, Z.; Kramer, R.P.; Martens, M.H.J.; von Schijnder, A.W.M.; Schellen, H.L. A proposed method to assess the damage risk of future climate change to museum objects in historic buildings. Build. Environ. 2012, 55, 43–56. [Google Scholar]
Figure 1. Location of “Poni-Cernătescu” Museum.
Applsci 12 03313 g001
Figure 2. (a,b) “Poni-Cernătescu” Museum’s underground level, currently the mineralogy section. (a)—before renovation, (b)—after renovation.
Applsci 12 03313 g002
Figure 3. “Poni-Cernătescu” Museum—image from the interior renovation during 2010.
Applsci 12 03313 g003
Figure 4. (a,b) Location of sensors on the ground floor (S1, S2, S4), and external walls (S5, S6) (a), and basement (S3) (b).
Applsci 12 03313 g004
Figure 5. Mean monthly air temperature values for exterior data loggers and University weather station (February 2020 to January 2021).
Applsci 12 03313 g005
Figure 6. Mean monthly air relative humidity for exterior data loggers and University weather station (February 2020 to January 2021).
Applsci 12 03313 g006
Figure 7. Daily mean temperature for inside sensors during 1 February 2020–31 January 2021.
Applsci 12 03313 g007
Figure 8. Daily mean relative humidity for inside sensors during 1 February 2020–31 January 2021.
Applsci 12 03313 g008
Figure 9. Annual median (black line in the colored box), minimum and maximum values outliers and 25–75 percentile of air temperature (a) and air humidity (b) for all sensors (A—S1; B—S2; C—S3; D—S4; E—S5; F—S6).
Applsci 12 03313 g009
Figure 10. Daily mean temperature values for the entire period.
Applsci 12 03313 g010
Figure 11. Daily mean humidity for the entire period.
Applsci 12 03313 g011
Figure 12. Climate evaluation chart of indoor climate conditions in “Poni-Cernătescu” Museum, NW Room, S4 (www.monumenten.bwk.tue.nl, accessed on 26 February 2021).
Applsci 12 03313 g012
Figure 13. Climate evaluation chart of indoor climate conditions in “Poni-Cernătescu” Museum, NE Room, S1 (www.monumenten.bwk.tue.nl, accessed on 26 February 2021).
Applsci 12 03313 g013
Figure 14. Climate evaluation chart of indoor climate conditions in “Poni-Cernătescu” Museum, SE Room, S2 (www.monumenten.bwk.tue.nl, accessed on 26 February 2021).
Applsci 12 03313 g014
Figure 15. Climate evaluation chart of indoor climate conditions in “Poni-Cernătescu” Museum, basement, S3 (www.monumenten.bwk.tue.nl, accessed on 26 February 2021).
Applsci 12 03313 g015
Figure 16. Specific climate risk assessment of mold growth for NW room, NE room, SE room and basement, “Poni-Cernătescu” Museum, 2020 (www.monumenten.bwk.tue.nl, accessed on 23 February 2022).
Applsci 12 03313 g016
Table 1. References on topic.
AuthorObjectiveRegion ClimatePeriod of TimeMethodologyHVAC SystemArtifacts
Bienvenido-Huertas et al., 2021 [24]Artificial intelligence to predict environmental performance in future scenarioswarm2015–2019; 2030–2100UNI 10829
Performance Index
NoWooden objects,
paintings
Ilieș, D.C. et al., 2022 [31]Fungal growthtemperateOctober 2020–March 2021ASHRAE Standard
API® 20 C AUX identification system
NoTextile
De Rubeis, T. et al., 2020 [32]Sensitivity of heating performance of energy self-sufficient buildingwarmSeptember 2019–November 2020EnergyPlus simulation model.yesN/A
Ishikawa, K. et al., 2021 [33]Hygrothermal analysishigh humiditySince February 2018Numerical model to simulate humidity and temperature changes in diffrent casesnoMetal artifacts
Kompatscher, K. et al., 2019 [34]Computational model on energy impact during the yeartemperate, humidityAugust 2016–August 2017ASHRAE
HAMBASE
Lifetime Multiplier
yesPaper
ElAdl et al., 2021 [35]Climate changehot and dryN/AquestionnaireyesTextiles, stone, fossils
Nawalany, G. et al., 2021 [16]The analysis of the effects of the frequency of religious services and the number of people at the services on the formation of temperature and humidity conditionstemperateMay 2018–May 2019Numerical method of calculating elementary balancesnowood
Palomar, T. et al., 2021 [19]Assessing the environmental conditionswarmMarch 2019–October 2020VOC analysisnoglass
Efthymiou, C. et al., 2021 [36]Indoor environmental qualitywarmFebruary 2019–April 2021VOC analysisnomanuscripts, scientific instruments, portrait paintings
Table 2. Air conditioning system and its parameters.
Cooling
Capacity (kW)
Heating
Capacity (kW)
Heat Exchanger Water Volume (l)Power Input
(W)
Water FlowWater Pressure DropFan (m3/h)Power Supply (Hz/V)
Cooling
(l/h)
Heating
(l/h)
Cooling (kPa)Heating
(kPa)
6.26.31.42401.06581241512501~/50/220–240
Table 3. Mean monthly air temperature values (°C) for exterior data loggers and University weather stations and the differences between exterior data loggers and University weather station (February 2020 to January 2021).
20202021Mean
FMAMJJASONDJ
University WS5.18.111.614.721.523.123.819.814.35.02.70.712.5
University WS–S5−0.8−1.2−1.3−1.10.0−0.5−0.5−1.2−0.8−1.1−0.3−1.0−0.8
University WS–S6−1.1−1.2−0.6−1.2−0.4−1.2−1.2−1.8−1.2−1.6−1.0−1.7−1.2
S5 (south outside)6.09.312.915.821.523.624.321.015.16.13.01.713.4
S6 (north outside)6.39.212.215.921.924.425.121.615.66.73.72.313.7
S5–S6−0.30.10.7−0.1−0.4−0.8−0.8−0.6−0.5−0.5−0.7−0.6−04
Table 4. Mean monthly air relative humidity values (%) for exterior data loggers and University weather stations and the differences between exterior data loggers and University weather station (February 2020–January 2021).
20202021Mean
FMAMJJASONDJ
University WS69.763.244.867.970.263.057.062.080.483.086.581.269.1
University WS–S52.93.37.01.6−1.42.62.74.4−3.1−4.0−6.4−4.80.4
University WS–S65.64.26.64.32.06.56.58.01.20.2−1.9−1.13.5
S5 (south outside)66.859.837.866.371.760.354.357.683.587.092.986.168.7
S6 (north outside)64.158.938.363.668.356.550.554.079.182.888.482.365.6
S5–S62.70.9−0.52.73.43.83.93.64.44.24.53.73.1
Table 5. Mean monthly air temperature values (°C) for indoor data loggers and the differences between the interior data loggers.
20202021Mean
FMAMJJASONDJ
S1 north indoor18.516.714.617.821.825.125.923.518.417.818.818.519.8
S4 north indoor18.517.515.018.121.825.125.823.618.818.218.818.920.0
S2 south indoor17.916.414.717.921.925.326.023.518.217.618.318.019.6
S3 basement13.514.513.715.317.821.122.622.320.016.915.915.417.4
Mean north rooms18.517.114.818.021.825.125.823.618.618.018.818.719.9
Mean indoor18.316.914.717.921.825.225.923.518.517.818.618.519.8
Diff north–south0.60.60.10.1−0.1−0.1−0.20.00.30.40.50.70.3
Diff indoor–basement4.82.41.02.64.14.13,.31.3−1.60.92.83.02.4
Table 6. Mean monthly air relative humidity values (%) for interior data loggers and the differences between the interior data loggers.
20202021Mean
FMAMJJASONDJ
S1 north indoor40.547.851.257.564.456.052.253.364.157.345.342.752.7
S4 north indoor40.345.149.656.263.955.752.152.561.855.645.141.651.6
S2 south indoor41.248.050.657.564.055.351.652.965.157.746.043.452.8
S3 basement48.353.155.471.281.372.265.561.565.053.948.945.960.2
Mean north rooms40.446.450.456.864.155.852.252.963.056.545.242.252.2
Mean indoor40.747.050.457.064.155.652.052.963.756.945.542.652.4
Diff north–south−0.8−1.6−0.2−0.70.10.50.50.0−2.1−1.2−0.8−1.2−0.6
Diff indoor–basement−7.6−6.2−5.0−14.1−17.2−16.6−13.5−8.6−1.32.9−3.4−3.3−7.8
Table 7. Median, minimum and maximum values, 25th and 75th percentiles for air temperature and humidity for all sensors (A—S1; B—S2; C—S3; D—S4; E—S5; F—S6) in unheated (March–October) and heated (October–February) periods of the entire year.
TemperatureHumidity
Unheated periodABCDEFABCDEF
Median20.1720.1118.7820.5518.518.553.553.1665.753.0360.2657.16
Min11.611.213.0812.38−3.7−1.937.7238.6737.1737.39.115.09
Max27.2527.524.4227.0335.7435.972.676.991.4274.3710096.62
25%17.3417.214.7617.2712.4612.7751.0250.556.749.5742.5541.9
75%24.2424.321.524.3822.9423.1348.1248.5955.2247.2193.6088.75
Heated period
Median18.6918.1515.5818.774.144.7644.8745.7749.3245.1688.0583.48
Min13.513.312.3712.34−3.74−1.95818.417.912.318.431924.36
Max21.720.320.6921.2921.4120.1772.374.1170.9770.7110099.6
25%18.1517.714.218.581.392.2840.0340.744.4239.875.5371.28
75%18.9818.417.218.887.878.153.5853.656.5353.6194.689.9
Table 8. Correlation matrix based on Pearson correlation coefficient for air temperature values from indoor and outdoor during the warm period (March–October).
Correlation RS1S2S3S4S5
S1 0.990.890.990.93
S2 0.880.990.94
S3 0.890.83
S4 0.91
S5
Table 9. Correlation matrix based on Pearson correlation coefficient for air humidity values from indoor and outdoor during the warm period (March–October).
Correlation RS1S2S3S4S5
S1 0.990.770.980.77
S2 0.720.970.81
S3 0.830.51
S4 0.72
S5
Table 10. ASHRAE climate classification values specific to the Poni-Cernătescu Museum, temperature (T °C), relative humidity (RH%), and gradient (K) fluctuations. The similarity between ASHRAE climate classification and the indoor climate of the Poni-Cernătescu Museum.
Statistical DataTemperatureRelative Humidity
MeanDropRiseTminTmaxMeanDropRiseRHminRHmax
NW room20.03.35.112.527.051.111.07.532.469.3
NE room19.73.65.311.727.152.112.07.234.071.0
SE room19.63.45.611.427.452.212.06.834.472.7
Basement17.33.84.812.724.059.513.015.024.490.4
ASHRAE
Classification
AA (%)As (%)A (%)B (%)C (%)D (%)
NW room37.465.761.198.6100.0100.0
NE room35.160.756.297.7100.0100.0
SE room35.558.756.397.0100.0100.0
Basement27.249.951.480.189.389.3
Table 11. Predicted mean annual mold growth for each room.
Mould Growth Rate
NW RoomNE RoomSE RoomBasement
Papersafesafesafe8 mm
Panel paintingsafesafesafe8 mm
Furnituresafesafesafe8 mm
Sculpturesafesafesafe8 mm
Table 12. Mechanical and chemical risks for different material depending on indoor climate [56].
TemperatureRelative Humidity
Set pointFluctuationsSet pointFluctuations
Paperchemical
major risk
-
low risk
chemical
high risk
mechanical
medium risk
Canvas paintingchemical
medium risk
-
low risk
chemical
medium risk
mechanical
high risk
Textileschemical
medium risk
-
low risk
chemical
medium risk
mechanical
medium risk
Wooden furniturechemical
medium risk
-
low risk
chemical
medium risk
mechanical
high risk
Bronze sculpture-
low risk
-
low risk
chemical
medium risk
-
low risk
Table 13. Predicted risk of mechanical degradation for each room.
LM (Lifetime Multiplier)Base MaterialPictorial Layer
NW RoomNE RoomSE RoomBasementNW RoomNE RoomSE RoomBasementNW RoomNE RoomSE RoomBasement
Paper0.8430.8450.8520.988--------
Panel painting0.90.8980.9050.943safesafesafedamage possiblesafesafesafedamage possible
Furniture0.8960.8930.90.936safesafesafedamage possible----
Sculpture0.9010.8990.9050.945safesafesafedamage possible----
Table 14. Dew point (DP), preservation index (PI), days to mold, moisture content in equilibrium conditions (EMC) calculated for NW room and basement (highlighted in bold are the inappropriate values for an indoor climate).
T (°C)RH (%)DP
(°C)
PIDays to MoldEMC
(%)
T
(°C)
RH (%)DP
(°C)
PIDays to MoldEMC
(%)
NW RoomBasement
F1941563no risk7.91448399no risk9.1
M1748667no risk91553576no risk9.9
A1551580no risk9.501455581no risk10.2
M1758851no risk10.701571946no risk13.5
J22641524no risk11.70188115251216.5
J25561621no risk10.10217216228613.6
A26521520no risk9.4023661620no risk12.1
S24531325no risk9.6022621425no risk11.3
O18641139no risk11.9020651329no risk12
N1857947no risk10.501754857no risk10
D1945757no risk8.501549585no risk9.2
J1952947no risk9.601546492no risk8.7
Publisher’s Note: MDPI stays neutral with regard to jurisdictional claims in published maps and institutional affiliations.

