
A New Approach to Modeling Focused Infrared Heating Based on Quantum Mechanical Formulations


Abstract
:1. Introduction
2. Modeling
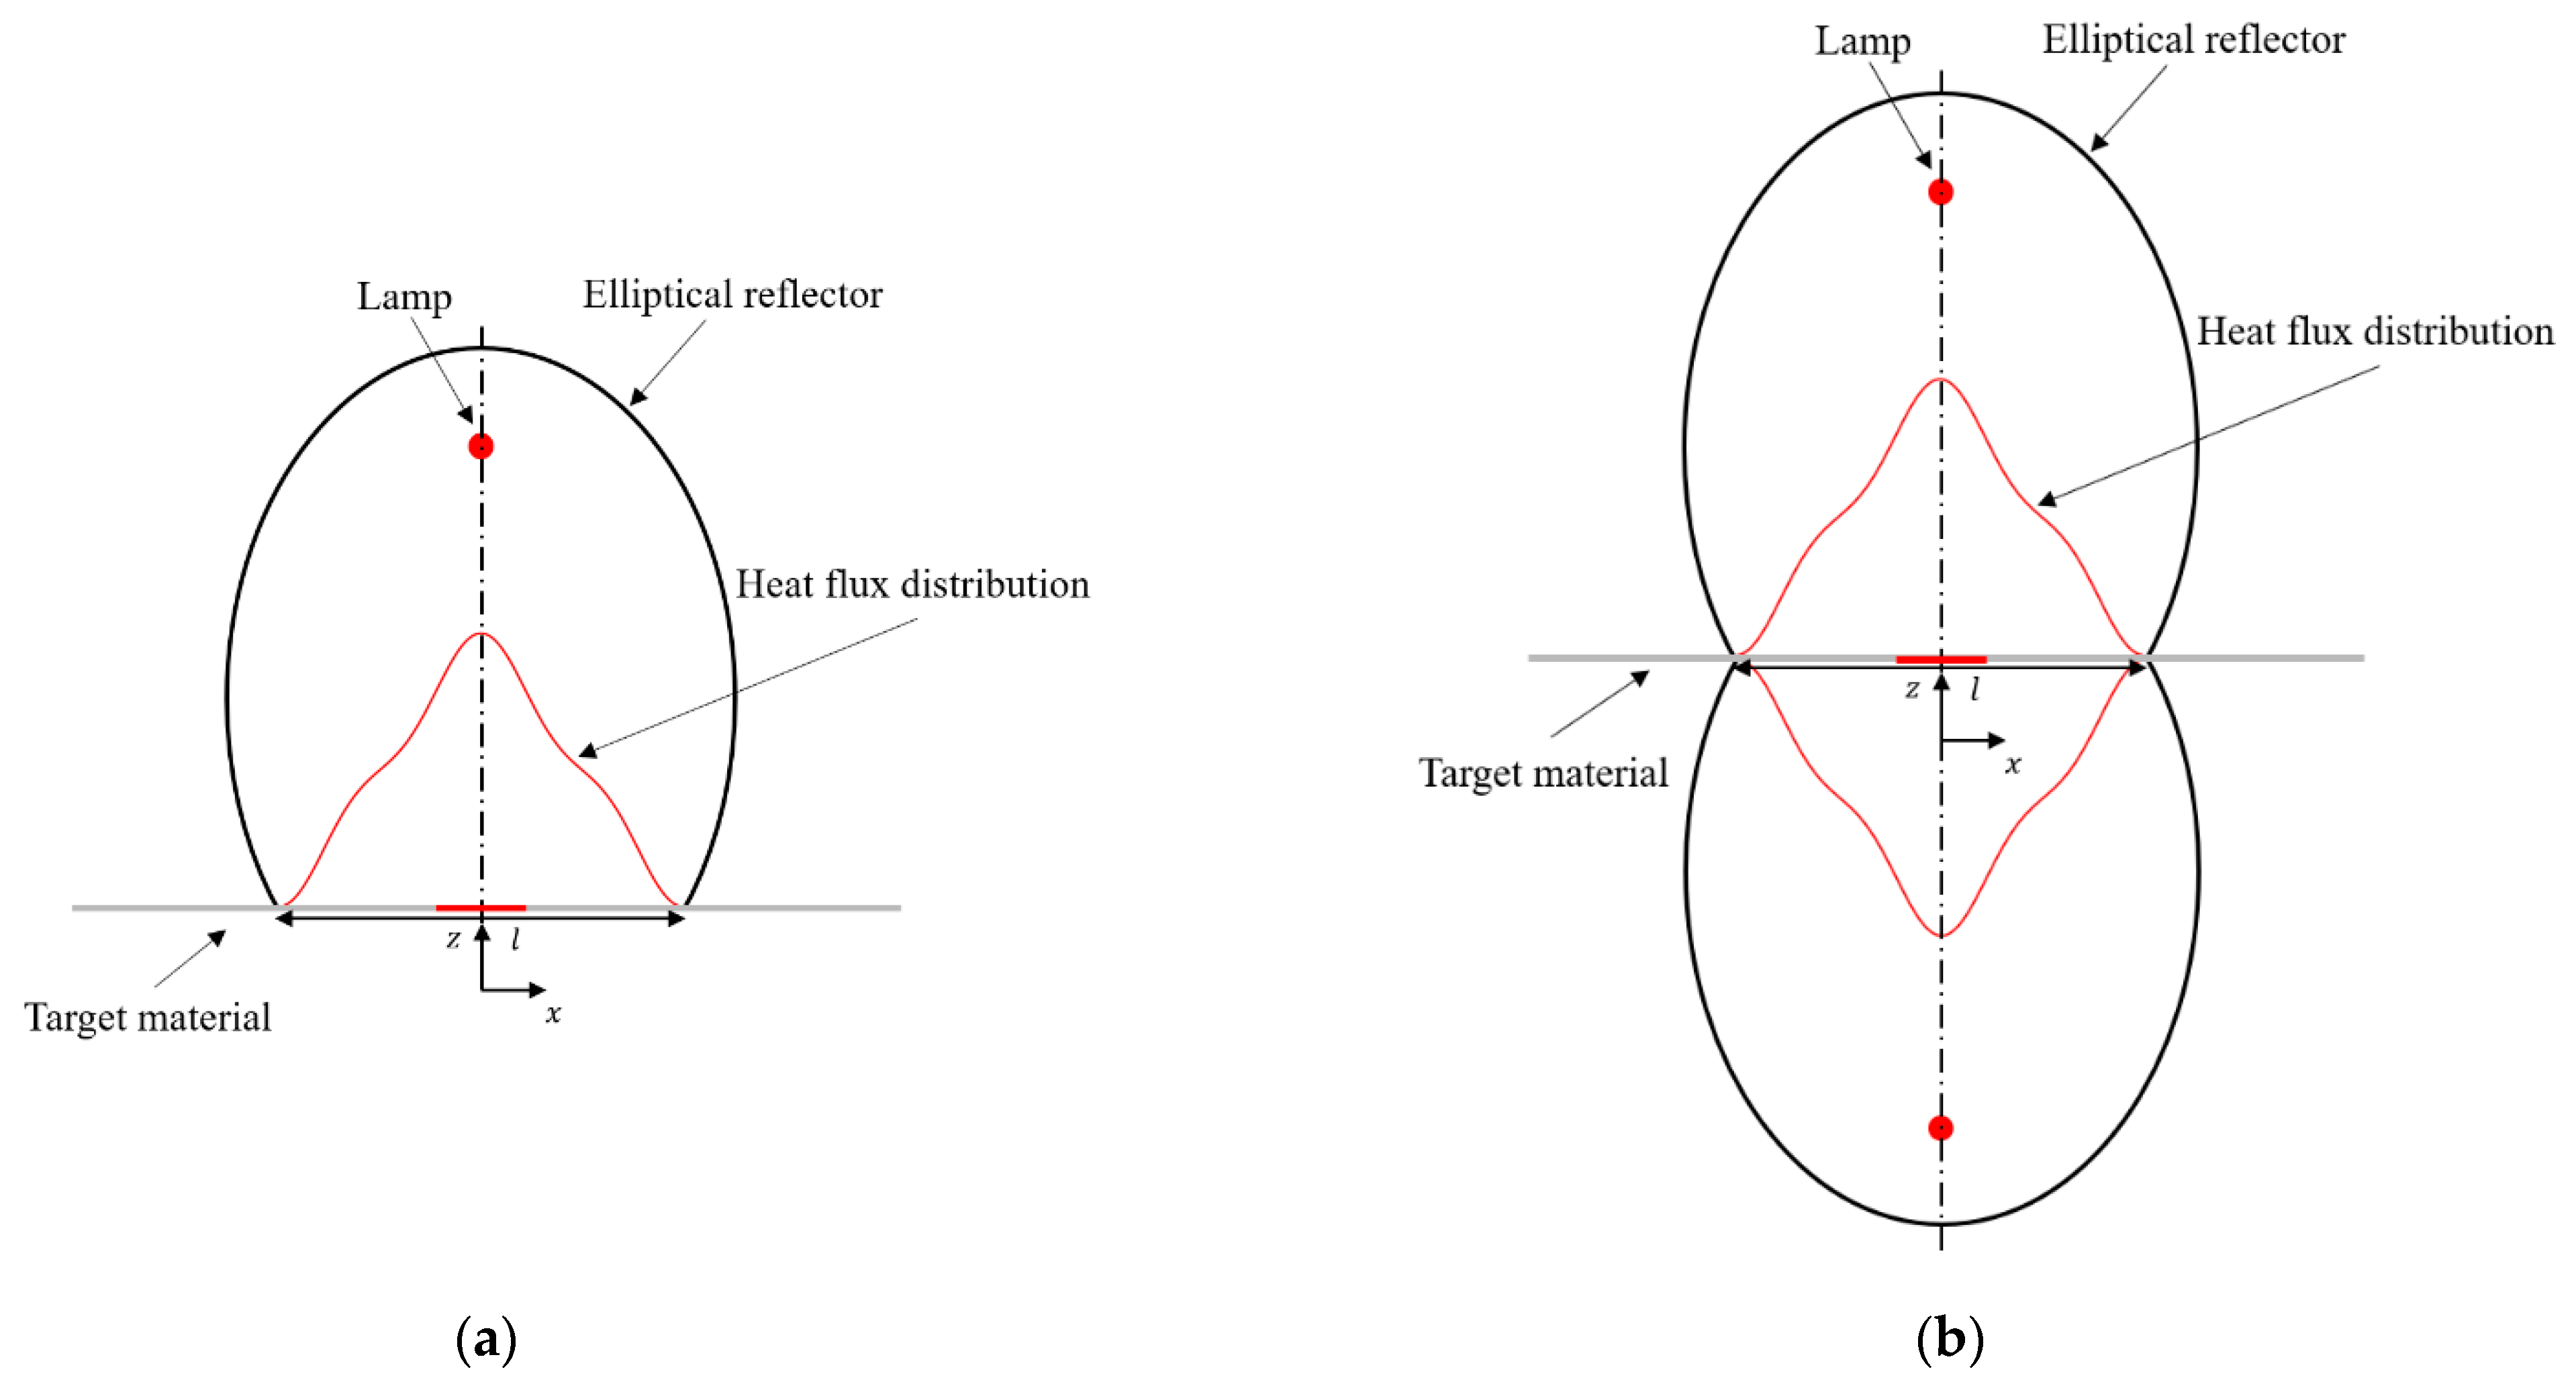
2.1. Focused IR Heating Condition
2.2. New Model Based on Quantum Mechanical Formulation
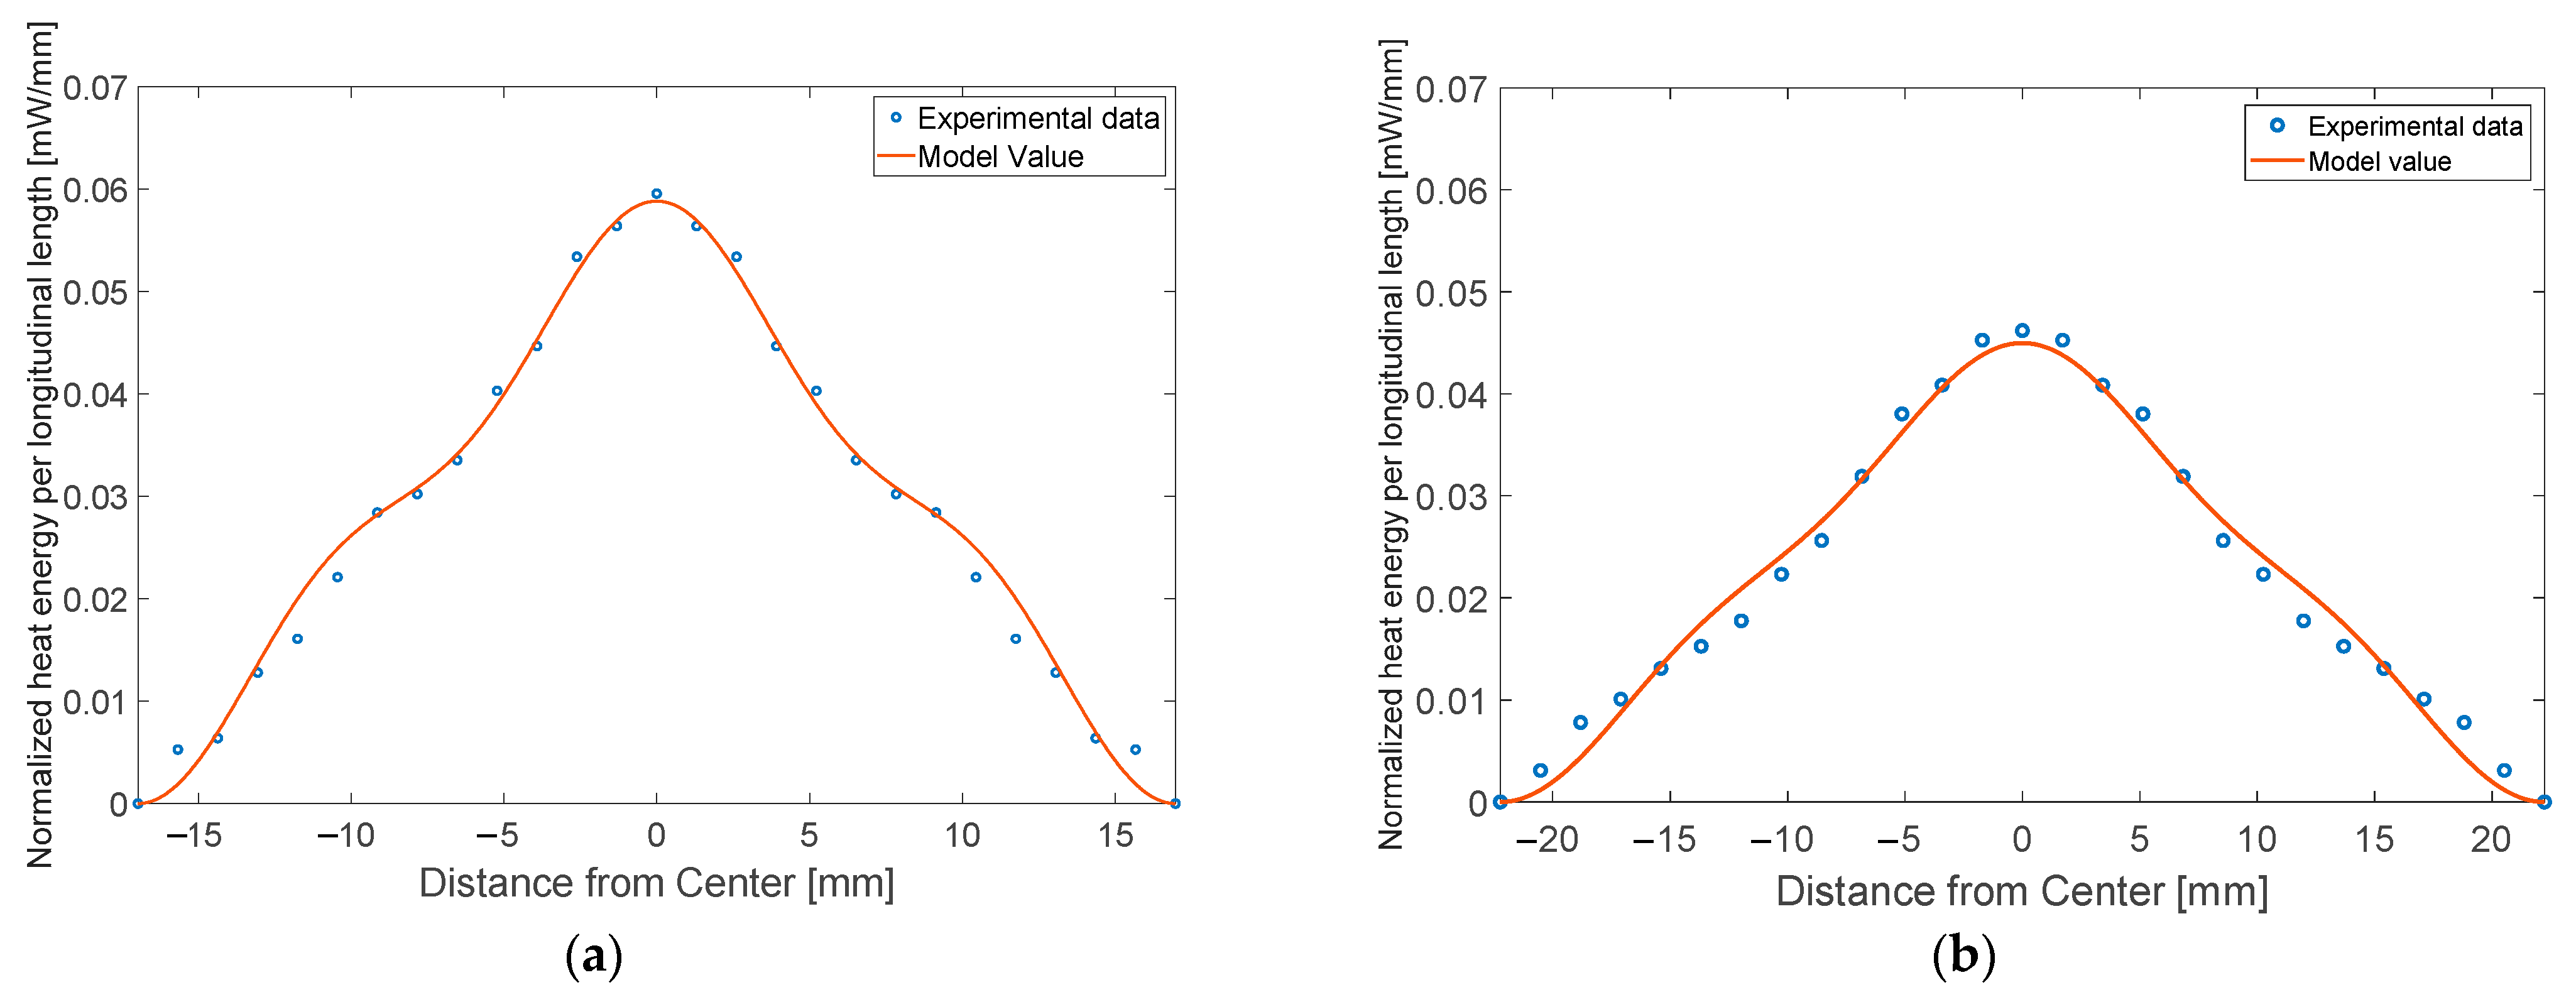
2.3. Model Calibration
3. FEM Simulation and Experimental Validation
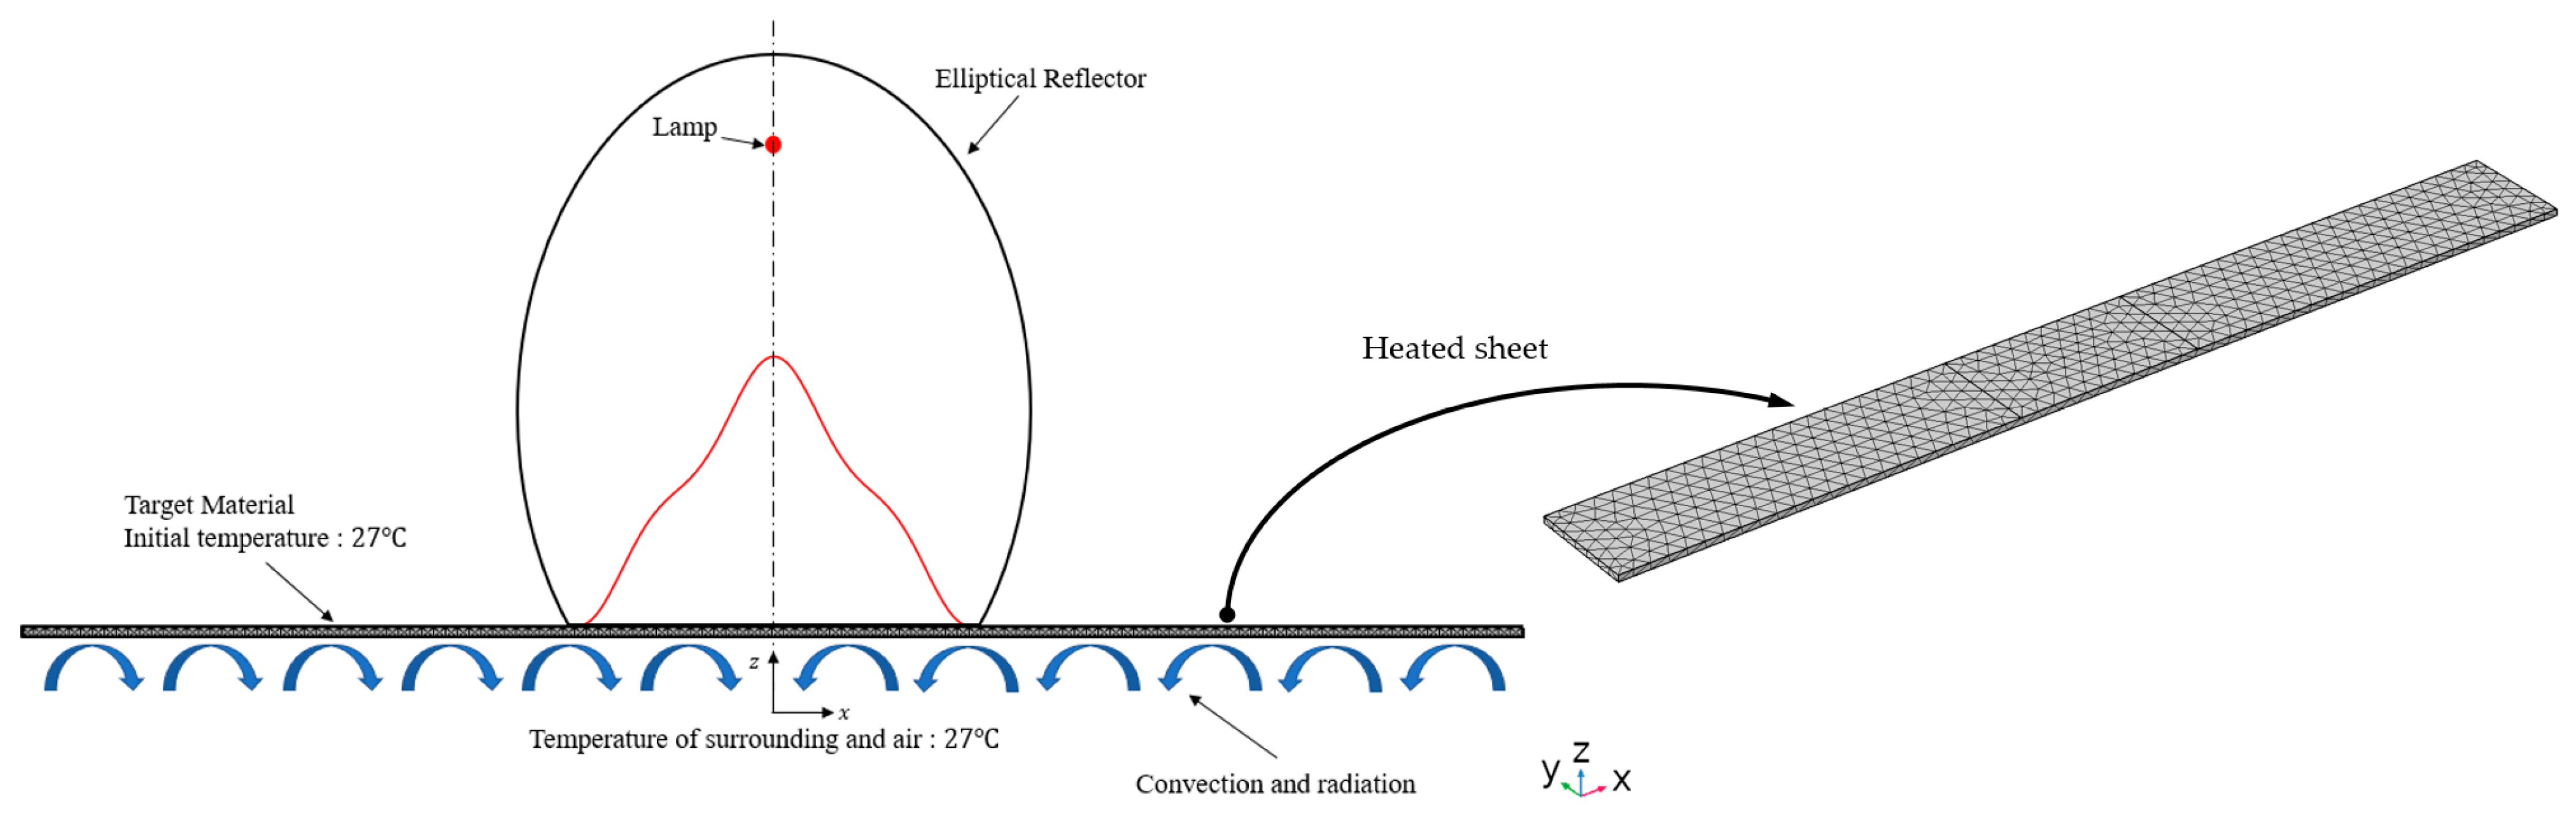
3.1. Electrical-Thermal Balance Equations for the FEM Simulation
3.2. Results of the FEM Simulation and Validation
4. Discussion
5. Conclusions
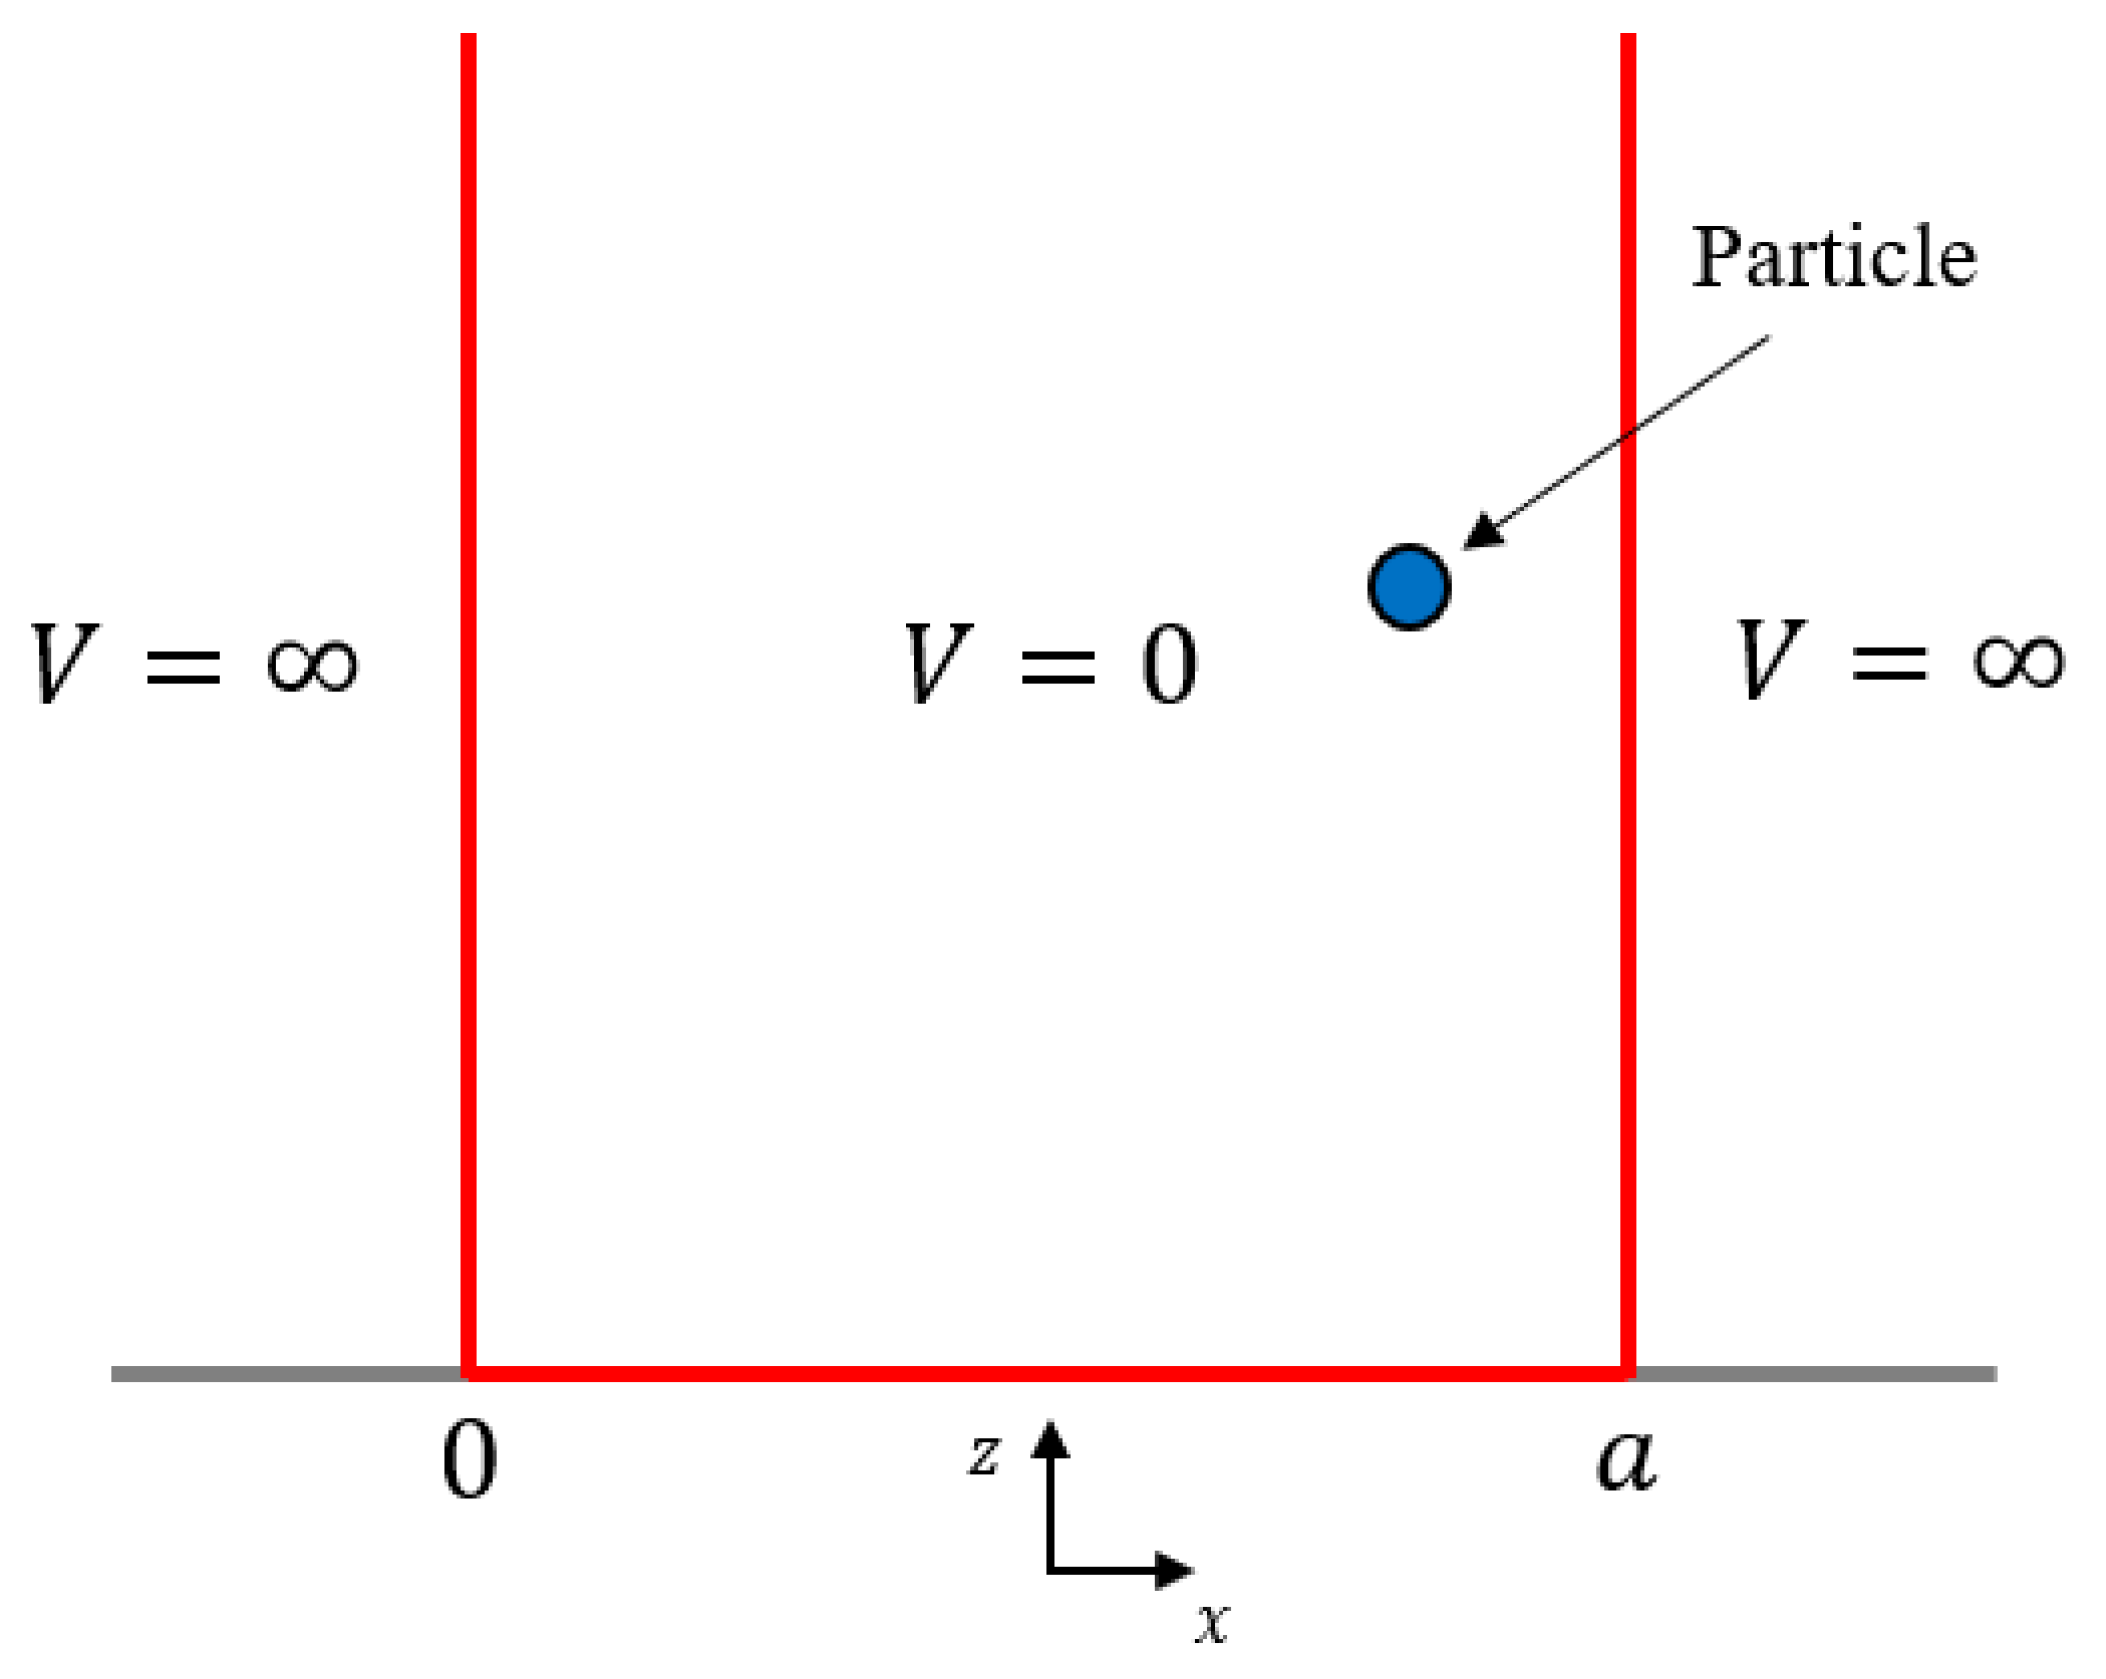
- The proposed model makes an abstraction by replacing the distributed IR rays with an energy particle having independent wave functions at different eigenstates, based on the Schrödinger equation.
- The proposed model is much simpler than pre-existing models because it does not need to consider the complex paths of IR rays and geometrical information of the reflector.
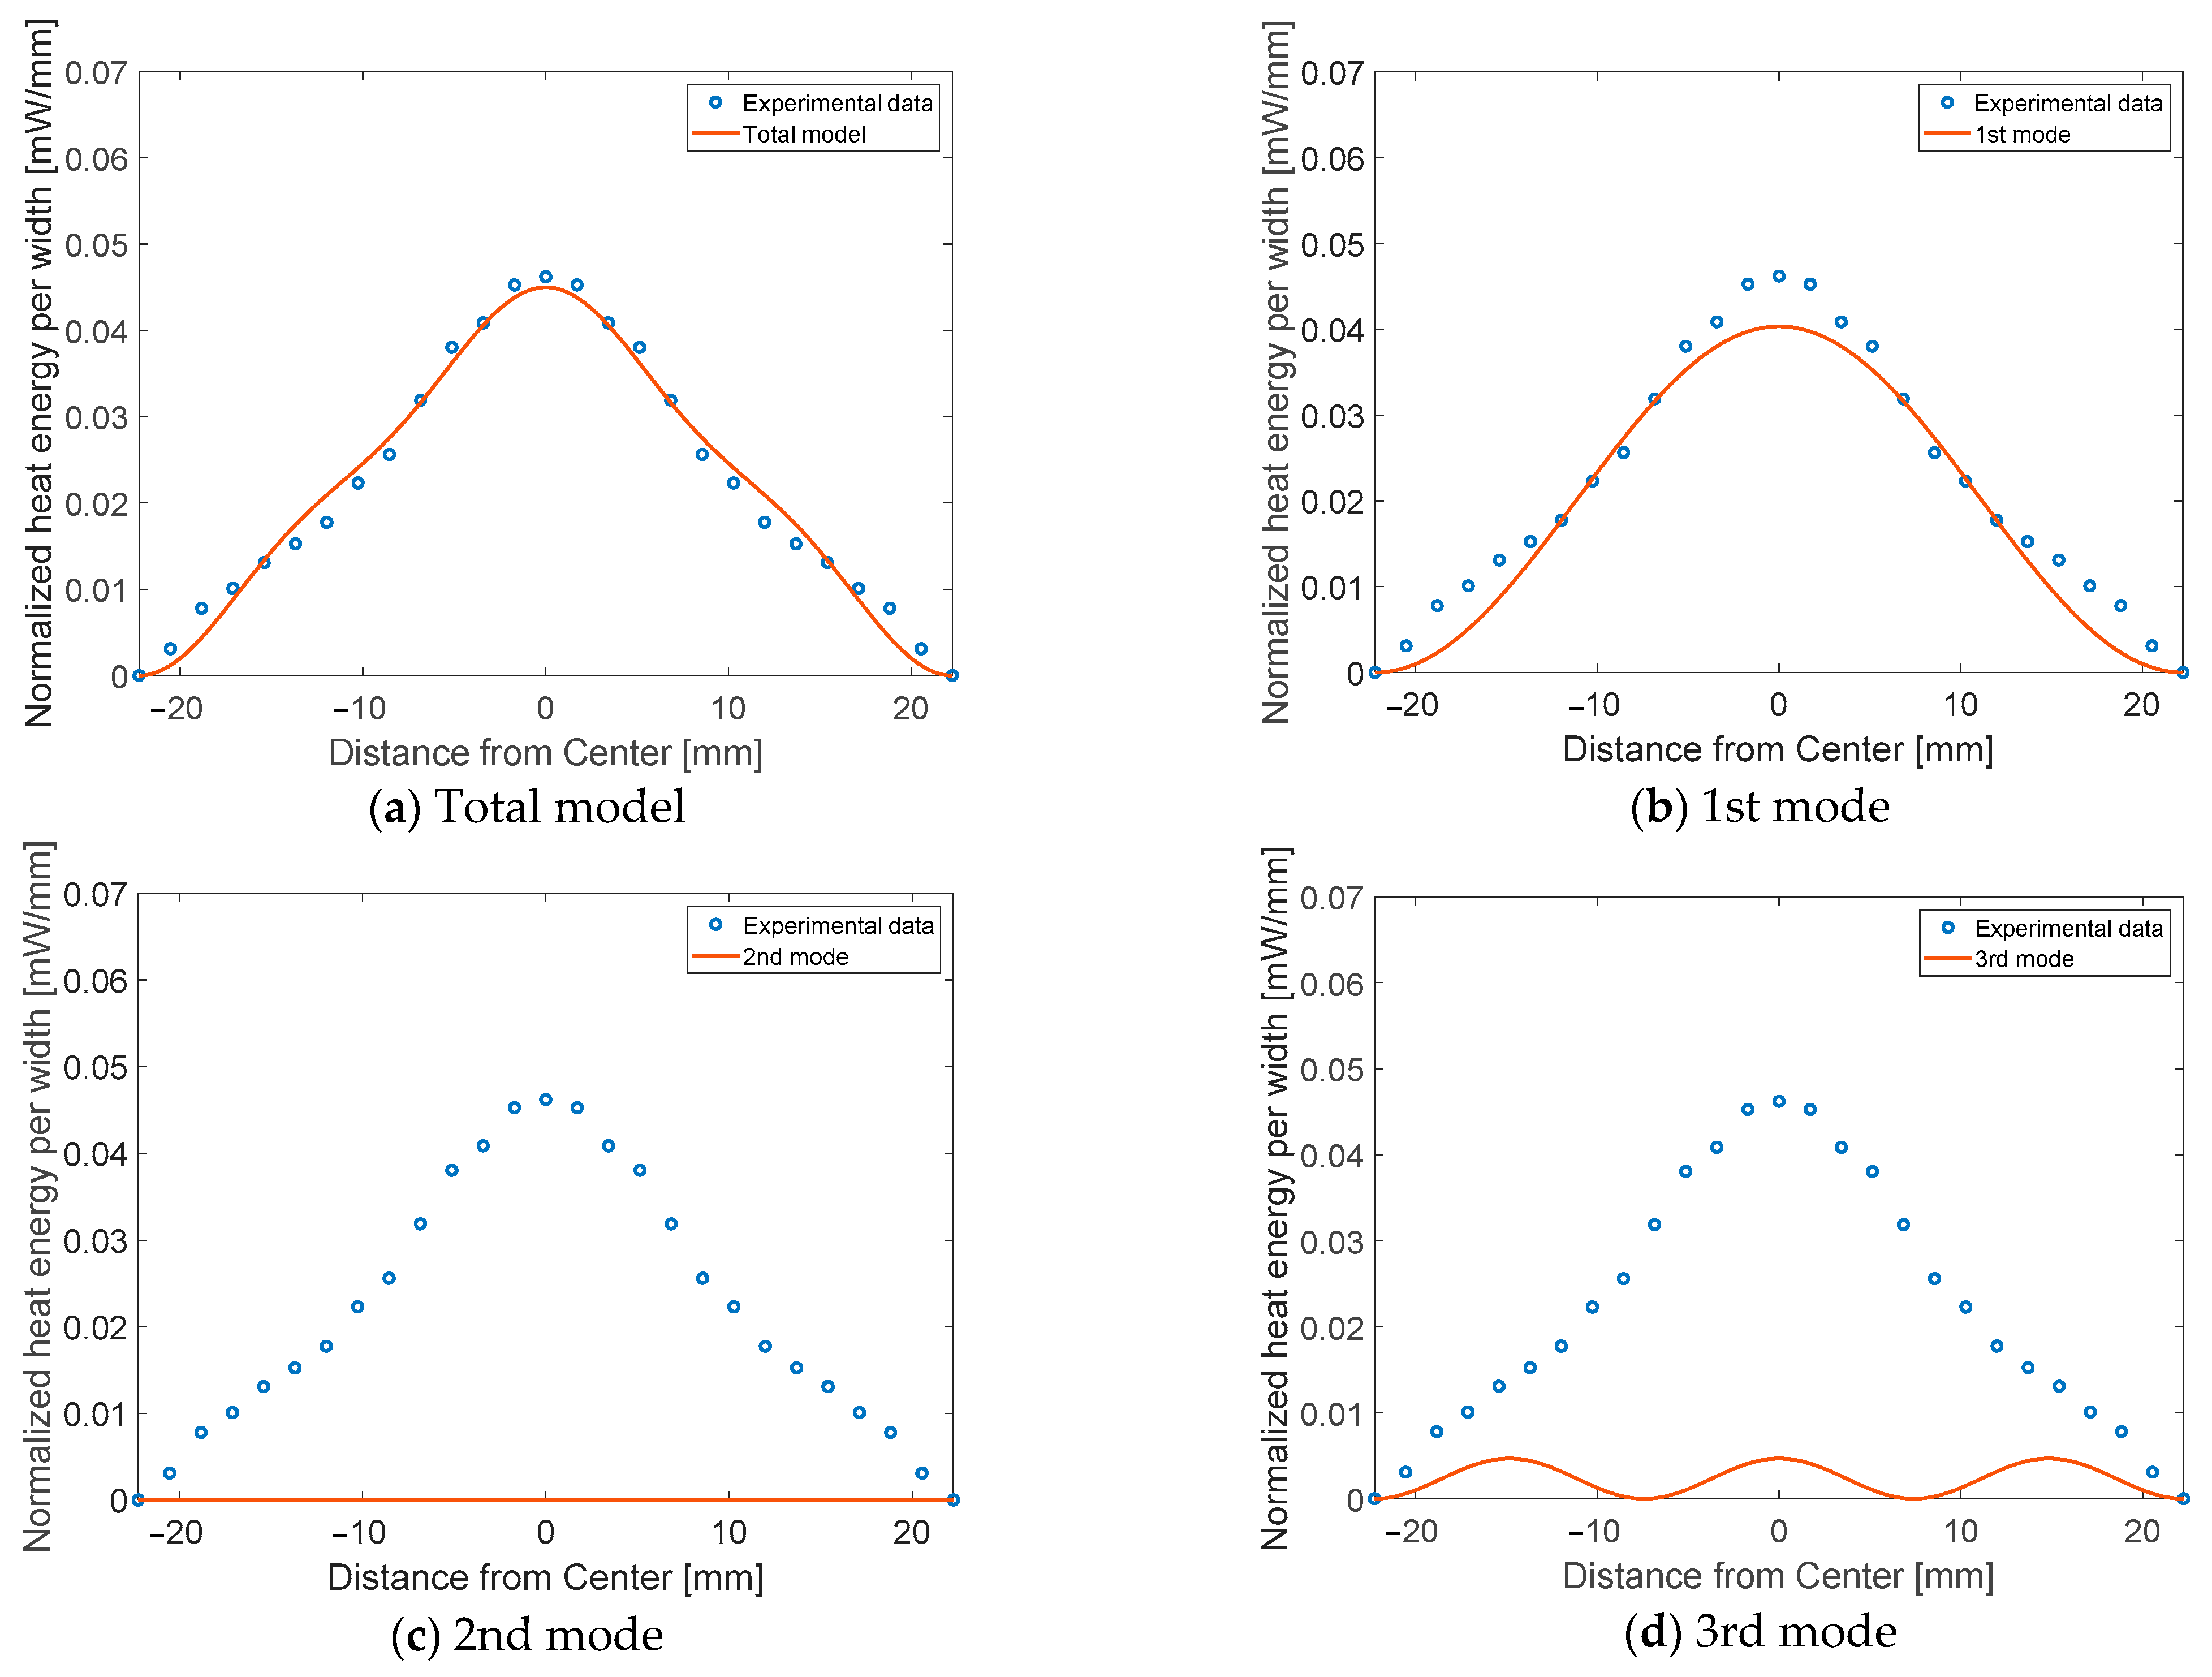
- In the proposed model, the 1st eigenmode was dominant, consistent with the design purpose of the reflector to focus maximum energy in a narrow area. The other modes are responsible for a certain amount of IR energy distributed by the imperfections of engineered conditions.
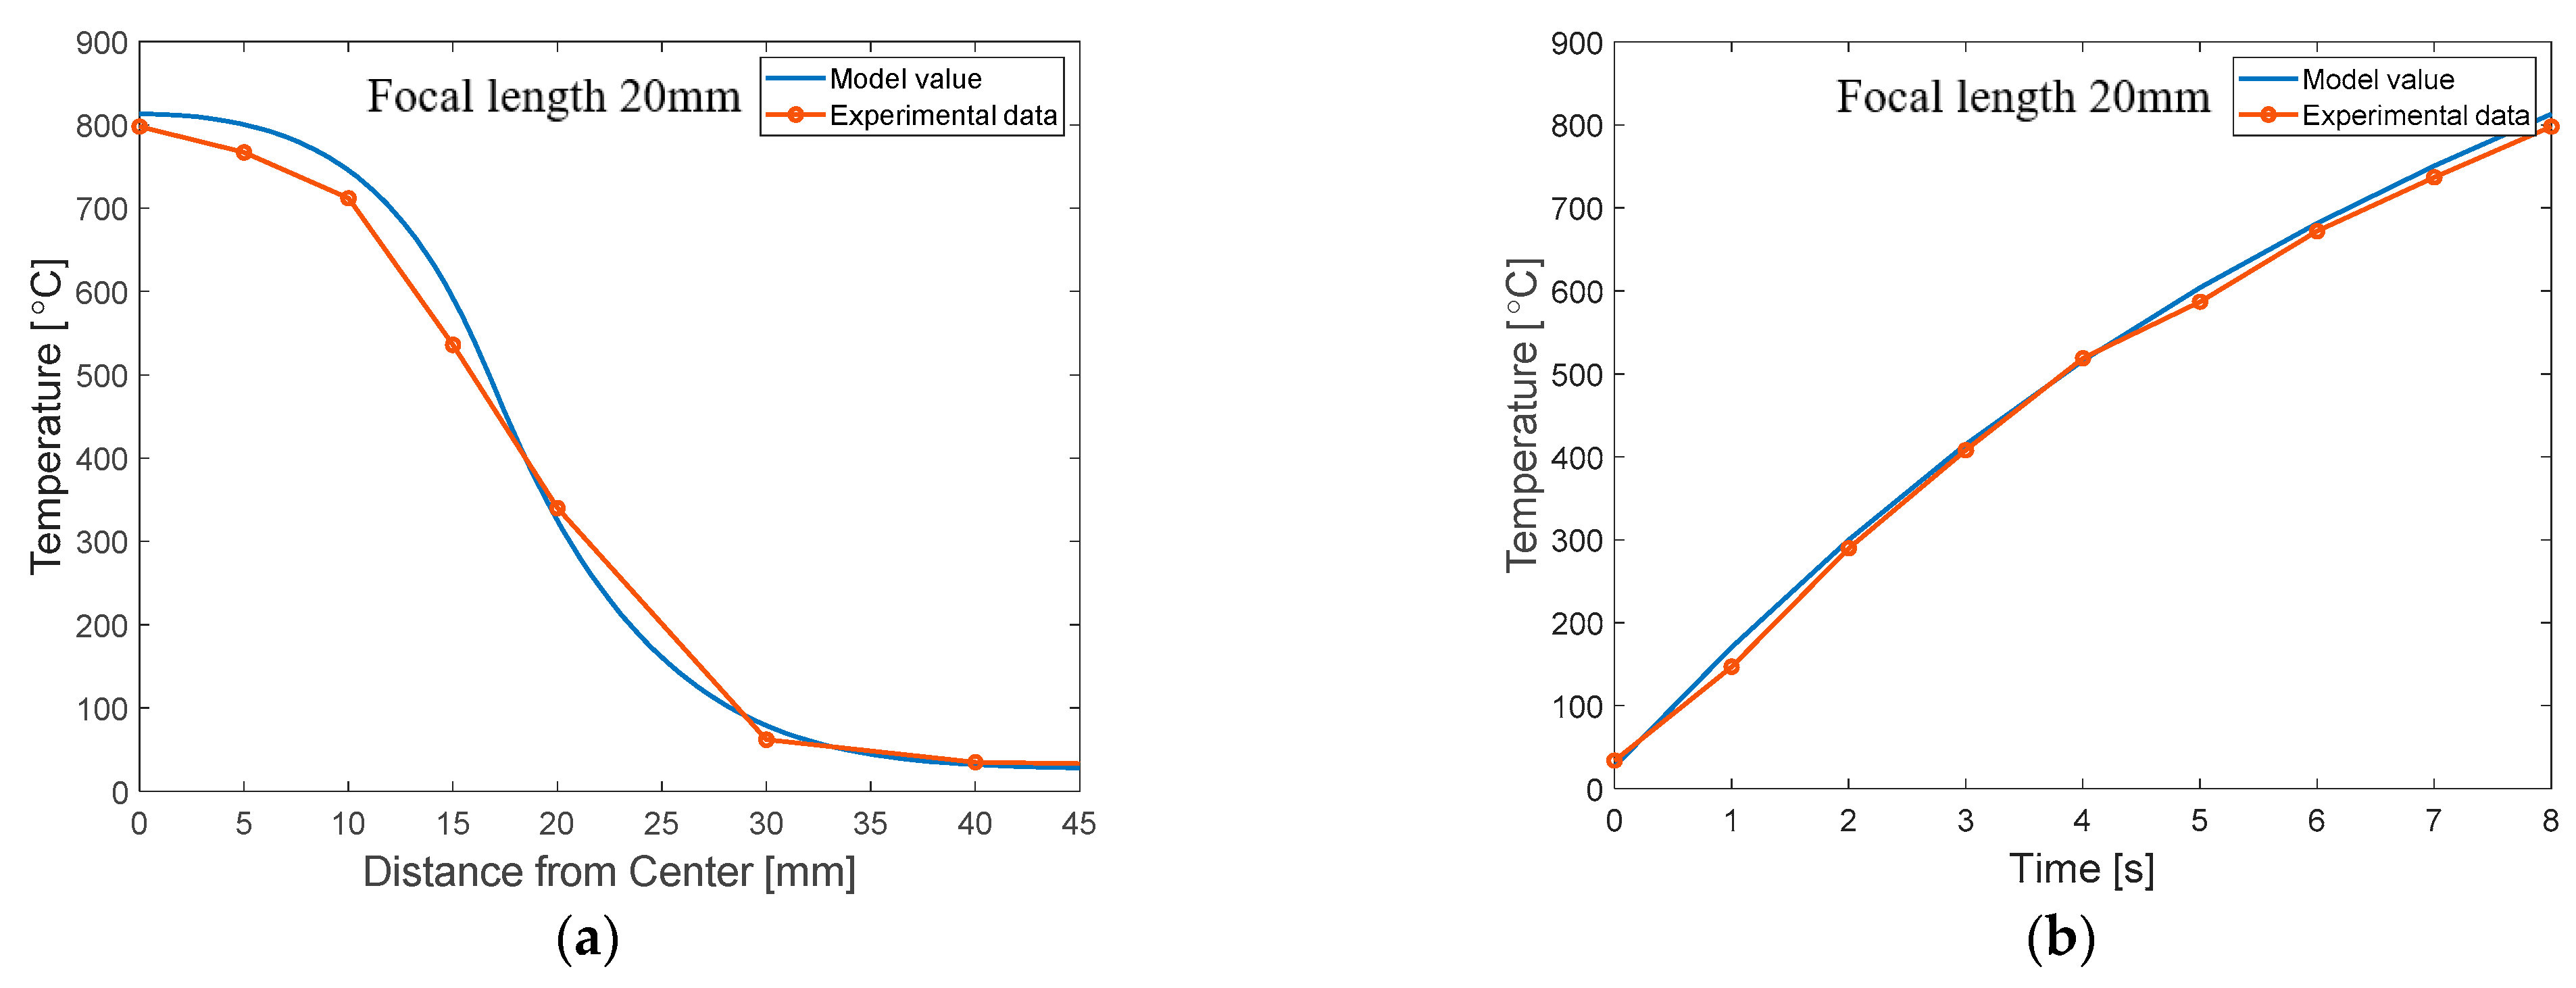
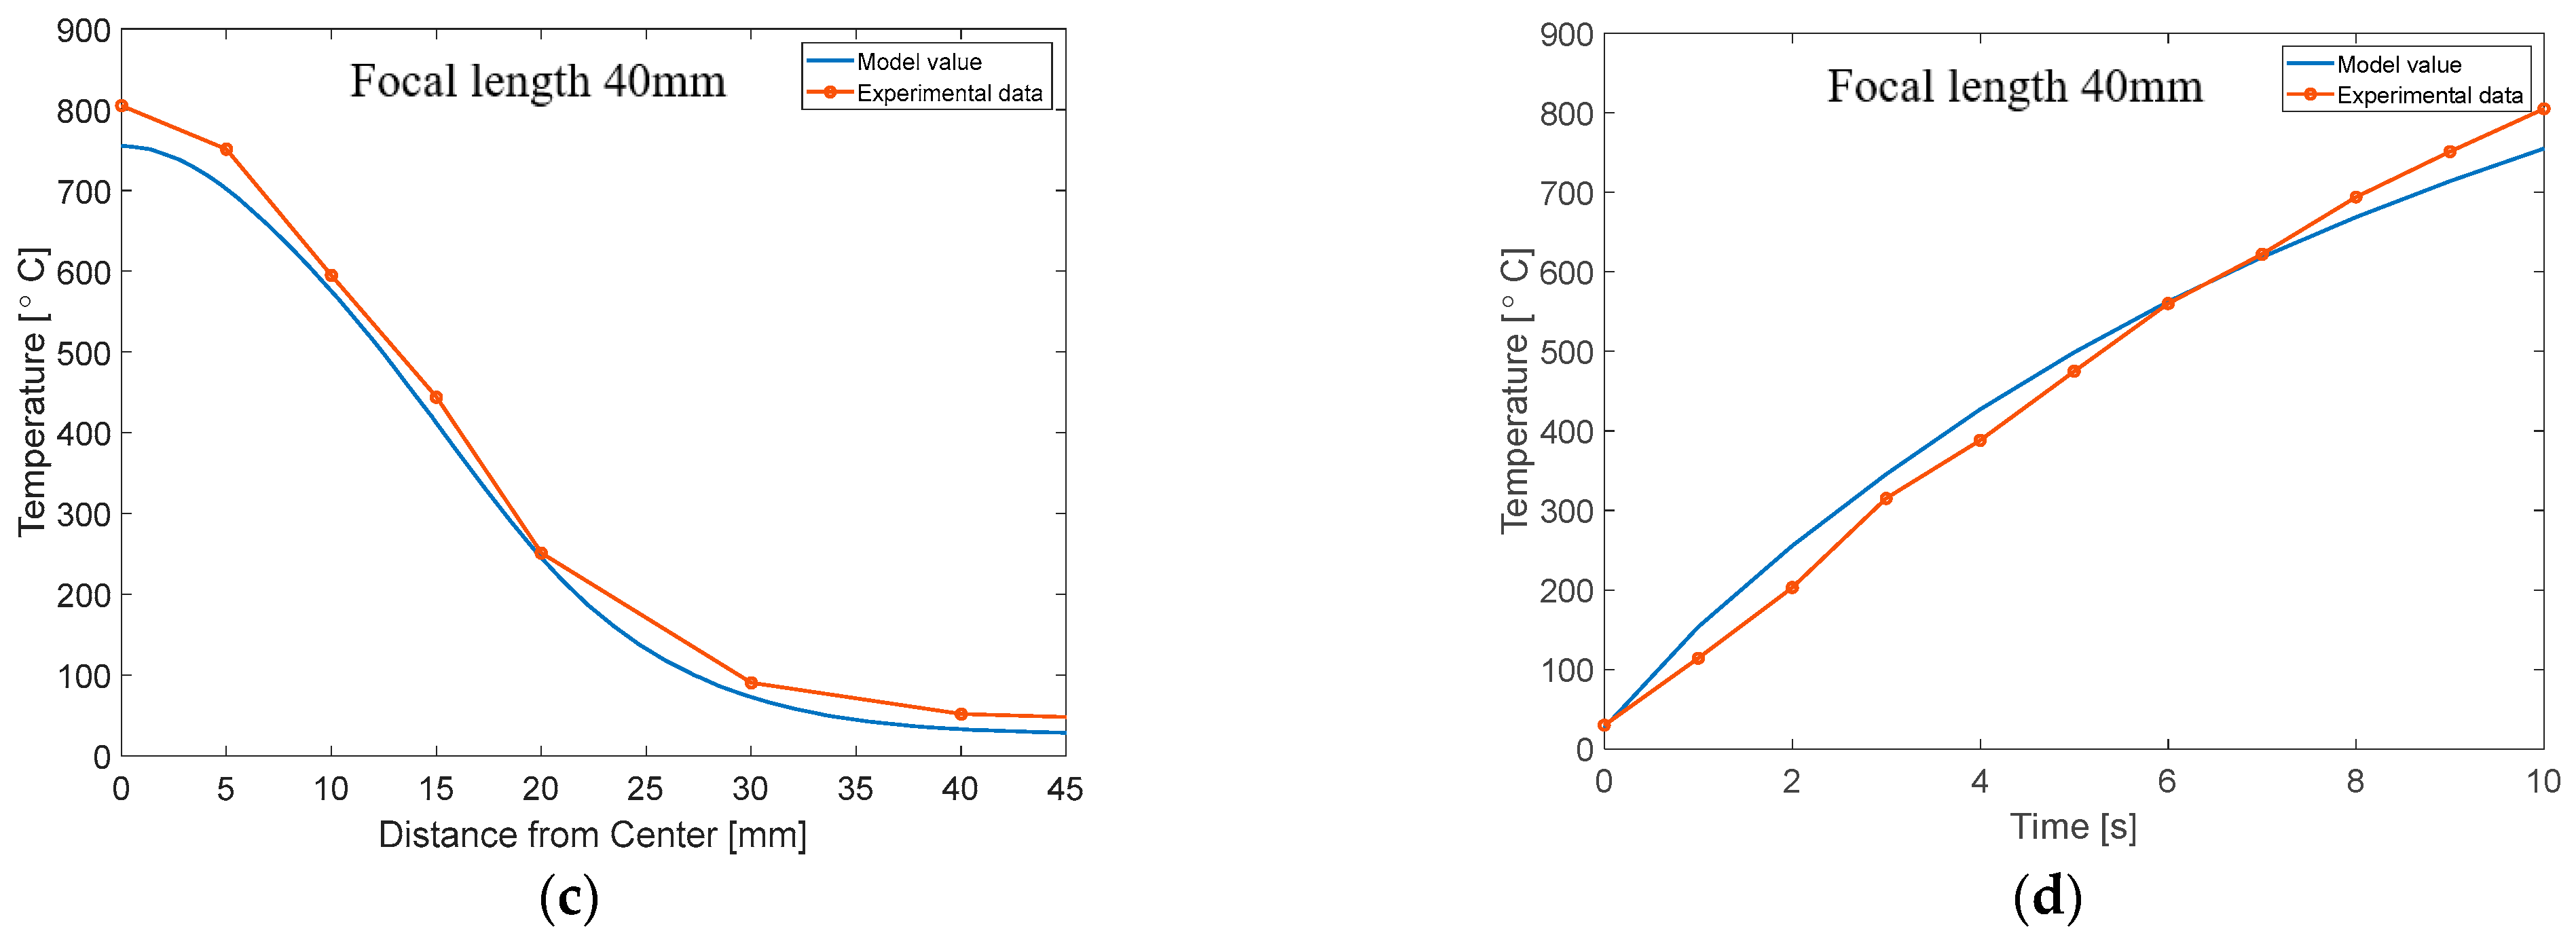
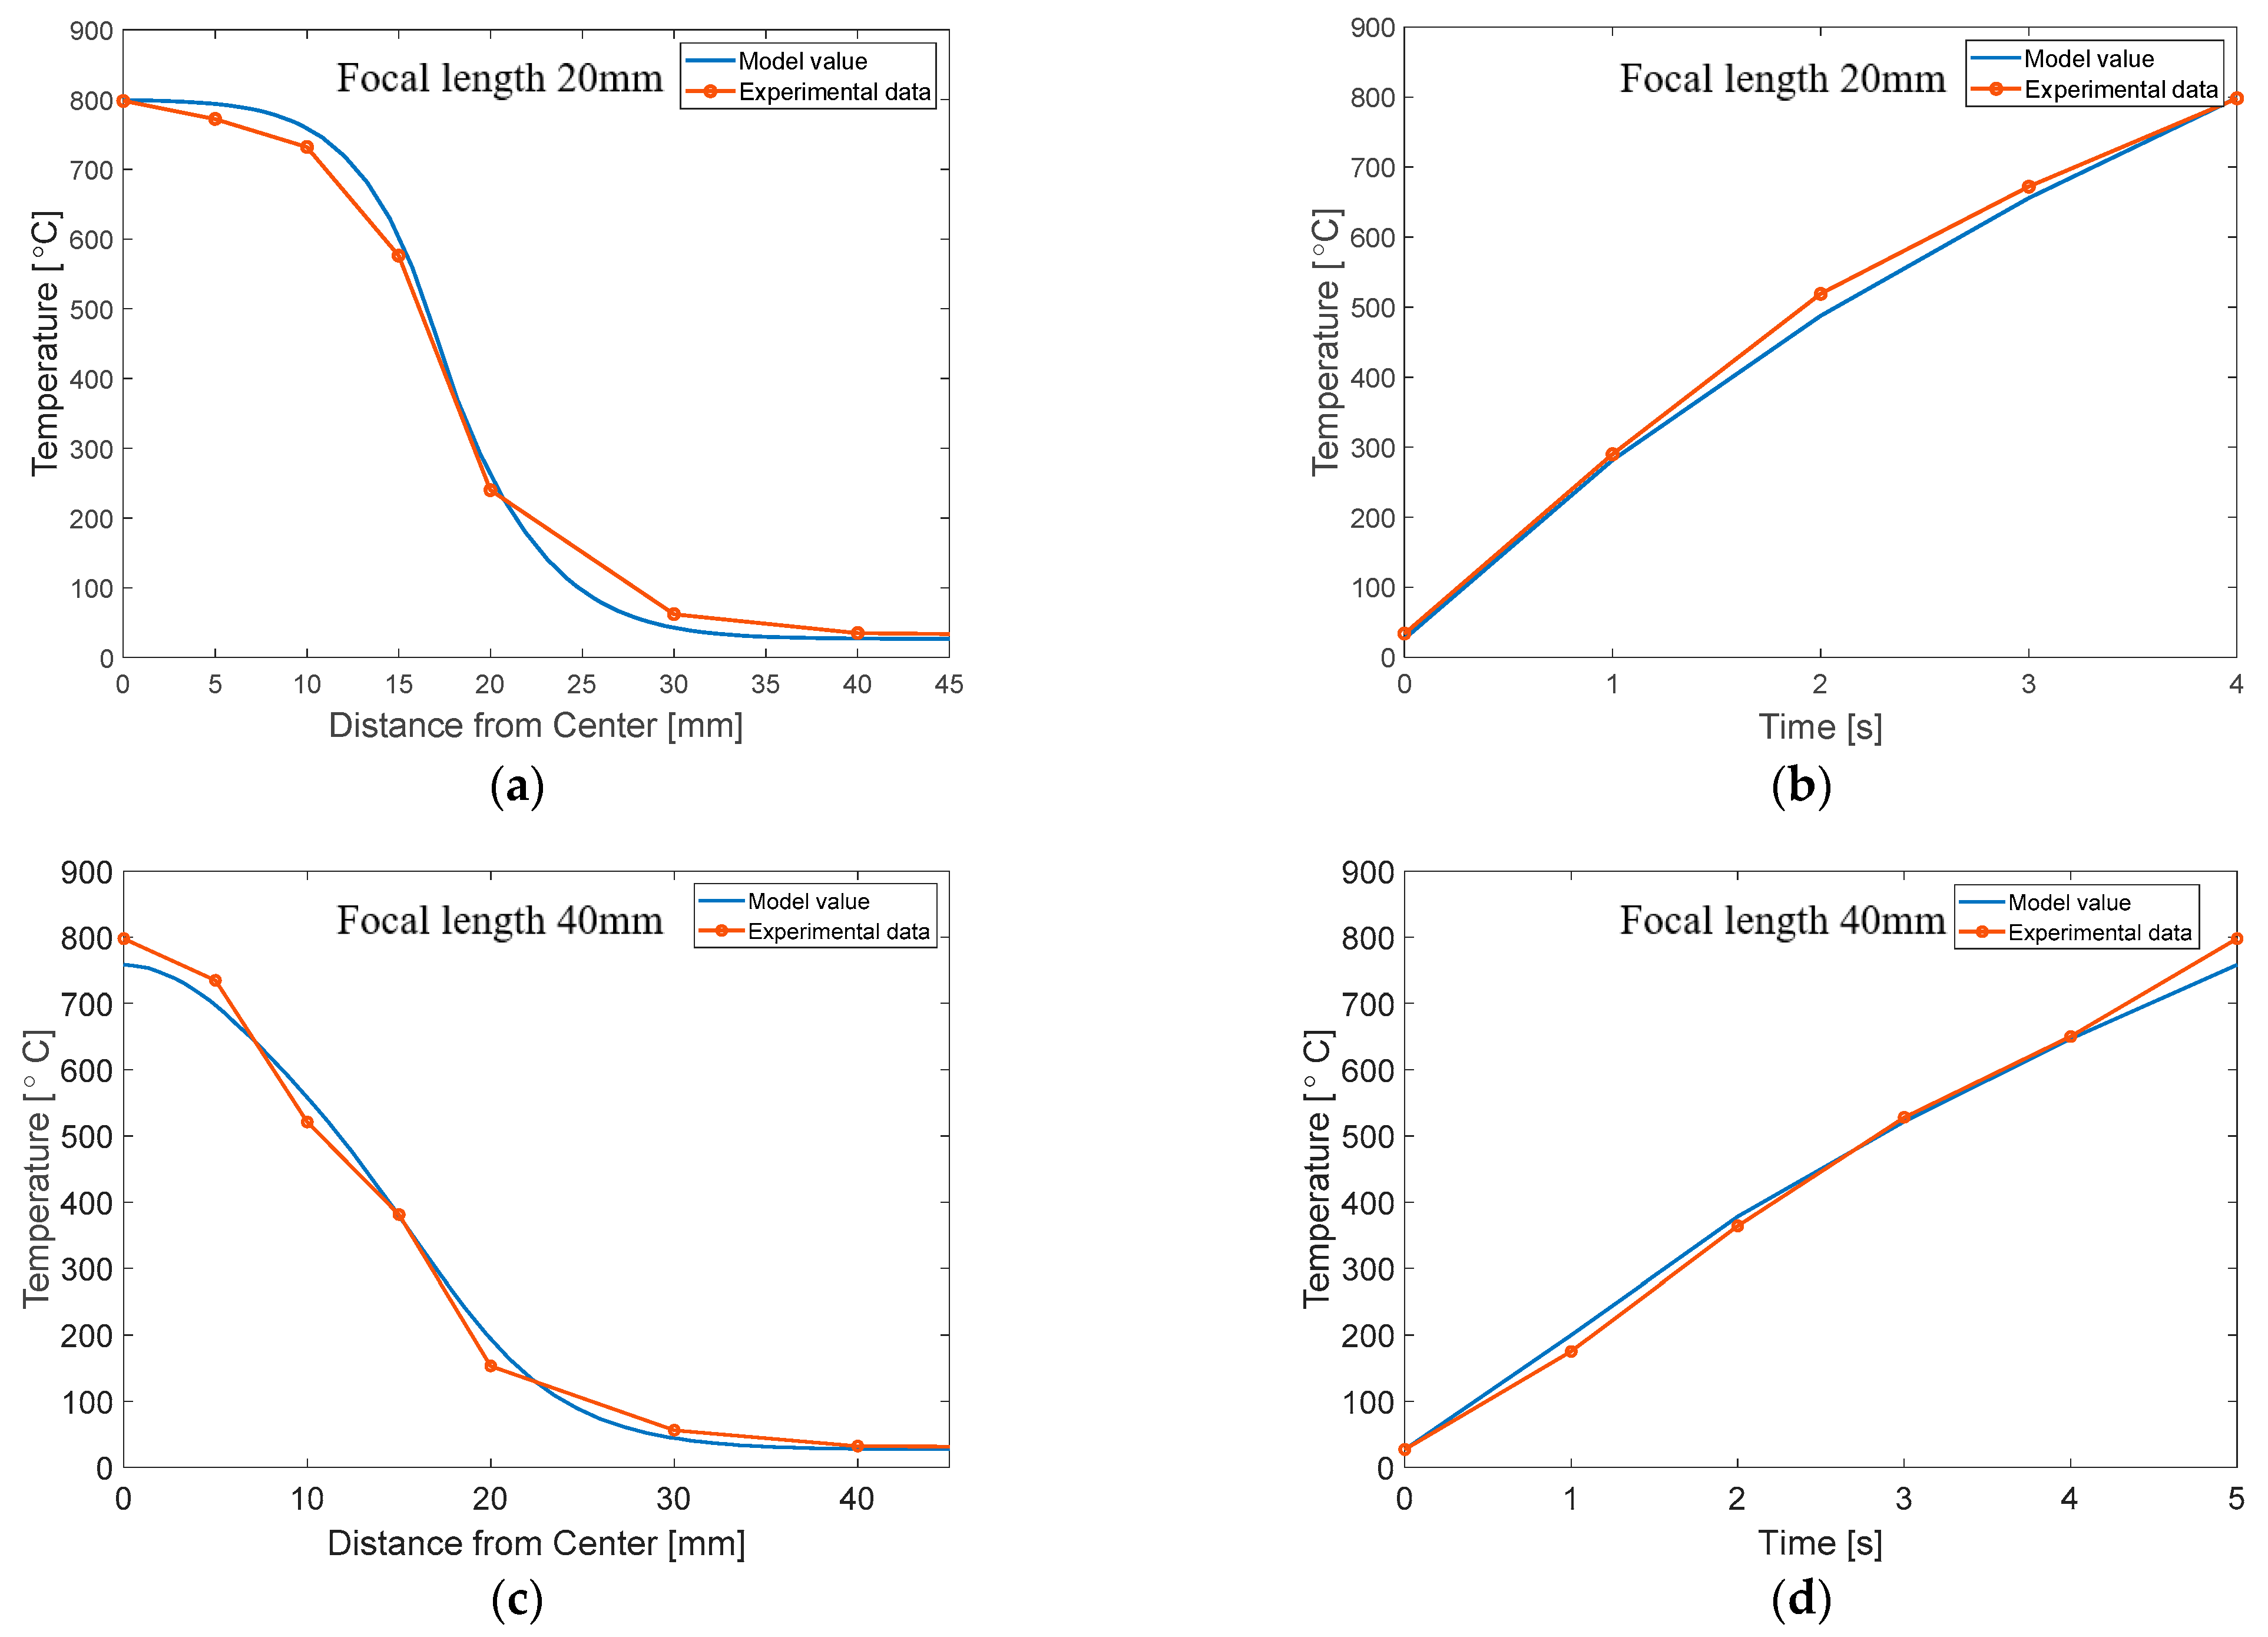
- The model was implemented into a FEM code to consider an electrical–thermal analysis of IR heating for a metal sheet. The FEM with the proposed model can accurately predict the experimental results of the focused IR heating.
- The results of this study show that the proposed approach can provide accurate and simpler modeling.
Author Contributions
Funding
Institutional Review Board Statement
Informed Consent Statement
Data Availability Statement
Conflicts of Interest
Appendix A

References
- Krishnamurthy, K.; Khurana, H.K.; Soojin, J.; Irudayaraj, J.; Demirci, A. Infrared heating in food processing: An overview. Compr. Rev. Food Sci. Food Saf. 2008, 7, 2–13. [Google Scholar] [CrossRef]
- Sandu, C. Infrared radiative drying in food engineering: A process analysis. Biotechnol. Prog. 1986, 2, 109–119. [Google Scholar] [CrossRef] [PubMed]
- Aboud, S.A.; Altemimi, A.B.; RS Al-HiIphy, A.; Yi-Chen, L.; Cacciola, F. A comprehensive review on infrared heating applications in food processing. Molecules 2019, 24, 4125. [Google Scholar] [CrossRef] [PubMed] [Green Version]
- Rastogi, N.K. Recent trends and developments in infrared heating in food processing. Crit. Rev. Food Sci. Nutr. 2012, 52, 737–760. [Google Scholar] [CrossRef]
- Tsai, S.R.; Hamblin, M.R. Biological effects and medical applications of infrared radiation. J. Photochem. Photobiol. B Biol. 2017, 170, 197–207. [Google Scholar] [CrossRef] [Green Version]
- Rushwin, S.T. Infrared drying of paint. Cent. Mater. Fabr. 1989, 3, P0108. [Google Scholar]
- Riadh, M.H.; Ahmad, S.A.B.; Marhaban, M.H.; Soh, A.C. Infrared heating in food drying: An overview. Dry. Technol. 2015, 33, 322–335. [Google Scholar] [CrossRef]
- Lee, E.H.; Yang, D.Y.; Yoon, J.W.; Yang, W.H. A manufacturing process using the infrared ray local heating method for seat cross members. Int. J. Adv. Manuf. Technol. 2017, 89, 3299–3305. [Google Scholar] [CrossRef]
- Lee, E.H.; Yoon, J.W.; Yang, D.Y. Study on springback from thermal-mechanical boundary condition imposed to V-bending and L-bending processes coupled with infrared rays local heating. Int. J. Mater. Form. 2018, 11, 417–433. [Google Scholar] [CrossRef]
- Lee, E.H. A review on applications of infrared heating for food processing in comparison to other industries. Innov. Food Processing Technol. A Compr. Rev. 2020, 431–455. [Google Scholar] [CrossRef]
- Lee, E.H.; Yang, D.Y. Design and analysis of infrared heating with overlapping heater array scheme for industrial application. Heat Transf. Eng. 2018, 39, 1344–1354. [Google Scholar] [CrossRef]
- Hou, Z.; Li, X.; Huang, Y.; Ho, S.T. Physics of elliptical reflectors at large reflection and divergence angles I: Their design for nano-photonic integrated circuits and application to low-loss low-crosstalk waveguide crossing. Opt. Commun. 2013, 287, 96–105. [Google Scholar] [CrossRef]
- Hou, Z.; Li, X.; Huang, Y.; Ho, S.T. Design of high efficiency elliptical reflector for strongly guiding waveguide. In Frontiers in Optics; FThC2; Optical Society of America: Washington, DC, USA, 2010. [Google Scholar]
- Sharma, G.P.; Verma, R.C.; Pathare, P. Mathematical modeling of infrared radiation thin layer drying of onion slices. J. Food Eng. 2005, 71, 282–286. [Google Scholar] [CrossRef]
- Purlis, E. Baking process design based on modelling and simulation: Towards optimization of bread baking. Food Control 2012, 27, 45–52. [Google Scholar] [CrossRef] [Green Version]
- Purlis, E. Optimal design of bread baking: Numerical investigation on combined convective and infrared heating. J. Food Eng. 2014, 137, 39–50. [Google Scholar] [CrossRef]
- Bagheri, H.; Kashaninejad, M. Kinetic modeling of mass transfer during roasting of soybeans using combined infrared-hot air heating. J. Food Biosci. Technol. 2018, 8, 1–12. [Google Scholar]
- Seyhun, N.A.D.İ.D.E.; Ramaswamy, H.; Sumnu, G.; Sahin, S.; Ahmed, J. Comparison and modeling of microwave tempering and infrared assisted microwave tempering of frozen potato puree. J. Food Eng. 2009, 92, 339–344. [Google Scholar] [CrossRef]
- Sun, X.; Zheng, Z.; Liu, X.; Gu, P. Etendue analysis and measurement of light source with elliptical reflector. Displays 2006, 27, 56–61. [Google Scholar] [CrossRef]
- Dong, X.; Ashman, P.J.; Nathan, G.J.; Sun, Z. Optical design of a high flux solar simulator configurable to achieve either a line or a point focus. In Proceedings of the Chemeca 2013: Challenging Tomorrow, Brisbane, QLD, Australia, 29 September–2 October 2013. [Google Scholar]
- Lee, E.H.; Yang, D.Y.; Yang, W.H. Numerical modeling and experimental validation of focused surface heating using near-infrared rays with an elliptical reflector. Int. J. Heat Mass Transf. 2014, 78, 240–250. [Google Scholar] [CrossRef]
- Lee, E.H.; Kim, W.S. Electrical–thermal–mechanical analysis of focused infrared heating Process. Int. J. Precis. Eng. Manuf. Green Technol. 2020, 7, 885–903. [Google Scholar] [CrossRef]
- Kim, T.H.; Park, S.H.; Lee, E.H.; Kang, Y.H.; Chung, J.S.; Ha, J. A New Mechanical Cold Trimming Process Assisted by Dashed Lined Infrared Heat Treatment of Martensitic Steel Considering Energy Efficiency. Int. J. Precis. Eng. Manuf. Green Technol. 2022, 1–22. [Google Scholar] [CrossRef]
- Takahashi, K.Y. Distribution functions in classical and quantum mechanics. Prog. Theor. Phys. Suppl. 1989, 98, 109–156. [Google Scholar] [CrossRef] [Green Version]
- Schrödinger, E. An undulatory theory of the mechanics of atoms and molecules. Phys. Rev. 1926, 28, 1049. [Google Scholar] [CrossRef]
- De Broglie, L. Waves and quanta. Nature 1923, 112, 540. [Google Scholar] [CrossRef]
- De Broglie, L. Recherches sur la Théorie des Quanta. Ph.D. Thesis, Migration-Université en Cours D’Affectation, Paris, France, 1924. [Google Scholar]
- Born, M. Statistical interpretation of quantum mechanics. Science 1955, 122, 675–679. [Google Scholar] [CrossRef] [Green Version]
- Han, J.; Zhang, L.; Weinan, E. Solving many-electron Schrödinger equation using deep neural networks. J. Comput. Phys. 2019, 399, 108929. [Google Scholar] [CrossRef] [Green Version]
- Hermann, J.; Schätzle, Z.; Noé, F. Deep-neural-network solution of the electronic Schrödinger equation. Nat. Chem. 2020, 12, 891–897. [Google Scholar] [CrossRef]
- Wismer, M.S.; Kruchinin, S.Y.; Ciappina, M.; Stockman, M.I.; Yakovlev, V.S. Strong-field resonant dynamics in semiconductors. Phys. Rev. Lett. 2016, 116, 197401. [Google Scholar] [CrossRef] [Green Version]
- Feit, M.D.; Fleck Jr, J.A. Solution of the Schrödinger equation by a spectral method II: Vibrational energy levels of triatomic molecules. J. Chem. Phys. 1983, 78, 301–308. [Google Scholar] [CrossRef]
- Griffiths, D.J.; Schroeter, D.F. Introduction to Quantum Mechanics, 3rd ed.; Cambridge University Press: Cambridge, UK, 2018; pp. 1–12. ISBN 978-1-107-18963-8. [Google Scholar]
- Zhang, P.; Zhang, S.; Liu, X.; Qiu, L.; Yi, G. A Least Squares Ensemble Model Based on Regularization and Augmentation Strategy. Appl. Sci. 2019, 9, 1845. [Google Scholar] [CrossRef] [Green Version]
- Griffiths, D.J. Introduction to Electrodynamics, 4th ed.; Cambridge University Press: Cambridge, UK, 2017; p. 222. ISBN 978-1-108-42041-9. [Google Scholar]
- Cortés, A.; Jiménez-Suárez, A.; Campo, M.; Ureña, A.; Prolongo, S.G. Assessment of Manufacturing Parameters for New 3D-Printed Heating Circuits Based on CNT-Doped Nanocomposites Processed by UV-Assisted Direct Write. Appl. Sci. 2021, 11, 7534. [Google Scholar] [CrossRef]
- Lipp, V.; Rethfeld, B.; Garcia, M.; Ivanov, D. Solving a system of differential equations containing a diffusion equation with nonlinear terms on the example of laser heating in silicon. Appl. Sci. 2020, 10, 1853. [Google Scholar] [CrossRef] [Green Version]
- Chiriac, G.; Lucache, D.D.; Nițucă, C.; Dragomir, A.; Ramakrishna, S. Electric Bus Indoor Heat Balance in Cold Weather. Appl. Sci. 2021, 11, 11761. [Google Scholar] [CrossRef]
- Lee, E.H.; Yang, D.Y.; Yoon, J.W.; Yang, W.H. Numerical modeling and analysis for forming process of dual-phase 980 steel exposed to infrared local heating. Int. J. Solids Struct. 2015, 75, 211–224. [Google Scholar] [CrossRef]


| Normalizing Coefficient | Component Coefficient | |||||
|---|---|---|---|---|---|---|
| Focal Length | ||||||
| Elliptical reflectors | ||||||
| Type | Focal Length | Length of Major Axis | Length of Minor Axis | Entrance Length | Reflectivity | Power of the Lamp |
| Reflector 1 | 20 | 21.6 | 9.1 | 33.94 | 0.85 | 2000 |
| Reflector 2 | 40 | 34 | 27.5 | 44.47 | 0.85 | 2000 |
| IR lamp | Electrical Resistivity | Rated Voltage | ||||
| 1.3 | 11 | 90 | 220 | |||
| Heated material (DP 980) | |||||
| Temperature | Thermal Conductivity | Specific Heat Capacity | Absorptivity | Emissivity | Density |
Publisher’s Note: MDPI stays neutral with regard to jurisdictional claims in published maps and institutional affiliations. |
© 2022 by the authors. Licensee MDPI, Basel, Switzerland. This article is an open access article distributed under the terms and conditions of the Creative Commons Attribution (CC BY) license (https://creativecommons.org/licenses/by/4.0/).
Share and Cite
Oh, S.-H.; Lee, E.-H. A New Approach to Modeling Focused Infrared Heating Based on Quantum Mechanical Formulations. Appl. Sci. 2022, 12, 3256. https://doi.org/10.3390/app12073256
Oh S-H, Lee E-H. A New Approach to Modeling Focused Infrared Heating Based on Quantum Mechanical Formulations. Applied Sciences. 2022; 12(7):3256. https://doi.org/10.3390/app12073256
Chicago/Turabian StyleOh, Sung-Hyun, and Eun-Ho Lee. 2022. "A New Approach to Modeling Focused Infrared Heating Based on Quantum Mechanical Formulations" Applied Sciences 12, no. 7: 3256. https://doi.org/10.3390/app12073256
APA StyleOh, S.-H., & Lee, E.-H. (2022). A New Approach to Modeling Focused Infrared Heating Based on Quantum Mechanical Formulations. Applied Sciences, 12(7), 3256. https://doi.org/10.3390/app12073256