Article

Cross-Laminated Timber Floor: Analysis of the Acoustic Properties and Radiation Efficiency

Faculty of Science and Technology, Free University of Bozen, 39100 Bolzano, Italy
*
Author to whom correspondence should be addressed.
Appl. Sci. 2022, 12(7), 3233; https://doi.org/10.3390/app12073233
Submission received: 24 January 2022 / Revised: 14 March 2022 / Accepted: 17 March 2022 / Published: 22 March 2022

Abstract

:
Cross-Laminated Timber (CLT) is a building technology that is becoming increasingly popular due to its sustainable and eco-friendly nature, as well as its availability. Nevertheless, CLT presents some challenges, especially in terms of impact noise and airborne sound insulation. For this reason, many studies focus on the vibro-acoustic behavior of CLT building elements, to understand their performance, advantages and limitations. In this paper, a 200 mm CLT floor has been characterized in the laboratory, according to ISO standards, by three noise sources: dodecahedron, standard tapping machine and rubber ball. In order to understand the vibro-acoustic behavior of the CLT floor, measurements through the analysis of sound pressure levels and velocity levels, measured by dedicated sensors, were performed. Analysis was carried out in order to understand what is prescribed by the prediction methods available in the literature and by the simulation software. Then, a specific prediction law for the CLT floor under investigation was derived. Finally, an analysis on sound radiation index is provided to complete the vibro-acoustic study.

1. Introduction

Cross-Laminated Timber (CLT) has increasingly become a timber product of global interest [1]. On the one hand, this is due to (i) the many merits of eco-sustainable wooden building elements, characterized by wide availability in nature, (ii) relative ease of handling and (iii) its environmental friendliness and wide range of end uses [2]. On the other hand, CLT is well known for its suitability [3] in the construction sector and its structural behavior [4]. However, due to their lightweight characteristics, CLT structures are characterized by poor acoustic performance [5]. Many studies were developed to determine if timber component properties are well known among users and the scientific community. The results demonstrate that there is no agreement on this topic [6].
For these reasons, there have been several recent experimental studies to determine the acoustic performance of CLT, with particular attention to its impact on noise behavior [7], and also for comfort perspective on users [8].
For example, Hoeller et al. [9] published the results of a comprehensive experimental study on the sound reduction index of CLT wall and floor systems, and also presented a method usable for calculating the flanking sound transmission, based on the vibrations measurement of sound reduction index, related to different types of panel joints. Schoenwald et al. [10] carried out measurements aimed at quantifying the impact noise of CLT floors, the airborne sound transmission and the lateral transmission, through joints between CLT panels, which were used as a starting database to assess the acoustic performance of a large building structure. Homb et al. [11] collected the results of laboratory measurements on the impact insulation of various CLT floor constructions. Other studies on the impact insulation of different CLT floor systems are presented by Zeitler et al. [12], Di Bella et al. [13] and Caniato et al. [14,15,16]. Barbaresi et al. [17] presented the results of an experimental campaign on flanking sound transmission.
In this perspective, further studies are needed to develop and improve prediction models of CLT floor sound and vibrational behavior [18,19]. In this regard, the sound radiation index is of paramount importance to understand and simulate the behavior of these elements [20,21]. Hence, to design CLT structures with good acoustic insulation, there is a need to characterize the sound radiation of the vibrating elements. Acoustic radiation has generated increasing interest over the past decades and it has been used in acoustic calculation models, for example, ISO 12354-1 [22].
Thus, to obtain a complete vibro-acoustic characterization and, in particular, to fully understand how material properties impact on the acoustic performance of structural elements, and meet the high quality standards required for CLT floors [23], the sound radiation of CLT floor is an issue that needs to be deepened and studied.
Atalla and Nicolas, in 1994 [24], presented an extensive and detailed bibliographic analysis of the prediction models to compute sound radiation in the same decade, while Nelisse et al. [25] proposed a generalized model for the acoustic radiation from baffled and unbaffled homogeneous plates, with arbitrary boundary conditions. A similar approach was also used by Foin et al. [26] and by Hosseinkhani et al. [27,28], to develop a tool to predict the acoustic and structural vibration response of sandwich plates. More recently, Mejdi and Atalla [29] presented a semi-analytical model to investigate, numerically, the vibro-acoustic response of stiffened plates, while Legault et al. [30] analyzed orthogonally ribbed plates by means of a periodic theory. Rhazi and Atalla [31] used statistical energy analysis and the transfer matrix method to estimate the vibro-acoustic response of mechanically excited multilayer structures.
Considering these studies as a reference, analyses on the vibro-acoustic behavior and radiation efficiency of wooden elements have recently been developed [32]. Fortini et al. [33] characterized the vibro-acoustic behavior of a composite structure and presented a comparison between the sound reduction index predictions and measurements in sound transmission suites, according to ISO 10140-2. Wang et al. [34] compared and validated simulated results with measurements of a timber joist floor, then analyzing the importance of the modes of the case study room and the correlation with the behavior of its floor. Conta and Homb [35] performed experimental investigations to identify the modal properties of such a system and to gain understanding of the sound radiation properties under impact excitation, using both experimental modal analysis (EMA) and the integral transform method (ITM). The results highlight the limitations of standard acoustic laboratories and show the importance of using advance measurement methods to acquire reliable data.
In addition to the studies mentioned above, there are also numerous works dealing with the vibro-acoustic characterisation of wooden floors, in particular with the impact noise [36,37,38,39,40]. Nevertheless, some recent studies have shown the need to study this issue in more detail [41,42].
A recent study [43] has shown, through a Round Robin Test, how the use of software and calculation models, currently available for the study of the characteristics of multilayer systems, are not reliable when wooden structures are used. For this reason, it is of paramount importance not only to know the characteristics of the materials, but also their radiation efficiency.
The study of sound radiation, in relation to the characterization of CLT floors, is still partially incomplete.
For these reasons, this paper presents: (i) An acoustic investigation of a 200 mm thick CLT floor, conducted in the laboratory, according to ISO 10140 series standards [44,45,46,47,48], both using sound pressure and vibration excitation. The systematic use of the rubber ball as exciting source is included, in order to investigate every above-presented parameter with this noise source. Indeed, if some research focused on the analysis of the impact noise produced by the rubber ball for concrete floors [41,42,49,50,51,52,53,54], only few studies focused on timber floors [55,56,57,58]. (ii) A new mass law for CLT elements in CLT. (iii) In addition to the comparison of the three sound sources, a detailed study on experimental approaches and comparison, with the outcomes of two simulation software for the full characterization of the CLT floors, was provided. (iv) A complete analysis of the radiation efficiency by varying the type of source. (v) Some simulation methods were compared with existing models.
The novelty of the research consists of studying the acoustic behavior of a CLT floor with three different noise sources and deriving equations that best fit the insulation characteristics of this type of floor.
The article is organized as follows. Section 2 summarizes the physical characteristics of the CLT floor, examined the design of the laboratory used for the measurements and the equations used for the measurements and the theoretical analysis. Section 3 shows the results of measurements, relating to airborne and vibrational noise. Section 4 shows a comparison between simulation methods and measurements. Conclusions are drawn in Section 5.

2. Materials and Methods

In this study the impact and airborne sound insulations as well as the radiation efficiency are investigated using sound pressure and velocity sensors on a CLT floor in the laboratory of the Free University of Bolzano, accordingly to ISO 10140-5 [48], to minimize flanking transmission. The laboratory consists of massive structure lined with double layer of gypsum board with a cavity filled with rock wool panels. The test frame and the floor of the receiving room are made of concrete. The two doors of the laboratory have a weighted sound reduction index of 42 dB (Figure 1).
In order to minimize the variability of the measurements with time a seasoned wood floor was adopted. Thus, for this reason the measurements were all carried out in a short time range (2 consecutive days).
The 5-layer CLT floor has dimensions of 4155 mm (longer length) × 3000 mm (shorter length) with a mass per unit area, m’, of 84 kg/m2 and a thickness of 200 mm. The shorter length consists of three resistant timber layers, while the longer length direction consists of two resistant wood layers (Figure 2).
The CLT floor is made of spruce and it is classified as a C24 according to the EN 338 [59], with the properties described in Table 1.
The CLT floor was laid on an anti-vibration material, 30 mm thick, with a density of 500 kg/m3. The perimeter of the specimen is therefore not bound to the structure.
To characterize the acoustic behavior of the CLT floor’s airborne and impact noise, some acoustic indices were determined. With sound pressure levels measurements, the normalized impact sound pressure level with tapping machine, the sound reduction index and the impact sound pressure with rubber ball have been determined. Velocity levels and radiation efficiency levels are then determined combining the vibration and acoustic measurements.
For the measurements, an airborne source and two impact noise sources according to ISO 10140-5 were used (Figure 3). A Svantek 958 four-channel analyzer to acquire sound pressure and vibration data was used.
An omnidirectional source with twelve loudspeakers (airborne source) driven with a pink noise signal, a standard tapping machine and a rubber ball have been used, respectively. In particular, the rubber ball is useful for a low frequency analysis.
The tapping machine is the one most used both in the study of bare structures and in the case of the application of additional layers [60]. The three sources above described are illustrated in Figure 3.

2.1. Acoustic and Vibration Parameters Determined from Measurements

The normalized impact sound pressure level, Ln, measured with a standard tapping machine and the energy average maximum impact sound pressure level measured with rubber ball, Li,Fmax, are determined according to ISO 10140-3 [46]. Weighted indices, Ln,w, evaluated from 100 Hz to 3150 Hz, and LiA,Fmax, evaluated from 50 Hz to 630 Hz, have been derived according to ISO 717-2 standard [61]. For the measurements with the tapping machine and with the rubber ball, 4 positions of the source (A, B, C, D) and 5 fixed positions of the microphone (R1, R2, R3, R4, R5) have been used as depicted in Figure 4.
The sound reduction index, R, is calculated according to ISO 10140-2 [45]. The weighted sound reduction index, Rw, is evaluated in the frequency range 100–3150 Hz and is calculated according to ISO 717-1 [62]. For the measurement of the sound reduction index two positions (A, C) of the source and 5 positions of the microphone have been used (Figure 4).
For all the measurements, the microphones have been positioned in a range of heights between 1 and 1.5 metres in order to avoid positions on the same plane.
Velocity levels were measured with an accelerometer fixed in 9 positions with screws. A reference velocity value, v0, of 10−9 m/s has been considered.
The noise sources (tapping machine, dodecahedron and rubber ball) were positioned at 3 points (A, B, C) for a total of 27 measurements, according to ISO 10848-1 [63] (Figure 5).
Radiation power, Wrad, radiation efficiency, σ r a d and radiation index, L σ r a d , are derived by the Equations (1)–(3) [64]:
W r a d = A p 2 S , t 4 ρ 0 c 0 1 + S T λ 0 8 V ,
σ r a d = W r a d S ( v 2 ) S , t ρ 0 c 0
L σ r a d = 10 lg σ r a d
where A is the equivalent absorption area of the receiving room, p 2 S , t , is the average sound pressure (with tapping machine, dodecahedron or rubber ball), ρ 0 is the air density, c0 is the speed of sound, ST is the room surface, λ 0 is the wavelength and V is the room volume, S is the floor surface and v 2 S , t is the average square vibration velocity (with tapping machine, dodecahedron or rubber ball).
The sound pressure level can be obtained with Equation (4):
L i = L v + L σ r a d 28 + 10 lg S A
The normalized impact sound pressure level is obtained by the following Equation (5):
L n = L i + 10 lg A A 0
The normalized impact sound pressure level in one-third octave bands emitted by the impact of the hammers of the tapping machine is expressed by Equation (6) from ISO 12354-2 [22]:
L n = L F + 10 lg R e Y + 10 lg σ r a d 10 lg m + 10 lg T s + 10.6
where LF is the force level of the tapping machine (reference 10−6 N), Re(Y) is the real part of the floor mobility Y = v/F, σrad is the radiation efficiency for free bending waves, m′ is the mass per unit area, Ts is the structural reverberation time, considered in accordance with the relation expressed by Barbaresi et al. [17] in their study.
For the examined CLT floor the following equation was found which best fit the curve of the measured values:
L n _ pr = L F + 10 lg R e Y + 12 lg σ r a d 10 lg m + 10 lg T s + 6.8
As regards the tapping machine, a force value in 1/3 octave band of 0.91 f [64] was considered.
In this research, Equation (6) was also used in the case of the rubber ball, considering the maximum force values measured and subtracting the normalization term 10 lg A A 0 , as depicted by Equation (8):
L i , F m a x = L Fmax + 10 lg R e   Y max + 10 lg σ r a d 10 lg m + 10 lg T s + 10.6 10 lg A A 0
where LFmax is the maximum force level of the rubber ball, Re(Ymax) is the real part of the floor mobility.
For the examined CLT floor the following equation was found which best fit the curve of the measured values:
L i , F m a x _ p r = L Fmax + 10 lg R e   Y max + 10 lg σ r a d 10 lg m + 2 lg T s + 5 10 lg A A 0
The impact force exposure levels generated by the rubber ball LFE with a reference period of 1 s are reported in Table 2 according to ISO 10140-5 [48].
Since the reported values in Table 2 are not maximum values nor in 1/3 octave bands, the equivalent curve, LF (1/3 oct) was obtained [13]. To obtain the value correspondent to the reference time of 1 s and then considering the maximum difference in level between the measured and evaluated ones the conversion values were obtained according to the formula LF_max-LF (1/3 oct) (Figure 6).

2.2. Simulations and Analytical Models

Firstly, two commercial software both based on traditional mass law and Sewell correlation [65] were used to compare the simulated versus the measured sound reduction index for the analyzed CLT floor. The elastic properties of the material, such as Young’s modulus and the loss factor, were varied, while the real dimensions of the tested slab were considered for the geometry.
Secondly, a numerical model with multi-quadratic interpolation function was used to map the sound radiation index for the three sound sources (tapping machine, dodecahedron, rubber ball). The sound reduction index was determined for the nine positions of the vibration measurement depicted in Section 3.2 permitting the characterization of the average sound pressure level for the three positions of each source.

3. Results and Discussion

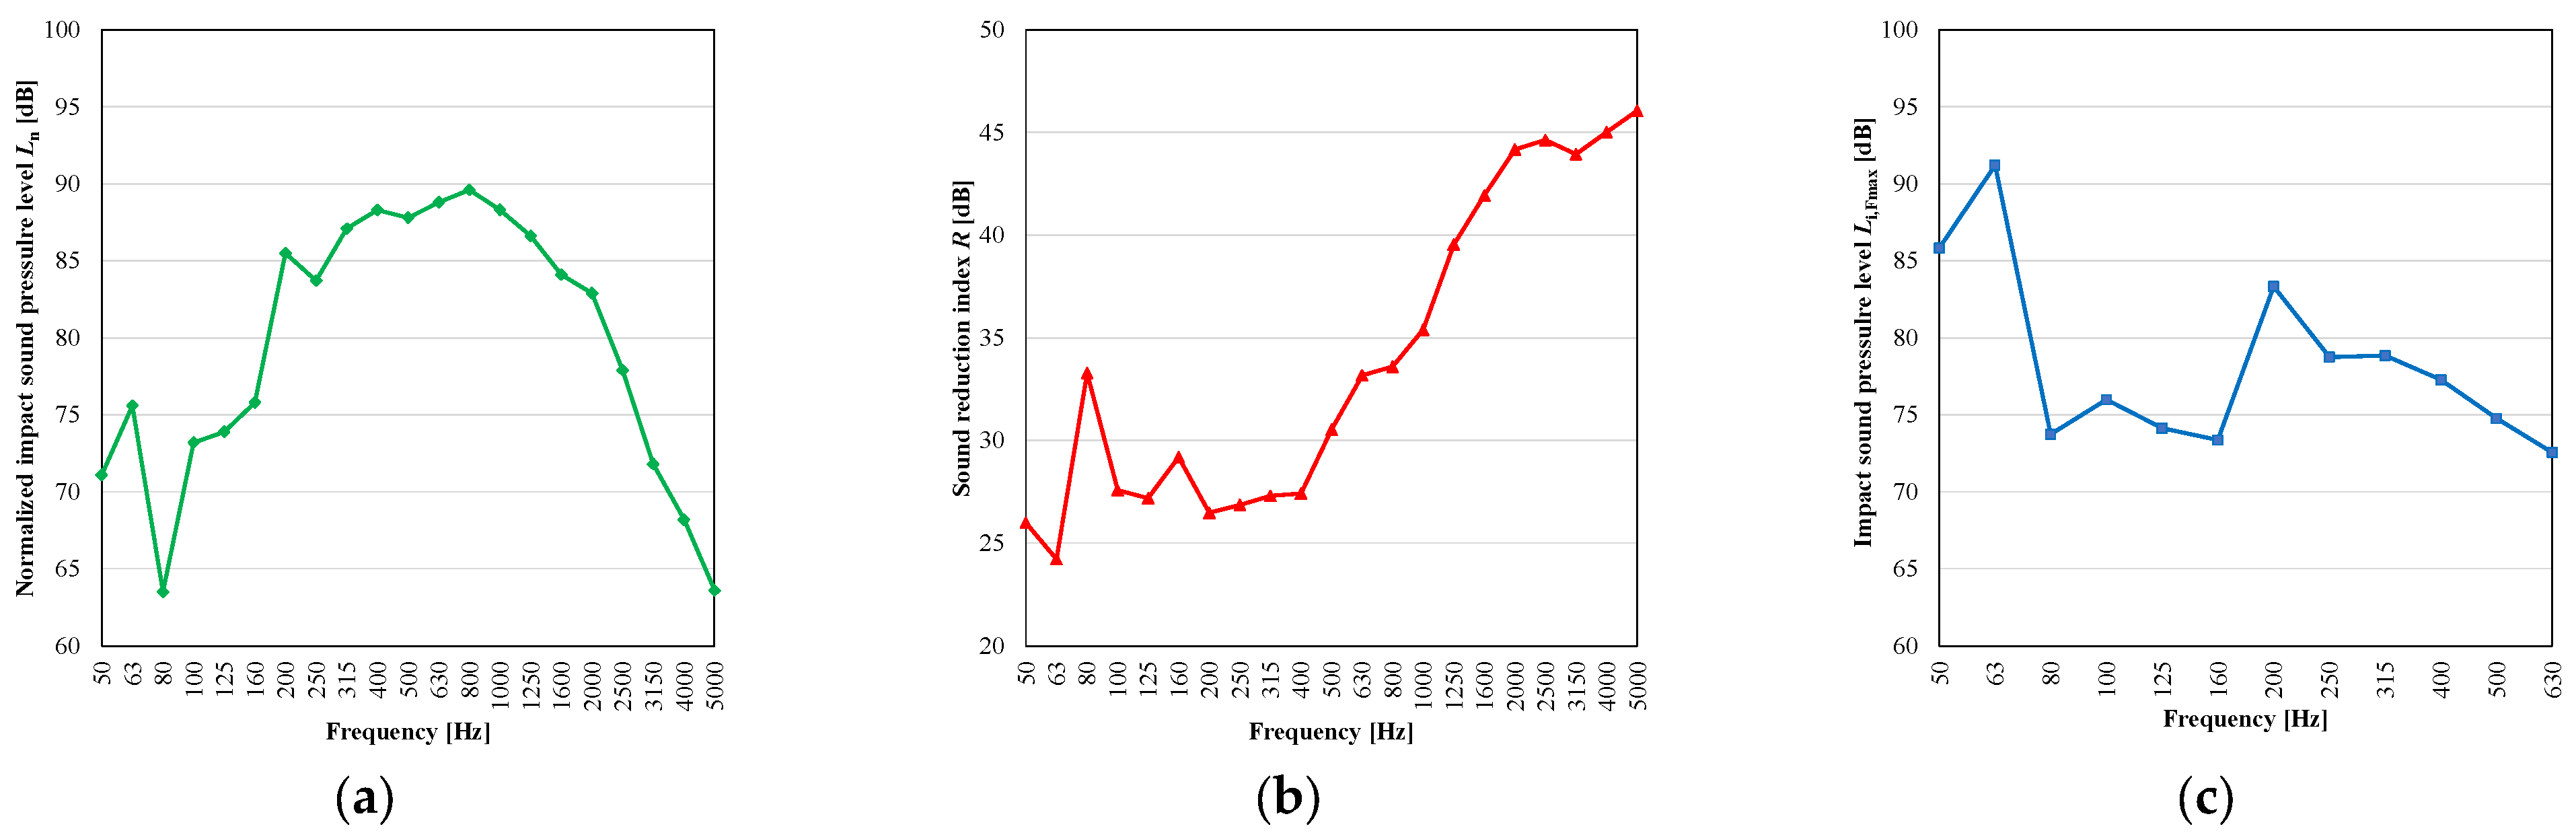
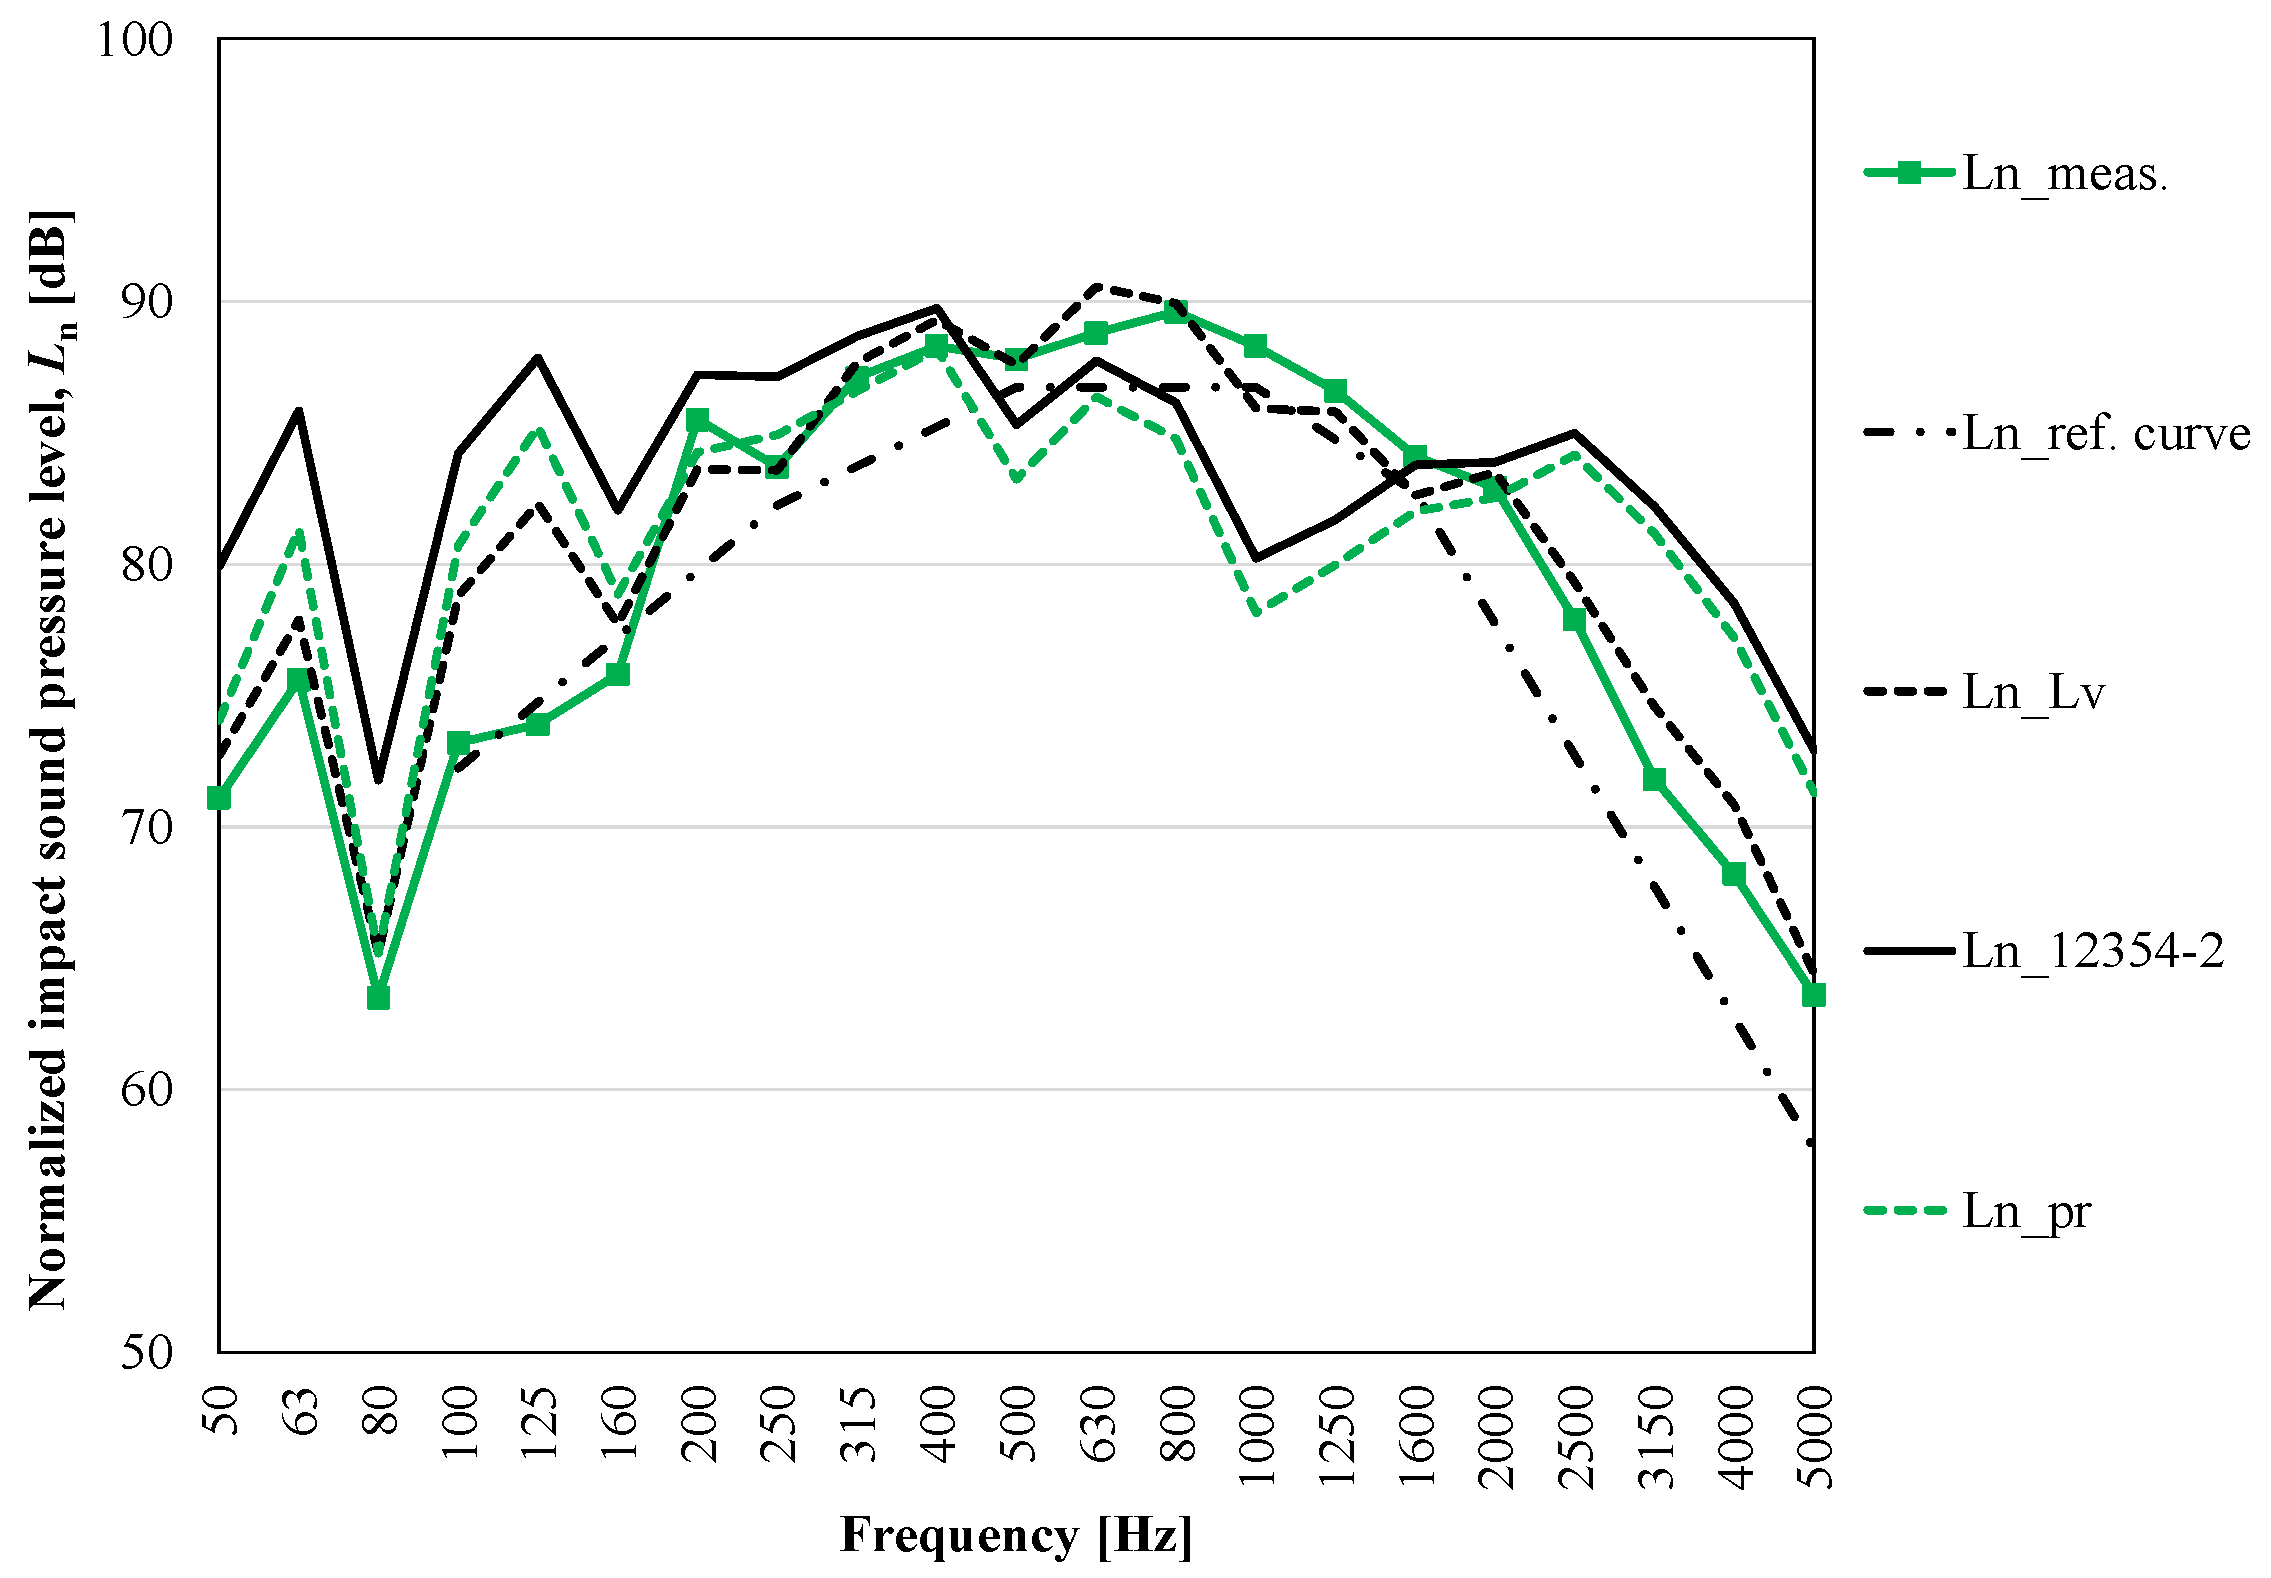
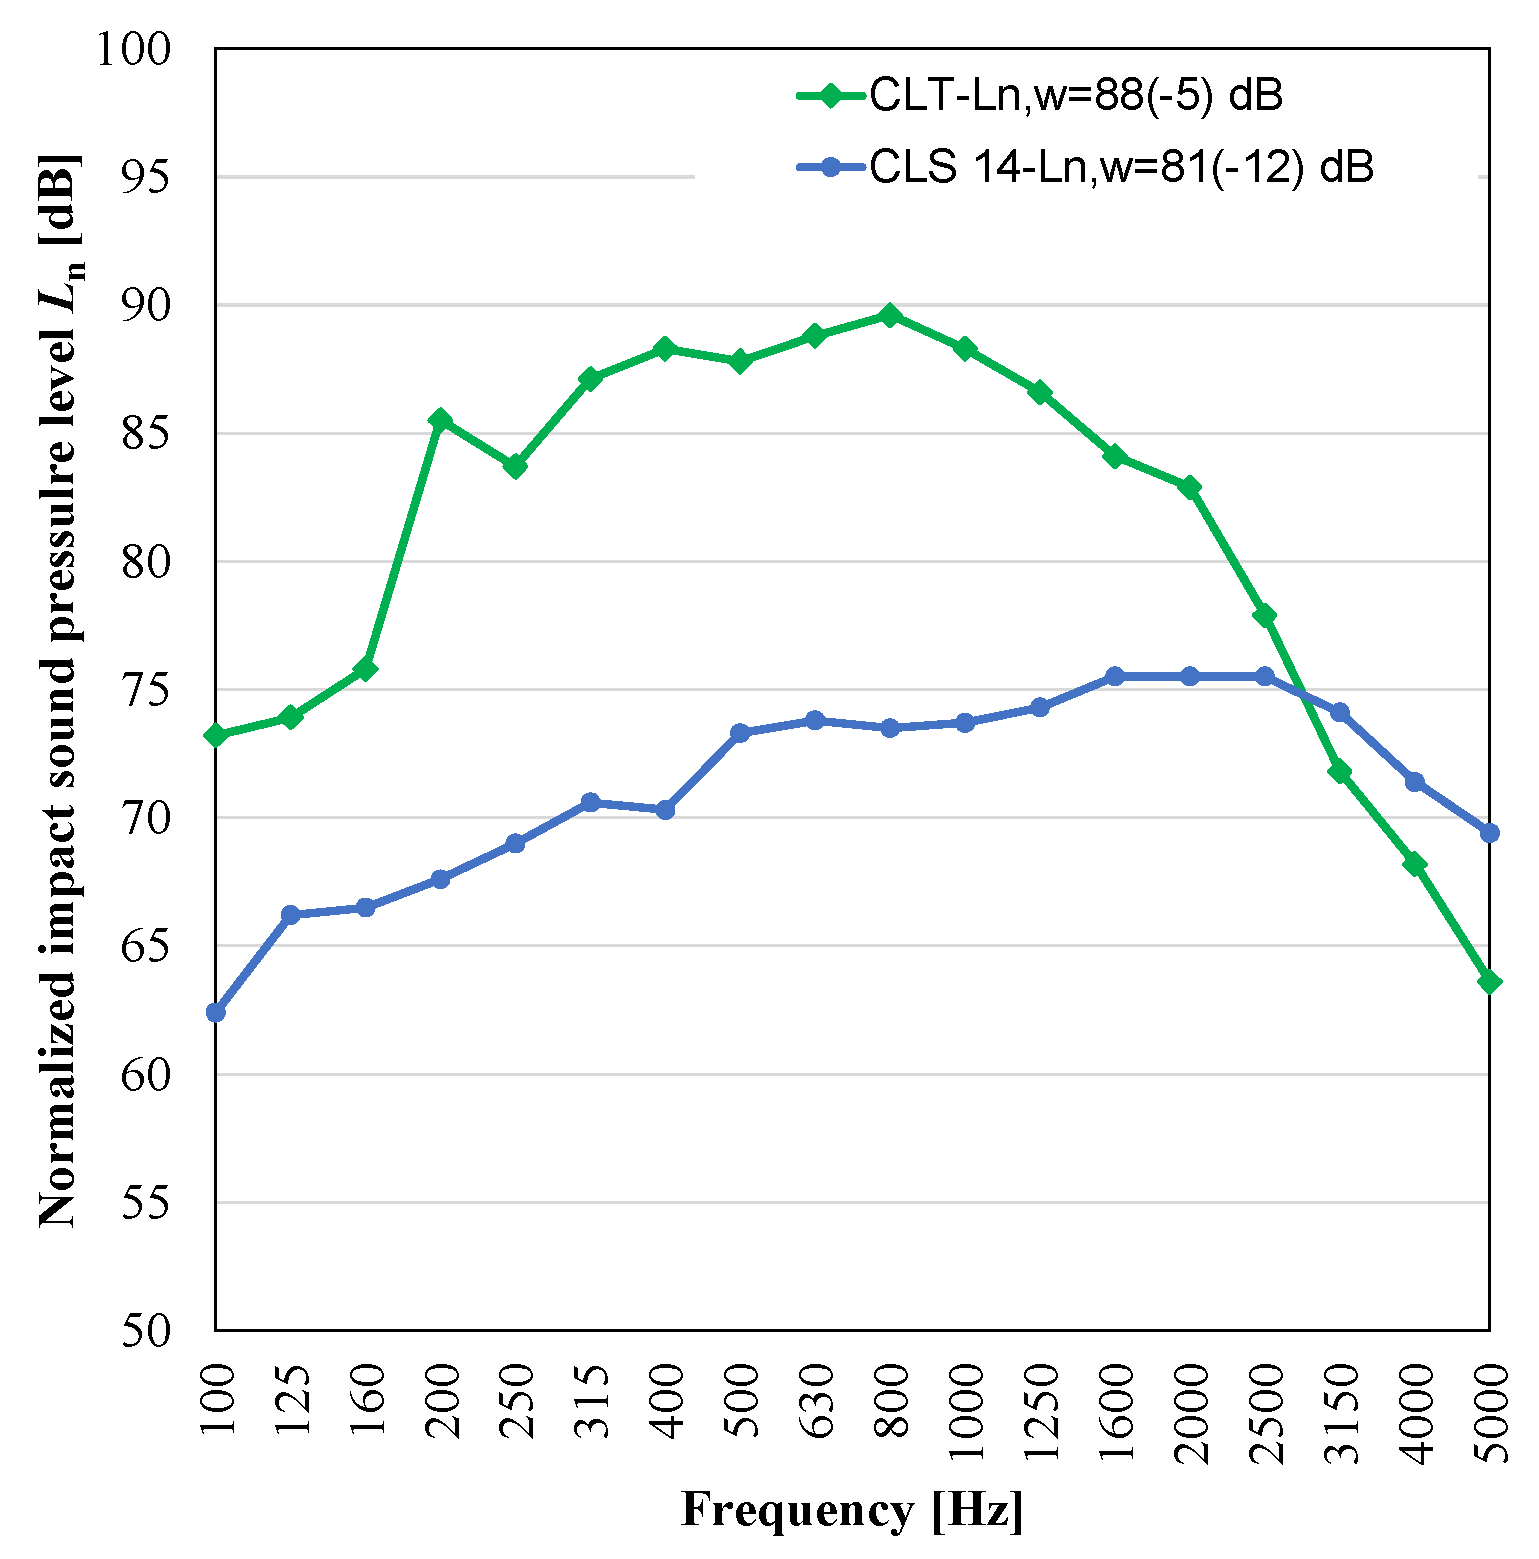
3.1. Experimental Results: Sound Pressure Level-Derived Parameters
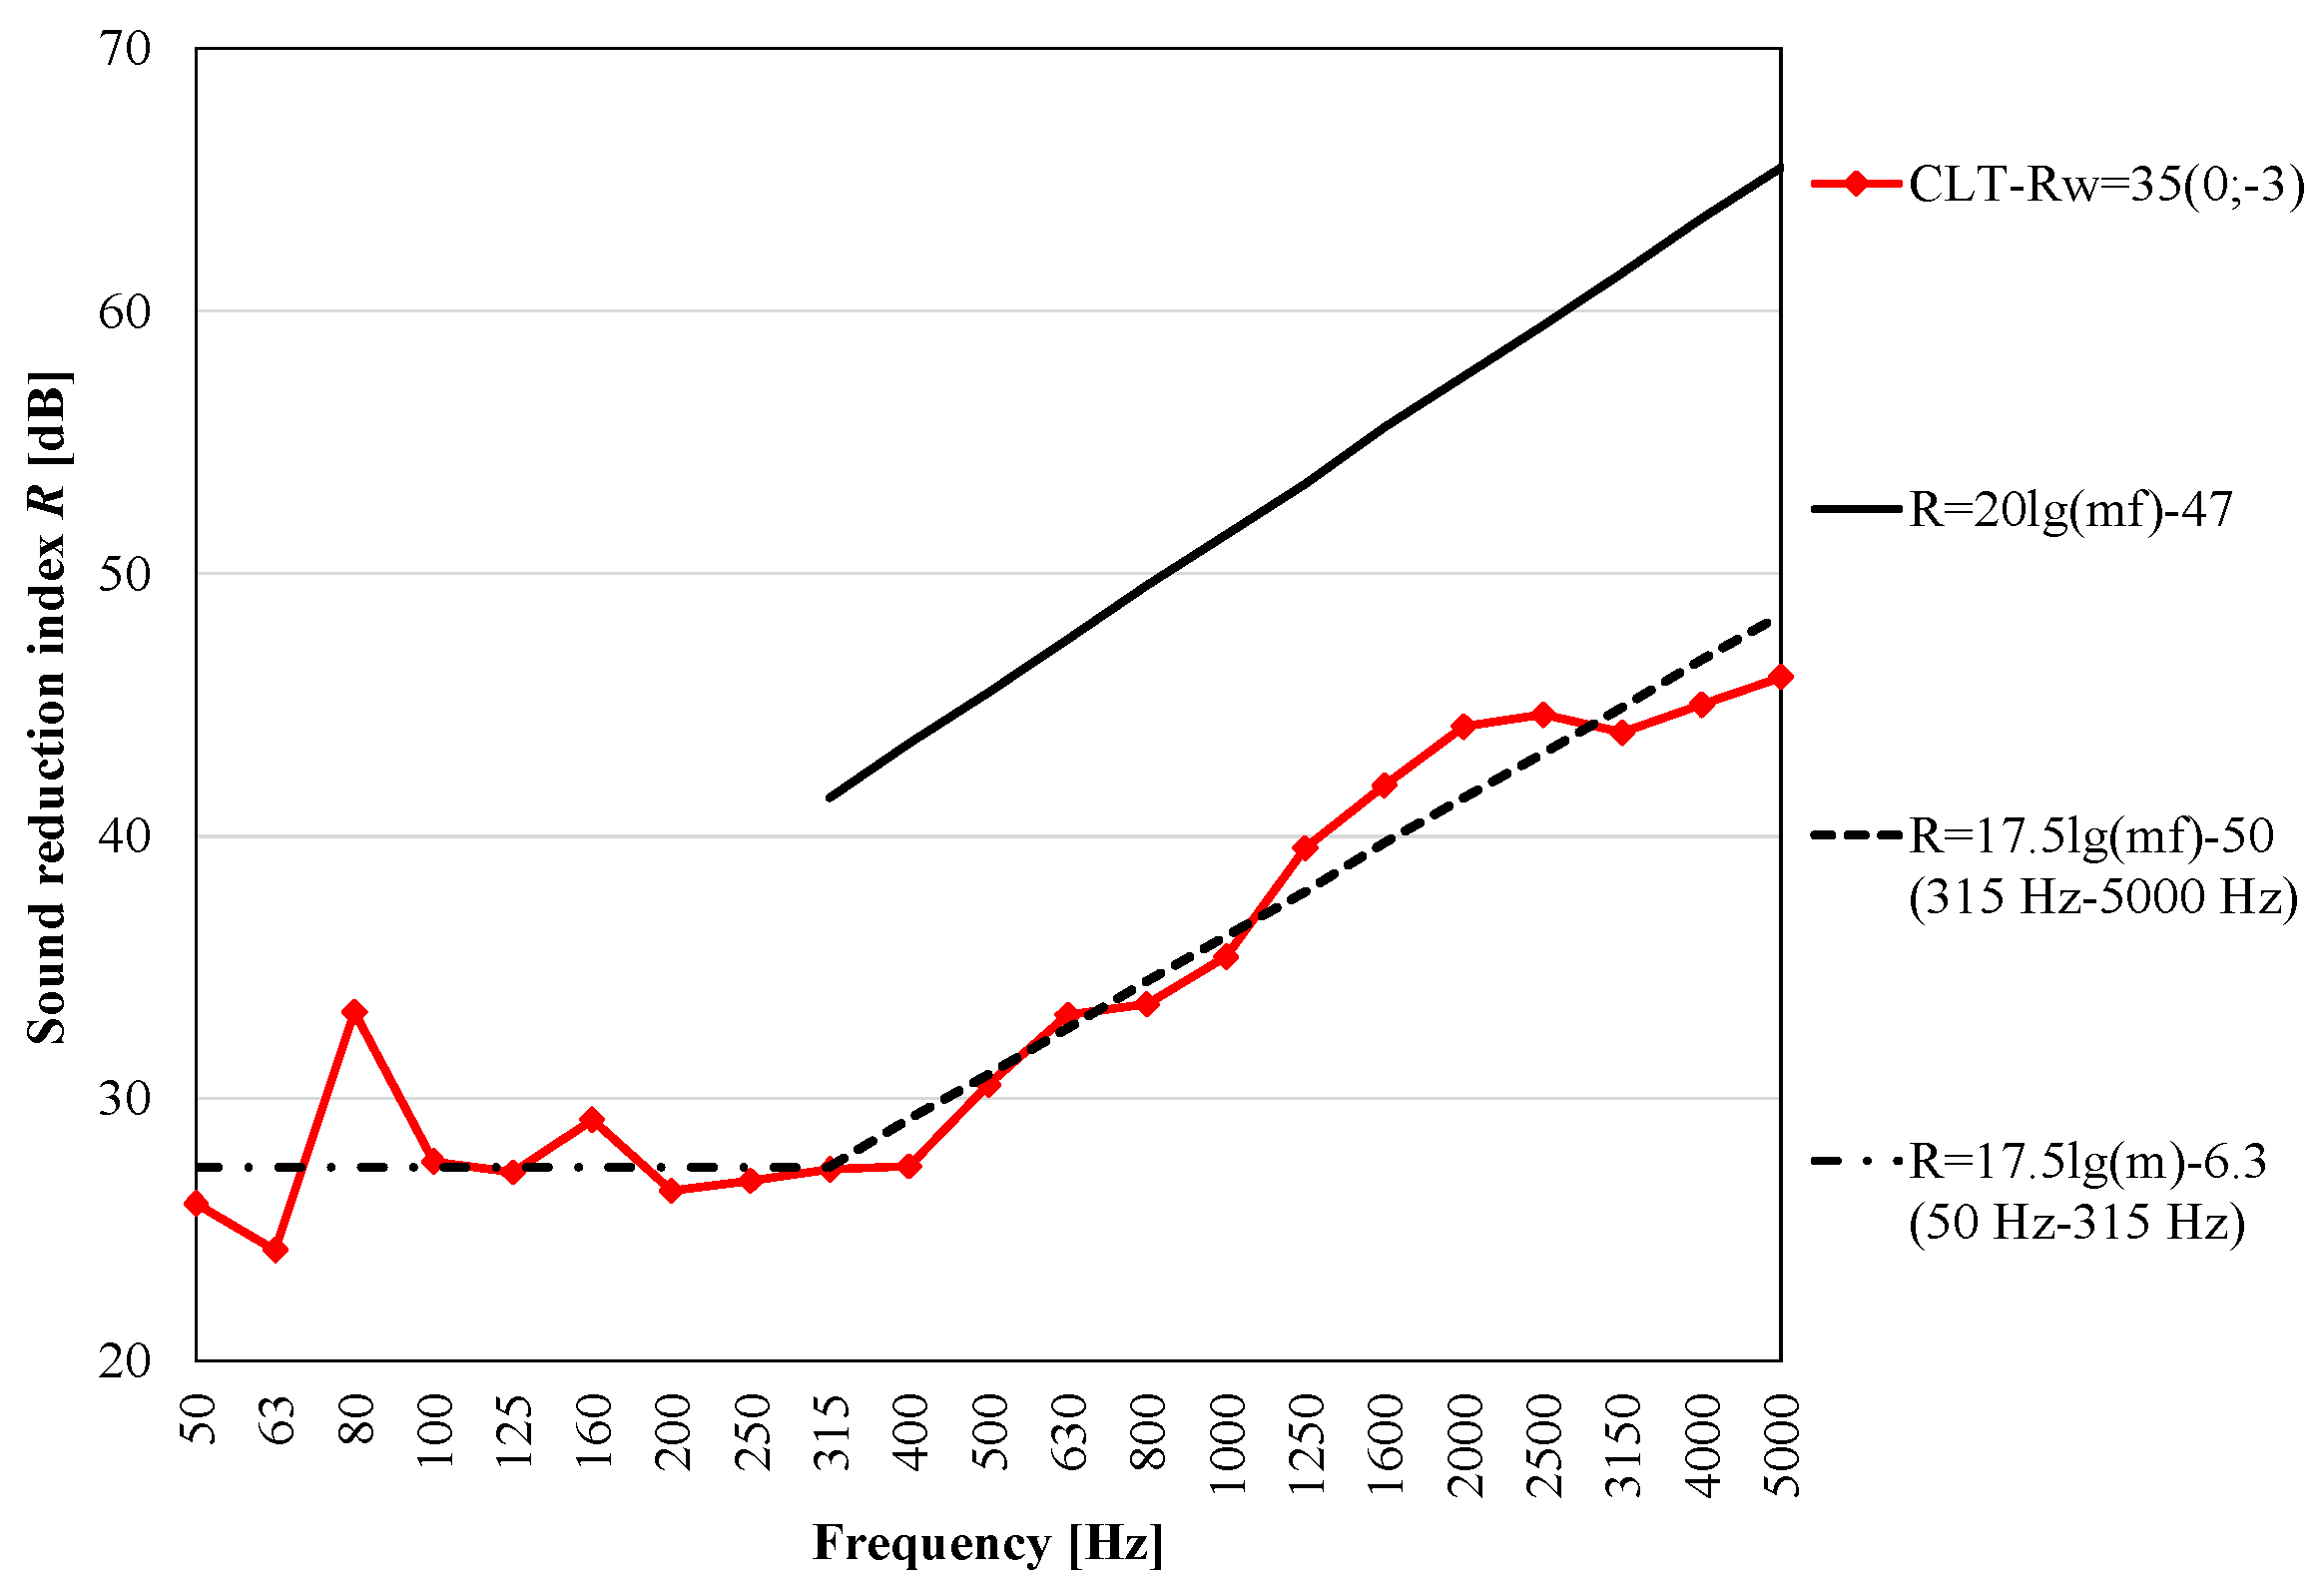
The normalized impact sound pressure level obtained using the tapping machine, the sound reduction index retrieved using a dodecahedron and the maximum sound pressure levels measured impinging the rubber ball on the 200 mm CLT floor are shown in Figure 7.
For normalized impact sound pressure level, a resonant frequency of 63 Hz is clearly highlighted. Above 800 Hz, the impact of the sound pressure level decreases, as the surface dampens the impact of the hammers by attenuating the impact force. This is due to the fact that the wooden surface of the floor is much less rigid than, for example, a concrete floor, for which this phenomenon is much less noticeable [66] (Figure 8).
Due to this important aspect, it is not possible, for example, to use the attenuation data of the impact sound pressure level, obtained on a normalized concrete floor, on wooden floors. The L n   at high frequency, obtained on the normalized concrete floor of a lining, is greater than the same lining applied on a wooden floor, because floating floors are effective above high frequencies, where the wooden floor has a good impact acoustic behavior, with respect to mass.
When looking at the sound reduction index, R, (Figure 7b) a resonant frequency at 63 Hz is also determined. It can be noted that a mass-law-like trend, starting from 315 Hz, is present.
From the comparison of the impact sound pressure level produced by the standard tapping machine (Figure 7c), and the sound reduction index (Figure 7b), it is clear that the peak of R, at 80 Hz, corresponds to the minimum impact sound pressure level, as expected [67,68]. Then, in the case of the impact sound pressure level and the rubber ball trends, the resonance frequency is also at 63 Hz.
The weighted index values are depicted in Table 3.
The weighted impact sound pressure level and weighted sound reduction index are consistent with the literature [12], confirming the possibility of extending the results obtained in this research to other CLT floors.
In Figure 9, the standard deviations associated to the sound pressure levels and measured for the three sources in the receiving room are compared. Due to the greater variability in the positioning of the source, the rubber ball results are characterized by higher values of standard deviation than the other sources.
In the case of the impact measurements, it can be noted that due to the non-homogeneous contact surface, the standard deviation is greater than with the airborne measurements. In the literature, the difference is less evident, probably due to the analysis of homogeneous heavy weight floors [69].
Then, by comparing the measured sound reduction index with the ones derived from the mass law R = 20lg(mf) − 47 [70], a new correlation was retrieved experimentally, starting from 315 Hz, according also to the range frequency of the mass law. The proposed mass law for the 200 mm CLT timber floor analyzed here is expressed in Equation (10).
R = 17.5 lg m f 50
Then, a comparison of the here-proposed mass law versus the traditional one [70] and the measured sound reduction index is proponed to focus on its reliability. From the results depicted in Figure 10, the following highlights can be drawn:
1.
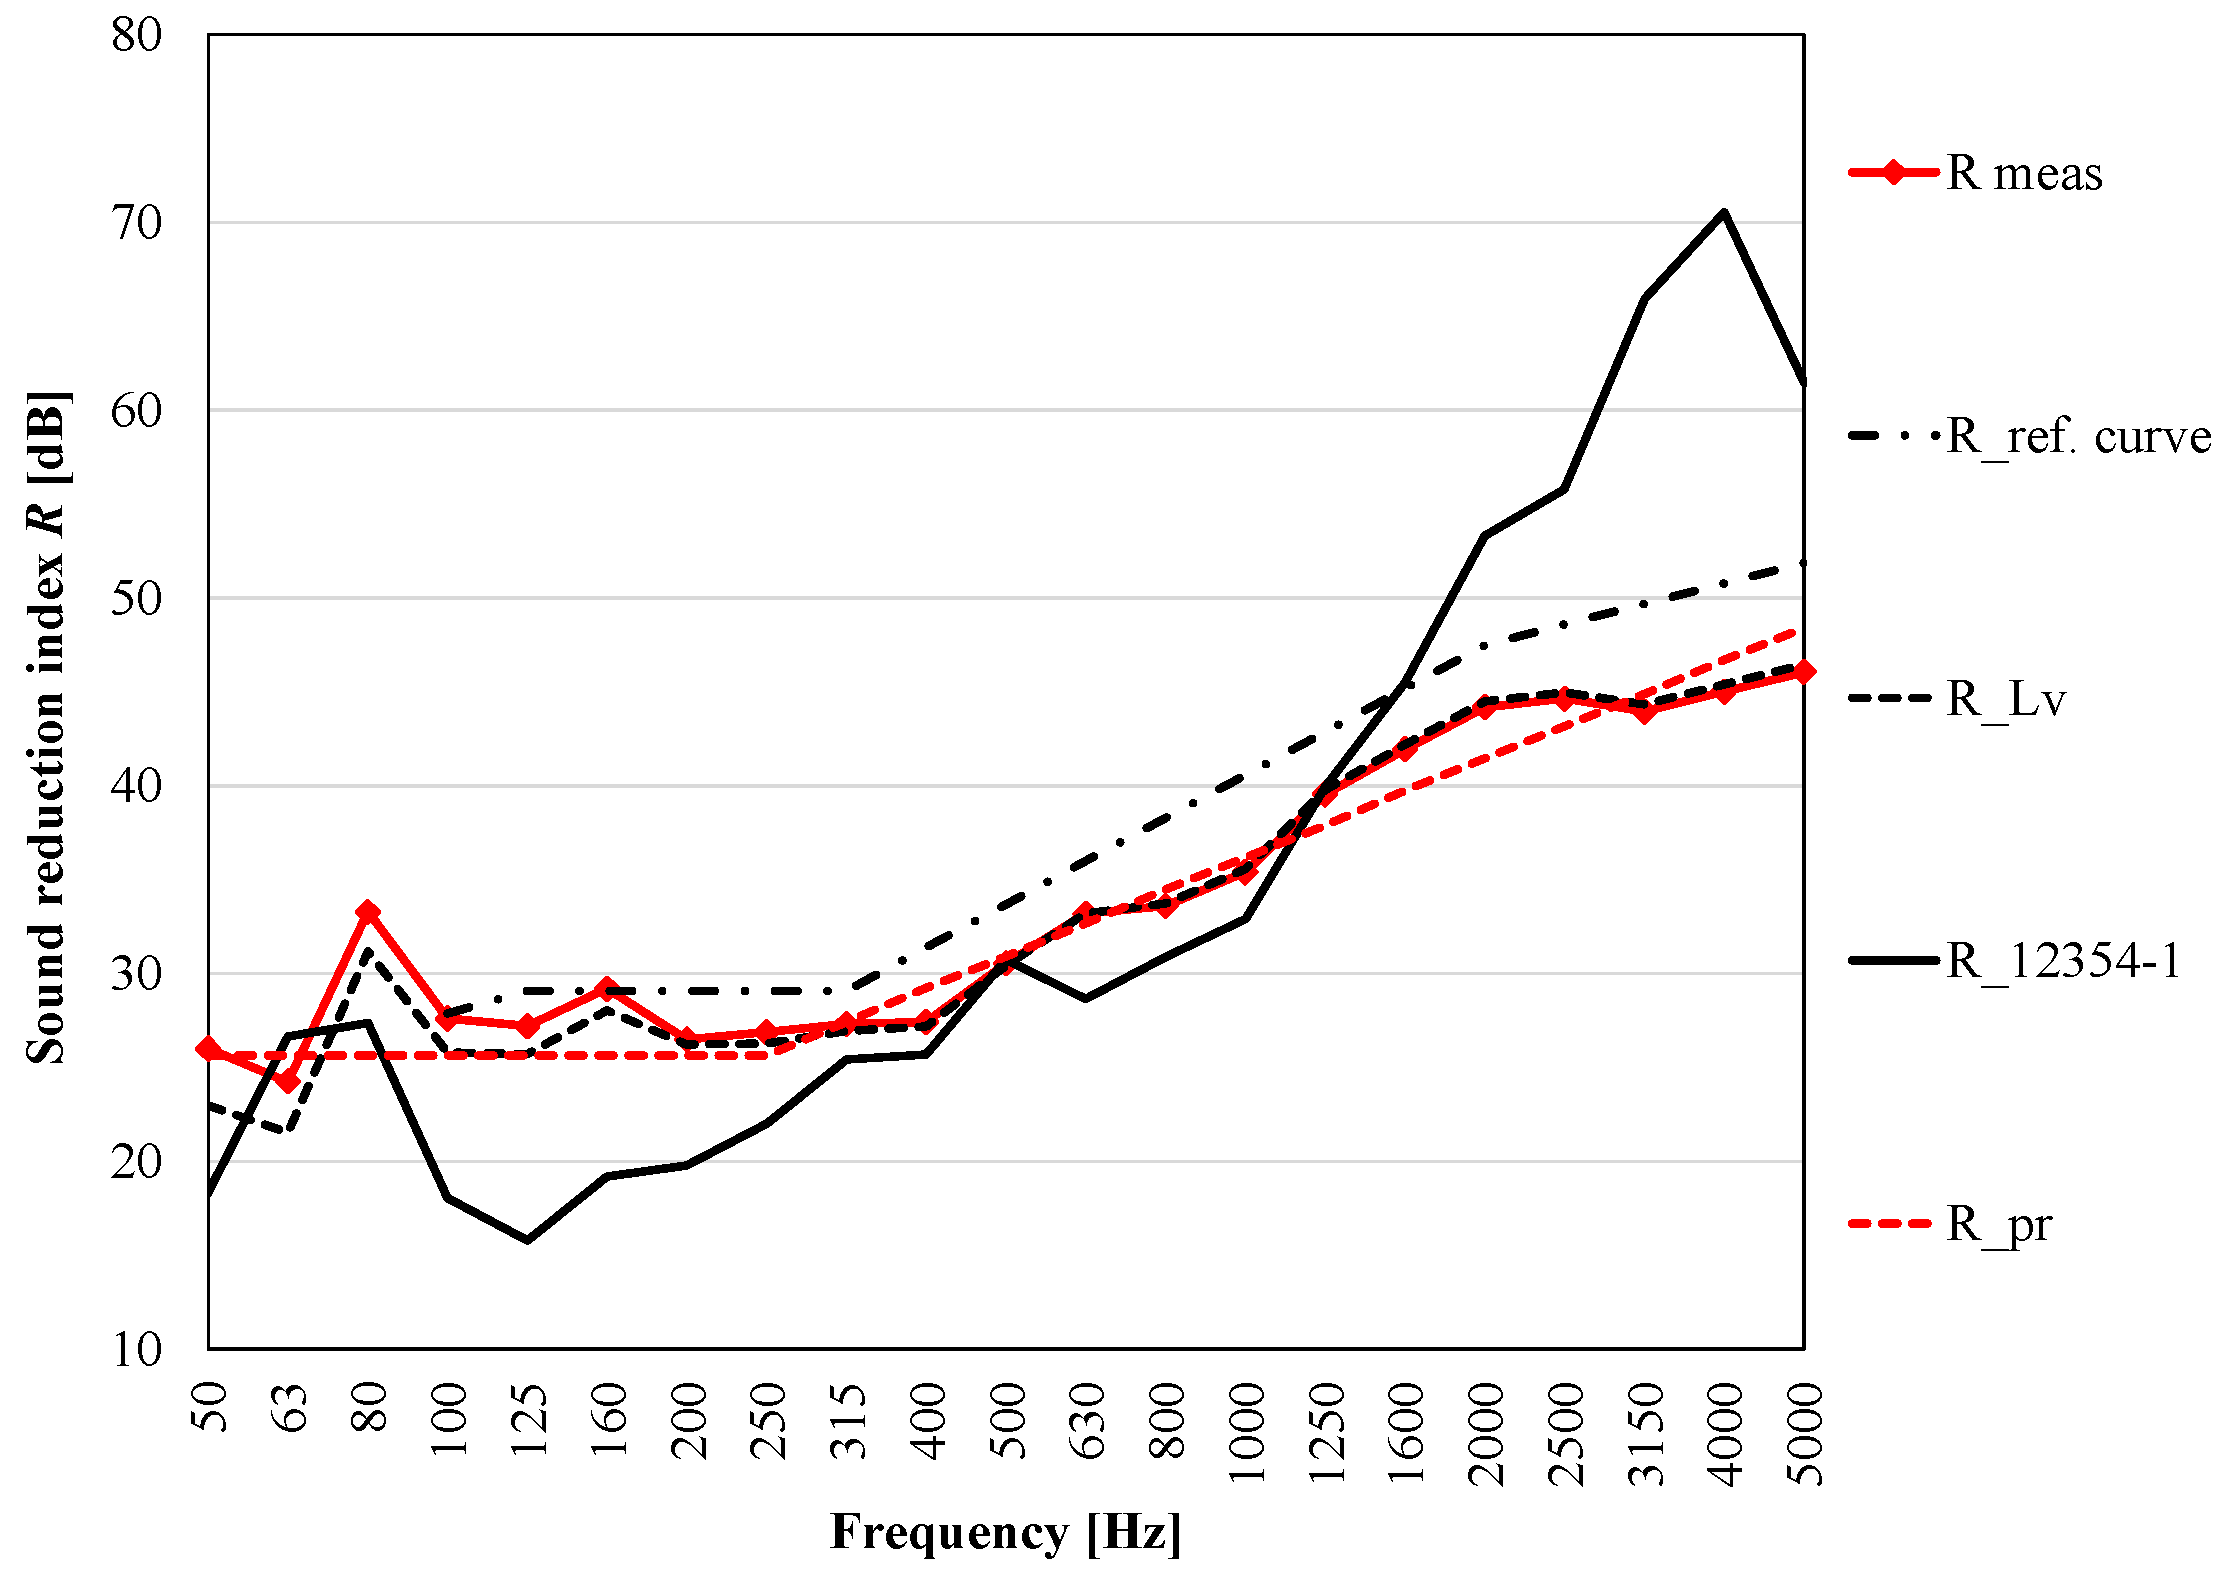
Starting from 315 Hz, there is an increasing trend with mass law R = 17.5lg(mf) − 50, so between 50 Hz and 315 Hz, the equation R = 17.5lg(m’) − 6.3 can be used ( R 2 = 0 .93);
2.
The trend of the mass law (Equation (11)) is significantly different from the theoretical one [70].
Therefore, the classical mass law seems not to be suitable to characterize the acoustic insulation to the airborne noise of a CLT floor. The possible explanation could be related to the fact that the classical law of mass is obtained for thin panels, with a density greater than that of wood.
Figure 11 shows the results of a calculation performed, variating the modulus of elasticity and the loss factor, while input data, such as geometrical dimensions, were kept fix. The results of the simulations are then compared with the measured sound reduction index. Even by means of these software simulations, it is possible to observe an overestimation of the results, particularly in the medium-high frequencies. It seems, quite clearly, that a dedicated study for CLT is necessary, since none of the models manage to fairly calculate the requested characteristics.
Finally, the ISO 12354-2 [71] standard reports the following equation that correlates the sound reduction index, R, to the normalized impact sound pressure level, Ln:
R + L n = 38 + 30 lg f
where both R + Ln and the equation 38 + 30lg(f) are reported in Figure 12.
From the results in Figure 12, it can be seen that a poor correlation index (R2 = 0.72) is obtained in the 100–3150 Hz frequency range, while a good correlation index (R2 = 0.95) can be noted in the 100–2000 Hz frequency range.

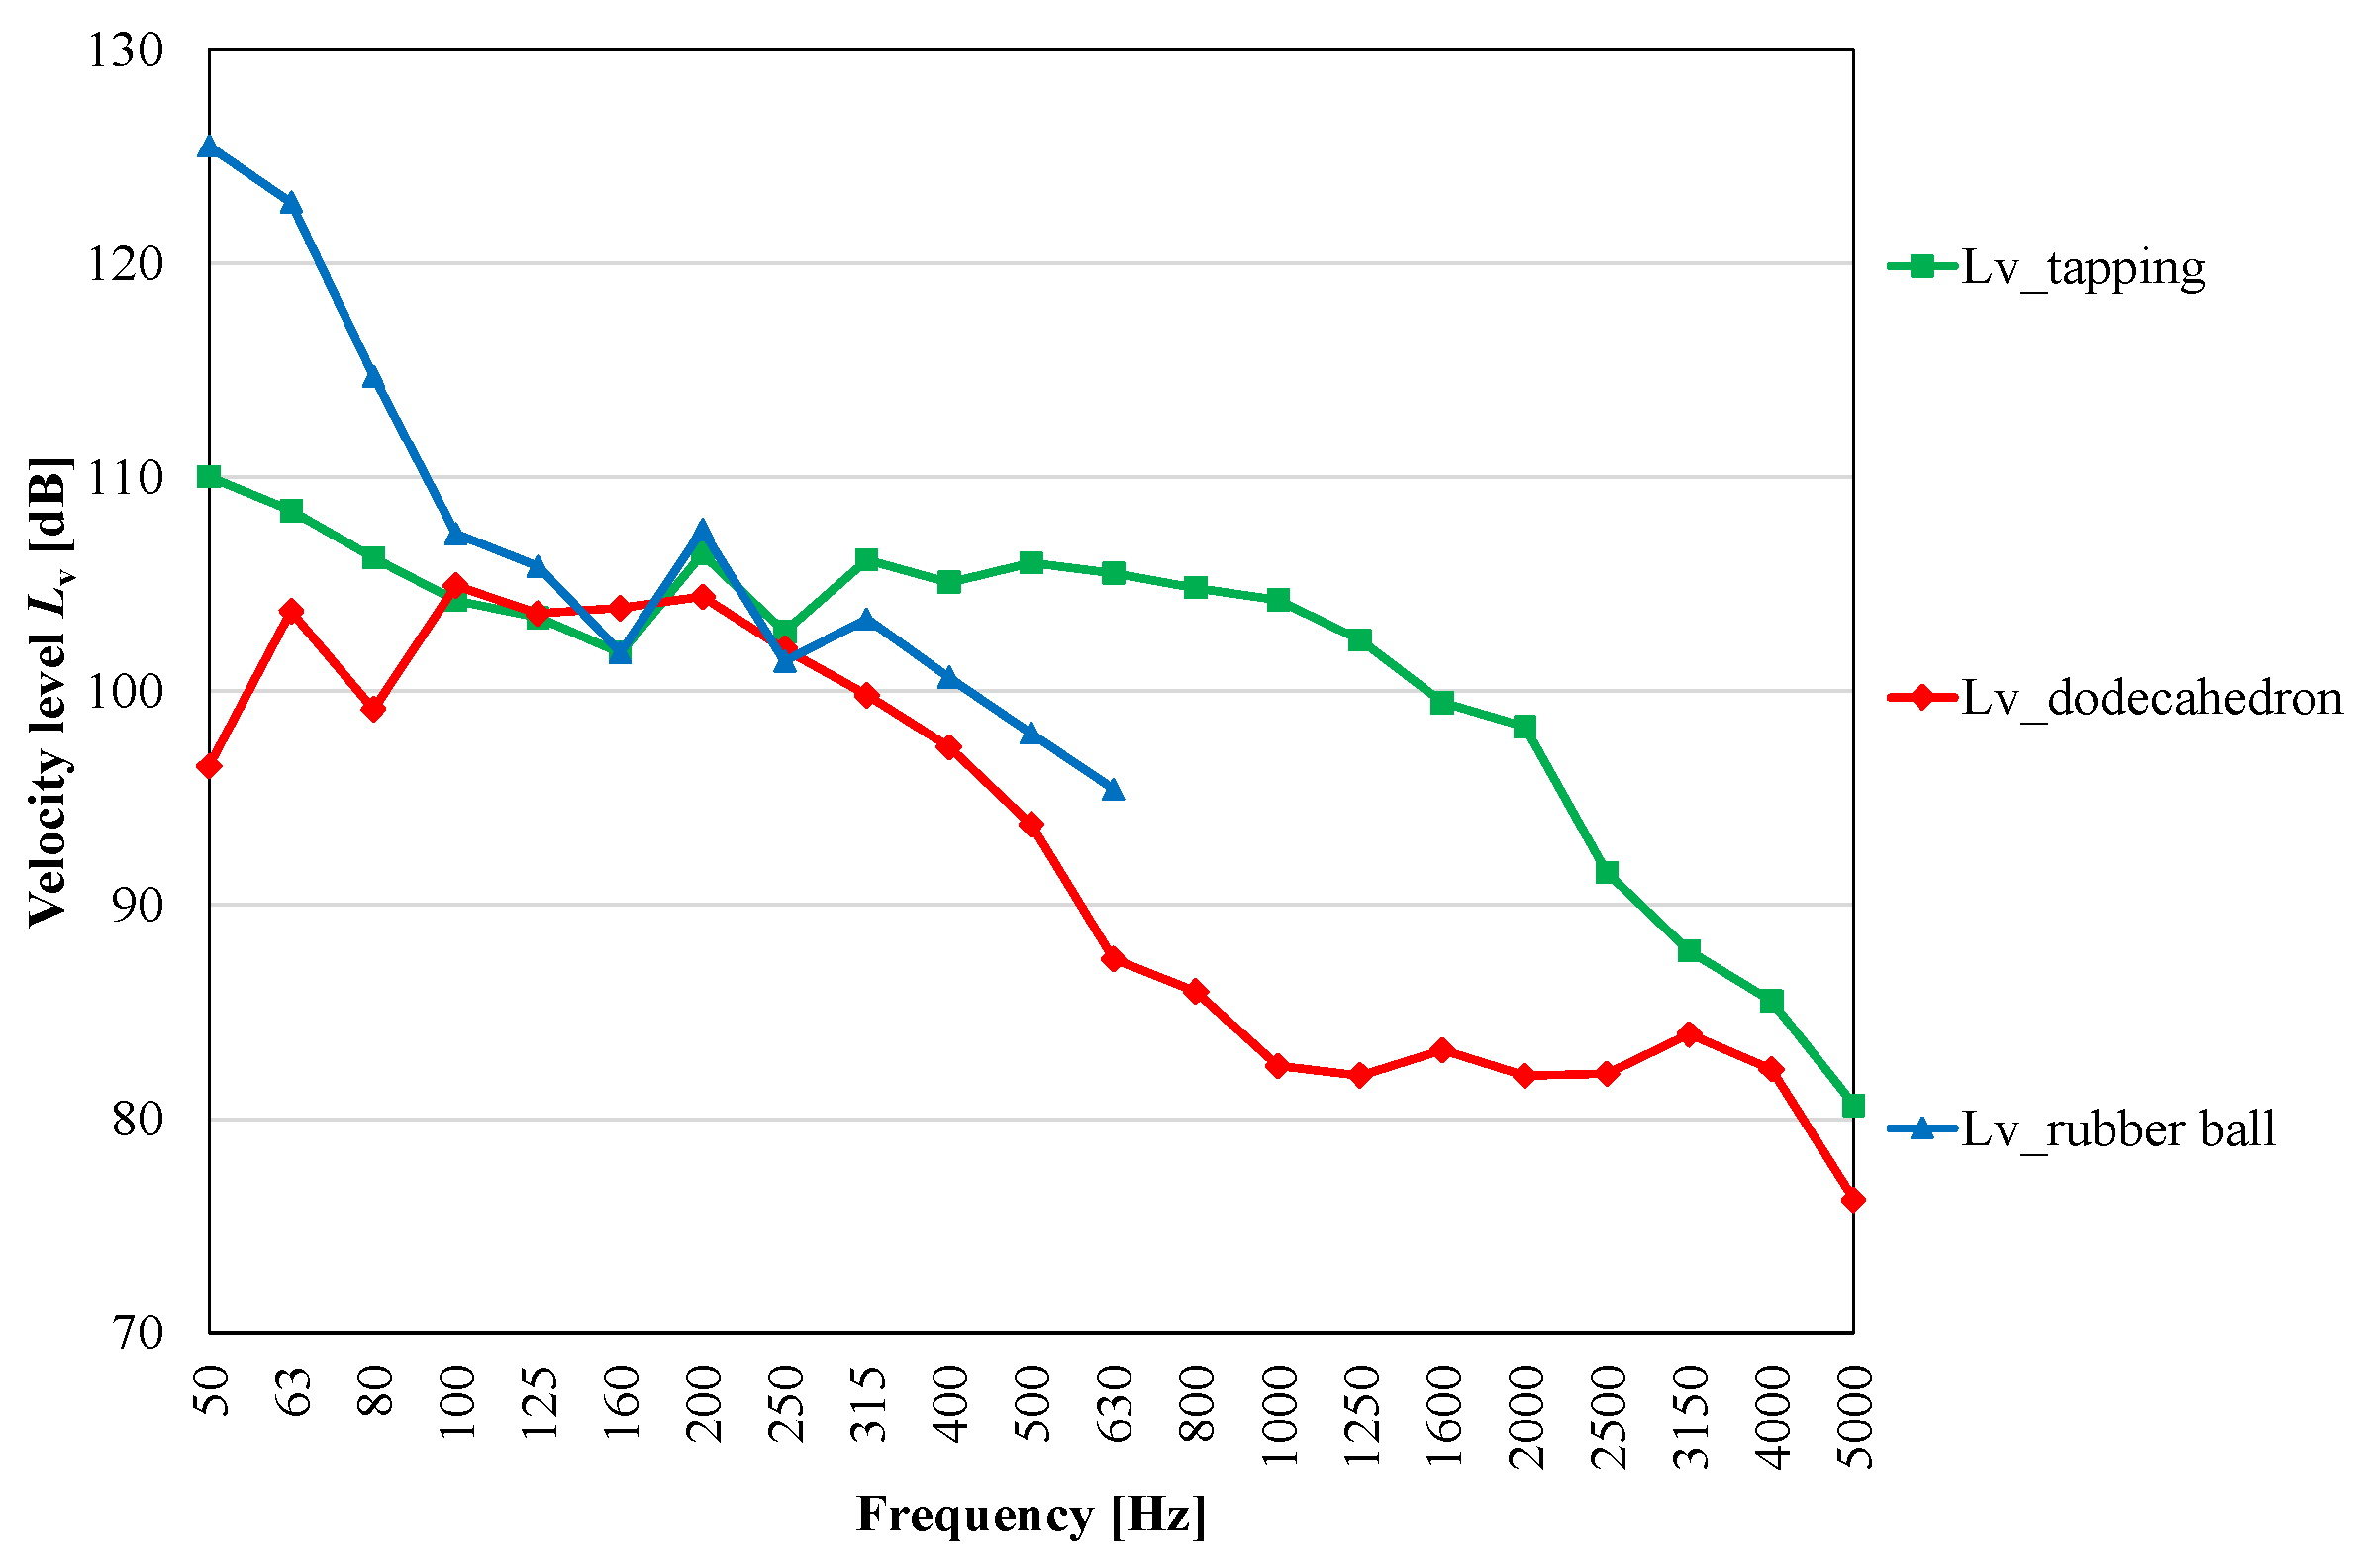
3.2. Experimental Results: Vibration-Derived Parameters

A grid of accelerometer measurement positions is used to evaluate the vibration velocity of the CLT slab. Firstly, the frequency trends are plotted to investigate the velocity levels. From the velocity levels in Figure 13, it is possible to observe how those produced by the rubber ball, for frequencies below 125 Hz, are higher than those produced by the tapping machine and the dodecahedron. Conversely, the velocity level’s trend of the standard tapping machine and of the rubber ball are partially overlapped, only in the range between 160–250 Hz. For frequencies below 80 Hz, however, the levels recorded are lower than those of the rubber ball, but higher than those of the dodecahedron. For frequencies above 250 Hz, the velocity levels of the standard tapping machine are the highest of the three sources presented here.
Figure 14 shows the radiation indices of the CLT for each exciting source (tapping machine, airborne, noise and rubber ball). It can be clearly seen that, between 50 Hz and 80 Hz, the radiation indices of the two impactive sources are almost superimposed, while after 80 Hz, the value of the tapping machine is far higher, not only than the radiation index of the rubber ball, but also than that of the dodecahedron. From this analysis, it is evident how each sound source produces a different type of excitation. It is, therefore, important that all three sources are considered, when analyzing the behavior of a CLT building element.
Finally, by looking at the average of the nine measurements and at the variability of values for the nine measurements of the radiation indices, for each of the three sources (Figure 15), some considerations can follow.
Firstly, looking at the tapping machine measurements, it is clear that, especially in the range between 50–80 Hz, all nine measurements are quite close to each other and to the average values. From 100 Hz to 200 Hz, they are rather scattered, then especially from 250 Hz onwards, the nine measurements seem quite different from each other, rarely overlapping the average curve.
Then, when looking at the measurements performed with the dodecahedron, it can be noted how the trends of each of the nine positions are quite dissimilar for almost all the frequencies. A more similar behavior of the nine curves, on the other hand, can be observed in the proximity of high frequencies (3150–5000 Hz).
Finally, by looking at the rubber ball trends, it is possible to note that (i) the trends are more similar to that of the averaged values at low frequencies (50–100 Hz) and that (ii) the differences between the nine positions, at high frequencies, are much more evident than at low frequencies.
Using the vibration data as a baseline, it was possible to derive and study the radiation index caused by each individual source at different receiver positions. This resulted in mapping, useful to better understand how the entire CLT floor surface behaves (Appendix A).
Looking at the maps produced by the impact of the tapping machine, some considerations can be made for the radiation index. The resonance peak of the normalized impact sound pressure level at 63 Hz is the same as the one of the corresponding radiation index. The negative peak at 80 Hz is also found in both Ln and in L σ r a d .
As in the case of the tapping machine, and also for the airborne noise, the peak at 63 Hz is clearly shown in Figure A2. Then, in accordance with the trend found in Figure 14 and Figure 15, the minimum is reached at 80 Hz. Conversely to the tapping machine case, a fluctuation between negative and positive values of the radiation index can be seen. Then, if the overall average value is around −4 dB (dark green), a level of 3.0 dB is found in the centre-right part of the floor. Next, from 100 Hz to 2500 Hz, the surface maps always show a positive behavior. Then, some negative trends are found at 3150 Hz and 4000 Hz. Focusing on 3150 Hz, a negative trend of the radiation index is found in the centre-right part of the floor, while at 4000 Hz, the negative behavior of the radiation index characterizes the upper-right, together with centre-right area, and the low-centre area of the CLT flooring.
Finally, looking at the radiation index of the rubber ball (Figure A3), two down peaks characterize the impact source behavior on the CLT floors, at 50 and 80 Hz, in accordance with the trends of Figure 12 and Figure 13. While the maximum level is found at 63 Hz, from 100 Hz onwards, an increasingly positive trend of the radiation index is always found.
For the impact noise produced by the tapping machine and the rubber ball, Equations (7) and (9) are proposed. These equations have been obtained by modifying those reported in the ISO 12354-2 standard, minimizing the sum of the absolute value of the differences in the measured and theoretical levels. The results are shown in Figure 16.

4. Comparison between Measured and Calculated Values

It is now possible to use the sound radiation and velocity level, experimentally determined, together with the geometrical features, to predict the impact noise by means of the literature and proposed methods (equations presented in Section 2.1 and Section 2.2), in order to compare them with the measured one.
In Figure 17, the normalized impact sound pressure level measured in the laboratory ( L n _ meas . ), the expected level according to the reference curve ( L n _ ref . curve ) [13], the level derived from the velocity levels ( L n _ Lv ) according to Equation (5) and the expected level using the model in ISO 12354-2 ( L n _ 12354 2 ), using Equation (6), and the expected level ( L n _ pr ), using the proposed Equation (7) are shown.
Table 4 shows the weighted normalized impact sound pressure levels for the measurements and models used.
It can be noted that for all the models, the calculated values fall within a range of 2 dB. The result obtained using the velocity levels is more accurate, as it is derived from an actual measurement made on the floor. It can be noted that the shape of the measured spectrum is similar to the reference curve [13], while the measured values are 2 dB higher than the reference curve.
Figure 18 shows the sound reduction index measured in the laboratory ( R meas ), according to the reference curve ( R ref . curve ), derived from the velocity levels and the levels measured in the transmitting room ( R Lv ), in which A ed L1 are the measured values, while L2 is evaluated according to Equation (4), and the predicted level using the model in ISO 12354-1 annex B ( R 12354 1 ) and predicted with proposed equations R = 17.5lg(mf) − 50, between 315 Hz and 5000 Hz and R = 17.5lg(m’) − 6.3, between 50 Hz and 315 Hz.
Table 5 shows the weighted sound reduction indices for the measurements and models used. The prediction made by velocity level and sound pressure level measurements in the transmitting room is quite accurate, because actual measurements are used on the floor. The reference curve overestimates the performance by 4 dB, while the ISO 12354-1 model (as from the equations in paragraph 2.1) overestimates (above 1600 Hz) and underestimates (between 80 and 1000 Hz) the performance of the floor, significantly. The proposed equations lead to the same index R w and spectrum adaptation terms C and C tr .
Figure 19 shows the maximum sound pressure level measured in the laboratory ( L i ,   Fmax _ meas ), the level derived from the velocity levels (Li,Fmax_Lv) according to Equation (4) and the predicted level using the model in ISO 12354-2 (Li,Fmax_12354-2), using Equation (8) and the expected level ( L i , Fmax _ pr ), using the proposed Equation (7).
Table 6 shows the A-weighted sound pressure levels for the measurements and models used. The results show that looking at the weighted indices, the prediction made with the model derived from ISO 12354-2 gives a better value (+1 dB difference) than the model based on measured velocity levels (−2 dB difference). This results from the fact that the A-weighting gives an increasing weighting, as the frequency increases from 50 Hz to 630 Hz. When analyzing the frequency trend, it can be seen that the model derived from the measured velocity values is significantly more accurate. The average absolute value of the differences is 1.7 dB, using L v and 3.6 dB, using the model derived from 12354-2. The proposed equations lead to the same weighted index L i ,   AFmax .

5. Conclusions

This work presents the experimental results of acoustic measurements, carried out on a CLT floor, consisting of five layers of 200 mm thickness, according to the ISO 10140 series standards.
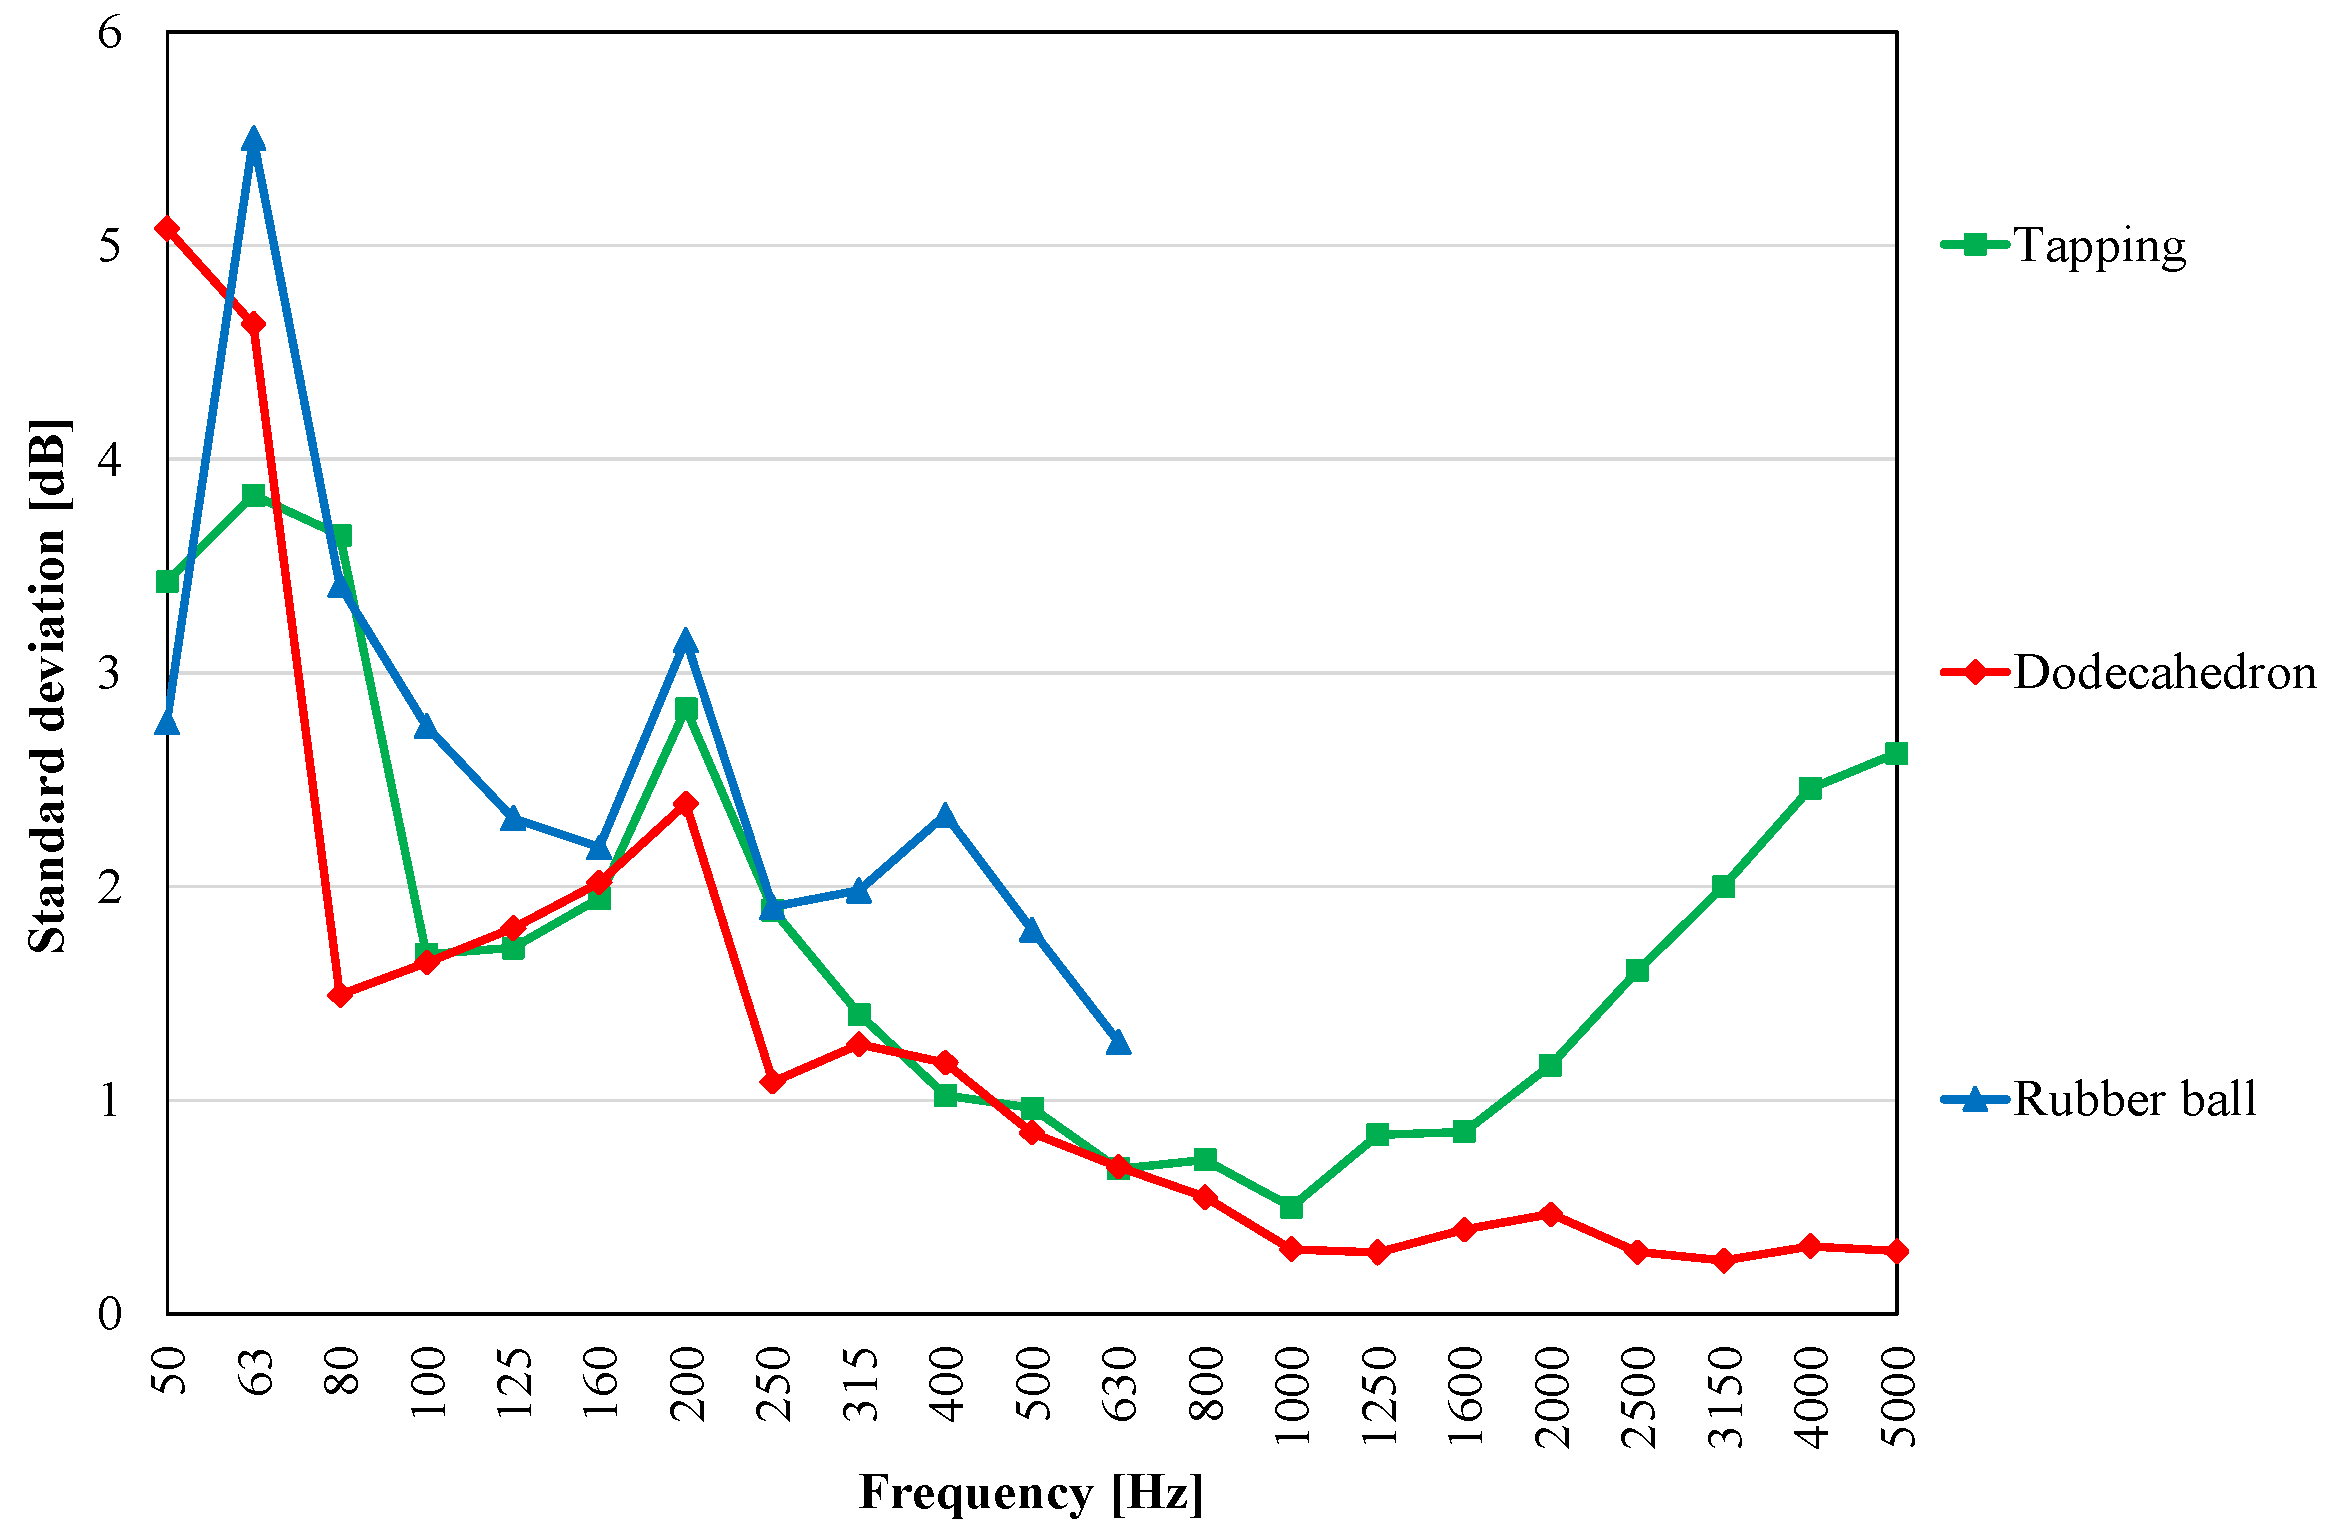
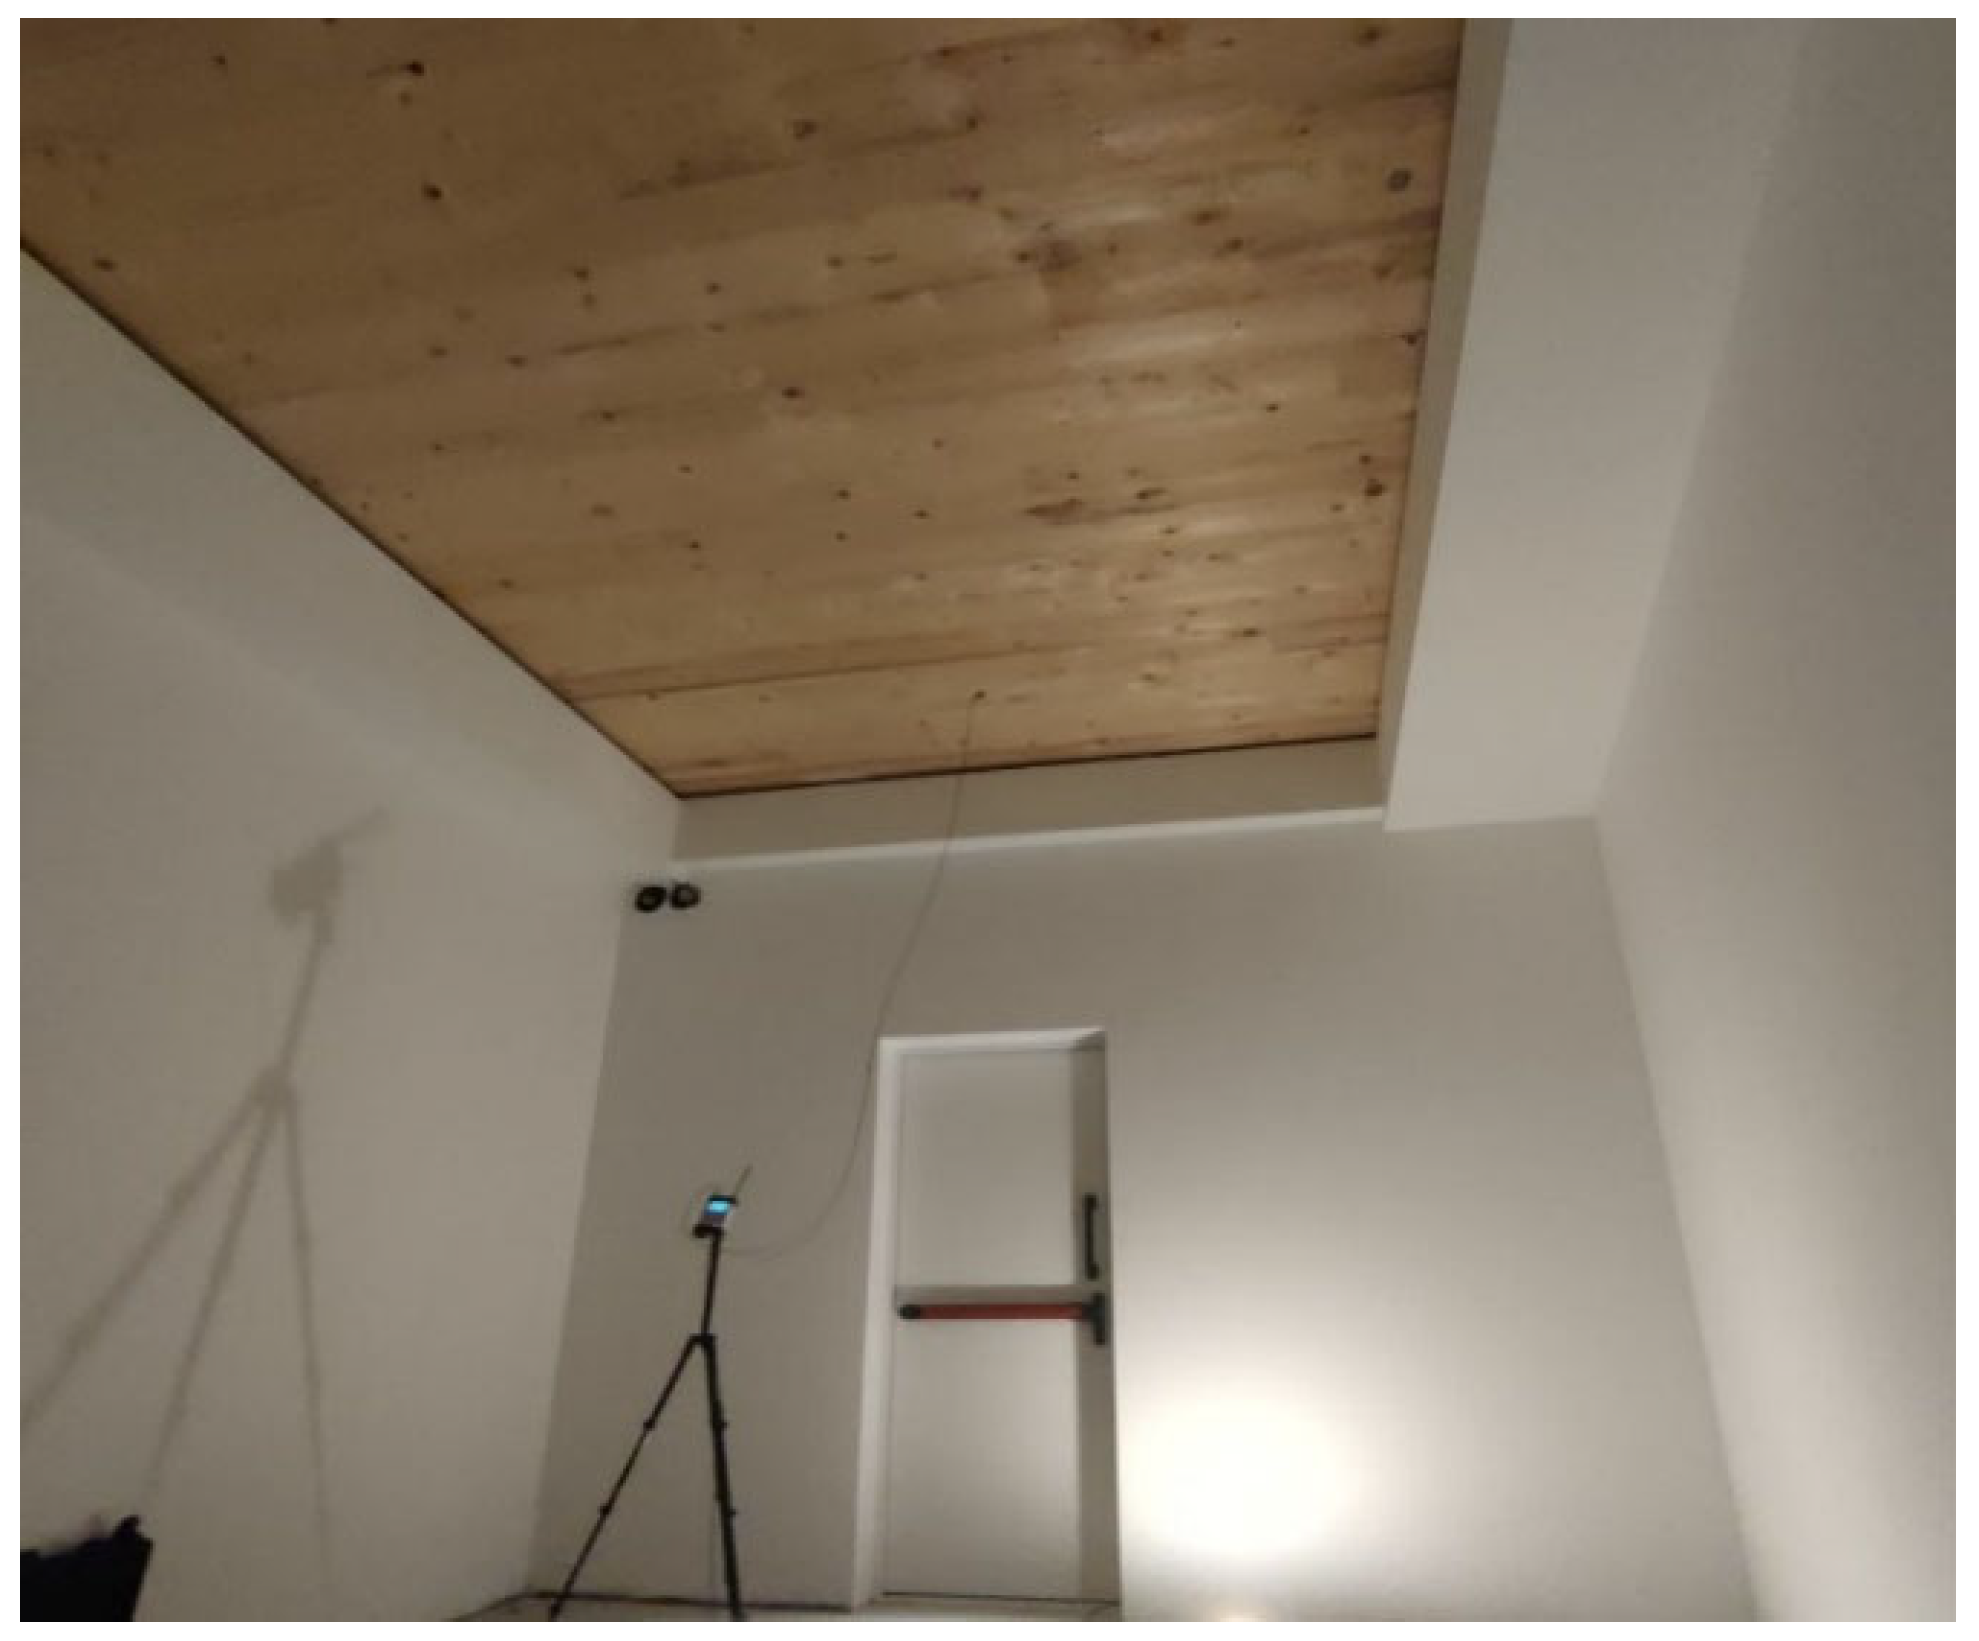
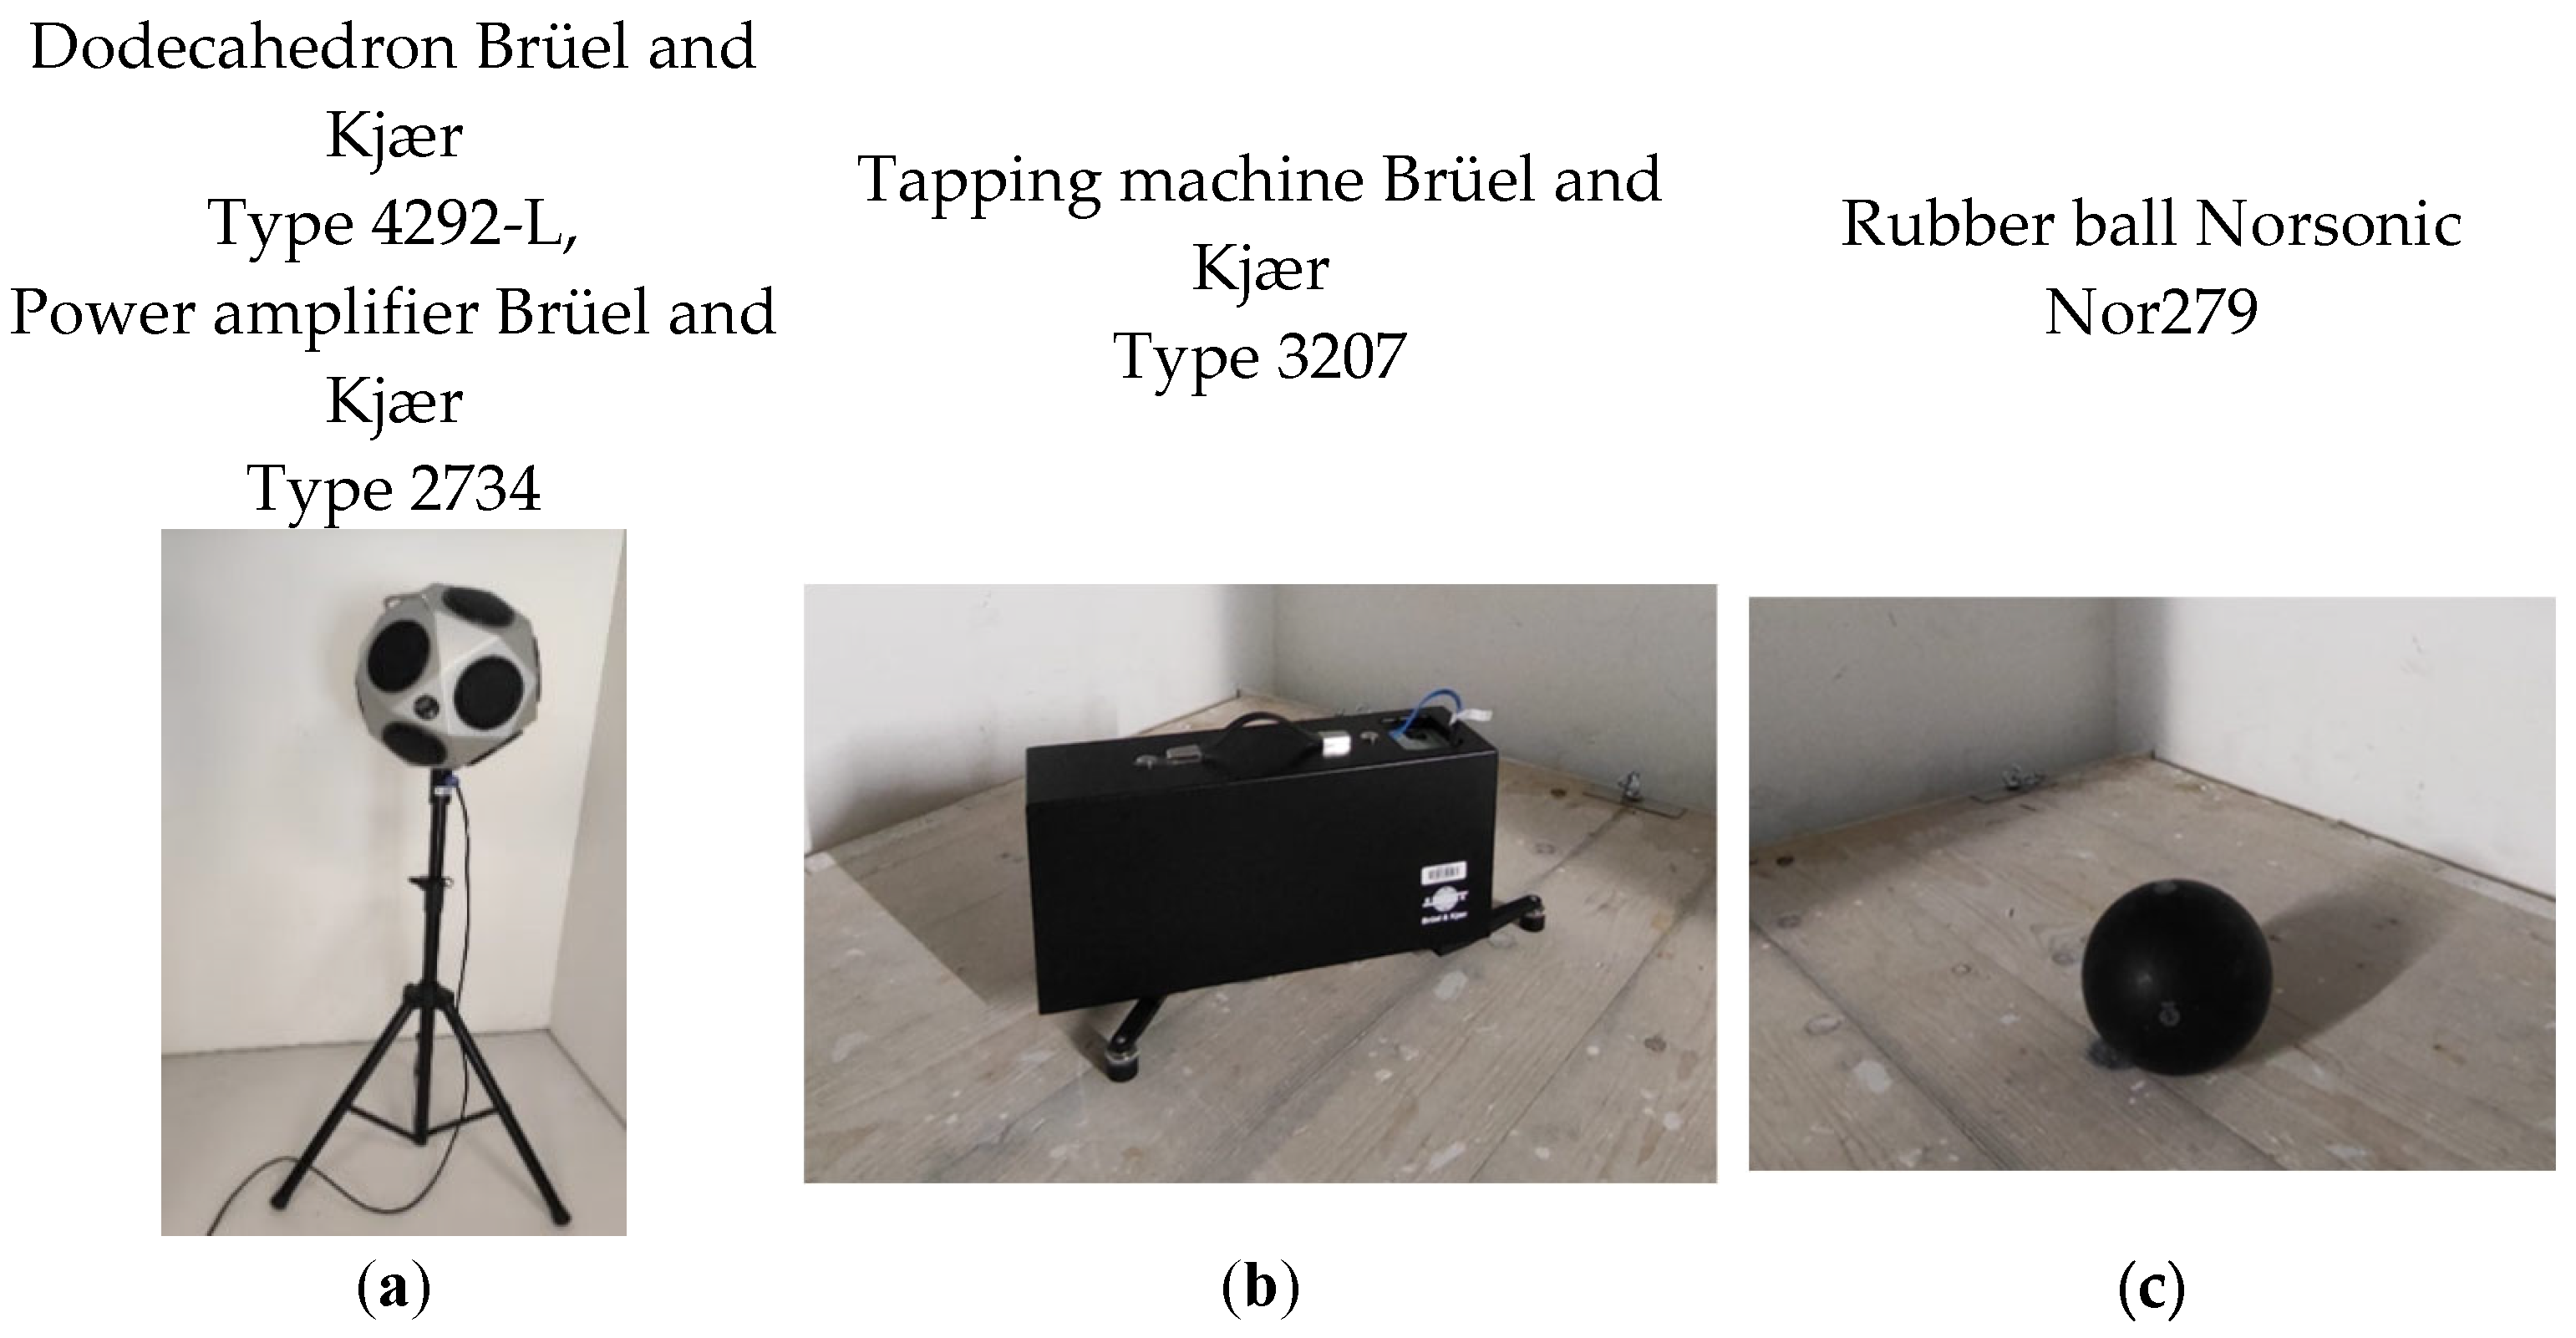
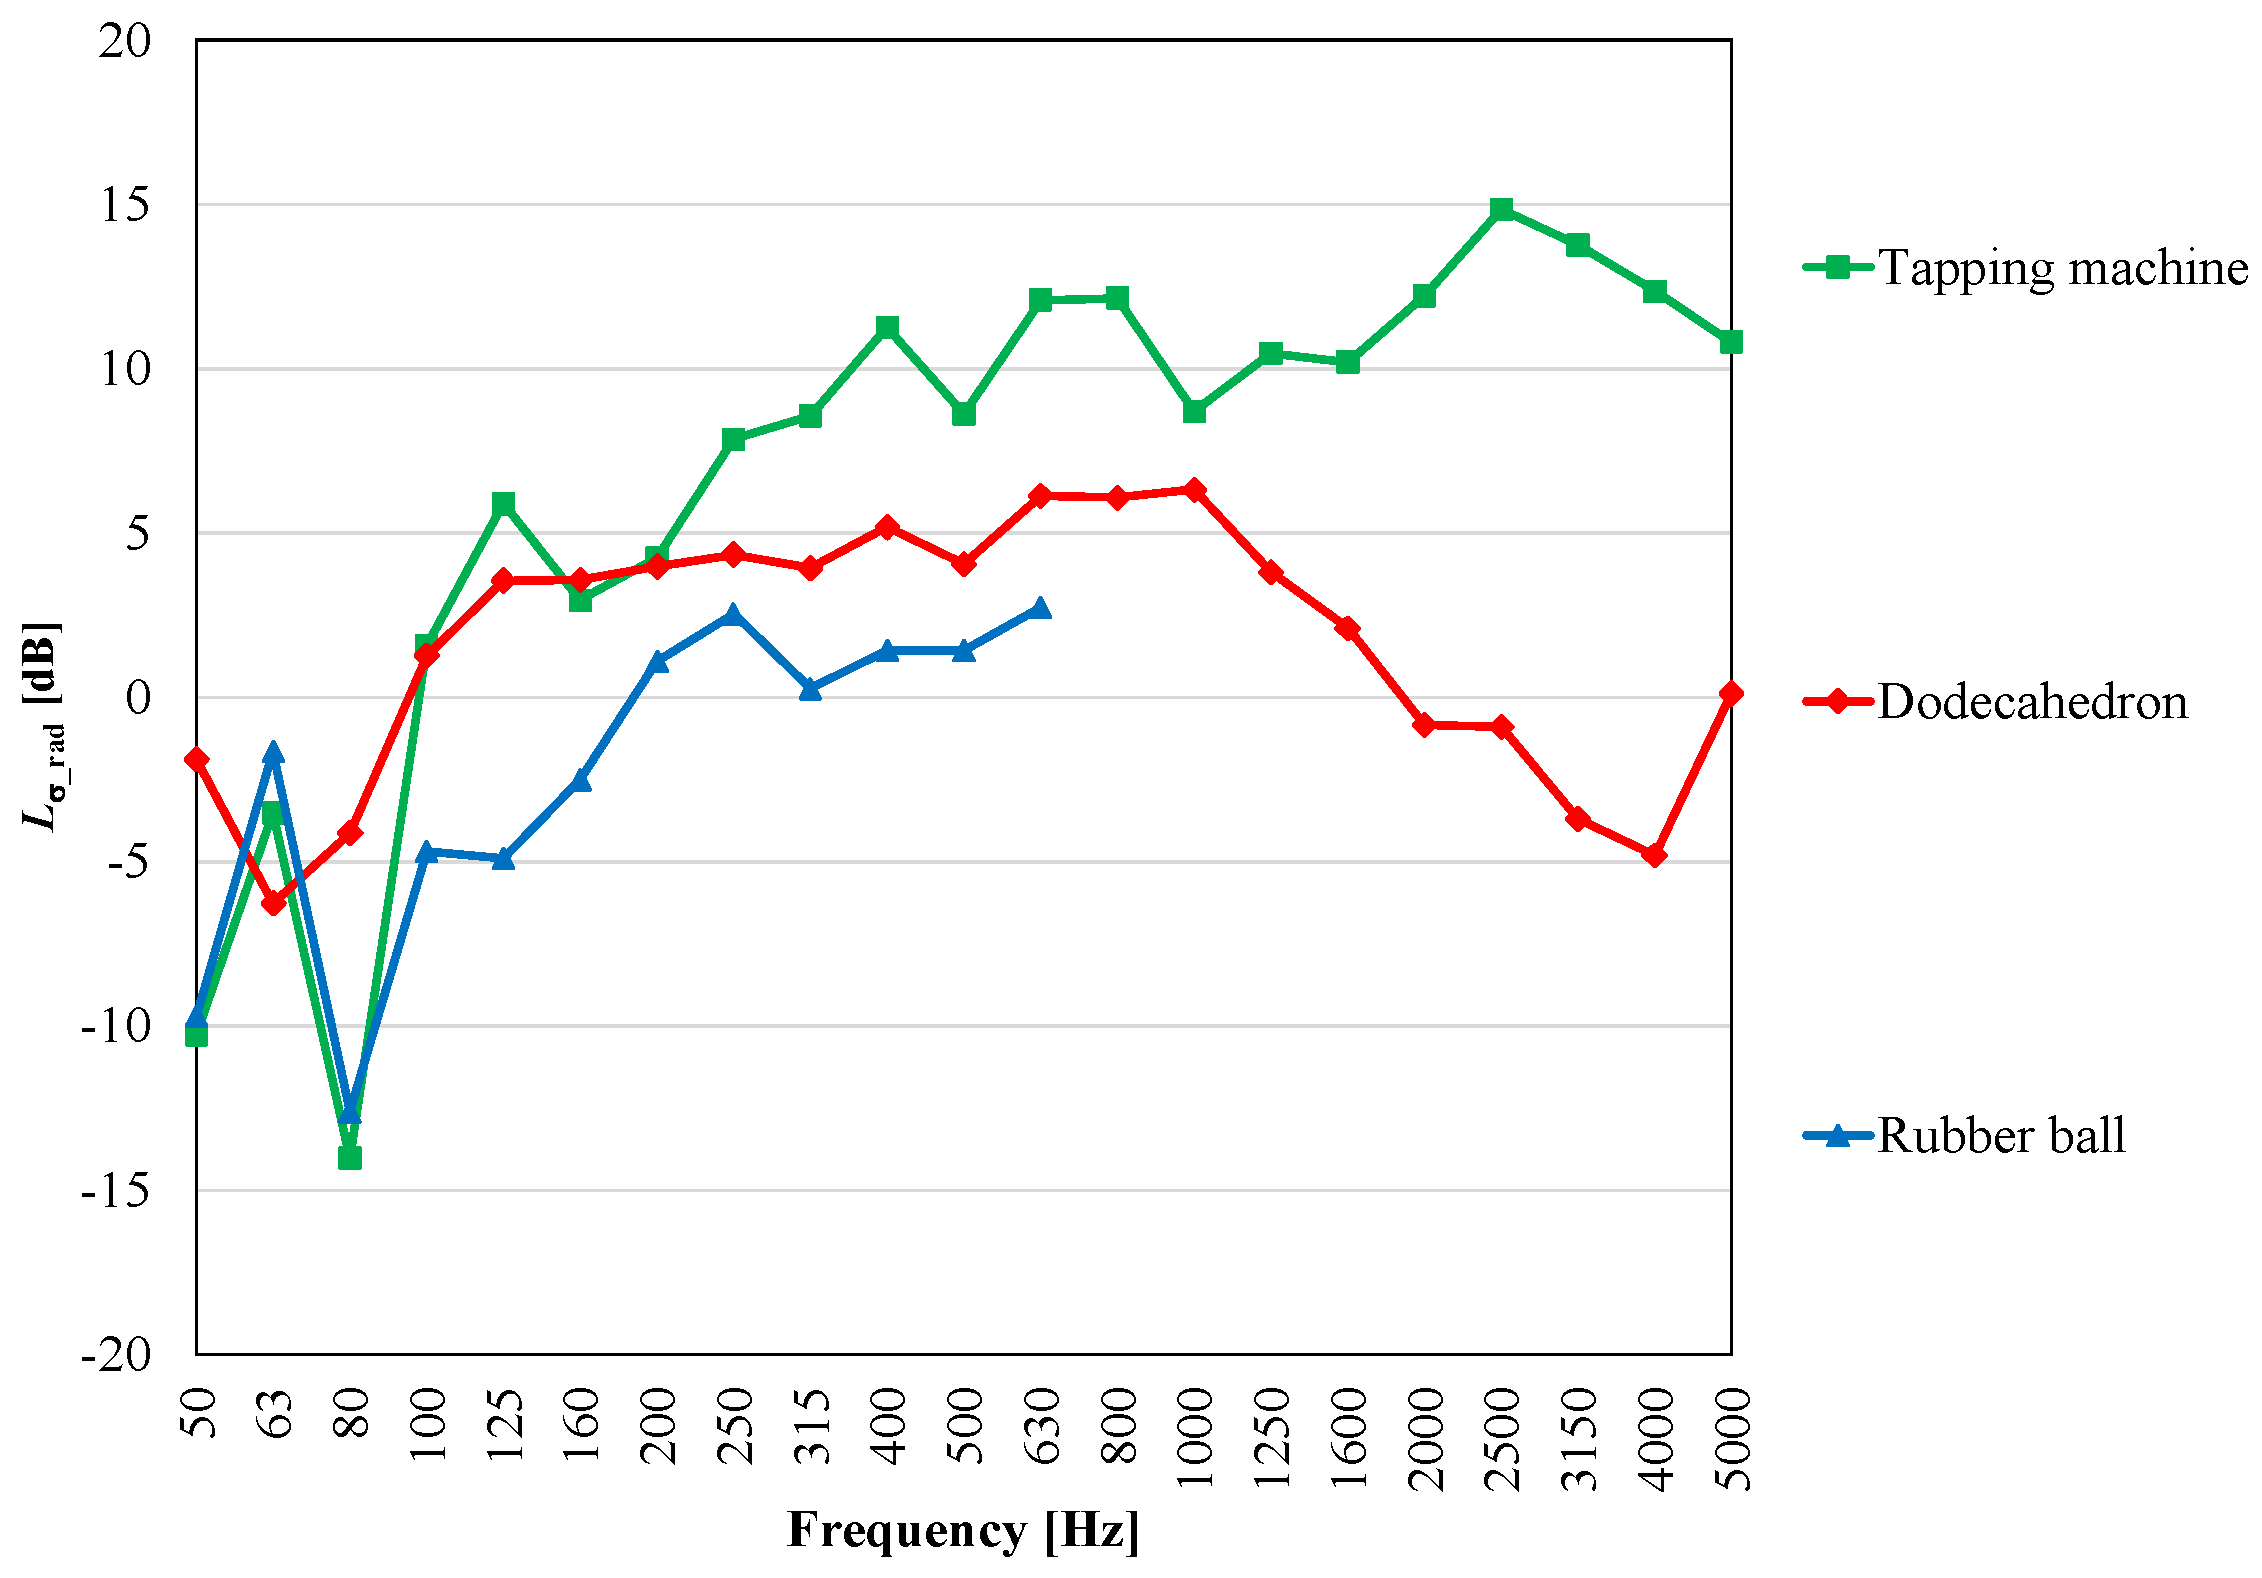
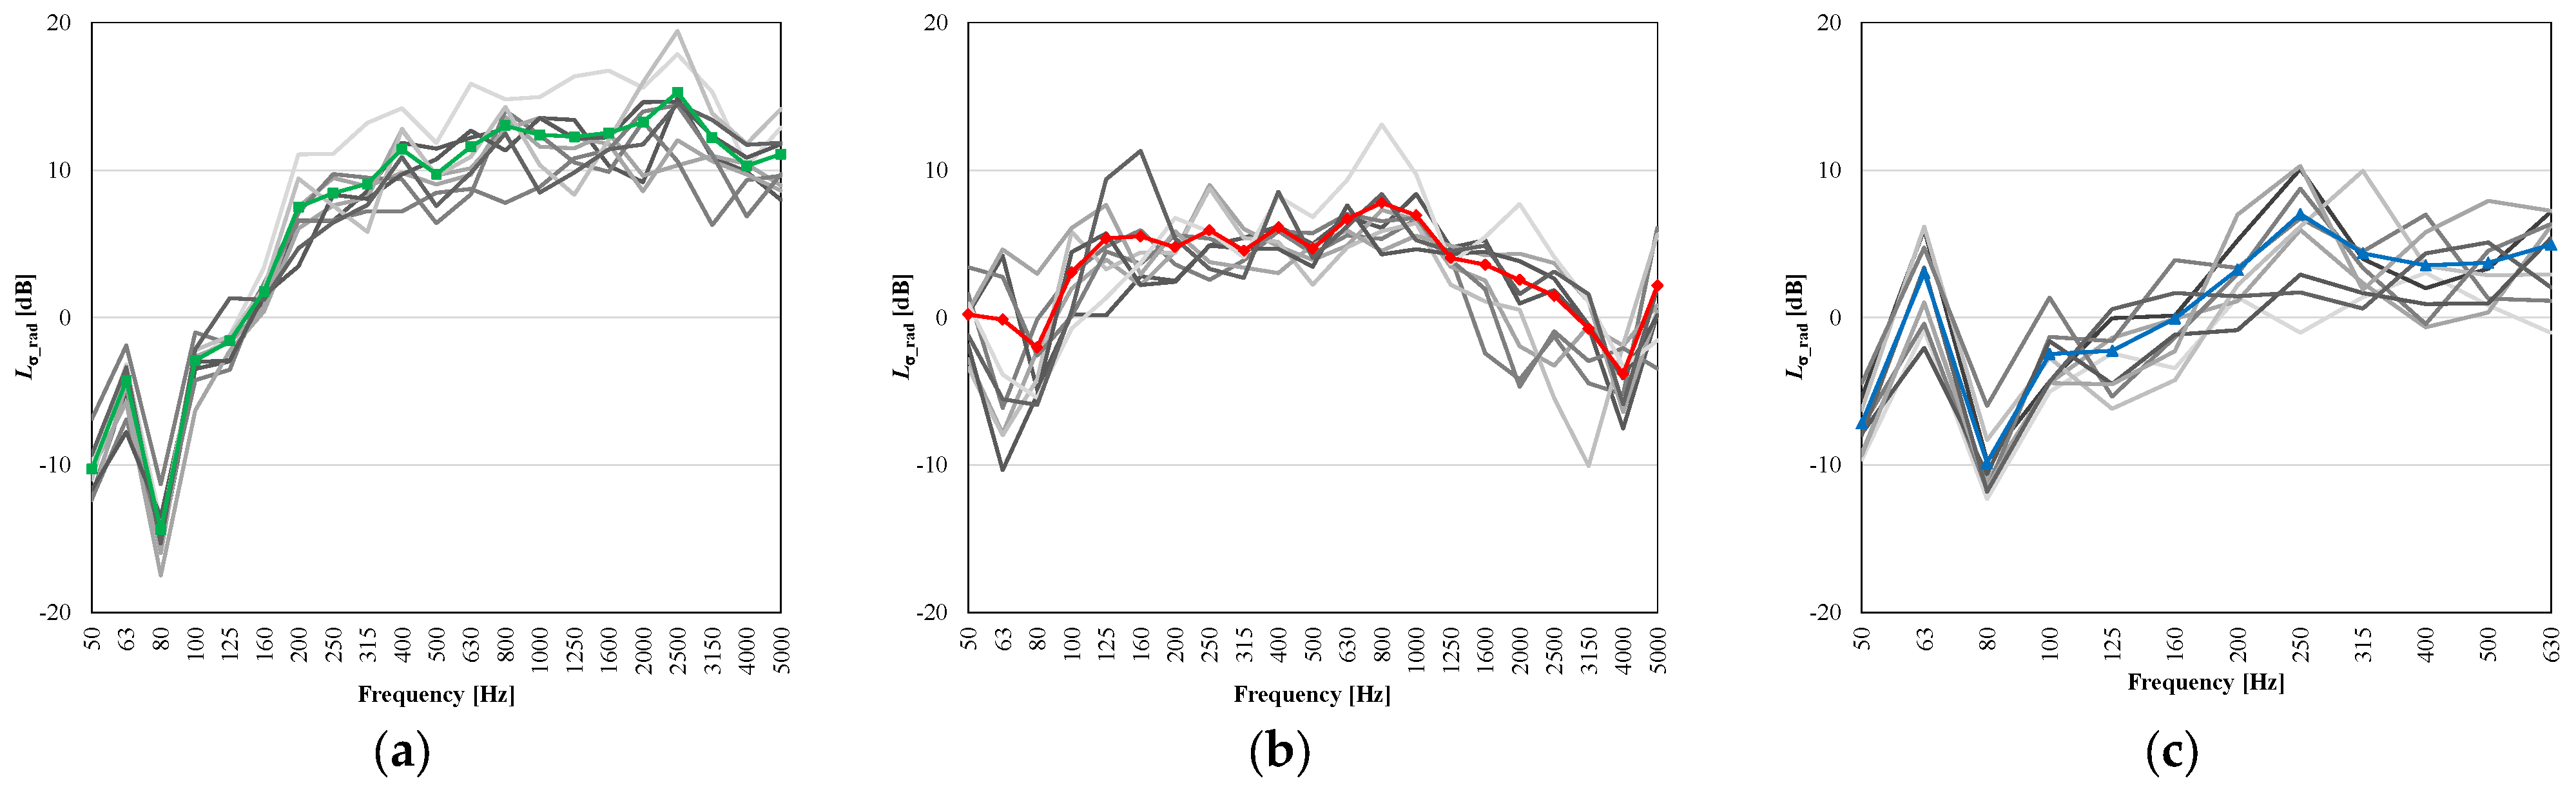
  • Firstly, three different types of sources were used in the laboratory of the Free University of Bolzano: tapping machine, dodecahedron and rubber ball. Furthermore, vibration measurements were carried out for each source. The results make it possible to derive the impact sound pressure level obtained from the tapping machine and the rubber ball, the sound reduction index obtained with the dodecahedron, velocity levels and consequent radiation index for each of the sources. For all three sources, the use of velocity level measurements to derive the acoustic parameters has led to excellent results, in comparison to the experimental data. This is not a predictive method and could not be fully verified in in-situ measurements, due to lateral transmissions, which are not trivial, to be determined., As regards the measurement of the radiation index, it can be noted that at the frequency of 63 Hz, the higher value can be found in correspondence with the resonance frequency of the floor for each type of sound source. The same maximum can be found in the sound pressure measurements. Furthermore, the radiation indices of the two impact sources (tapping machine and rubber ball), at low frequency (50–80 Hz), provided results significantly similar, while after 80 Hz, the values of the tapping machine far exceed not only the radiation index of the rubber ball, but also that of the dodecahedron.
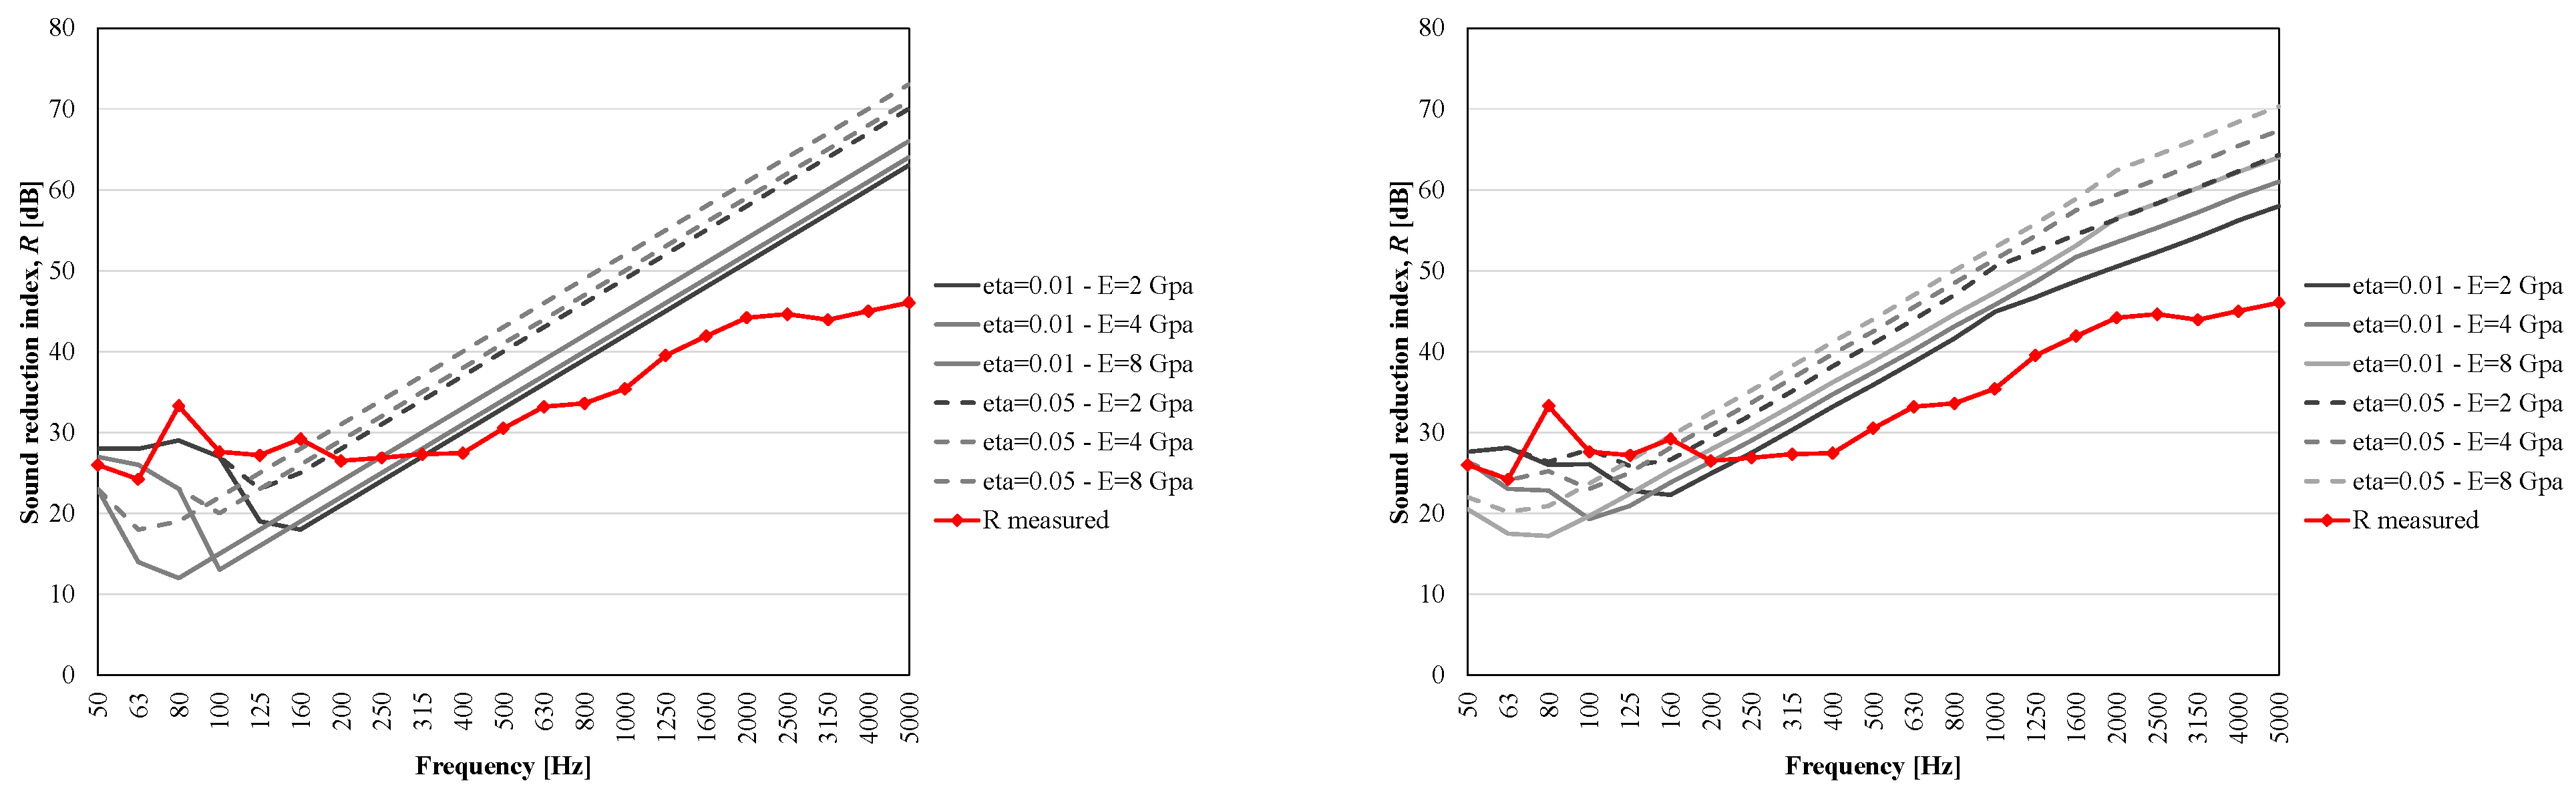
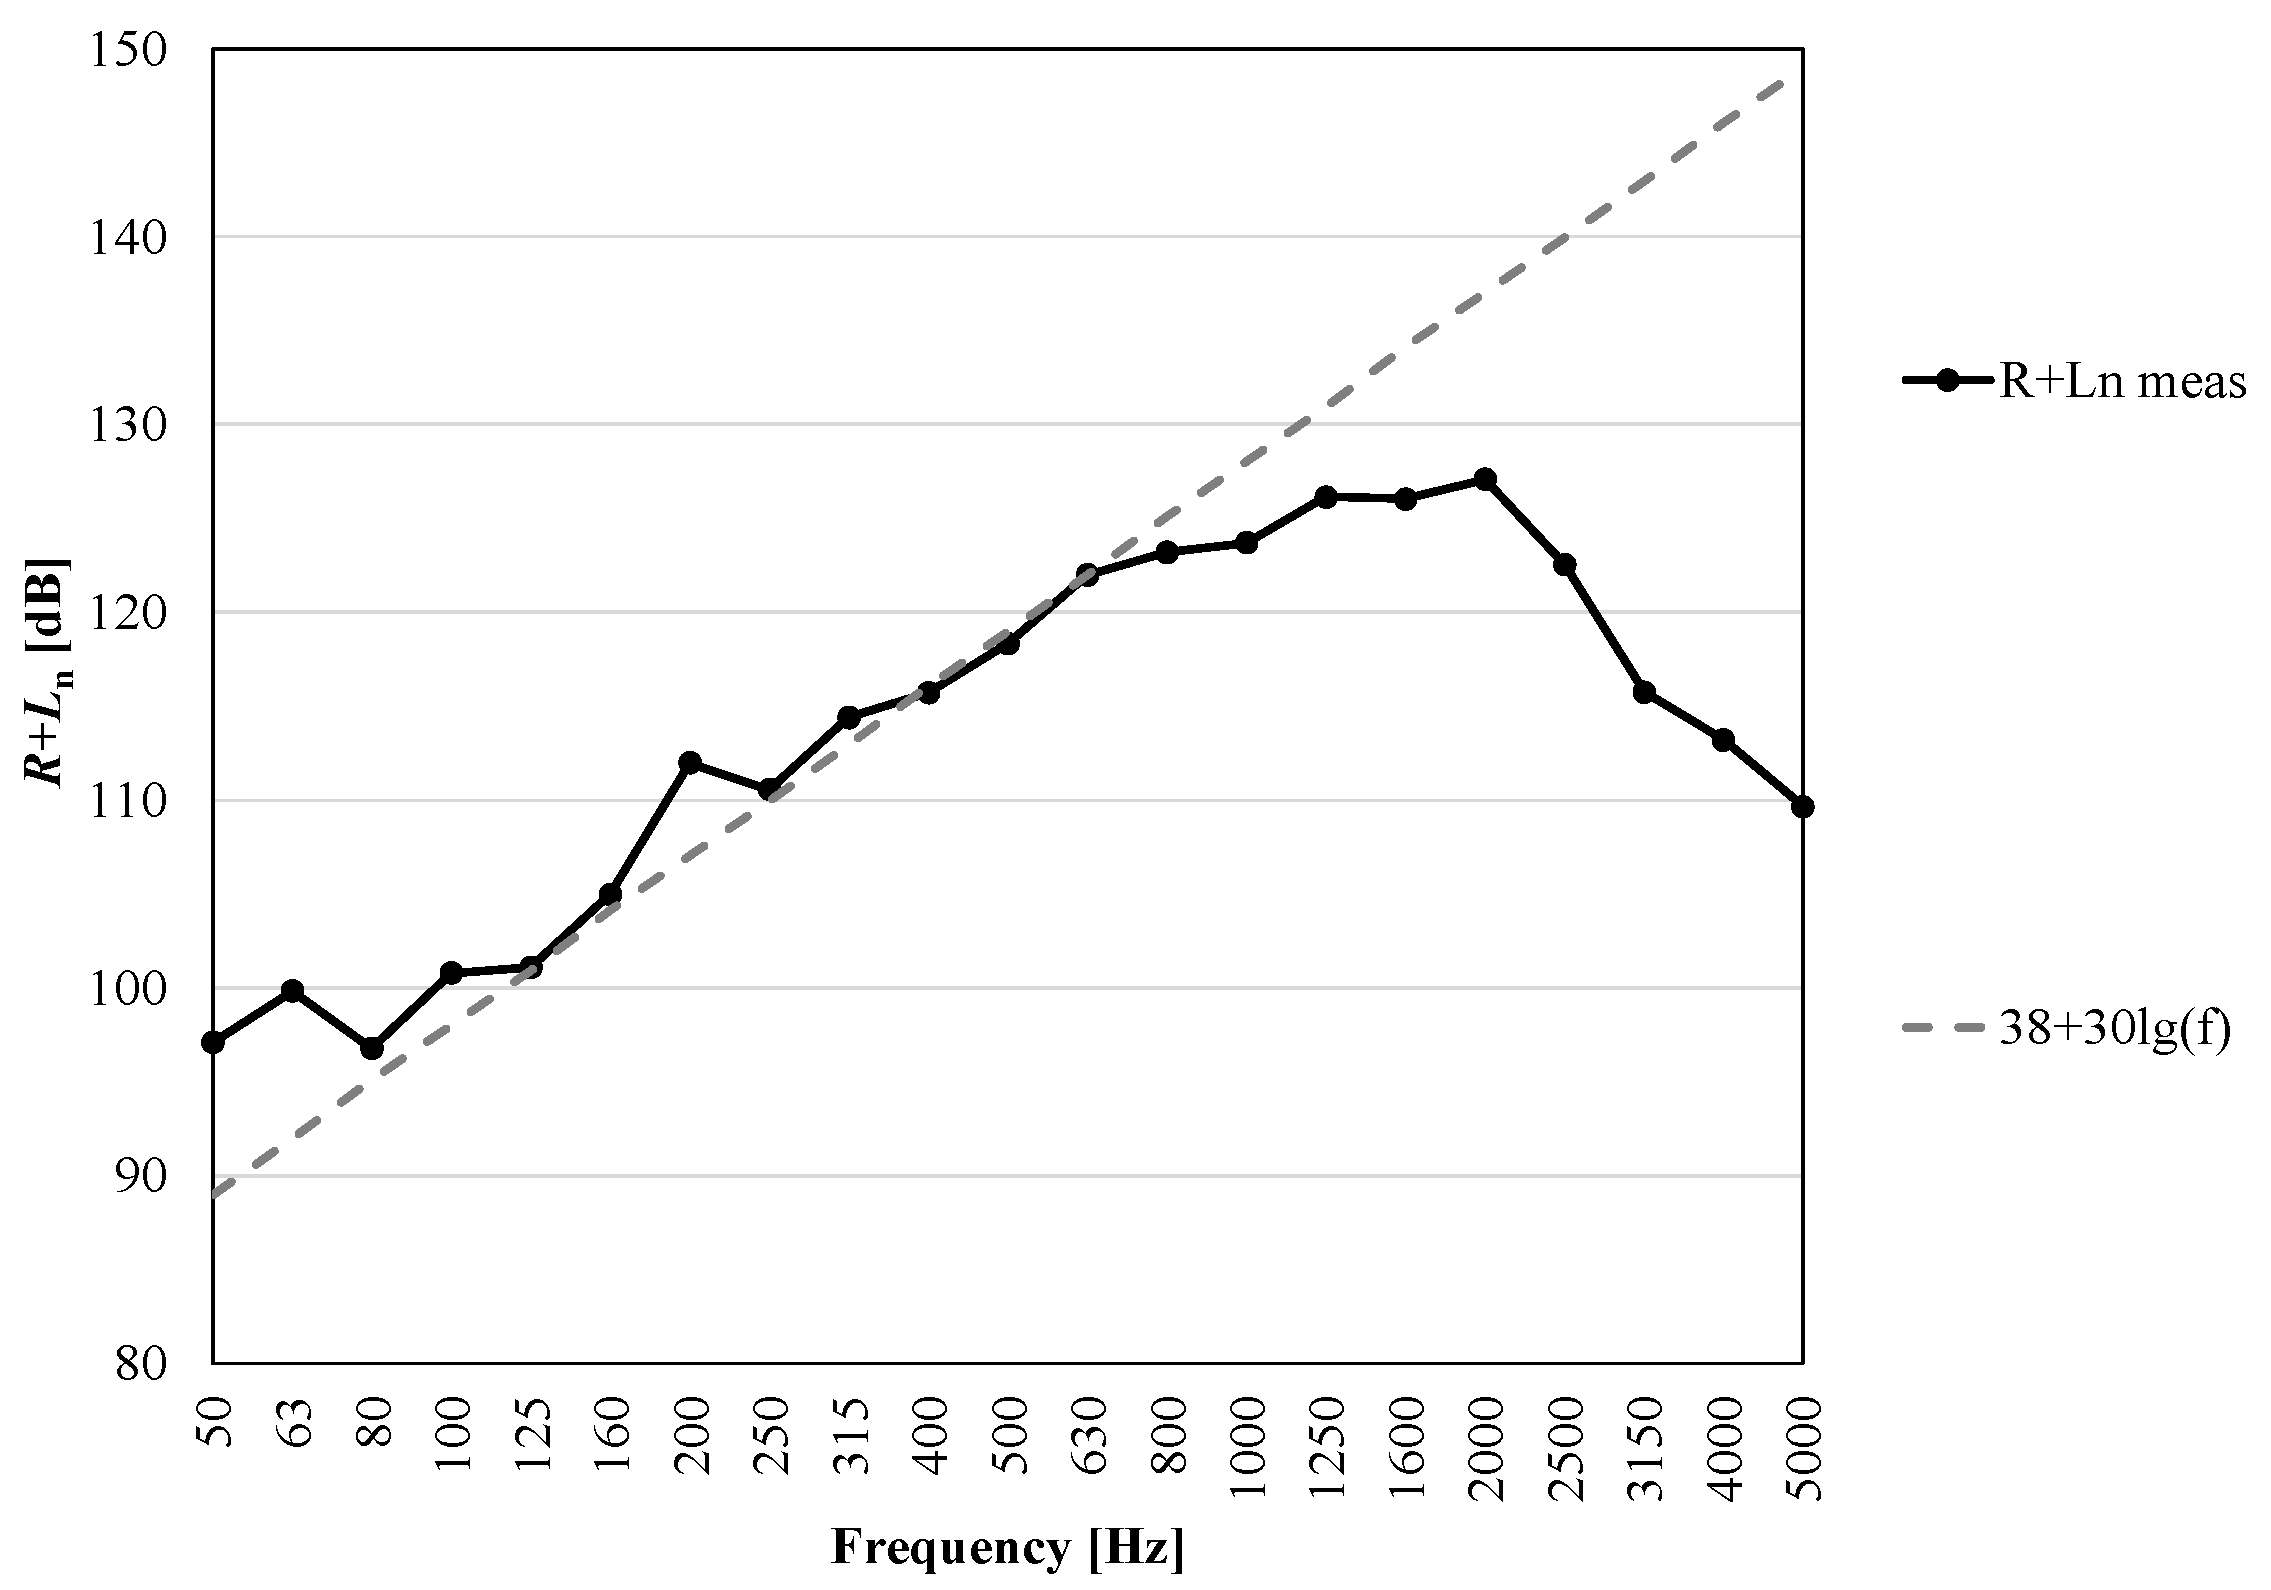
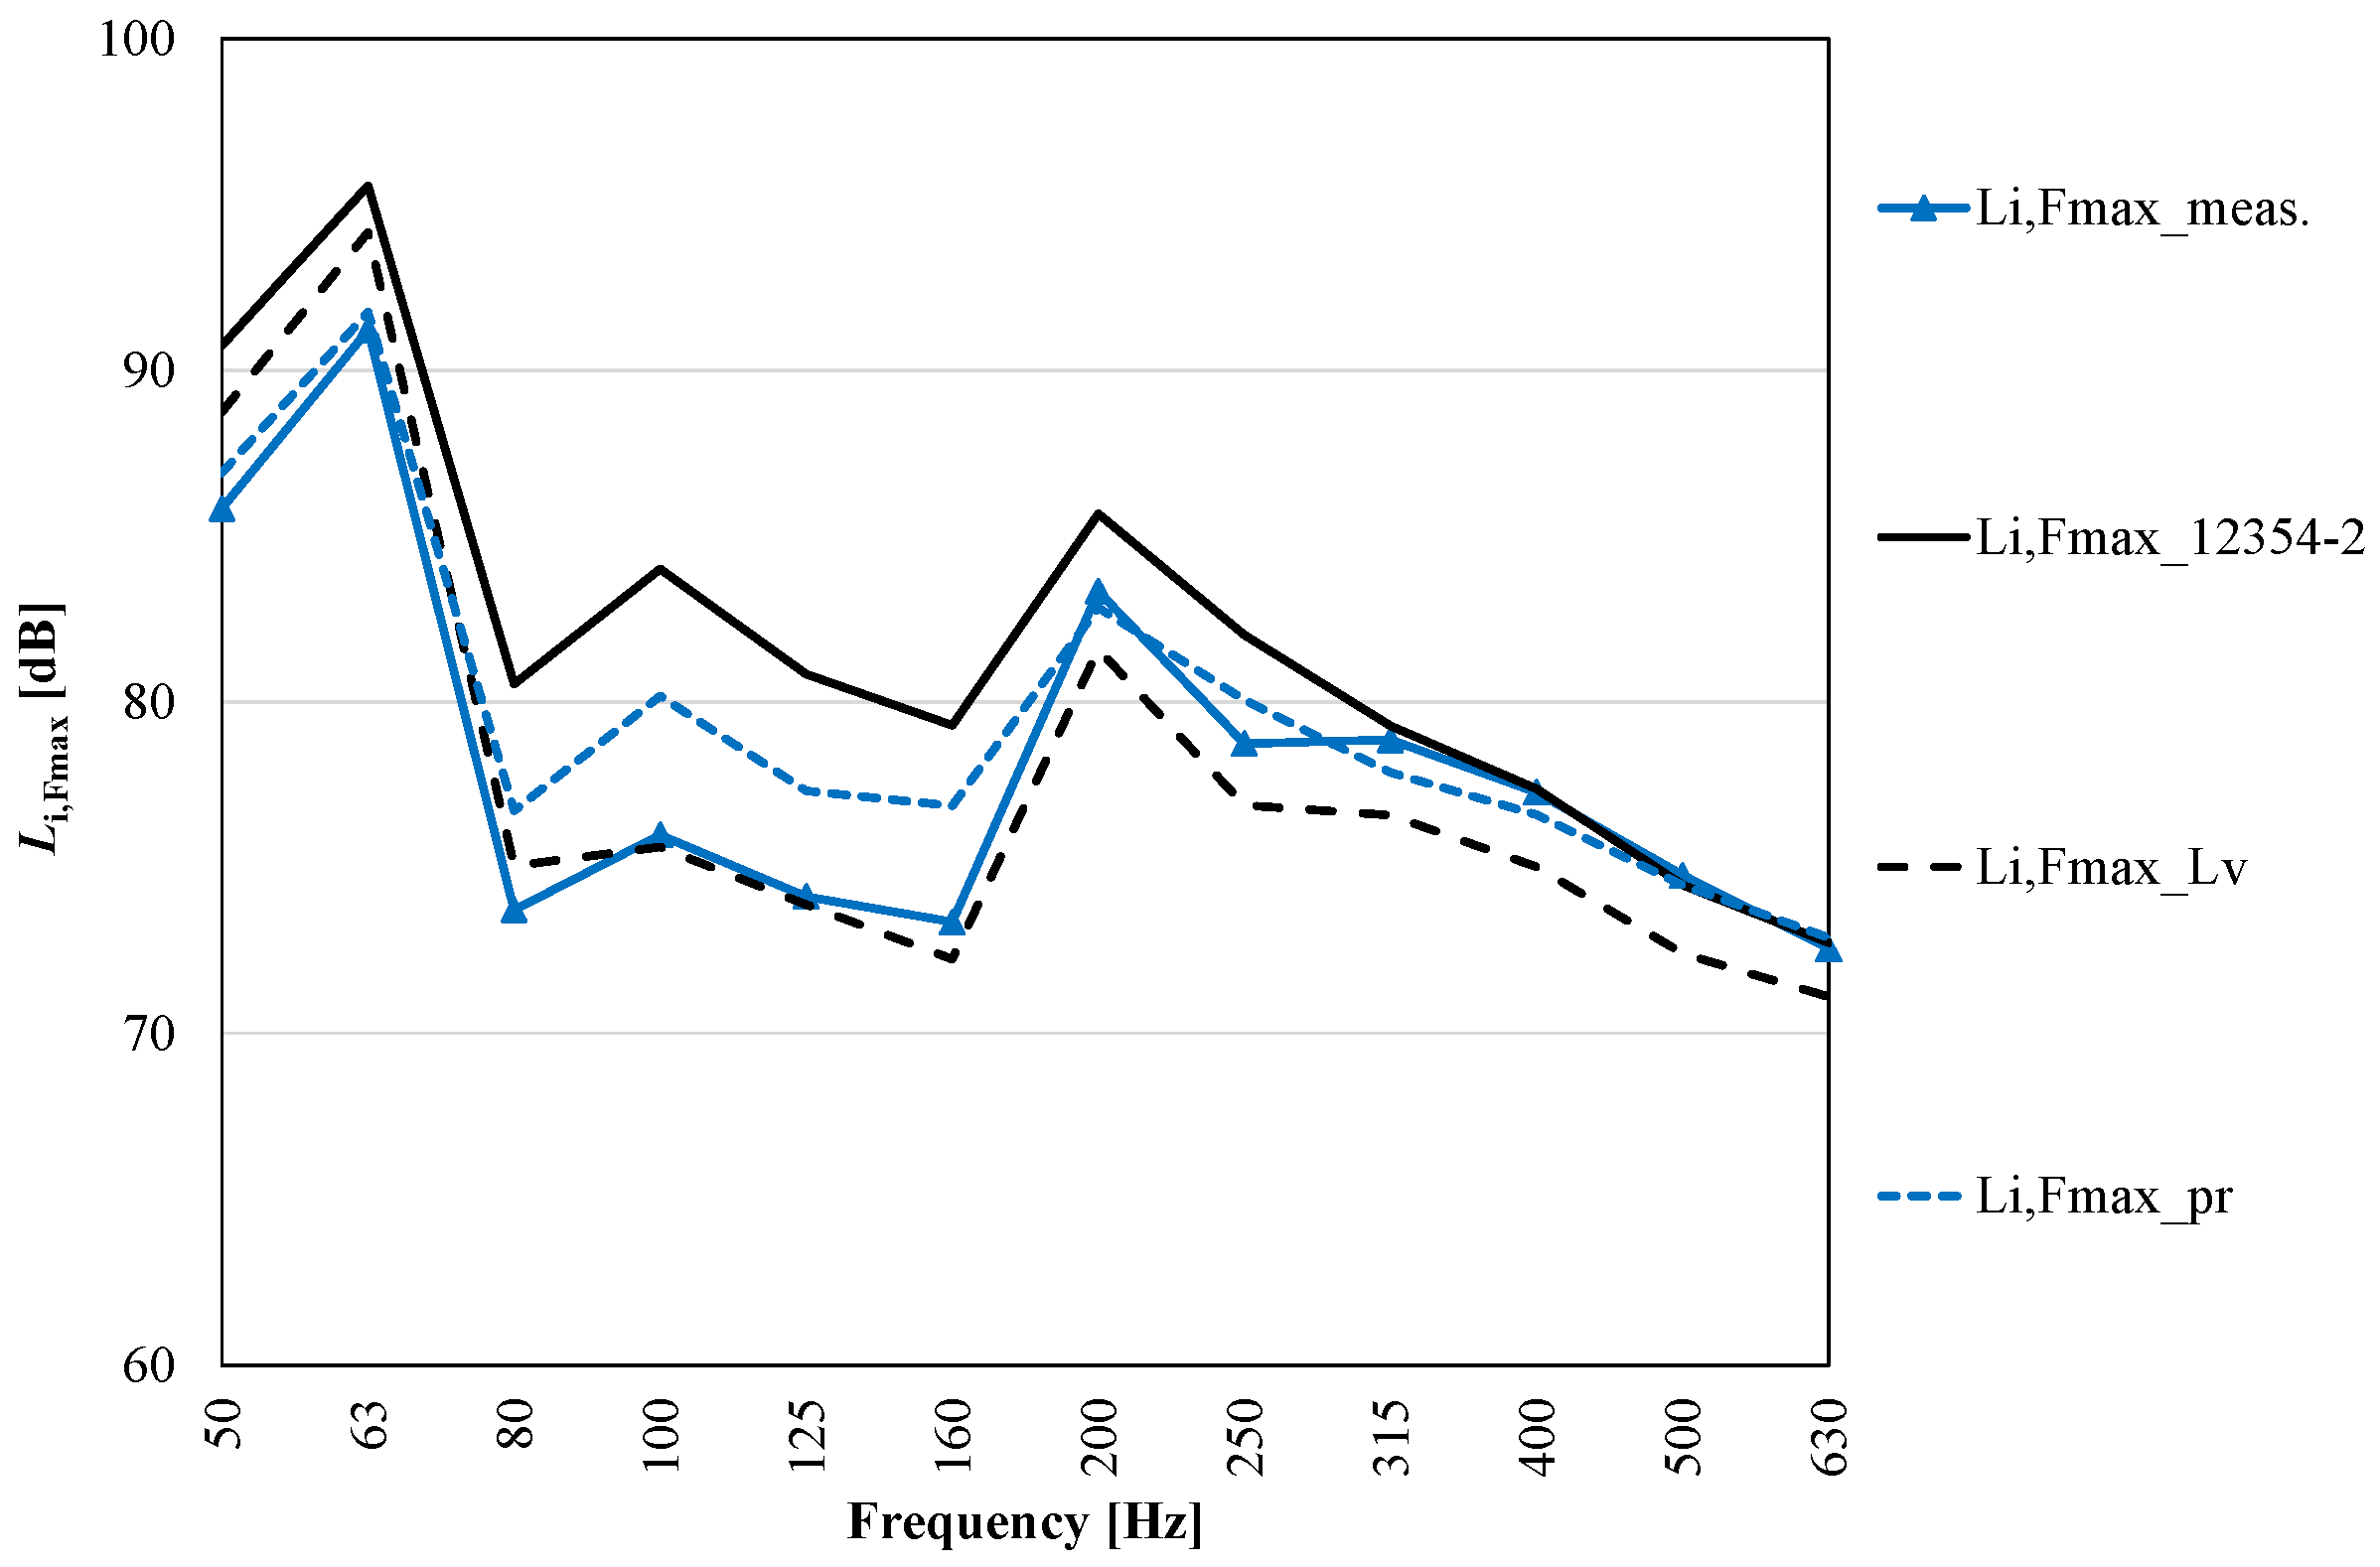
  • Then, it was observed that the predicted sound reduction index, evaluated with the mass law R = 20lg(mf) − 47, was not suitable for the CLT floor examined, and a new proposed law was introduced for CLT floors. Furthermore, a correlation between the normalized impact pressure level and the impact sound pressure level of the rubber ball was detected.
  • Finally, for all three types of sources, the use of velocity level measurements to derive the acoustic parameters has led to good results, in comparison to the experimental data. This could not be fully verified in in-situ measurements due to lateral transmissions, which are not trivial, to be determined.
As for the impact sound pressure level, good correlations (within 2 dB) can be seen, both with the use of the reference curve, and by using the formula provided by the ISO 12354-2 standard, using, in any case, the measured radiation index and the structural reverberation time. As for the sound reduction index, the standard model leads to an underestimation at medium-low frequencies and to a considerable overestimation at medium-high frequencies. From the results obtained, it was possible to see how traditional analytical models do not provide good approximations of the measurements. Good correlations are obtained using the proposed equations; however, these correlations can be used with floors having characteristics similar to those used in laboratory tests.
A future development of this work will concern the study of the CLT floor with coverings consisting of acoustic mats, with a concrete screed and the influence of the physical characteristics of the materials, with respect to the acoustic performance.

Author Contributions

Conceptualization, N.G.; software, N.G.; project administration, N.G.; validation, N.G. and A.M.; methodology, N.G. and A.M.; formal analysis, N.G. and A.M.; investigation, N.G. and A.M.; data curation, N.G. and A.M.; writing—original draft preparation, N.G. and A.M.; writing—review and editing, N.G. and A.M.; visualization, A.M.; supervision, A.G.; funding acquisition, N.G. and A.M. All authors have read and agreed to the published version of the manuscript.

Funding

This research received no external funding.

Institutional Review Board Statement

Not applicable.

Informed Consent Statement

Not applicable.

Acknowledgments

This work was financed by the European Interreg BIGWOOD project, ITAT 1081 CUP: I54I18000300006.

Conflicts of Interest

The authors declare no conflict of interest.

Appendix A

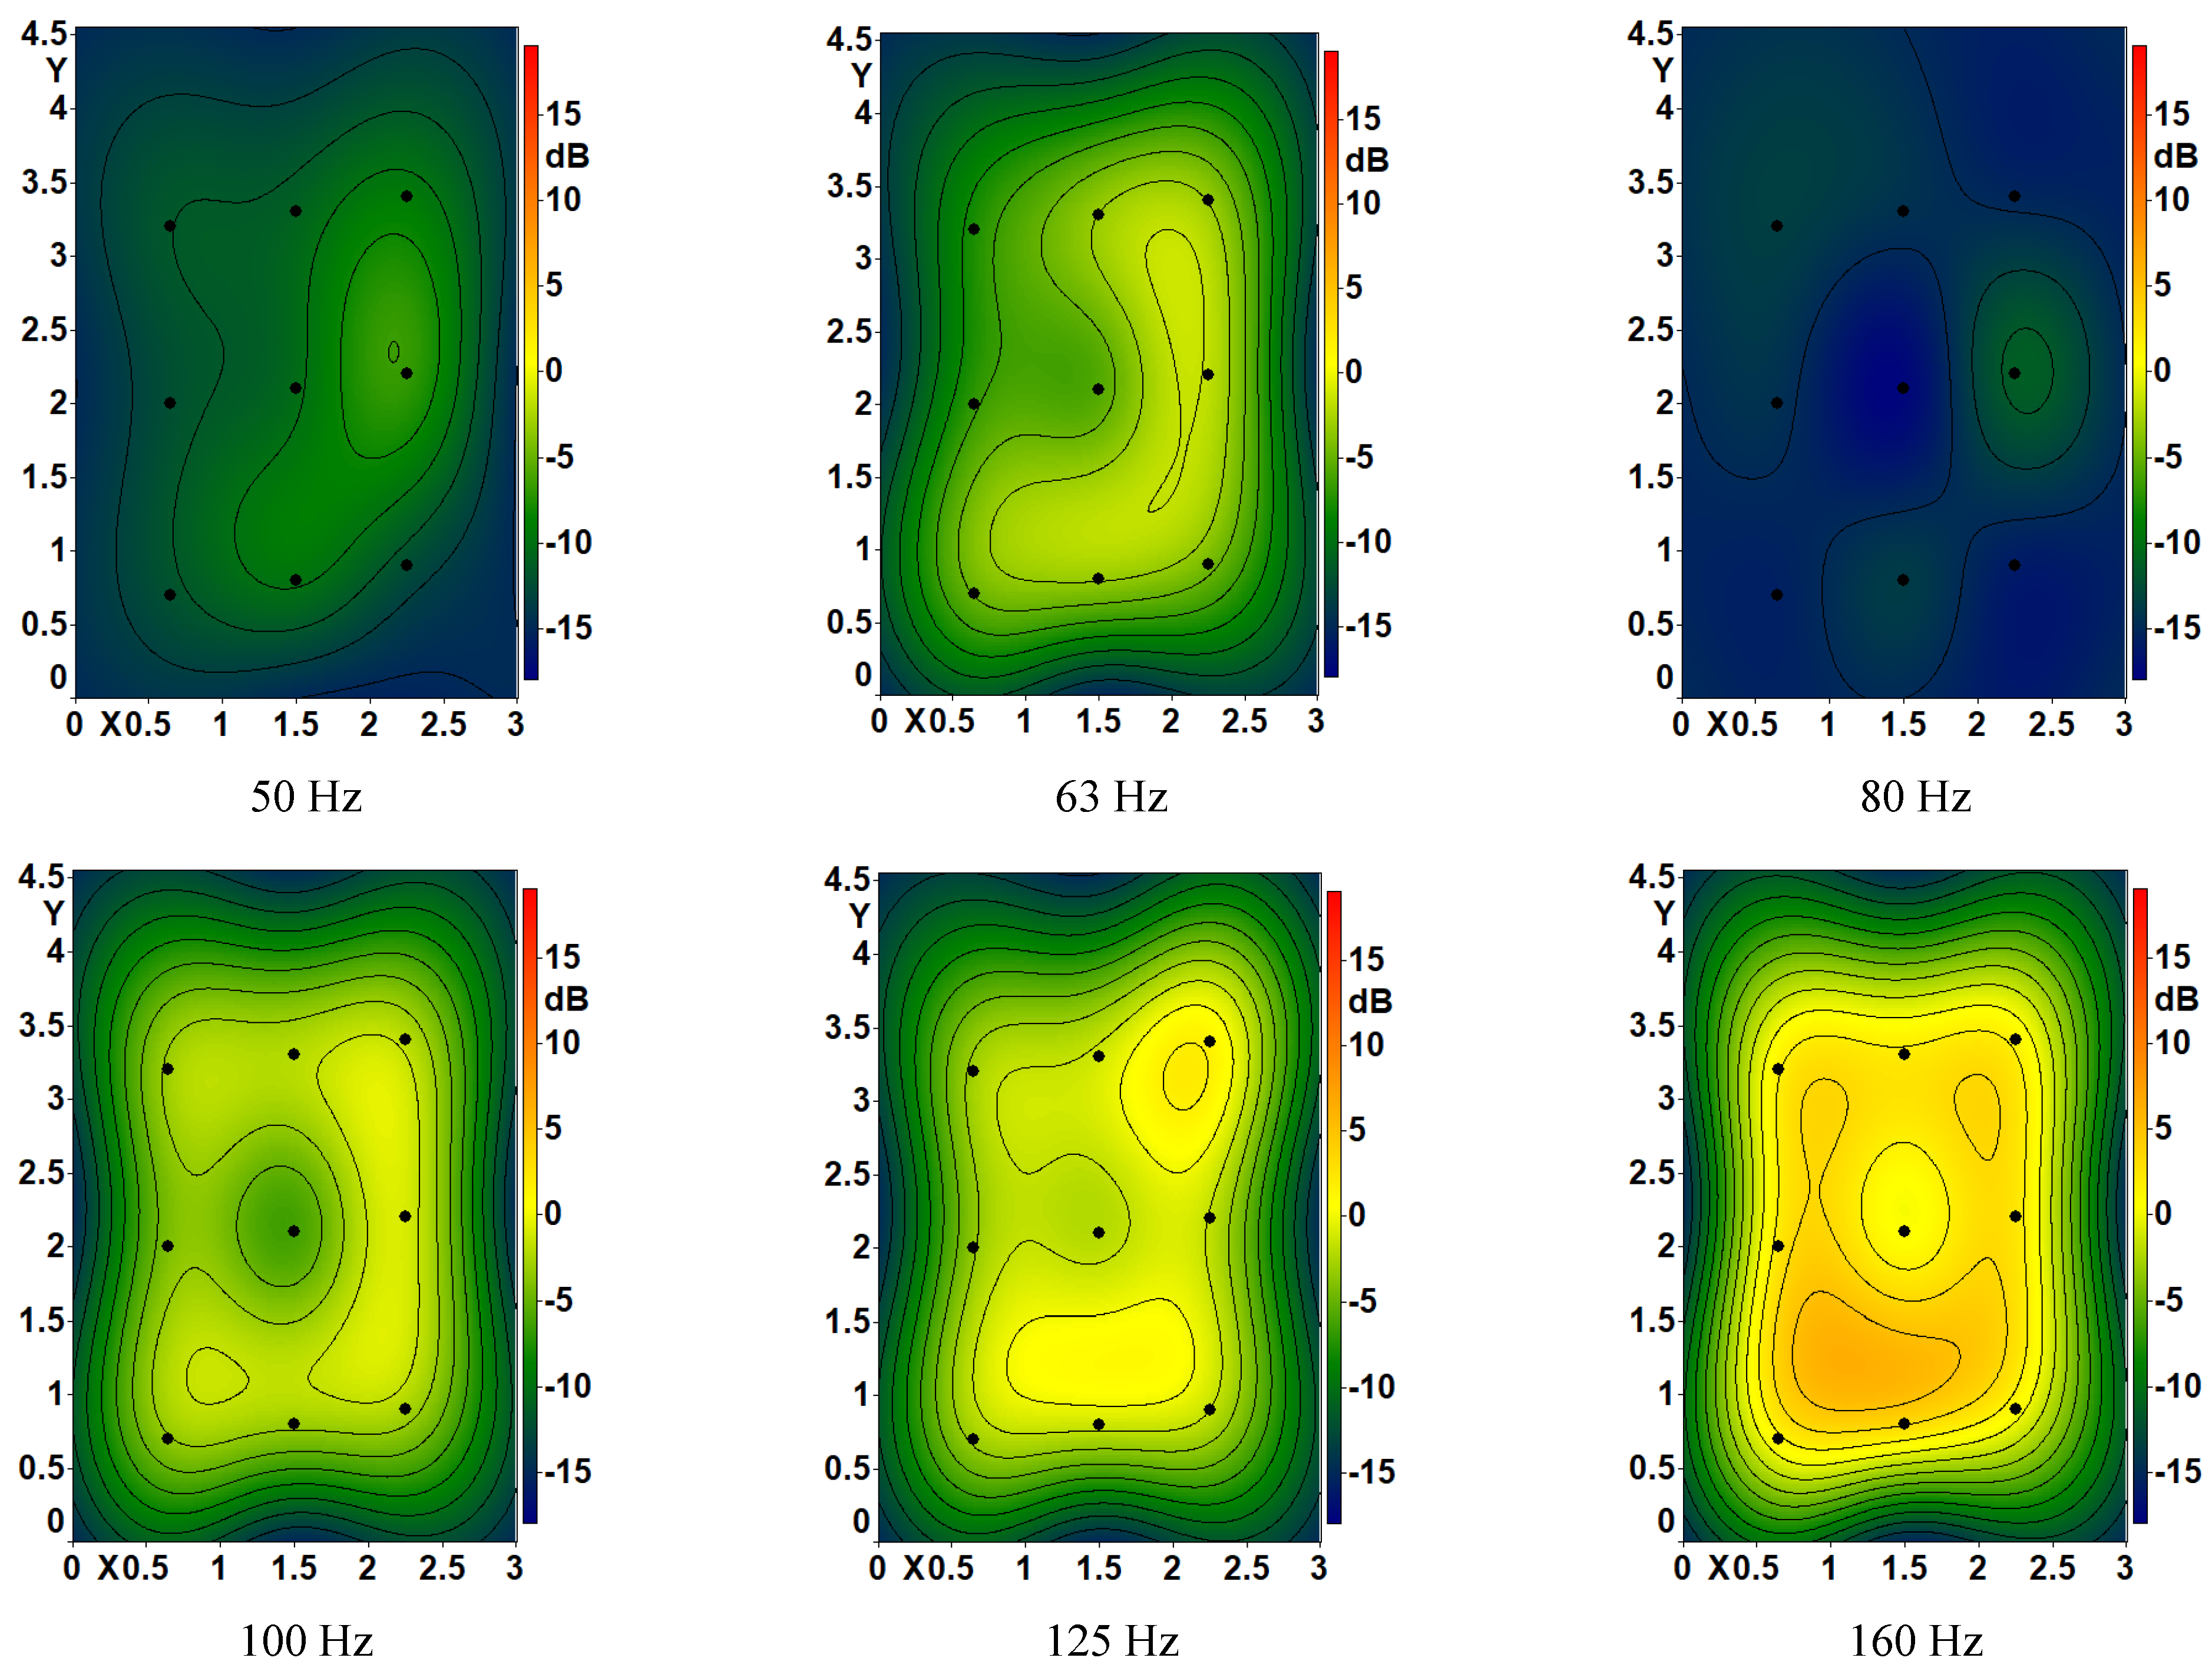
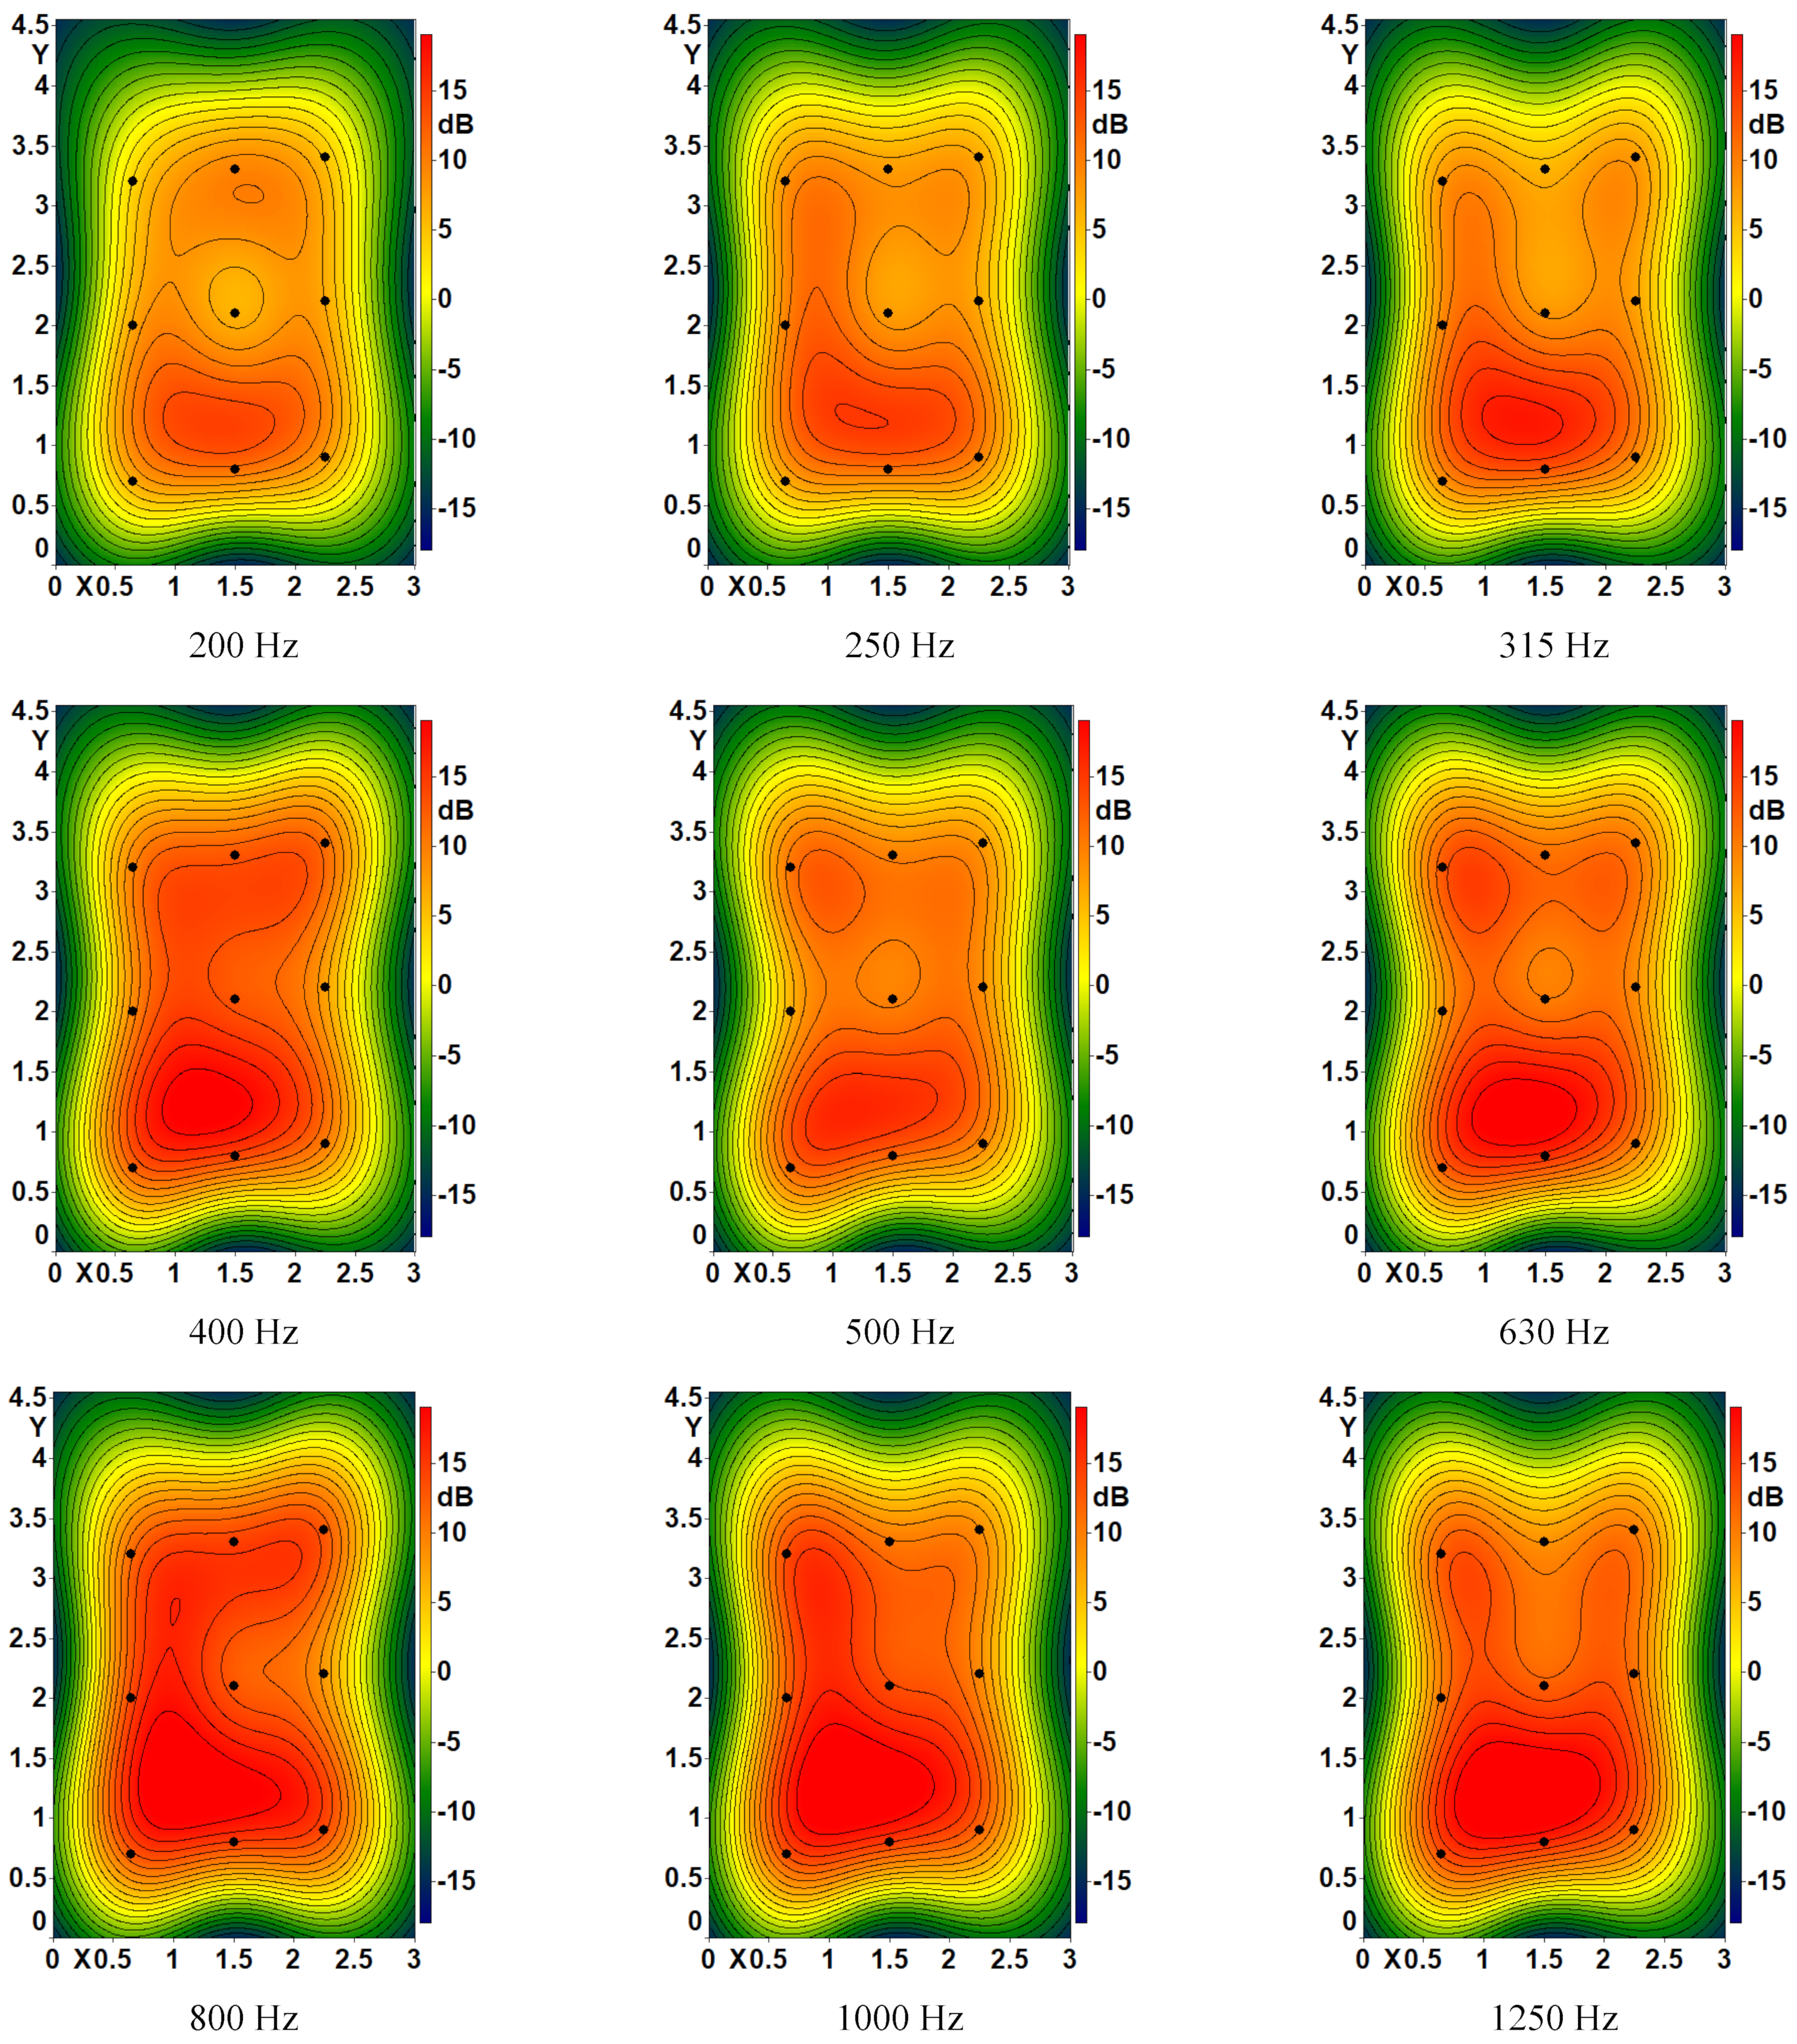
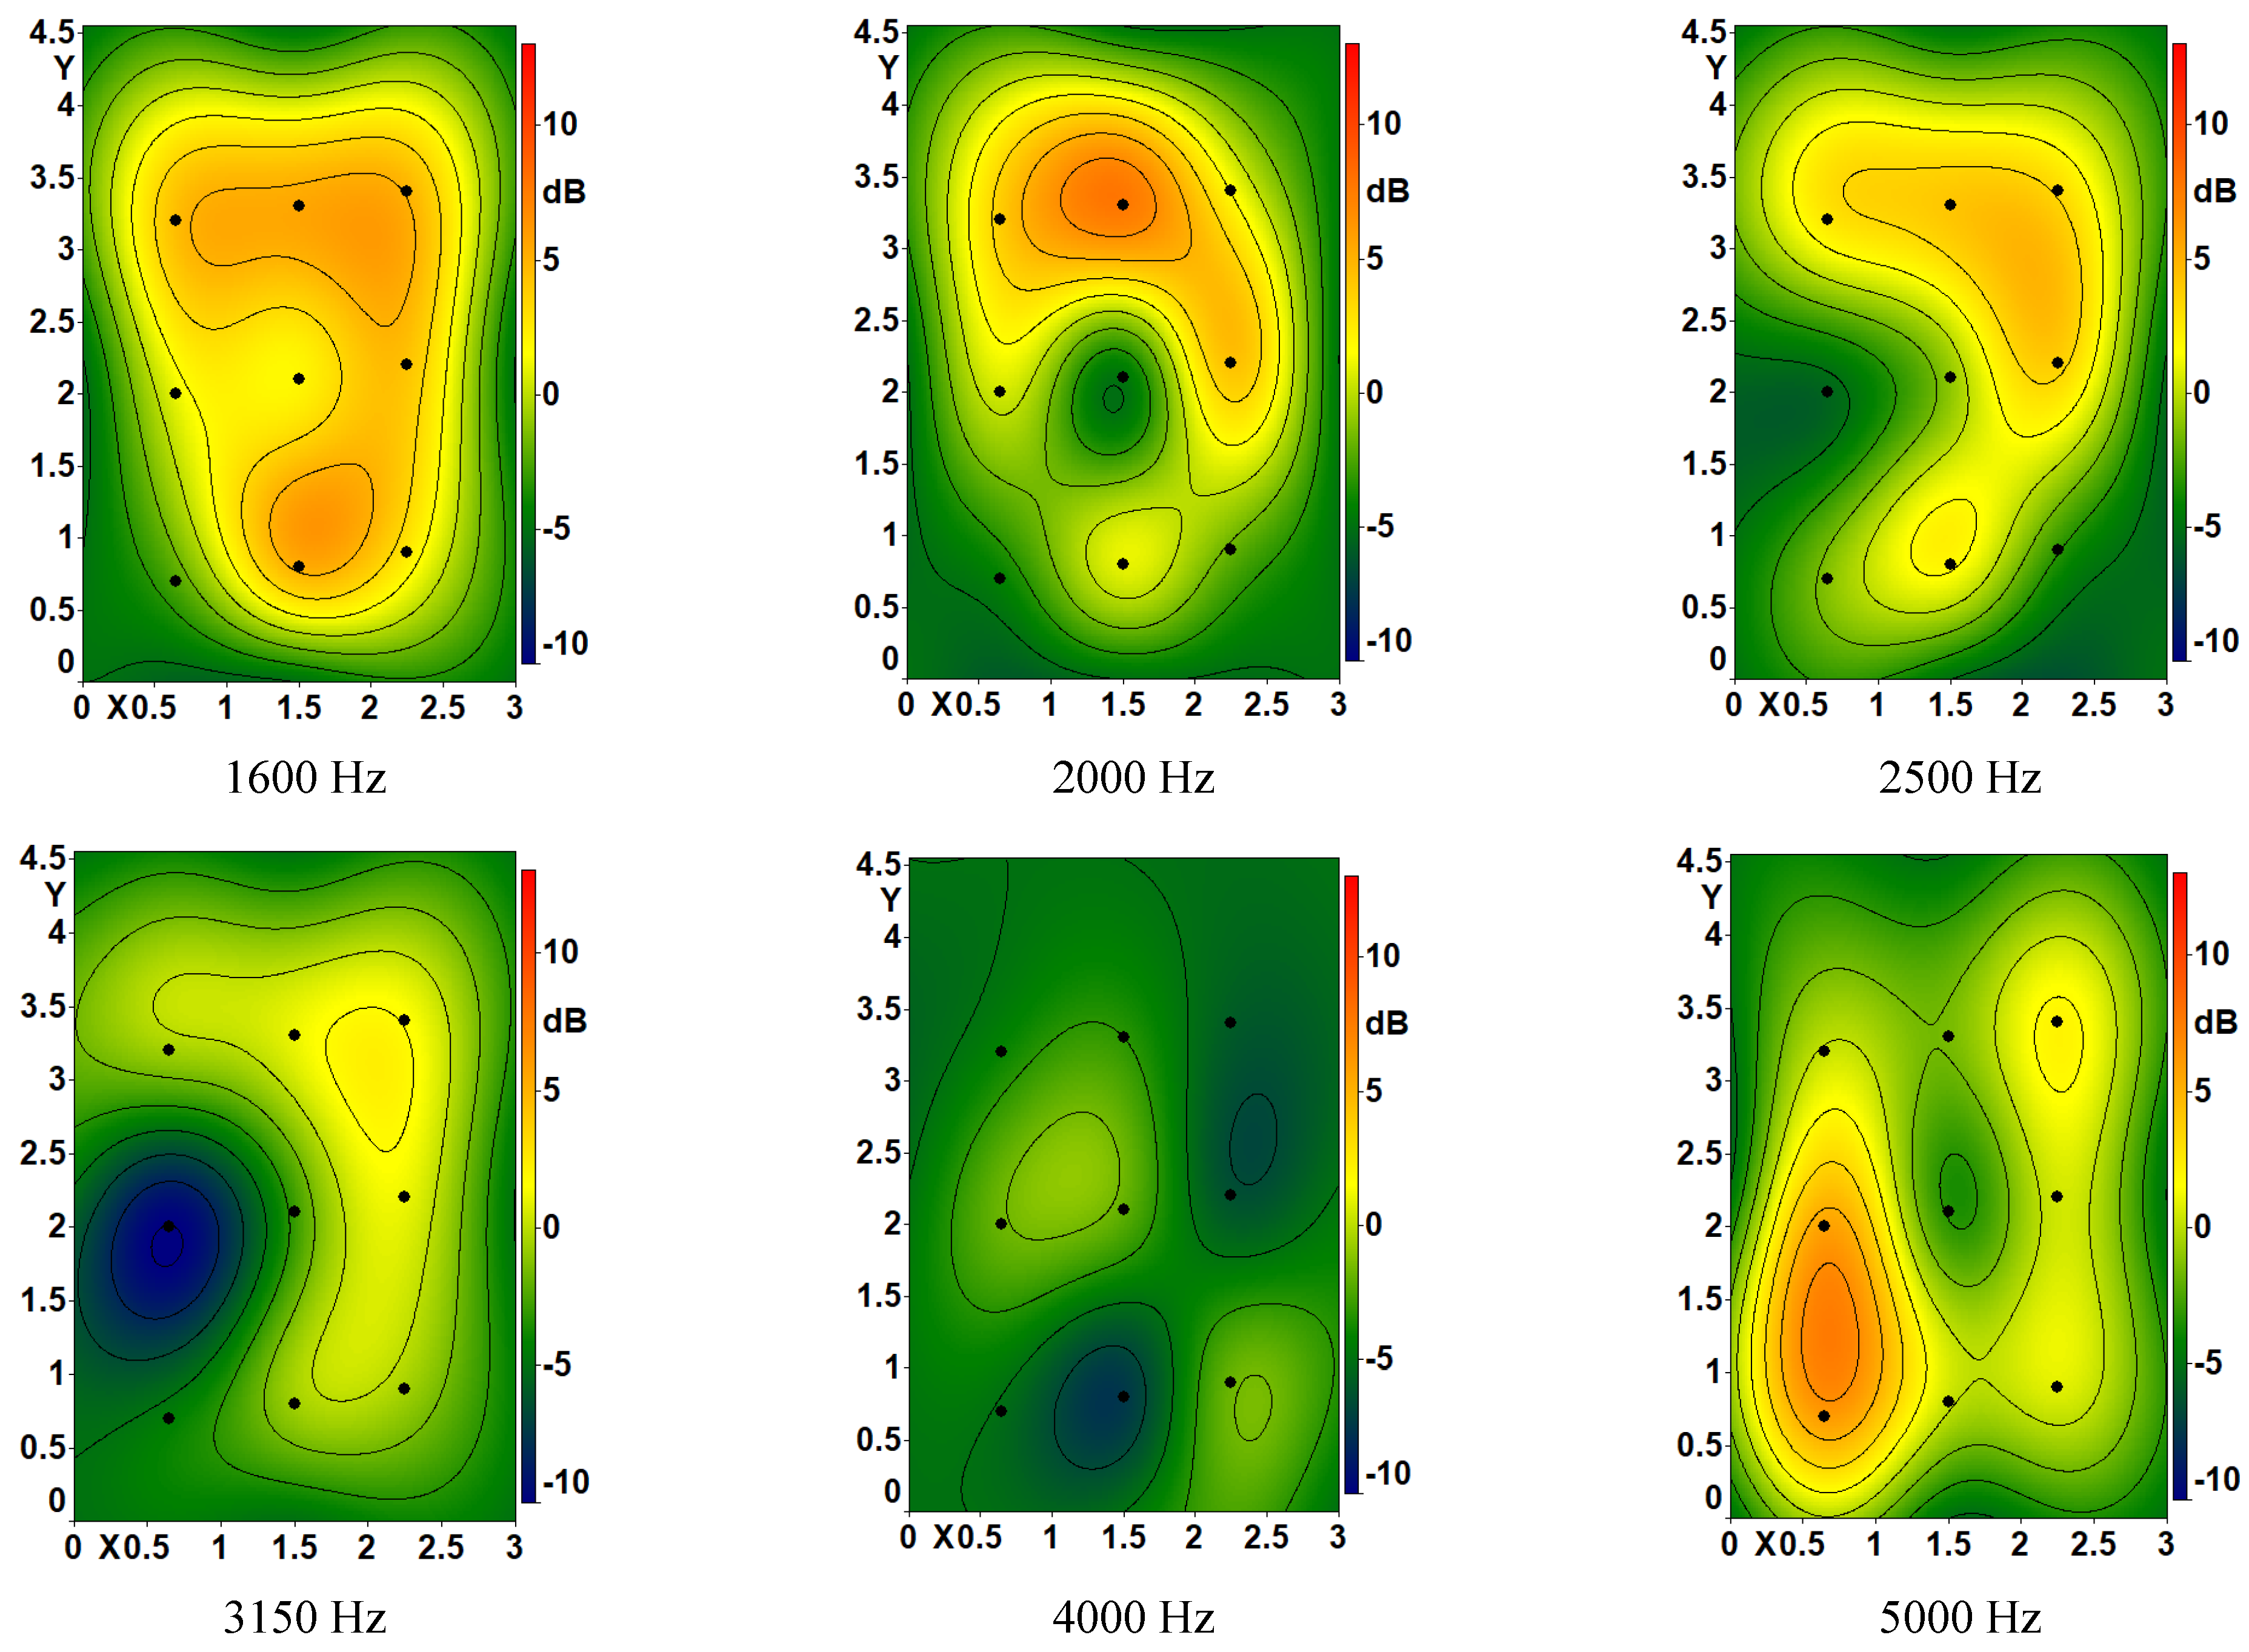
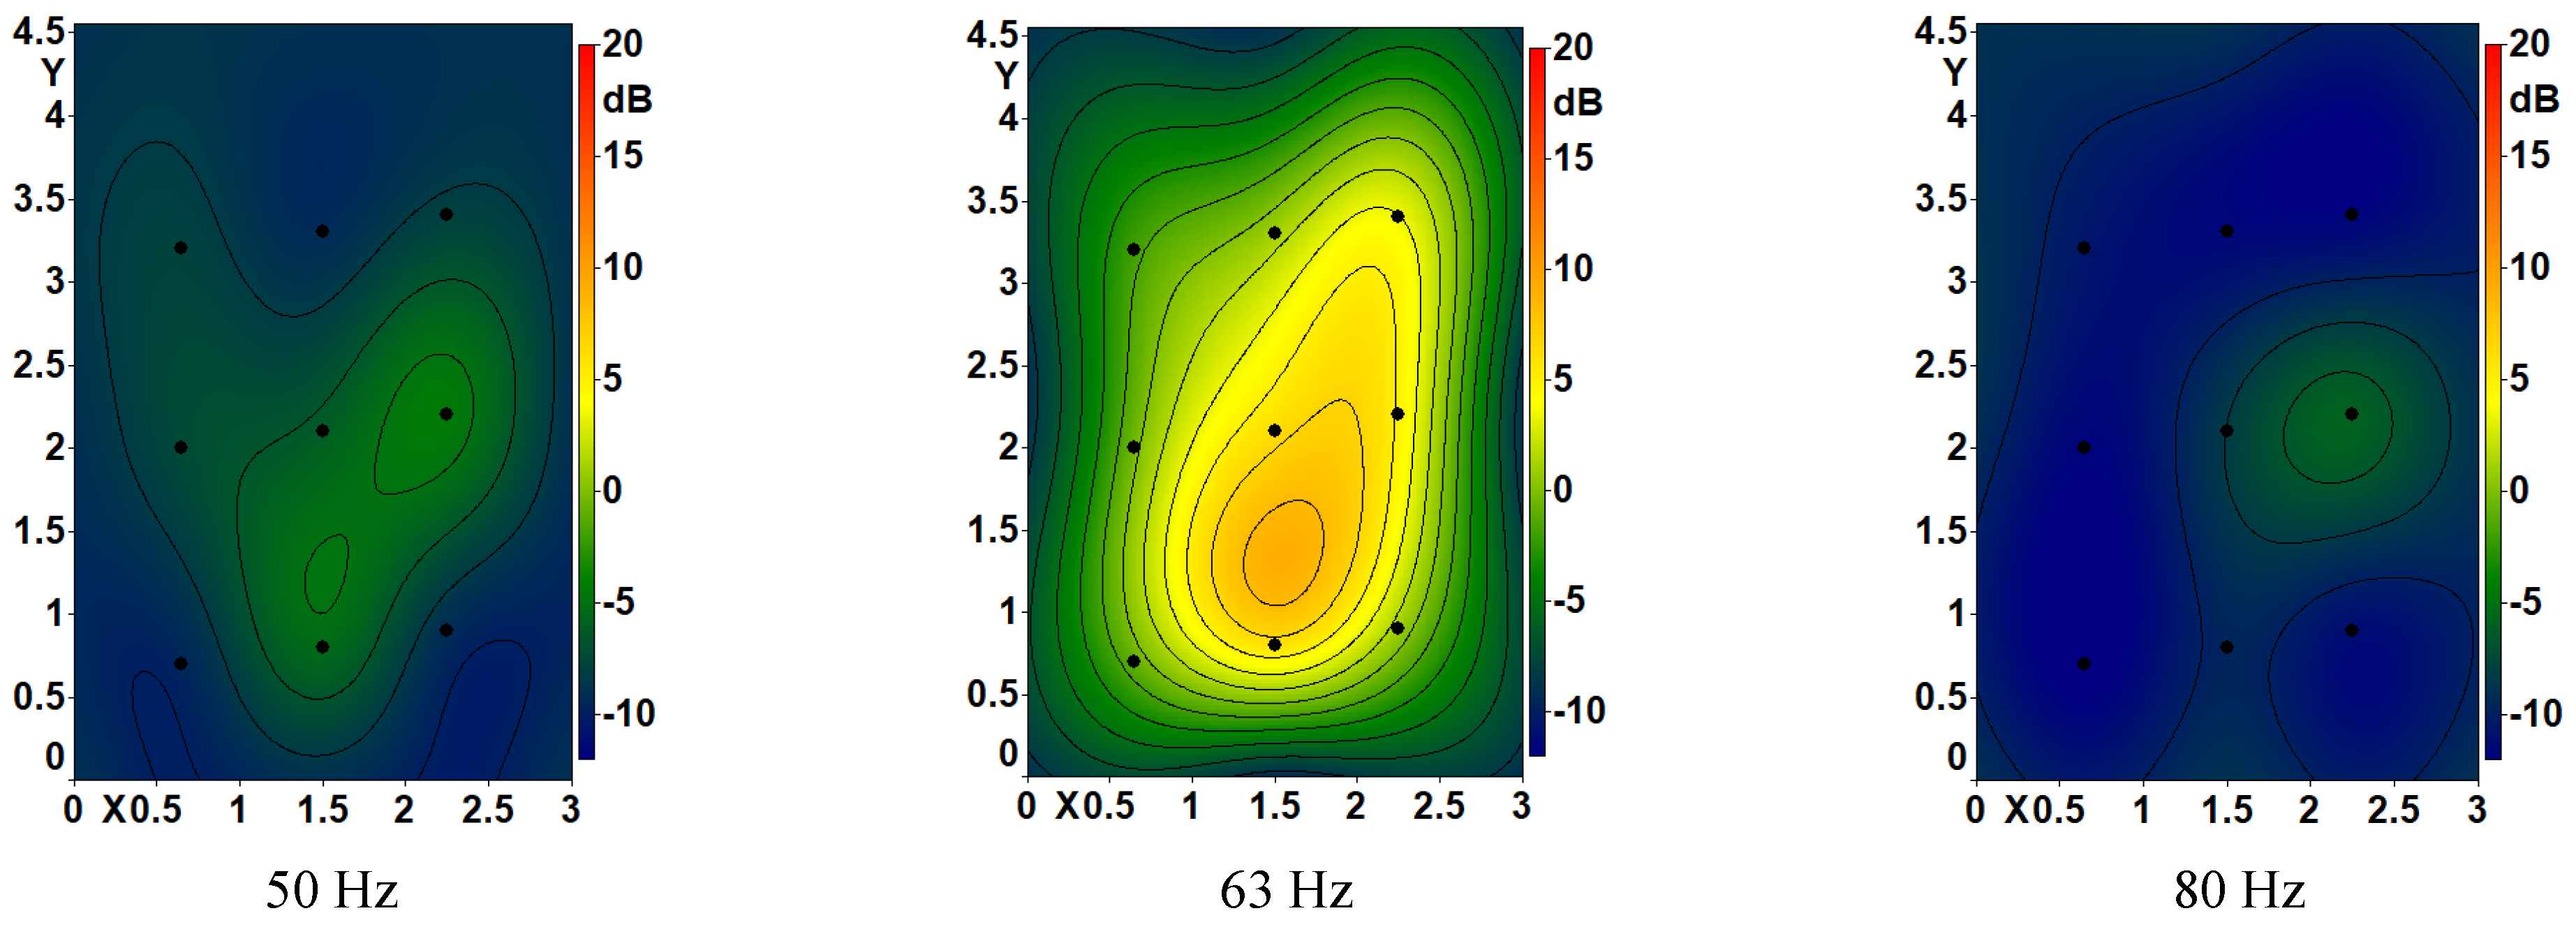
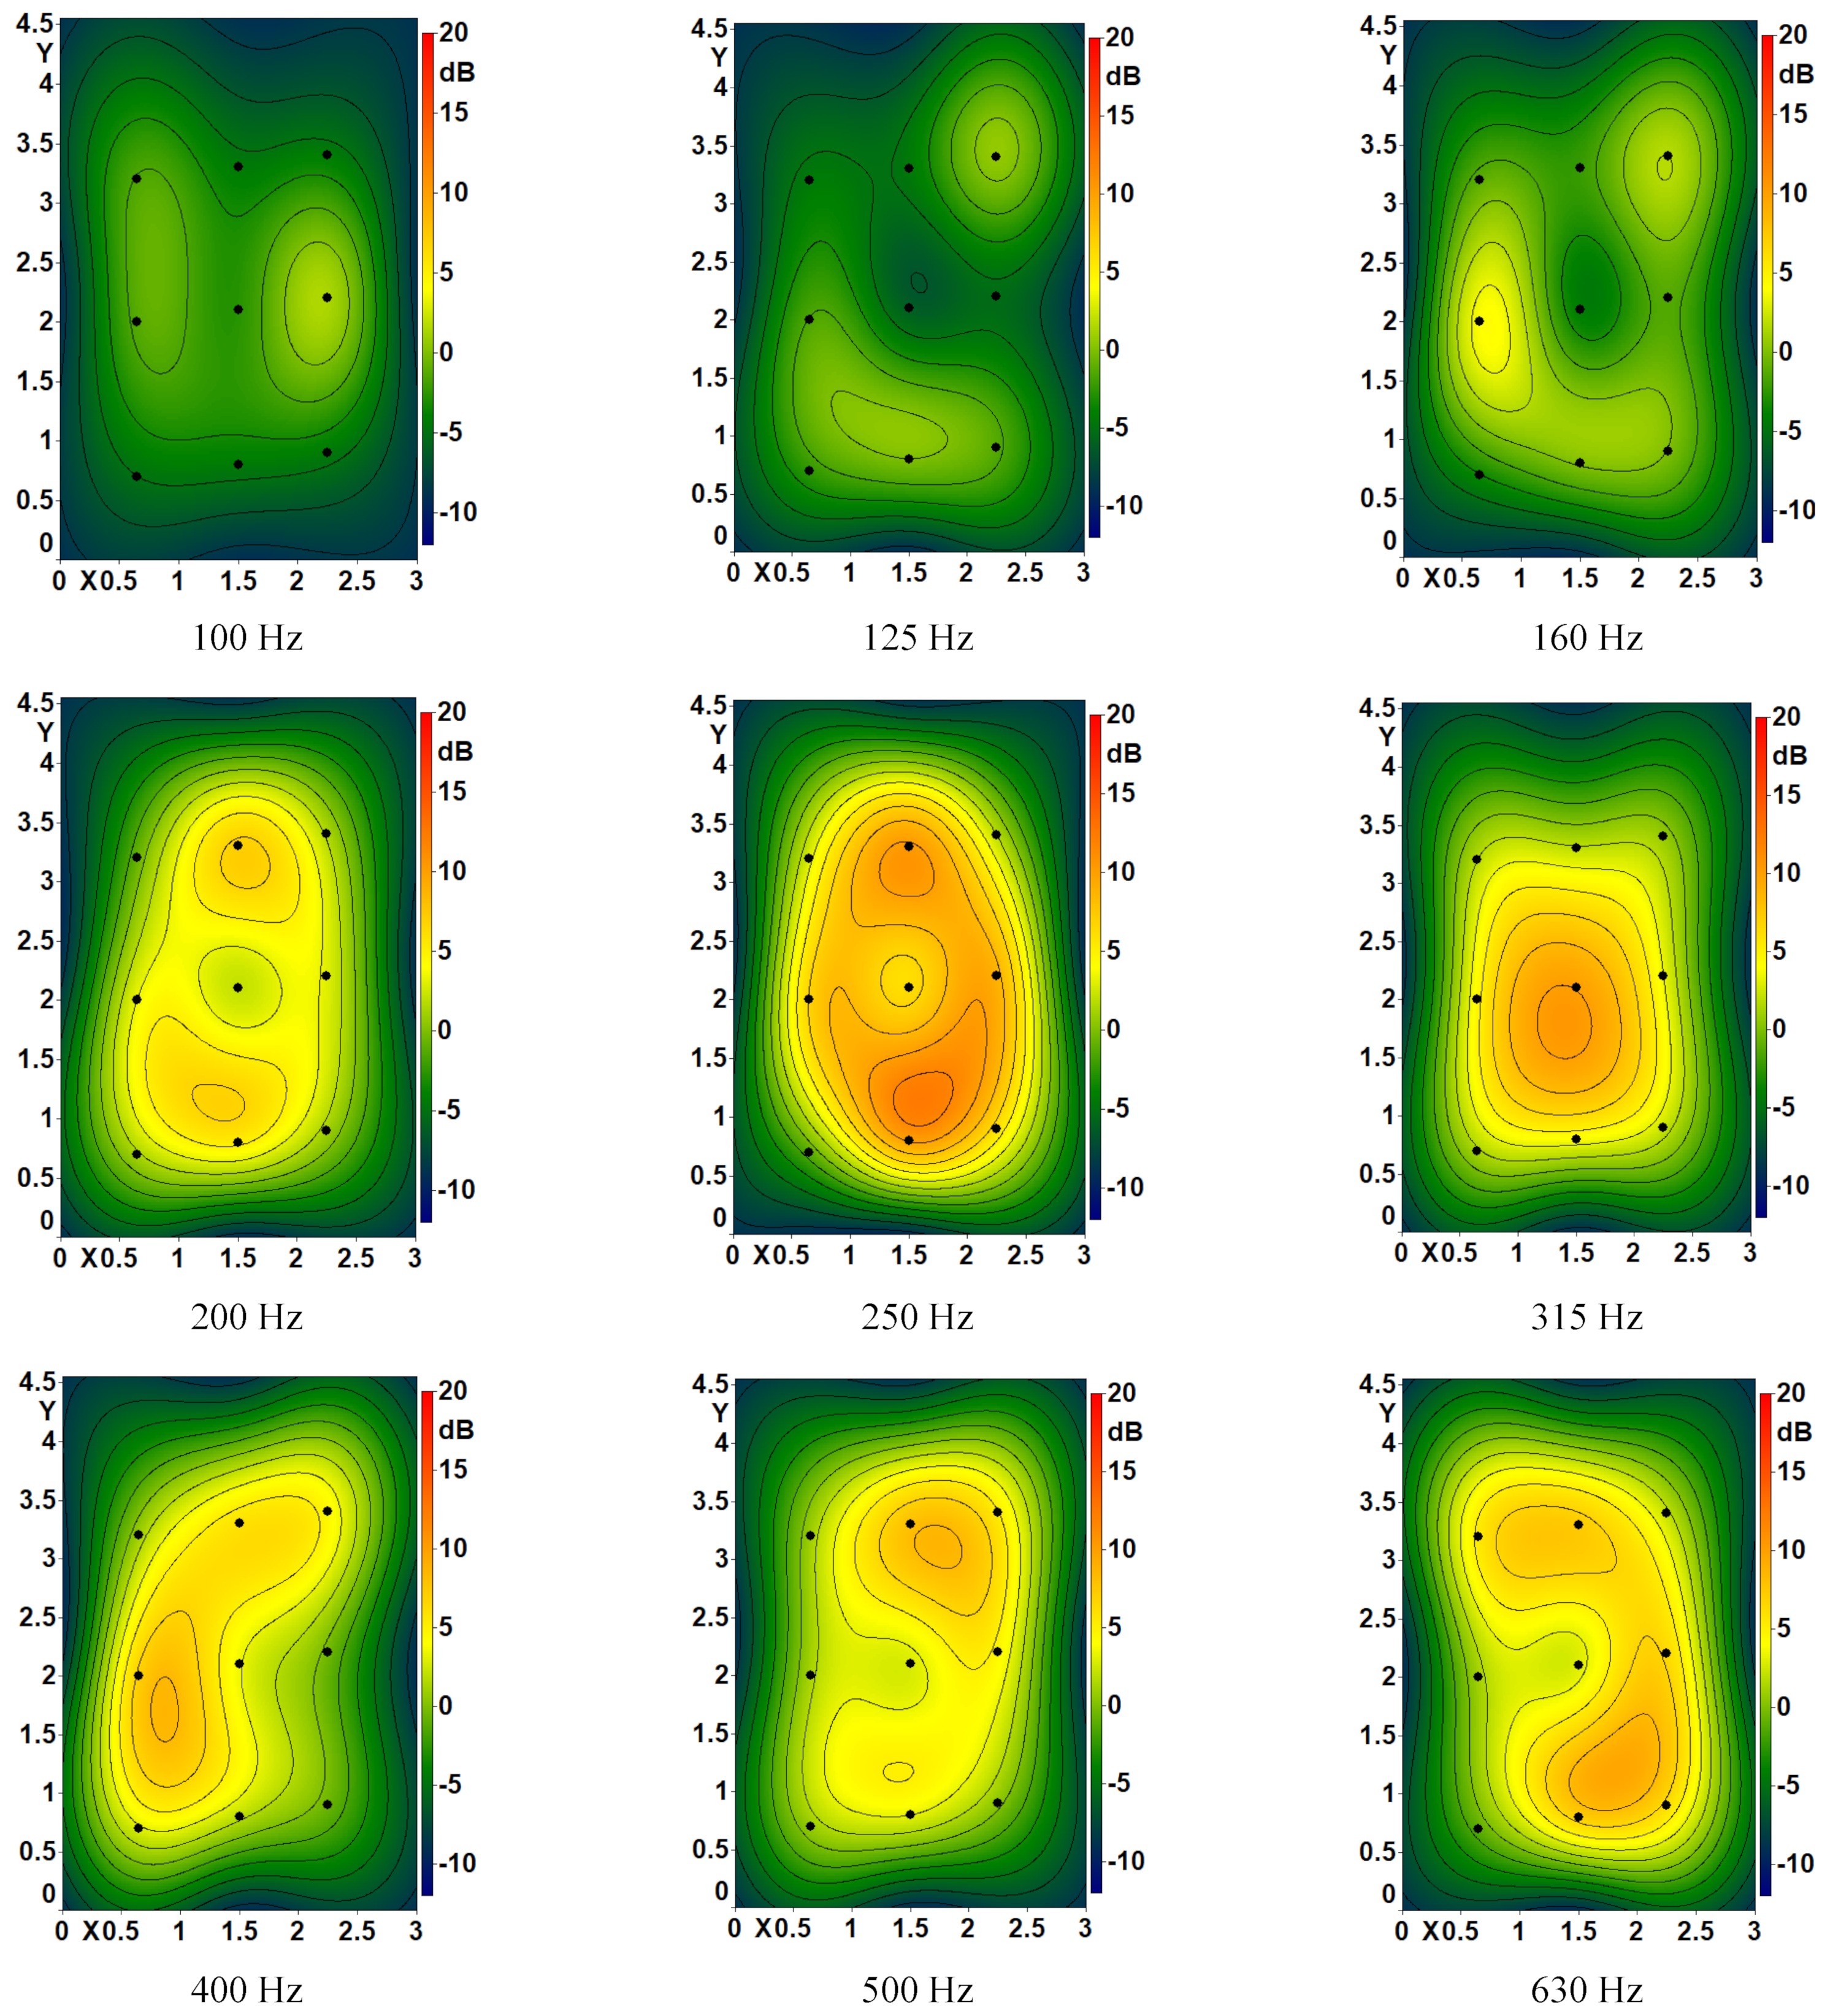
Appendix A.1. Tapping Machine Radiation Index Mapping

Figure A1. Tapping machine radiation index maps. Average between the three source positions.
Applsci 12 03233 g0a1aApplsci 12 03233 g0a1bApplsci 12 03233 g0a1c

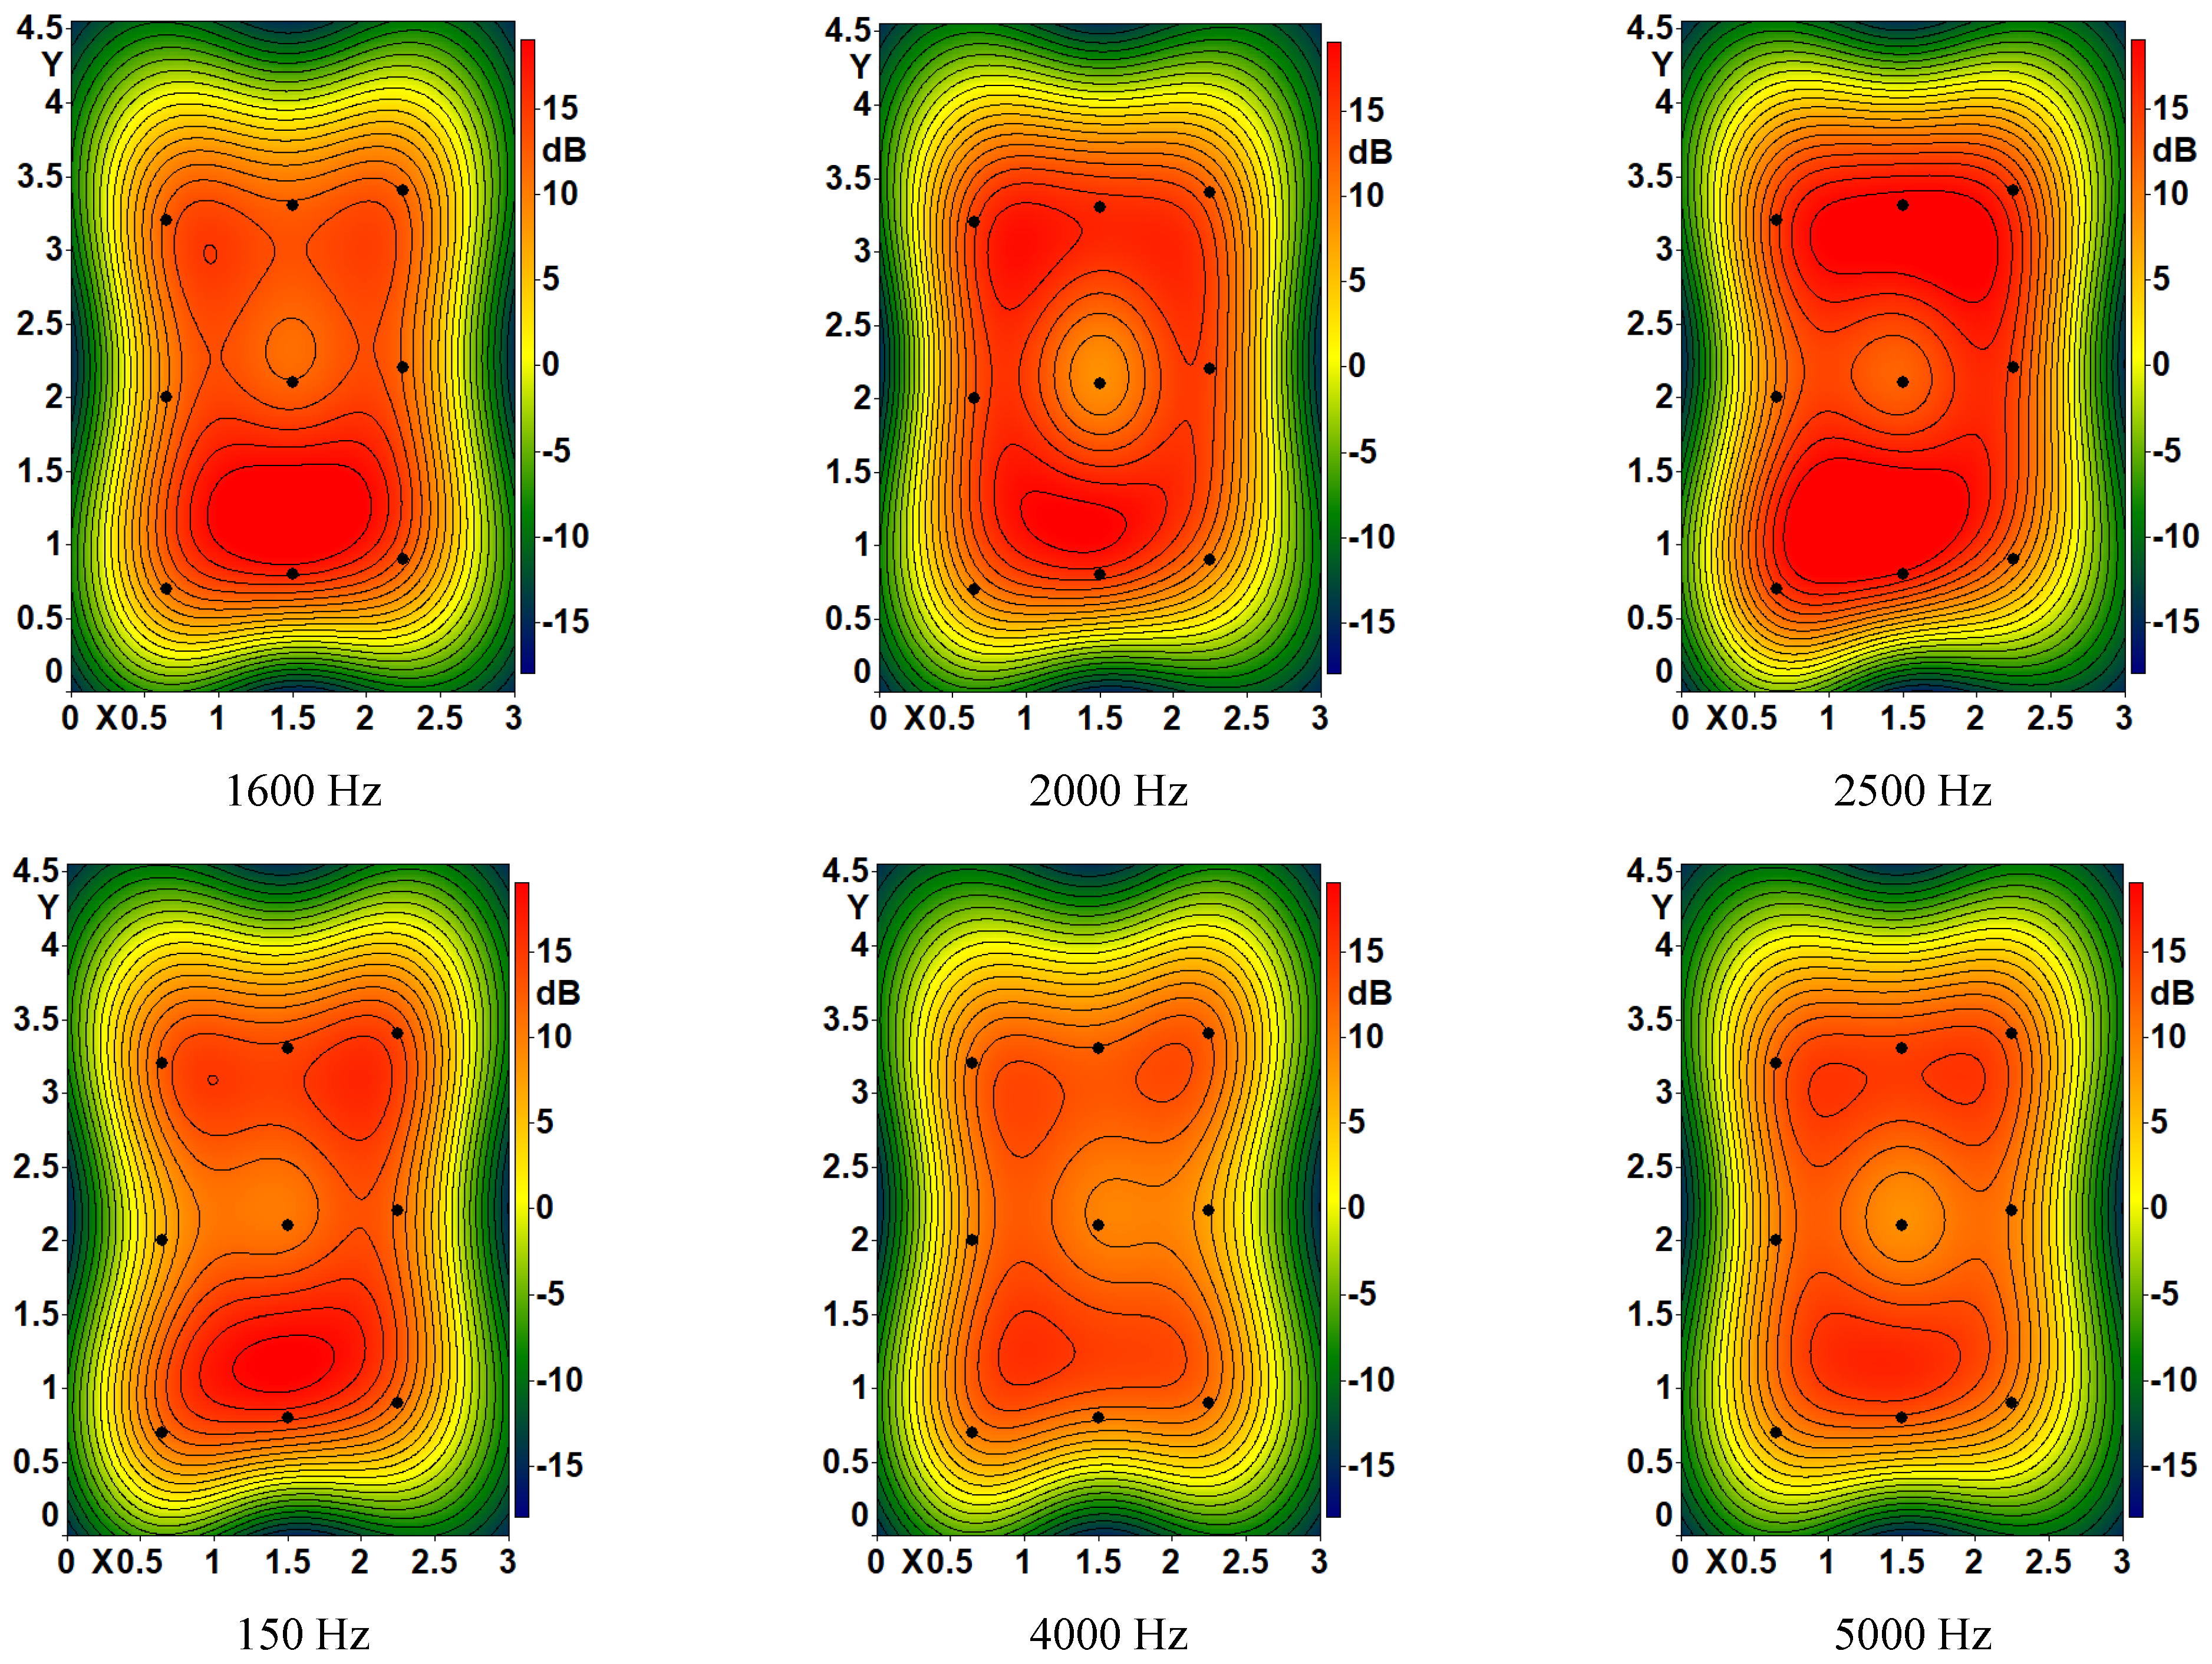
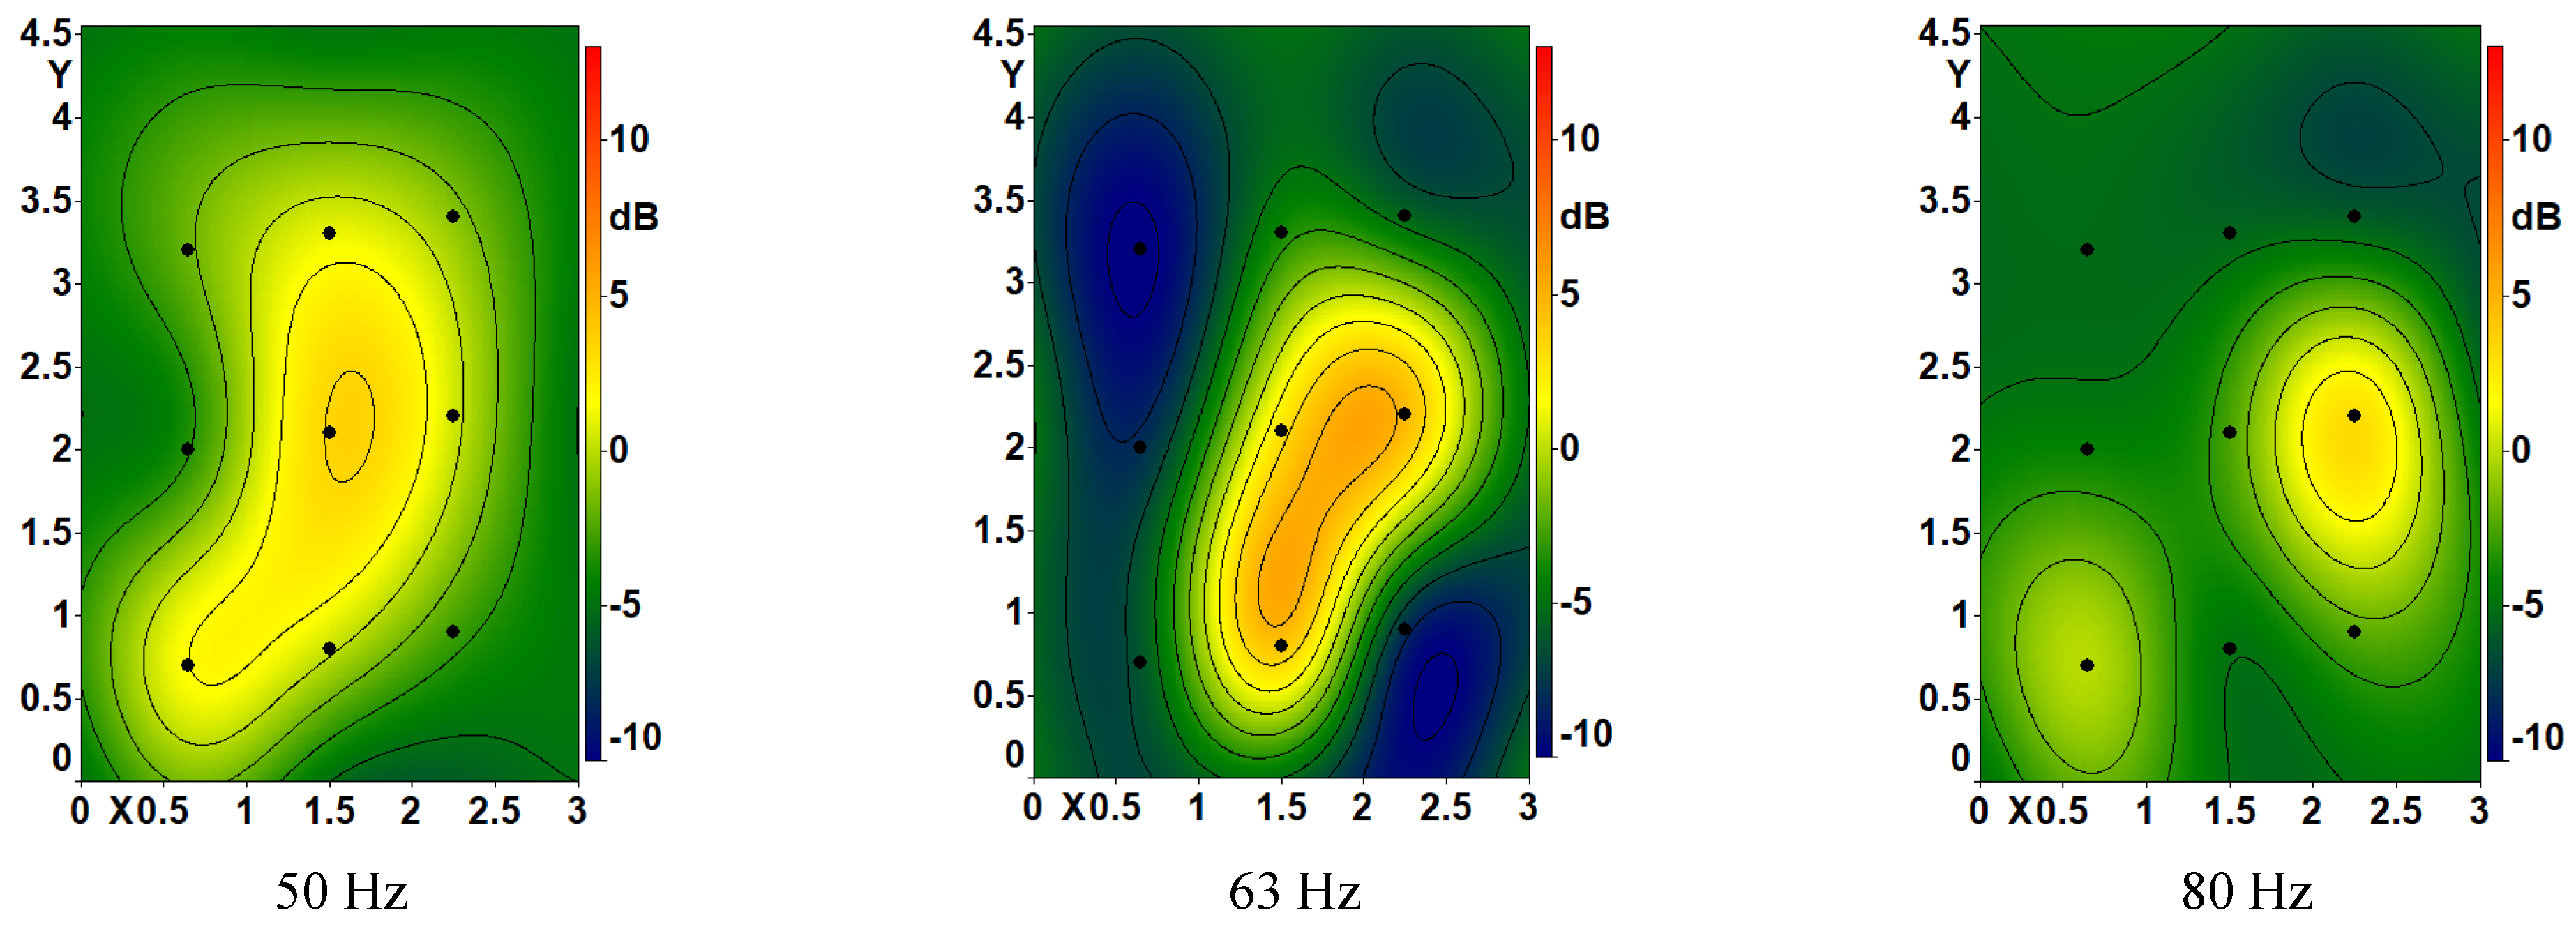
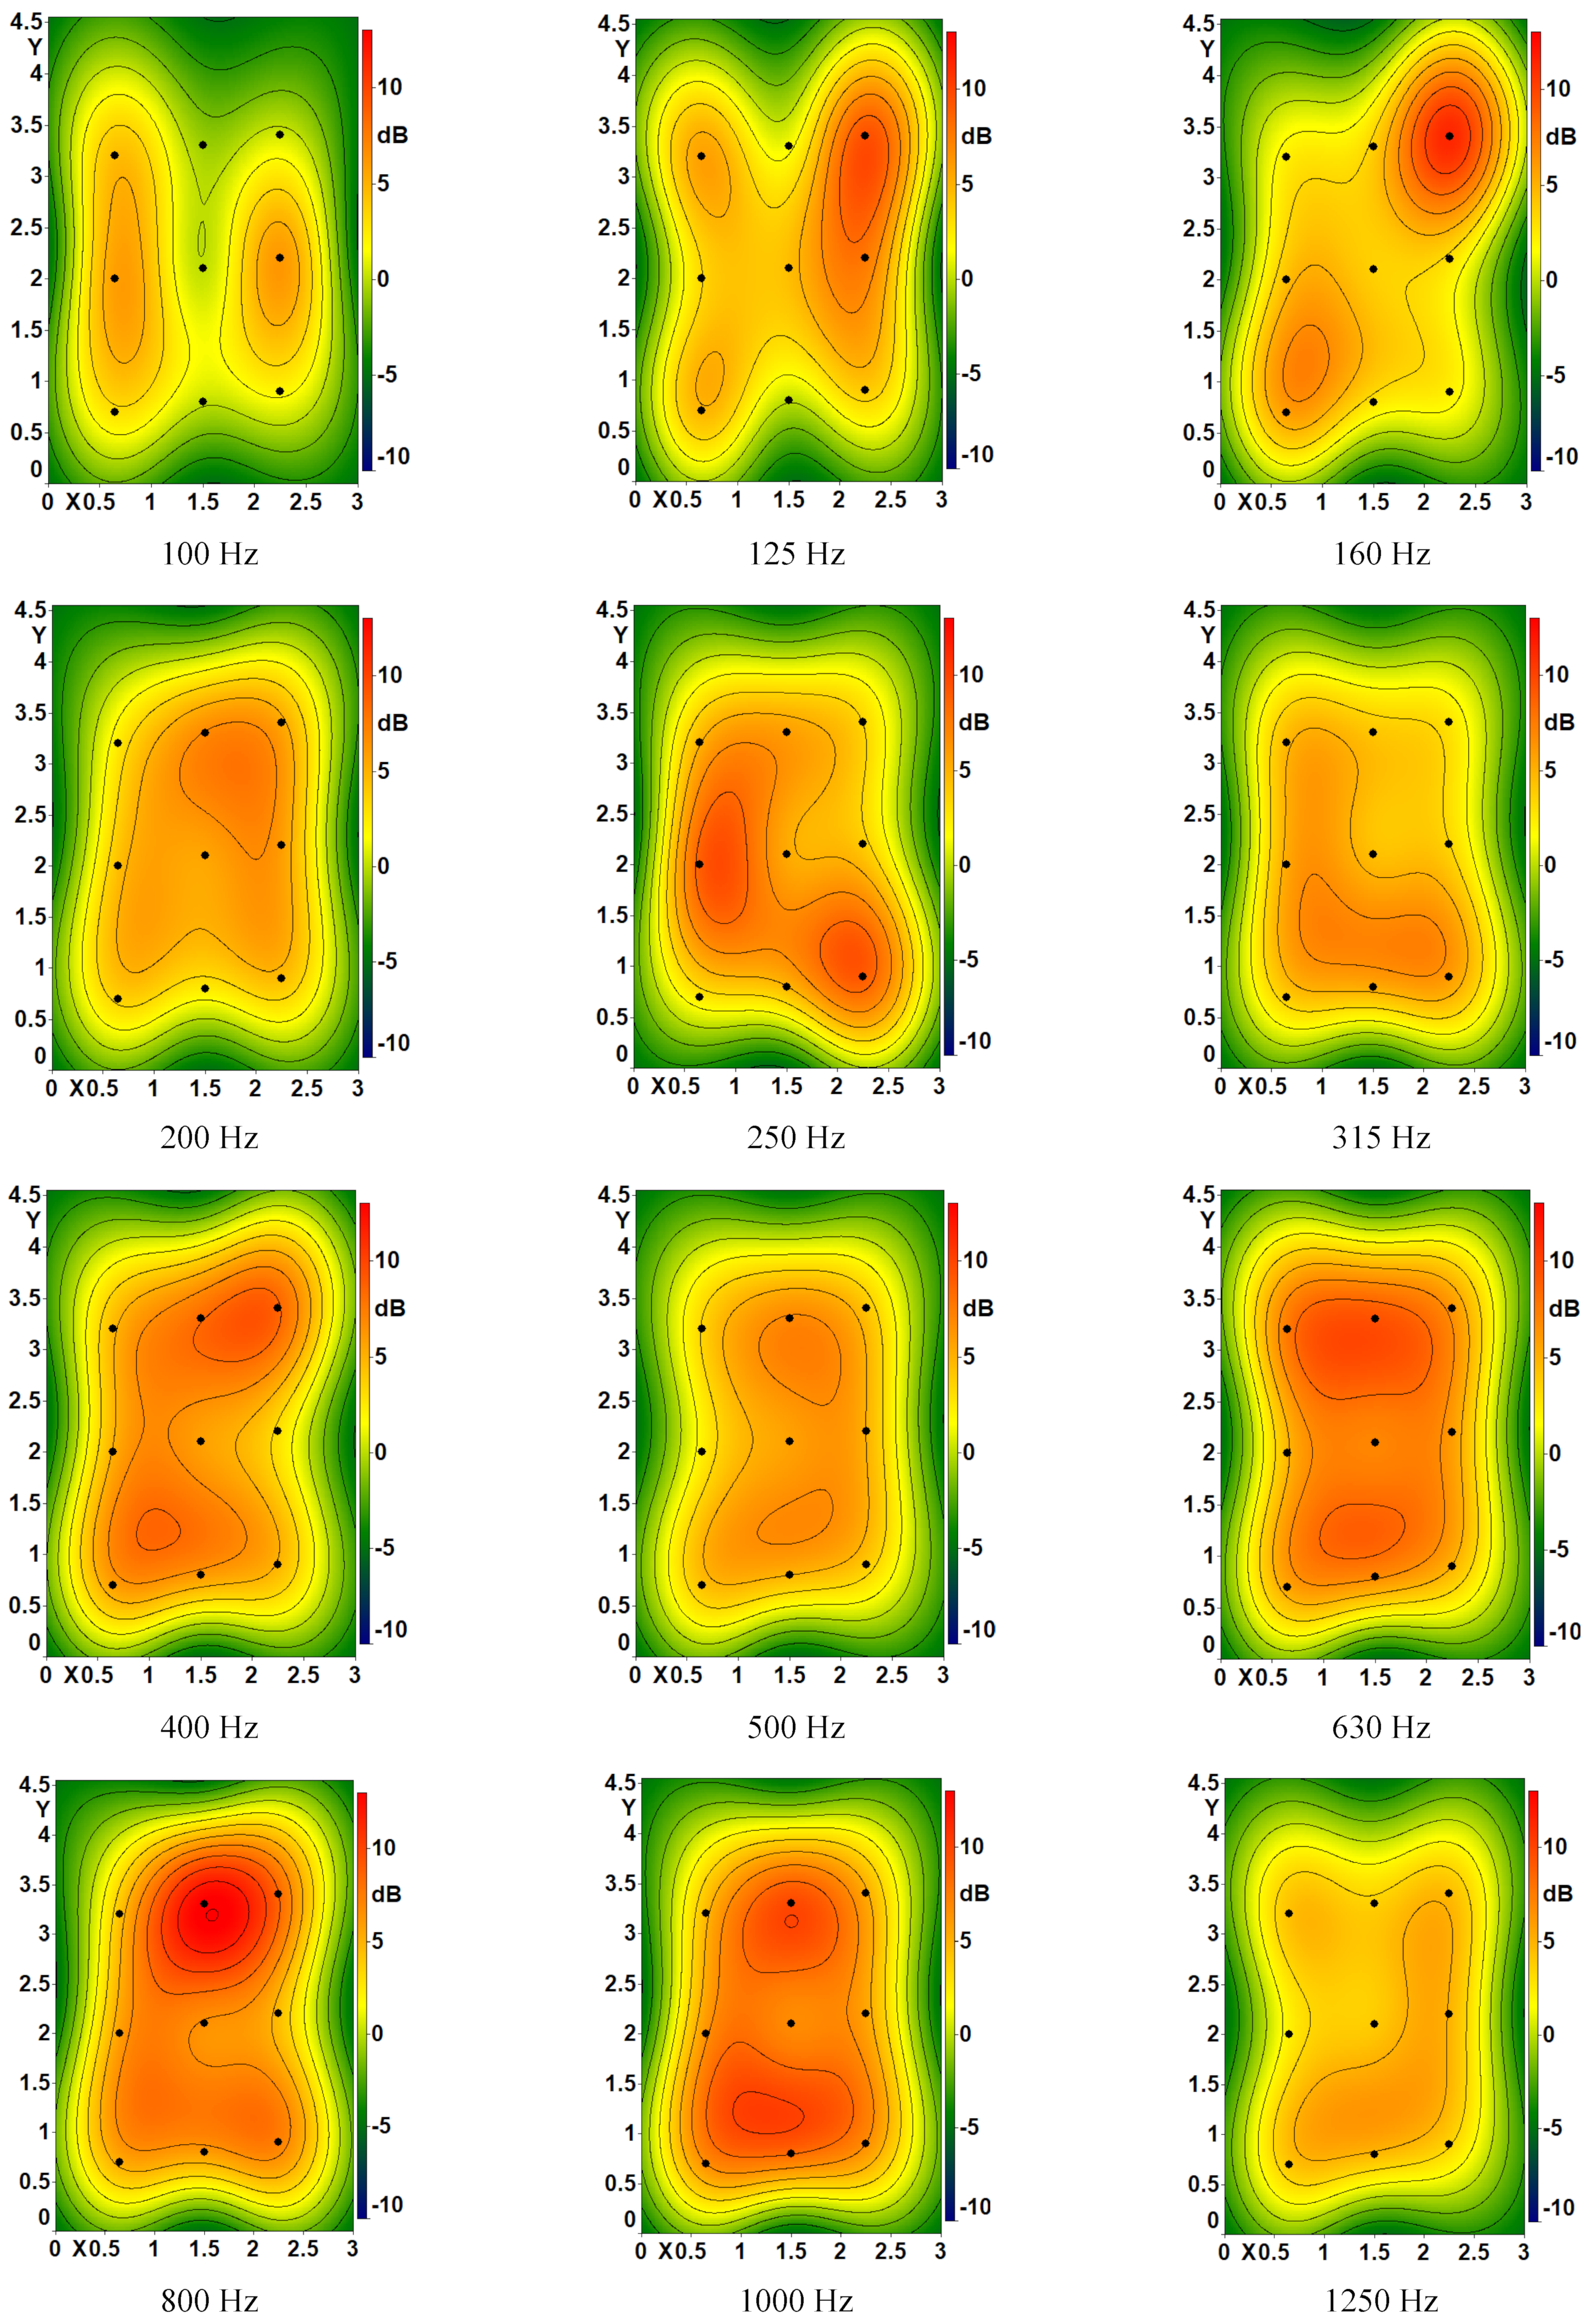
Appendix A.2. Airborne Noise Source Radiation Index Mapping

Figure A2. Air-borne source radiation index maps. Average between the three source positions.
Applsci 12 03233 g0a2aApplsci 12 03233 g0a2bApplsci 12 03233 g0a2c

Appendix A.3. Rubber Ball Radiation Efficiency Mapping

Figure A3. Rubber ball radiation index maps. Average between the three source positions.
Applsci 12 03233 g0a3aApplsci 12 03233 g0a3b

References

  1. Brandner, R.; Flatscher, G.; Ringhofer, A.; Schickhofer, G.; Thiel, A. Cross laminated timber (CLT): Overview and development. Eur. J. Wood Wood Prod. 2016, 74, 331–351. [Google Scholar] [CrossRef]
  2. Caniato, M.; Marzi, A.; da Silva, S.M.; Gasparella, A. A review of the thermal and acoustic properties of materials for timber building construction. J. Build. Eng. 2021, 43, 103066. [Google Scholar] [CrossRef]
  3. Caniato, M.; Cozzarini, L.; Schmid, C.; Gasparella, A. Acoustic and thermal characterization of a novel sustainable material incorporating recycled microplastic waste. Sustain. Mater. Technol. 2021, 28, e00274. [Google Scholar] [CrossRef]
  4. Brandner, R. Production and Technology of Cross Laminated Timber (CLT): A state-of-the-art Report. In Proceedings of the Focus Solid Timber Solutions-European Conference on Cross Laminated Timber (CLT), Graz, Austria, 21–22 May 2013; Volume 21, pp. 3–36. [Google Scholar]
  5. Öqvist, R.; Ljunggren, F.; Ågren, A. On the uncertainty of building acoustic measurements—Case study of a cross-laminated timber construction. Appl. Acoust. 2012, 73, 904–912. [Google Scholar] [CrossRef]
  6. Caniato, M.; Bettarello, F.; Ferluga, A.; Marsich, L.; Schmid, C.; Fausti, P. Thermal and acoustic performance expectations on timber buildings. Build. Acoust. 2017, 24, 219–237. [Google Scholar] [CrossRef]
  7. Caniato, M.; Bettarello, F.; Ferluga, A.; Marsich, L.; Schmid, C.; Fausti, P. Acoustic of lightweight timber buildings: A review. Renew. Sustain. Energy Rev. 2017, 80, 585–596. [Google Scholar] [CrossRef]
  8. Bettarello, F.; Caniato, M.; Scavuzzo, G.; Gasparella, A. Indoor Acoustic Requirements for Autism-Friendly Spaces. Appl. Sci. 2021, 11, 3942. [Google Scholar] [CrossRef]
  9. Hoeller, C.; Mahn, J.; Quirt, D.; Schoenwald, S.; Zeitler, B. Apparent sound insulation in cross-laminated timber buildings. J. Acoust. Soc. Am. 2017, 141, 3479. [Google Scholar] [CrossRef] [Green Version]
  10. Schoenwald, S.; Zeitler, B.; Sabourin, I.; King, F. Sound insulation performance of cross laminated timber building systems. In Proceedings of the INTER-NOISE and NOISE-CON Congress and Conference Proceedings, Innsbruck, Austria, 15–18 September 2013; Volume 247, pp. 4337–4346. [Google Scholar]
  11. Homb, A.; Guigou-Carter, C.; Rabold, A. Impact sound insulation of cross-laminated timber/massive wood floor constructions: Collection of laboratory measurements and result evaluation. Build. Acoust. 2017, 24, 35–52. [Google Scholar] [CrossRef]
  12. Zeitler, B.; Schoenwald, S.; Sabourin, I. Direct impact sound insulation of cross laminate timber floors with and without toppings. In Proceedings of the INTER-NOISE and NOISE-CON Congress and Conference Proceedings, Melbourne, Australia, 16–19 November 2014; Volume 249, pp. 5742–5747. [Google Scholar]
  13. Di Bella, A.; Granzotto, N.; Barbaresi, L. Analysis of acoustic behavior of bare CLT floors for the evaluation of impact sound insulation improvement. In Proceedings of the Meetings on Acoustics 22ICA, Buenos Aires, Argentina, 5–9 September 2016; Volume 28, p. 015016. [Google Scholar]
  14. Caniato, M.; Bettarello, F.; Fausti, P.; Ferluga, A.; Marsich, L.; Schmid, C. Impact sound of timber floors in sustainable buildings. Build. Environ. 2017, 120, 110–122. [Google Scholar] [CrossRef]
  15. Caniato, M.; Favretto, S.; Bettarello, F.; Schmid, C. Acoustic characterization of resonance wood. Acta Acust. United Acust. 2018, 104, 1030–1040. [Google Scholar] [CrossRef]
  16. Bettarello, F.; Gasparella, A.; Caniato, M. The Influence of Floor Layering on Airborne Sound Insulation and Impact Noise Reduction: A Study on Cross Laminated Timber (CLT) Structures. Appl. Sci. 2021, 11, 5938. [Google Scholar] [CrossRef]
  17. Barbaresi, L.; Morandi, F.; Garai, M.; Speranza, A. Experimental measurements of flanking transmission in CLT structures. In Proceedings of the Meetings on Acoustics 22ICA, Buenos Aires, Argentina, 5–9 September 2016; Volume 28, p. 015015. [Google Scholar]
  18. Zhang, X.; Hu, X.; Gong, H.; Zhang, J.; Lv, Z.; Hong, W. Experimental study on the impact sound insulation of cross laminated timber and timber-concrete composite floors. Appl. Acoust. 2020, 161, 107173. [Google Scholar] [CrossRef]
  19. Yang, Y.; Fenemore, C.; Kingan, M.J.; Mace, B.R. Analysis of the vibroacoustic characteristics of cross laminated timber panels using a wave and finite element method. J. Sound Vib. 2021, 494, 115842. [Google Scholar] [CrossRef]
  20. Kohrmann, M. Numerical Methods for the Vibro-Acoustic Assessment of Timber Floor Constructions; Technische Universität München: München, Germany, 2017. [Google Scholar]
  21. Jansson, L. Estimating Impact Noise through Cross Laminated Timber Floors Using the Transfer Matrix Method. In Proceedings of the INTER-NOISE 2021, Washington, DC, USA, 1–5 August 2021. [Google Scholar]
  22. ISO 12354-1:2017; Building Acoustics—Estimation of Acoustic Performance of Buildings from the Performance of Elements—Part 1: Airborne Sound Insulation between Rooms. International Organization for Standardization: Geneva, Switzerland, 2017.
  23. Caniato, M.; Schmid, C.; Gasparella, A. A comprehensive analysis of time influence on floating floors: Effects on acoustic performance and occupants’ comfort. Appl. Acoust. 2020, 166, 107339. [Google Scholar] [CrossRef]
  24. Atalla, N.; Nicolas, J. A new tool for predicting rapidly and rigorously the radiation efficiency of plate-like structures. J. Acoust. Soc. Am. 1994, 95, 3369–3378. [Google Scholar] [CrossRef]
  25. Nelisse, H.; Beslin, O.; Nicolas, J. A generalized approach for the acoustic radiation from a baffled or unbaffled plate with arbitrary boundary conditions, immersed in a light or heavy fluid. J. Sound Vib. 1998, 211, 207–225. [Google Scholar] [CrossRef]
  26. Foin, O.; Nicolas, J.; Atalla, N. An efficient tool for predicting the structural acoustic and vibration response of sandwich plates in light or heavy fluid. Appl. Acoust. 1999, 57, 213–242. [Google Scholar] [CrossRef]
  27. Hosseinkhani, A.; Younesian, D.; Krushynska, A.O.; Ranjbar, M.; Scarpa, F. Full-gradient optimization of the vibroacoustic performance of (non-) auxetic sandwich panels. Transp. Porous Media 2021, 1–18. [Google Scholar] [CrossRef]
  28. Hosseinkhani, A.; Younesian, D.; Ranjbar, M.; Scarpa, F. Enhancement of the vibro-acoustic performance of anti-tetra-chiral auxetic sandwich panels using topologically optimized local resonators. Appl. Acoust. 2021, 177, 107930. [Google Scholar] [CrossRef]
  29. Mejdi, A.; Atalla, N. Dynamic and acoustic response of bidirectionally stiffened plates with eccentric stiffeners subject to airborne and structure-borne excitations. J. Sound Vib. 2010, 329, 4422–4439. [Google Scholar] [CrossRef]
  30. Legault, J.; Mejdi, A.; Atalla, N. Vibro-acoustic response of orthogonally stiffened panels: The effects of finite dimensions. J. Sound Vib. 2011, 330, 5928–5948. [Google Scholar] [CrossRef]
  31. Rhazi, D.; Atalla, N. Transfer matrix modeling of the vibroacoustic response of multi-materials structures under mechanical excitation. J. Sound Vib. 2010, 329, 2532–2546. [Google Scholar] [CrossRef]
  32. Caniato, M.; Bettarello, F.; Bonfiglio, P.; Gasparella, A. Extensive investigation of multiphysics approaches in simulation of complex periodic structures. Appl. Acoust. 2020, 166, 107356. [Google Scholar] [CrossRef]
  33. Fortini, M.; Granzotto, N.; Piana, E.A. Vibro-acoustic characterization of a composite structure featuring an innovative phenolic foam core. Appl. Sci. 2019, 9, 1276. [Google Scholar] [CrossRef] [Green Version]
  34. Wang, P.; Lombaert, G.; Reynders, E. Numerical prediction and experimental validation of impact sound radiation by timber joist floors. Appl. Acoust. 2020, 162, 107182. [Google Scholar] [CrossRef]
  35. Conta, S.; Homb, A. Sound radiation of hollow box timber floors under impact excitation: An experimental parameter study. Appl. Acoust. 2020, 161, 107190. [Google Scholar] [CrossRef]
  36. Coguenanff, C.; Guigou-Carter, C. Multi-Criteria Optimization of a Wood-Based Floor. In Proceedings of the 24th International Congress on Sound and Vibration, ICSV24, London, UK, 23–27 July 2017. [Google Scholar]
  37. Guigou-Carter, C.; Coguenanff, C. Prediction of the acoustic performance of lightweight wood-based floor. In Proceedings of the INTER-NOISE and NOISE-CON Congress and Conference Proceedings, Ottawa, ON, Canada, 23–26 August 2009. [Google Scholar]
  38. Coguenanff, C.; Guigou-Carter, C.; Späh, M. Lightweight Floor: Step by Step Comparisons between Measured and Simulated Quantities. In Proceedings of the 24th International Congress on Sound and Vibration, ICSV24, London, UK, 23–27 July 2017. [Google Scholar]
  39. Hiramitsu, A.; Tomita, R.; Susumu, H.; Sato, M. Floor Impact Sound Insulation of the Six-Story Wood-Frame Model Building. In Proceedings of the 23rd International Congress on Acoustics, Aachen, Germany, 9–13 September 2019; pp. 5007–5012. [Google Scholar]
  40. Hiramitsu, A.; Tsuchimoto, T.; Kurumada, S. Floor impact sound insulation and airborne sound insulation on CLT model building. In Proceedings of the INTER-NOISE and NOISE-CON Congress and Conference Proceedings, Chicago, IL, USA, 26–29 August 2018; pp. 5014–5022. [Google Scholar]
  41. Van Damme, B.; Schoenwald, S.; Blanco, M.A.; Zemp, A. Limitations to the use of homogenized material parameters of cross laminated timber plates for vibration and sound transmission modelling. In Proceedings of the 22nd International Congress on Sound and Vibration, Florence, Italy, 12–16 July 2015; pp. 12–16. [Google Scholar]
  42. Jayalath, A.; Navaratnam, S.; Gunawardena, T.; Mendis, P.; Aye, L. Airborne and impact sound performance of modern lightweight timber buildings in the Australian construction industry. Case Stud. Constr. Mater. 2021, 15, e00632. [Google Scholar] [CrossRef]
  43. Caniato, M.; Gasparella, A.; Bettarello, F.; Santoni, A.; Fausti, P.; Granzotto, N.; Bécot, F.-X.; Chevillotte, F.; Jaouen, L.; Borello, G.; et al. A reliability study concerning the acoustic simulations of timber elements for buildings. Constr. Build. Mater. 2021, 315, 125765. [Google Scholar] [CrossRef]
  44. ISO 10140-1:2021; Acoustics—Laboratory Measurement of Sound Insulation of Building Elements Application Rules for Specific Products. International Organization for Standardization: Geneva, Switzerland, 2021.
  45. ISO 10140-2:2021; Acoustics—Laboratory Measurement of Sound Insulation of Building Elements Measurement of Airborne Sound Insulation. International Organization for Standardization: Geneva, Switzerland, 2021.
  46. ISO 10140-3:2021; Acoustics—Laboratory Measurement of Sound Insulation of Building Elements—Part 3: Measurement of Impact Sound Insulation. International Organization for Standardization: Geneva, Switzerland, 2021.
  47. ISO 10140-4:2021; Acoustics—Laboratory Measurement of Sound Insulation of Building Elements—Part 4: Measurement Procedures and Requirements. International Organization for Standardization: Geneva, Switzerland, 2021.
  48. ISO 10140-5:2021; Acoustics—Laboratory Measurement of Sound Insulation of Building Elements—Part 5: Requirements for Test Facilities and Equipment. International Organization for Standardization: Geneva, Switzerland, 2021.
  49. Caniato, M.; Bettarello, F.; Gasparella, A. Indoor and outdoor noise changes due to the COVID-19 lockdown and their effects on individuals’ expectations and preferences. Sci. Rep. 2021, 11, 16533. [Google Scholar] [CrossRef]
  50. Robinson, M.; Hopkins, C. Prediction of maximum fast time-weighted sound pressure levels due to transient excitation from the rubber ball and human footsteps. Build. Environ. 2015, 94, 810–820. [Google Scholar] [CrossRef]
  51. Caniato, M. Sound insulation of complex façades: A complete study combining different numerical approaches. Appl. Acoust. 2020, 169, 107484. [Google Scholar] [CrossRef]
  52. Jeon, J.Y.; Lee, P.J.; Sato, S. Use of the standard rubber ball as an impact source with heavyweight concrete floors. J. Acoust. Soc. Am. 2009, 126, 167–178. [Google Scholar] [CrossRef]
  53. Ryu, J.; Song, H.; Kim, Y. Effect of the suspended ceiling with low-frequency resonant panel absorber on heavyweight floor impact sound in the building. Build. Environ. 2018, 139, 1–7. [Google Scholar] [CrossRef]
  54. Shin, H.; Kim, K. Sound absorbing ceiling to reduce heavy weight floor impact sound. Build. Environ. 2020, 180, 107058. [Google Scholar] [CrossRef]
  55. Sato, H.; Yoshimura, J. Classification scheme of floor impact sounds with the standard rubber ball in dwellings. In Proceedings of the INTER-NOISE and NOISE-CON Congress and Conference Proceedings, Melbourne, VIC, Australia, 16–19 November 2014; Volume 249, pp. 6166–6172. [Google Scholar]
  56. Shen, X.; Hopkins, C. Prediction of Maximum Fast Time-Weighted Velocity Levels from a Rubber Ball Impact on a Timber Floor. In Proceedings of the Forum Acusticum, Lyon, France, 7–11 December 2020. [Google Scholar]
  57. Olsson, J.; Linderholt, A. Measurements of low frequency impact sound frequency response functions and vibrational properties of light weight timber floors utilizing the ISO rubber ball. Appl. Acoust. 2020, 166, 107313. [Google Scholar] [CrossRef]
  58. Jeong, J.H.; Kim, Y.H.; Ryu, J.K.; Kim, K.H. Just noticeable difference of rubber ball impact sound. In Proceedings of the Baltic-Nordic Acoustic Meeting, Reykjavík, Iceland, 15–18 April 2018. [Google Scholar]
  59. EN, B. 338 (2016). Available online: https://standards.iteh.ai/catalog/standards/cen/492c108d-268a-4cbd-9b59-3f31792887c5/en-338-2016 (accessed on 22 December 2021).
  60. Vér, I.L. Impact noise isolation of composite floors. J. Acoust. Soc. Am. 1971, 50, 1043–1050. [Google Scholar] [CrossRef]
  61. 61. ISO 717-2:2020; Acoustics—Rating of Sound Insulation in Buildings and of Building Elements—Part 2: Impact Sound Insulation. International Organization for Standardization: Geneva, Switzerland, 2021.
  62. ISO 717-1:2020; Acoustics—Rating of Sound Insulation in Buildings and of Building Elements—Part 1: Airborne Sound Insulation. International Organization for Standardization: Geneva, Switzerland, 2021.
  63. ISO 10848-1:2017; Acoustics—Laboratory and Field Measurement of Flanking Transmission for Airborne, Impact and Building Service Equipment Sound between Adjoining Rooms Frame Document. International Organization for Standardization: Geneva, Switzerland, 2017.
  64. Kristensen, J.; Rindel, J.H. Bygningsakustik: Teori og Praksis; Statens Byggeforskningsinstitut (SBI): Aalborg, Denmark, 1989. [Google Scholar]
  65. Sewell, E.C. Transmission of reverberant sound through a single-leaf partition surrounded by an infinite rigid baffle. J. Sound Vib. 1970, 12, 21–32. [Google Scholar] [CrossRef]
  66. Patrício, J.; da Silva, P.M.; da Piedade, A.C. The Influence of Concrete Elastic Characteristics on the Impact Noise Insulation of Concrete Floors. Build. Acoust. 1997, 4, 259–274. [Google Scholar] [CrossRef]
  67. Heckl, M.; Rathe, E.J. Relationship between the Transmission Loss and the Impact-Noise Isolation of Floor Structures. J. Acoust. Soc. Am. 1963, 35, 1825–1830. [Google Scholar] [CrossRef]
  68. Bettarello, F.; Fausti, P.; Baccan, V.; Caniato, M. Impact Sound Pressure Level Performances of Basic Beam Floor Structures. Build. Acoust. 2010, 17, 305–316. [Google Scholar] [CrossRef]
  69. Jeong, J.H.; Park, J.O. Repeatability Evaluation of Rubber Ball Impact Sound in a Reverberation Chamber. In Proceedings of the INTER-NOISE and NOISE-CON Congress and Conference Proceedings, Madrid, Spain, 16–19 June 2019. [Google Scholar]
  70. Fahy, F.J.; Gardonio, P. Sound and Structural Vibration: Radiation, Transmission and Response; Academic Press: Oxford, UK, 2006. [Google Scholar]
  71. ISO 12354-2:2017; Building Acoustics—Estimation of Acoustic Performance of Buildings from the Performance of Elements Impact Sound Insulation between Rooms. International Organization for Standardization: Geneva, Switzerland, 2017.
Figure 1. Laboratory receiving room and CLT floor.
Applsci 12 03233 g001
Figure 2. Wood fiber direction. Longer dimension (4155 mm) with 2 resistant layers (a). Shorter dimension (3000 m) with 3 resistant layers (b).
Applsci 12 03233 g002
Figure 3. Airborne noise source (a), tapping machine (b) and rubber ball (c).
Applsci 12 03233 g003
Figure 4. CLT floor and sources positions (a); microphone positions in the transmitting room (b) and in the receiving room (c).
Applsci 12 03233 g004
Figure 5. General scheme of the positioning of the sound sources (a) and the accelerometer (b) for the determination of the velocity levels.
Applsci 12 03233 g005
Figure 6. Comparison of LF_max (1/3 oct), LF (1/1 octave), LF (1/3 octave), LF_max-LF (1/3 oct).
Applsci 12 03233 g006
Figure 7. Normalized impact sound pressure level (a), sound reduction index (b), rubber ball impact sound pressure level (c) for the 200 mm CLT floor.
Applsci 12 03233 g007
Figure 8. Normalized impact sound pressure level for CLT floor (200 mm) and for concrete floor (140 mm).
Applsci 12 03233 g008
Figure 9. Standard deviation of the sound pressure levels of the three sources, measured in the receiving room.
Applsci 12 03233 g009
Figure 10. Measurements of sound reduction index for the 200 mm CLT floor and comparison with proposed mass law and R = 20lg(mf) − 47.
Applsci 12 03233 g010
Figure 11. Comparison of measurement and simulation with two different commercial software.
Applsci 12 03233 g011
Figure 12. Measurements of normalized impact sound pressure level for the 200 mm CLT floor, comparison with R +   L n = 38 + 30lg(f) equation.
Applsci 12 03233 g012
Figure 13. Measurements of velocity level: tapping machine (50–5000 Hz), dodecahedron (50–5000 Hz) and rubber ball (50–630 Hz).
Applsci 12 03233 g013
Figure 14. Measurements of radiation index: tapping machine (50–5000 Hz), dodecahedron (50–5000 Hz) and rubber ball (50–630 Hz).
Applsci 12 03233 g014
Figure 15. 9 points receiving measurement radiation indices and average respectively of: tapping machine (a), dodecahedron (b), rubber ball (c).
Applsci 12 03233 g015
Figure 16. Simulated normalized sound reduction index (Equation (7)) and energy average maximum impact sound pressure level (Equation (9)).
Applsci 12 03233 g016
Figure 17. Measured and predicted normalized impact sound pressure level.
Applsci 12 03233 g017
Figure 18. Measured and predicted sound reduction index.
Applsci 12 03233 g018
Figure 19. Measured and predicted energy average maximum impact sound pressure level with rubber ball.
Applsci 12 03233 g019
Table 1. Mechanical properties of the CLT under consideration.
Em,0,meanEm,90,meanρmeanm
11 kN/mm20.37 kN/mm2420 kg/m384 kg/m2
Table 2. Impact force exposure level in each octave band of the rubber ball.
1/1 Oct. Band Freq. [Hz]31.563125250500
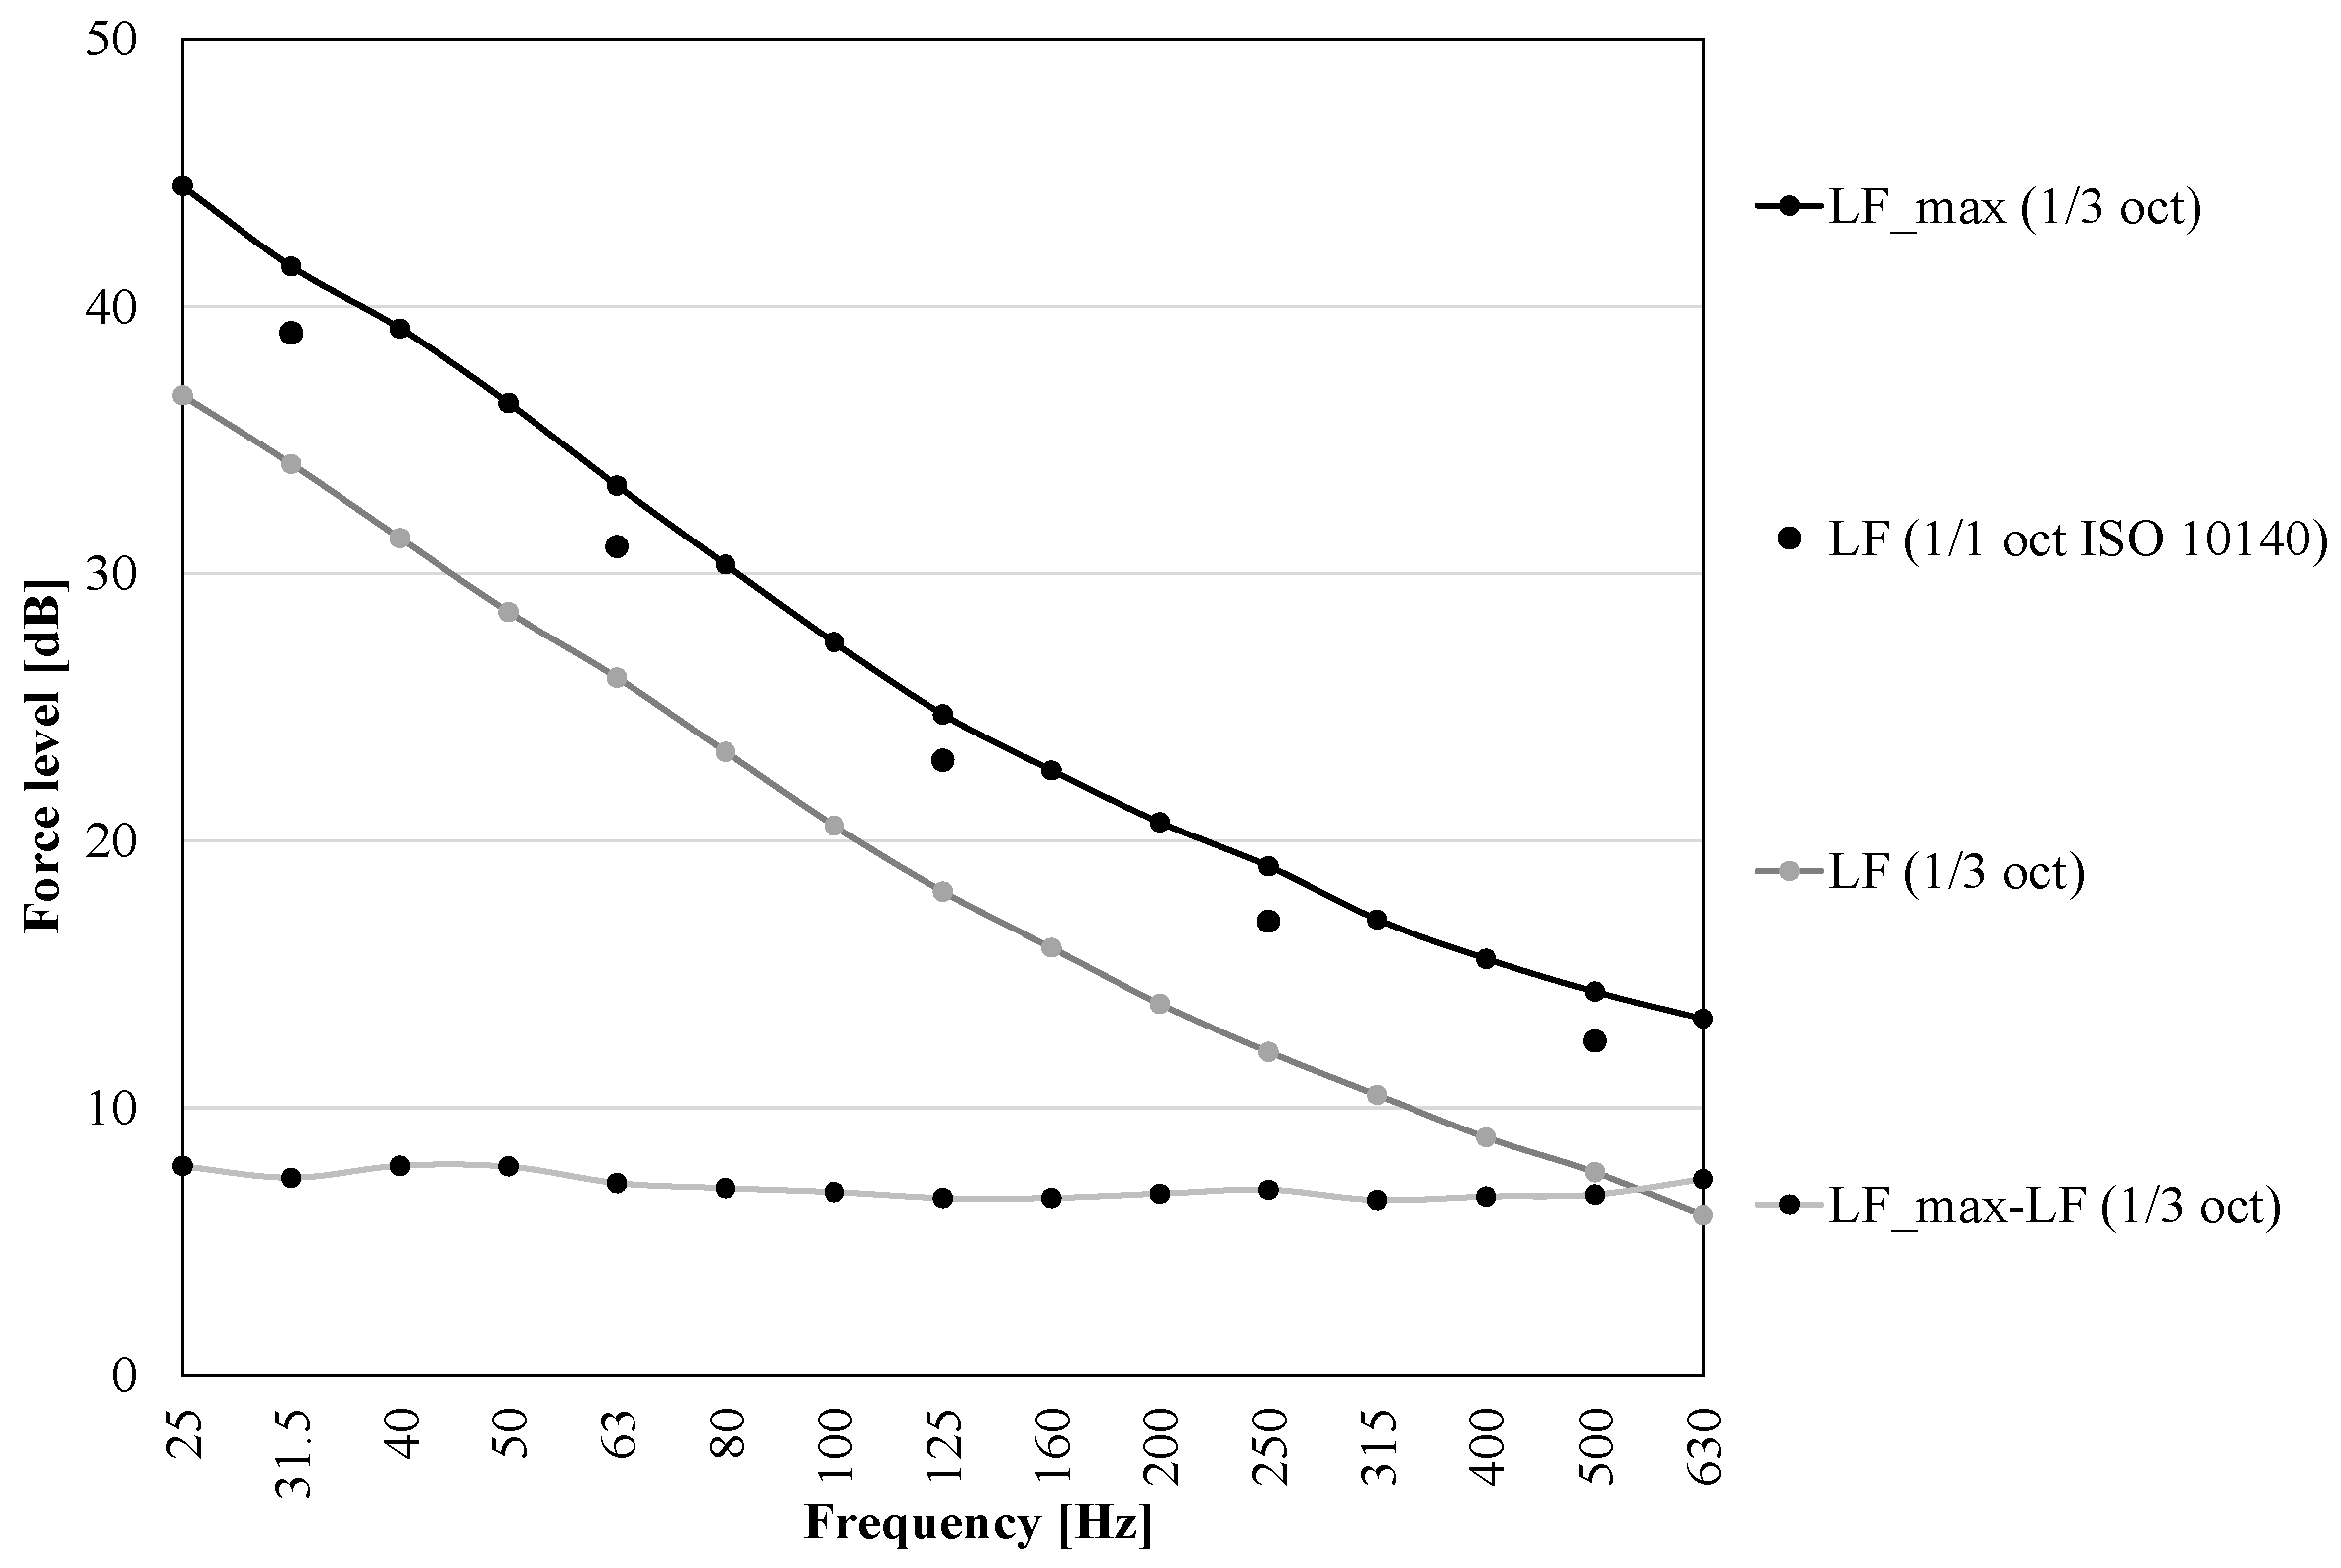
Impact force
exposure level
[dB re 1 N]
39.0 ± 1.031.0 ± 1.523.0 ± 1.517.0 ± 2.012.5 ± 2.0
Table 3. Weighted normalized impact sound pressure level, Ln,w, weighted sound reduction index, R w , and A-weighted energy average maximum impact sound pressure level measured with rubber ball according to the standard, LiA,Fmax.
Ln,w [dB]Rw [dB]LiA,Fmax [dB(A)]
883580
Table 4. Weighted normalized impact sound pressure level, L n , w .
Ln,w_meas [dB]Ln,w_ref. curve [dB]Ln,w_Lv [dB]Ln,w_12354-2 [dB]Ln,w_pr [dB]
8886899088
Table 5. Weighted sound reduction indices, R w ( C ; C tr ).
Rw [dB]Rw_ref. Curve [dB]Rw_Lv [dB]Rw_12354-1 [dB]Rw_pr [dB]
35(0; −3)39(−1; −4)35(0; −3)32(−1; −4)35(0; −3)
Table 6. Weighted sound pressure levels.
LiA,Fmax_meas
[dB(A)]
LiA,Fmax_Lv
[dB(A)]
LiA,Fmax_12354-2
[dB(A)]
LiA,Fmax_pr
[dB(A)]
80788180
Publisher’s Note: MDPI stays neutral with regard to jurisdictional claims in published maps and institutional affiliations.

