Article

Technology Prediction for Acquiring a Must-Have Mobile Device for Military Communication Infrastructure

1
Defense Institute of SeoulTech, Seoul National University of Science and Technology, Seoul 01811, Korea
2
Navy Headquarters, Sindoan-myeon, Gyeryong-si 32800, Korea
3
Defense Science Department, Korea National Defense University, Nonsan-si 33021, Korea
*
Author to whom correspondence should be addressed.
Appl. Sci. 2022, 12(6), 3207; https://doi.org/10.3390/app12063207
Submission received: 11 February 2022 / Revised: 8 March 2022 / Accepted: 10 March 2022 / Published: 21 March 2022
(This article belongs to the Special Issue Innovative Protection Facility and CBRNE Effects)

Abstract

:
The smartphone is a must-have mobile device for the military forces to accomplish critical missions and protect critical infrastructures. This paper explores the applicability of a technology prediction methodology to manage technological obsolescence while pursuing the acquisition of advanced commercial technology for military use. It reviews the Technology Forecasting using Data Envelopment Analysis (TFDEA) methodology and applies an author-written Stata program for smartphone technology forecasting using TFDEA. We analyzed smartphone launch data from 2005 to 2020 to predict the adoption of smartphone technology and discuss the pace of technological change. The study identifies that the market is undergoing reorganization as new smartphone models expand the market and increase their technical performance. The average rate of technological change, the efficiency change, and the technology change were 1.079, 1.004, and 1.011 each, respectively, which means that the technology progressed over the period. When dividing before and after 2017, technological change and efficiency change generally regressed except for Huawei, Xiaomi, and Oppo. This means that Chinese smartphones are expanding the global market in all directions and the technology is reaching maturity and market competition is accelerating.

1. Introduction

Smartphones have been widely distributed around the world since 2010 and are being applied not only in the private sector but also in military applications. As Samsung Electronics unveiled in 2020, the tactical mobile solution ‘Galaxy S20 Tactical Edition (TE)’ was jointly developed with the US federal government and the Ministry of Defense [1]. The Republic of Korea (ROK) military also saw its applicability as a military tactical operation, and as a first step, introduced commercial smartphones to the military for general administrative work. In the military, the difference between the life cycle of weapon systems hardware and the life cycle of software is significant and the rate of obsolescence of software with rapid technological progress is relatively fast, so component obsolescence management is essential [2,3,4]. Efforts such as technology prediction for component obsolescence management are required to procure commercial smartphones for military tactical application. In Korea, in 1999, the dual-use technology development project was legislated and promoted, with the main tasks being defense technology transfer, civil-military standard unification, and technology information exchange [3,4]. Additionally, there were various studies and policy considerations that the concept of open technological innovation should be applied for defense science and technology innovation [5,6,7]. In 2014, the Institute of Civil-Military Technology Cooperation was established for civil-military technology development and cooperation [8]. As smartphones become widely used militarily, it becomes important to acquire devices that can counter potential threats. In order to use a smartphone with commercial technology for military purposes, it is necessary to select an alternative that can meet the military needs and target level.
In terms of national security, new technologies are both a challenging threat to the protection of national key infrastructure and an important asset. The US Patriot Act of 2001 and Cybersecurity and Infrastructure Security Agency (CISA) states that “Critical infrastructure includes the assets, systems, facilities, networks, and other elements that society relies upon to maintain national security, economic vitality, and public health and safety. Additionally, there are four designated lifeline functions—transportation, water, energy, and communications, which means that their reliable operations are so critical that a disruption or loss of one of these functions will directly affect the security and resilience of critical infrastructure within and across numerous sectors. For example, energy stakeholders provide essential power and fuels to stakeholders in the communication, transportation, and water sectors, and, in return, the energy sector relies on them for fuel delivery (transportation), electricity generation (water for production and cooling), as well as control and operation of infrastructure (communication)” [9]. ROK also manages national critical infrastructures that are closely related to national operation and people’s lives by ministries, and the communication infrastructure is considered as the critical infrastructure [10].
The development of smartphone technology has continued over the past 30 years, and about half of the world’s population uses a smartphone in June 2021 [11]. Smartphones have rapidly spread since they were introduced to the world in the early 1990s and have become an essential tool in daily life, and there have been epochal changes in shape and performance. In addition, the foldable smartphone and 5G communication expected in the past have become a reality.
Technological advances are good news for consumers, but companies that make products need a competitive strategy to survive. Technology-based companies need a strategy to develop core technology through technology prediction to respond to rapid technological change. Technology forecasting is a structured discipline which started by the United States Department of Defense and the RAND Corporation in the 1950s and was closely associated with military affairs [12]. Technological prediction began in the 1950s as a military competition between the United States and the Soviet Union. After World War II, while promoting national development through scientific and technological innovation, technology prediction played an important role in establishing R & D priorities and development strategies for the development of new weapons in the military field as well. However, over the last 70 years, many technology forecasting methods have been developed and used by governments, companies, and other organizations to ease the uncertainty of the future.
Countries around the world, including the Korean military, are paying attention to new technologies that will lead to the fourth industrial revolution in military capability building. The Korean Agency for Defense Development (ADD) chose 57 technologies that correspond to the core fields of the fourth industrial revolution, such as robots, new materials, internet of things, artificial intelligence, synthetic biology, and smart medical care, in a booklet titled “Patented Defense Technology to Lead the Fourth Industrial Revolution”. In 2021, the Ministry of National Defense and the Ministry of Science and ICT decided to establish a defense Information and Communications Technology (ICT) support group and prepared a Digital New Deal/Smart Defense Innovation Workshop to explore a role for smart defense innovation at the academic level. From July 2020, South Korean soldiers were allowed to use smartphones during after-work hours. With the development of IT technology, smartphones are now becoming the unparalleled comrades of soldiers in the military base.
Defense Acquisition Program Administrations (DAPA), which is responsible for acquiring Korea’s weapon systems, has signed a contract with Samsung Electronics for the rapid trial acquisition of a commercial smartphone-based small unit combat command system in 2020 in order to quickly apply innovative technologies in the civil sector that will change the future battlefield to the defense sector [13]. The ‘Commercial Smartphone-based Small Unit Combat Command System’ is a personal combat device that integrates Samsung Electronics’ Galaxy S20 military tactical version and radio. It communicates with real-time encrypted data and voice through the module. It also features a night vision mode to ensure operational security and combatant survivability (night displayed adjustment), stealth mode (communication interruption), and intelligence capture mode (night video capture and sharing) functions.
Considering the trend of rapid technological development in the era of the fourth industrial revolution, it is necessary to quickly apply and utilize advanced technologies in the civilian field to the military for efficient defense acquisition. Through the Rapid Demonstration Acquisition Project (RDAP), the DAPA purchases privately developed products to which the fourth industrial revolution-based technology is applied; the military conducts a pilot operation to confirm military utility, and the results are fed back to the private sector. In addition, products whose military utility has been confirmed are promoted through an official acquisition program such as additional mass production according to military requirements. The RDAP is a new system for rapidly acquiring weapon systems in line with the speed of technological development of the fourth industrial revolution and was first introduced in the defense sector in 2020 led by the DAPA. Smartphones are a representative product that integrates the core technologies of this era and can be used for both dual-use purposes, civilian and national defense. This study is about a technology prediction methodology that can be used for technology prediction, which is the main activity of defense technology planning. Considering that technological superiority is an important factor that can determine victory or defeat due to the competitive nature of the military, the technology prediction methodology was selected, and its applicability was examined for smartphones, which are representative products of dual use.
Despite the merits of the acquisition program that applies the superior technology of the private sector to the military, it is necessary to solve the problems of the obsolescence of products and parts by private companies and technological obsolescence [2,3,4]. The Korean Ministry of National Defense (MND) must follow the reinforced parts obsolescence management task for newly promoted projects in accordance with “the Parts Obsolescence Management Work Order” implemented in 2019. In Article 5 of the Order, the basic principle of component obsolescence management manages component obsolescence throughout the entire life cycle of a weapon system, and emphasizing the need to focus on management, it is specified to minimize the impact on the acquisition, operation, and logistics support of weapon systems by predicting parts obsolescence problems in advance and establishing alternatives [14]. Against this background, it is necessary to analyze technology obsolescence and component discontinuation through application of technology prediction methodology before applying civilian advanced technology to the military. The purpose of this study is to confirm the significance of the application of technology prediction methodology to high-tech private sector and to draw implications from the analysis of technological development and obsolescence. The case of smartphones withdrawn from the market offers implications for what to consider when predicting disruptive technologies. The R-based TFDEA program is provided by Shott and Lim [15], and in this paper, the author-written Stata programs dea.ado and malmq.ado are additionally provided [16,17] (Supplementary materials). Additionally, it tries to give some implications on defense technology obsolescence management when we procure the advanced technology from the civilian side.
In Section 2, we briefly explain the concept and procedure of the TFDEA and Malmquist Productivity Index using DEA. Section 3 shows empirical examples using smartphone data, and Section 4 suggests a conclusion.

2. Technology Forecasting Methodology

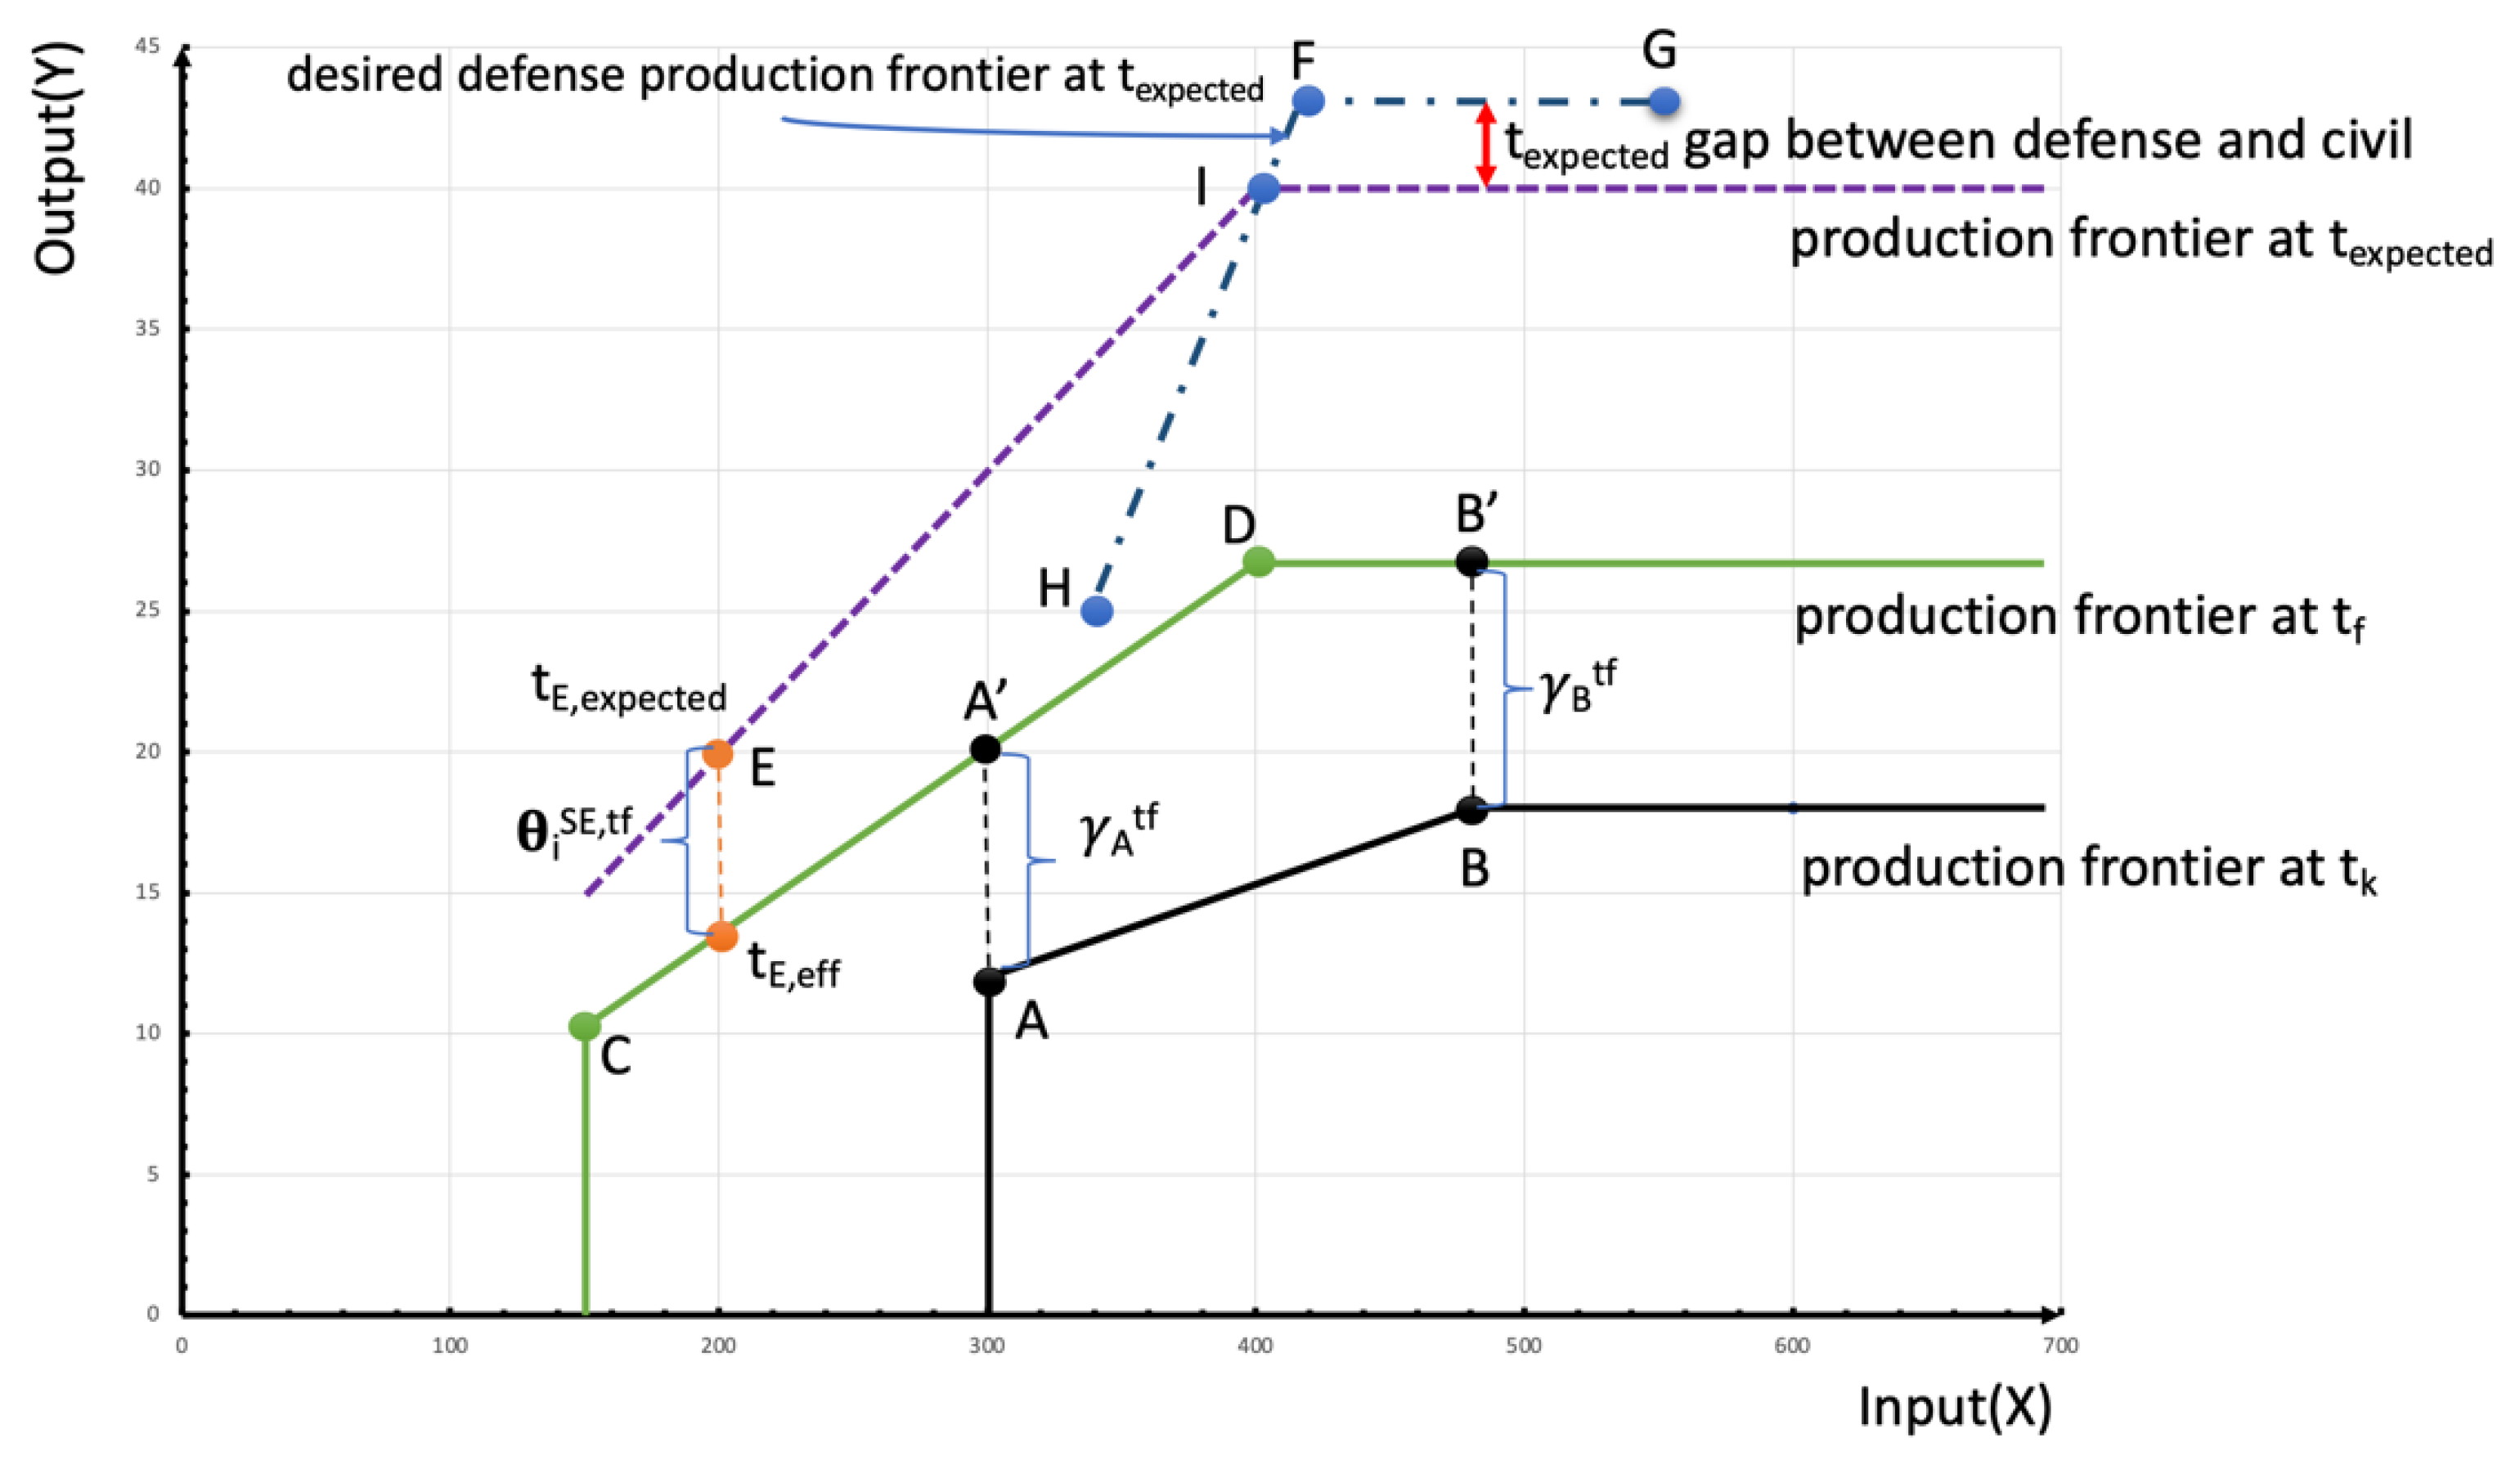
2.1. Concepts of Technology Forecast

Technological forecasting is premised on a certain orderliness of the innovation process [18]. Technological forecasting is the study of new trends, technologies, or new forces that arise due to policies, social changes, or scientific inventions. Martino [19] defines it as: “A prediction of the future characteristics of useful machines, procedures or techniques”. The classification of technology forecasting methods varies according to experts. According to Cho and Daim [20], technology forecasting methods could be traditionally categorized into three groups: exploratory, normative, and combined (normative/experimental) methods. Exploratory methods try to predict future technological state of the art (SOA) from the present by extrapolating past technological trends. Trend extrapolation, Growth Curve, Bibliometrics, and Cross impact analysis are kinds of experimental methods. Normative methods set up a possible future that ought to be or needs to be, then suggest a strategy to achieve this future. Morphological analysis, Relevance tree, Analytic Hierarchy Process (AHP), and Backcasting are normative methods. Combined (normative/exploratory) methods use two different methods, normative and experimental, in forecasting. Delphi, Scenario Planning, Trend impact analysis, and Technology roadmapping could be categorized as these methods. Anderson et al. [21] introduced a new exploratory forecasting methodology, Technology Forecasting using Data Envelopment Analysis (TFDEA), at the PICMET 01 Conference for assessing the change of database market.
TFDEA extends the traditional Data Envelopment Analysis (DEA) for technology forecasting, so it has inherited DEA’s nonparametric and non-statistic characteristics. Technological SOA frontiers are estimated using DEA and measuring the rate of change (ROC) by observing the evolution of SOA frontiers. After being introduced in 2001, TFDEA has been used in a variety of sectors including jet fighter aircraft, wireless communications, microprocessors, hybrid electric vehicles (HEV), Research and Development (R & D) target-setting, etc. [21,22,23,24,25,26,27,28,29]. The TFDEA methodology can be said to be a technology prediction centered on SOA technology in that it predicts future technology by considering the degree of change in the technology frontier. TFDEA provides better forecasting results than regression when forecasting technological SOA because it chooses SOA based observation and predicts future SOA according to ROC [21,22,23,24,25,26,27,28,29]. Because TFDEA is modeled based on DEA, it retains the strengths and limitations of DEA’s methodology. There is another reason to consider TFDEA as a research methodology because it has the advantage of being able to make technology predictions for multiple inputs and multiple outputs that regression models cannot handle. Smartphone technology, the subject of this study, had characteristics such as enlarged screen size, increased battery capacity, applied next-generation data communication, sensors, applied advanced camera technology, and expanded applications. On the other hand, discussions about the prospect of sixth generation communication technology applicable to smartphones, expansion of IoT technology, and application of artificial intelligence technology are revealing the limitations of predicting future smartphone technology due to technological changes in the past. In addition, the equipment required to achieve a strategic advantage militarily in the new battlefield environment in the future requires a new technology that is different from the past. Therefore, despite the advantages of TFDEA as a technology prediction methodology, an approach to supplement the limitations of TFDEA classified as an exploratory methodology is needed.
It was first developed for military use, such as the Internet, GPS, computers for decryption, microwave ovens, and drones that we use in our daily life, but it is a case that has spread to the public. On the other hand, considering that civil-military compatibility is great at the stage of low technological maturity, there is an investment efficiency of applying technologies led by the private sector, such as commercial satellite communication technology, for military use. Therefore, predicting technologies with great military applicability starts with identifying promising technologies that can grow into necessary technologies. However, if the dependence on the general market grows, it is necessary to be able to receive the military-necessary products continuously and stably, and this needs to be considered. In addition, the competition for technological hegemony between the United States and China is accelerating in fields such as semiconductors, 5G, quantum computing, and artificial intelligence. Therefore, to adopt commercial technology that can be used for military purposes, it is necessary to understand the growth of companies that develop products.
The technology prediction approach proposed in this study to develop military products based on commercial technology is as follows. First, as an exploratory study, TFDEA is used to measure the rate of technological change. Then, a candidate product that can satisfy the performance of the product to be launched at the time of the military target is selected. Finally, it is to prepare basic data for product selection decision-making by analyzing the growth trend of companies that produce products.
The TFDEA technique applied to measure the rate of technological change is introduced in Section 2.2 and Section 2.3. Figure 1 shows the approach in this study to select future commercial equipment that can meet the performance level of smartphones required for military purposes through technology prediction. It can be used for basic analysis to select an alternative that can satisfy military needs among products from A to E. The Malmquist index was used for the analysis of productivity, which is the core of the growth potential of a company that develops products, and the introduction of the methodology is described in Section 2.4.

2.2. Measuring Technological SOA Frontiers Using DEA

Farrell [30] suggests measuring efficiency using linear programming. He estimates the efficient point of each observed enterprise based on the production function. Additionally, he suggests measuring the relative efficiency of each enterprise according to the isoquants of efficient points using fraction programming. In 1978, Charnes, Cooper, and Rhodes (CCR) [31] introduced Data Envelopment Analysis (DEA), which could measure the relative efficiency of Decision-Making Units (DMUs) based on given observation without assuming any production functions. They composed a Production Possibility Set (PPS) using observations, i.e., input and output combination of DMUs, and then inference of the production frontiers, which is the boundaries of PPS. Then, DEA estimates the relative efficiency of each DMUs according to production frontiers. In 1984, Banker, Charnes, and Cooper (BCC) [32] suggested Variable Returns to Scale (VRS) models, which complemented the assumption of Constant Returns to Scale (CRS) with the economy of scales.
Basic DEA models, such as CCR and BCC, use Farrell’s measurement method [30] or Shephard’s directional distance functions [33] to estimate the efficiency of each DMU. Because Farrell’s efficiency [30] and Shephard’s distance functions [33] have a reciprocal relationship, Shephard’s method [30] is usually used for convenience. Directional distance functions measure the Euclidean distances from DMUs’ current position to its projection point to the frontier. If there is a production possibility set that has (1 × p) input variables, (1 × q) output variables, and n observations, then an output-oriented efficiency of arbitrary DMU K ( x k ,   y k ) is calculated using the following Equation (1),
θ ^ k CRS = max { θ θ y k Y λ , x k X λ , λ 0 }
where θ is an efficiency estimate, X is a (n × p) matrix of input variables, Y is a (n × q) matrix of output variables, and λ is a (1 × n) vector of reference weights [17,34].
In DEA, efficient DMU means the best-performed products, companies, or organizations in each input and output variable. The definition of efficient is “performing or functioning in the best possible manner with the least waste of time and effort, having and using requisite knowledge, skill, and industry” [34,35]. This definition of efficient is very similar to that of SOA. Dodson [36] defined SOA as the “state of best-implemented technology as reflected by the physical and performance characteristics achieved during the period in question”. SOA is usually represented as a boundary or planar surface in which one or more characteristics have a trade-off relationship with other characteristics. If a DMU was efficient, then it could produce the best performance; it can produce an output level with a minimum input level or maximum output level within a fixed input level. SOA technology is a technology belonging to the frontier, which consists of a set of DMU’s that are efficient at a certain time.

2.3. Technology Forecasting Using TFDEA

A fundamental concept of TFDEA is estimating technological frontier using DEA and measuring a change of frontiers as new DMUs appear even though there is a slight variation according to an objective of forecasting. Rate of Change (ROC) is measured by observing a DMU that existed in the frontier when it appeared but moved inside as new DMUs are presented and forecasting a future technology or product using ROC. In TFDEA, the frontier is state-of-the-art (SOA) which means the most efficient status that can be achieved at that time, and DMUs that exist on a frontier are regarded as SOA. Thus, ROC is measured with a change of efficiency estimates of DMUs which were SOA when they first appeared but became non-SOA as time goes by. This method has excellence in measuring technological ROC because it uses only SOA, which means widespread and cutting-edge technology compared with all other observations. The process of TFDEA is composed of two phases. In phase 1, it estimates the technological frontier using DEA and measures an ROC of the frontier. Additionally, it then forecasts a technology or product in the future using ROC in phase 2.

2.3.1. Phase 1. Measuring Technological Rate of Change

A technological ROC is measured by an algorithm of Inman et al. [22] and Inman [37].
An Algorithm for measuring technological ROC in TFDEA.
  • For the input and output specified in Equation (1), compose production possibility set as accumulating DMUs from first appearance date ( t k = t 0 ) to current date ( t f );
  • Select an SOA DMU which is efficient at the date it first appeared ( θ i t k = 1 ), using an output-oriented DEA model;
  • Select a non-SOA DMU which was selected in the previous step 2 but not any more efficient ( θ i t f > 1 ) according to current ( t f ) frontier. Additionally, project these non-SOA DMUs to the current frontier to calculate an effective date ( t i , eff ) by Equation (2).
    t i , eff = j = 1 n λ j t j / j = 1 n λ j j = 1 , , n ;   λ j   reference   weight
  • Compute rate of change each DMU which selected in the previous step 3 using the following Equation (3).
    γ i t f = ( θ i t f ) ( 1 t i , eff - t k )   j = 1 , , n
  • Compute technological ROC ( γ ˉ ) by averaging the rate of change each DMU.
    γ ˉ = j = 1 n λ j , k γ k / j = 1 n λ j , k
A calculation of technological ROC is performed by iterating through 1–3 from the date of first DMU released ( t 0 ) to the current date ( t f ). We can select DMUs that were SOA when released but become non-SOA as new DMUs appeared during this process. We except DMUs which remain on the frontier when measuring a technological ROC because that is still an SOA. The ROC of each DMU is calculated in 1–5 with selected DMUs using Equation (3). Additionally, the elapsed time of each DMU is from its released date ( t k ) to the effective date ( t i , eff ), which was calculated using Equation (2). An effective date ( t i , eff ) is a projected point on the current frontier, a weighted average of DMU’s reference set and its released dates. The annual average ROC ( γ ˉ ) is a weighted average of each DMU’s ROC by Equation (4).

2.3.2. Phase 2. Forecasting Future Technological SOA

Before the forecasting, we need to measure the super-efficiency of target DMUs. Anderson and Petersen [38] and Rousseau and Semple [39] suggested the super-efficiency DEA models identify relative rank among the efficient DMUs. First, it composes PPS without the specified DMU. Then, it measures the efficiency score of the specified DMU using distance functions. Suppose the efficiency score of DMU K is less than unity ( θ k SE < 1 ), it is considered that DMU K is located inside the production frontier. Additionally, if the efficiency score is greater than the unity ( θ k SE > 1 ), it is considered that DMU K is located outside of the production frontier.
In TFDEA, if the super-efficiency score of the target DMU is greater than the unity, it means that the technology is more advanced than the current technological SOA frontiers. Inman et al. [22] and Inman [37] forecast the releasing date of target DMU K using Equation (5)
t k , expected = t eff + ln ( 1 / θ k SE , t f ) ln ( γ ˉ )
where t K , expected is releasing date of target DMU K and t eff is the effective date of DMU K. The effective date of DMU K is calculated using Equation (2), and then super-efficiency score ( θ k SE , t f ) is measured according to the current ( t f ) technological frontiers. The technology forecasting estimates the releasing date of target DMU by calculating the required time that current technological frontiers are moving to that of futures by the rate of annual average ROC.

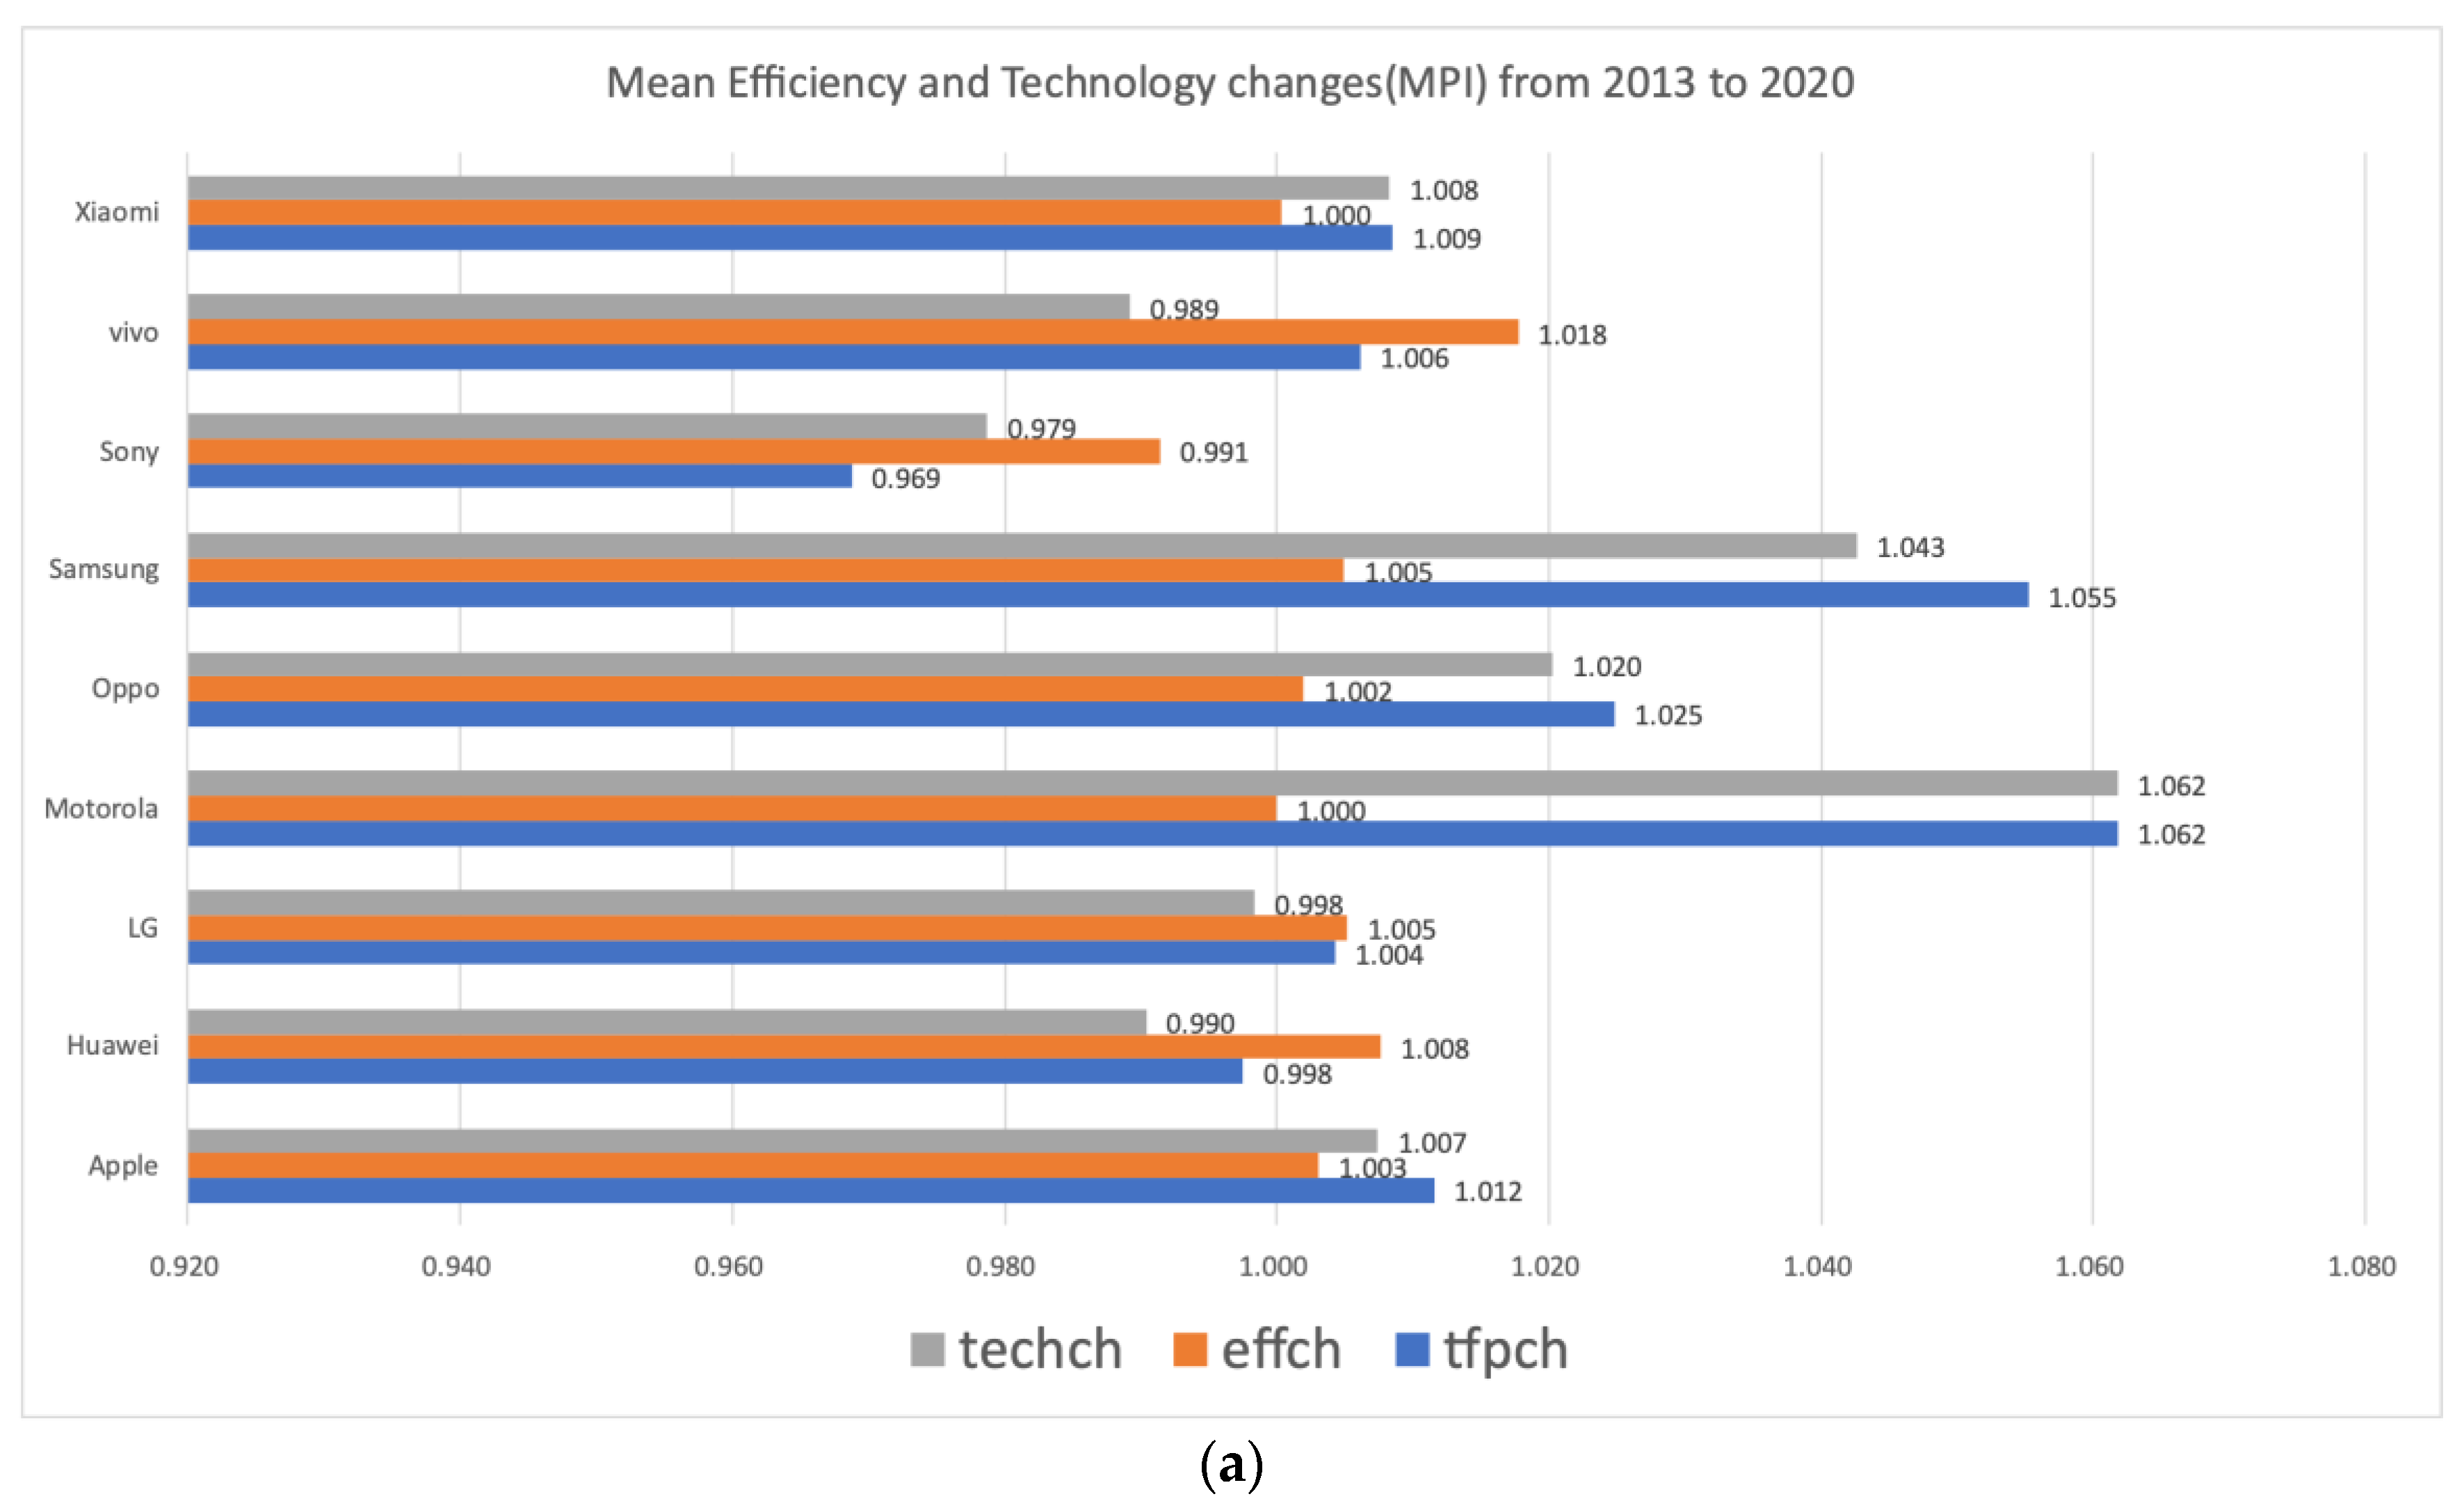
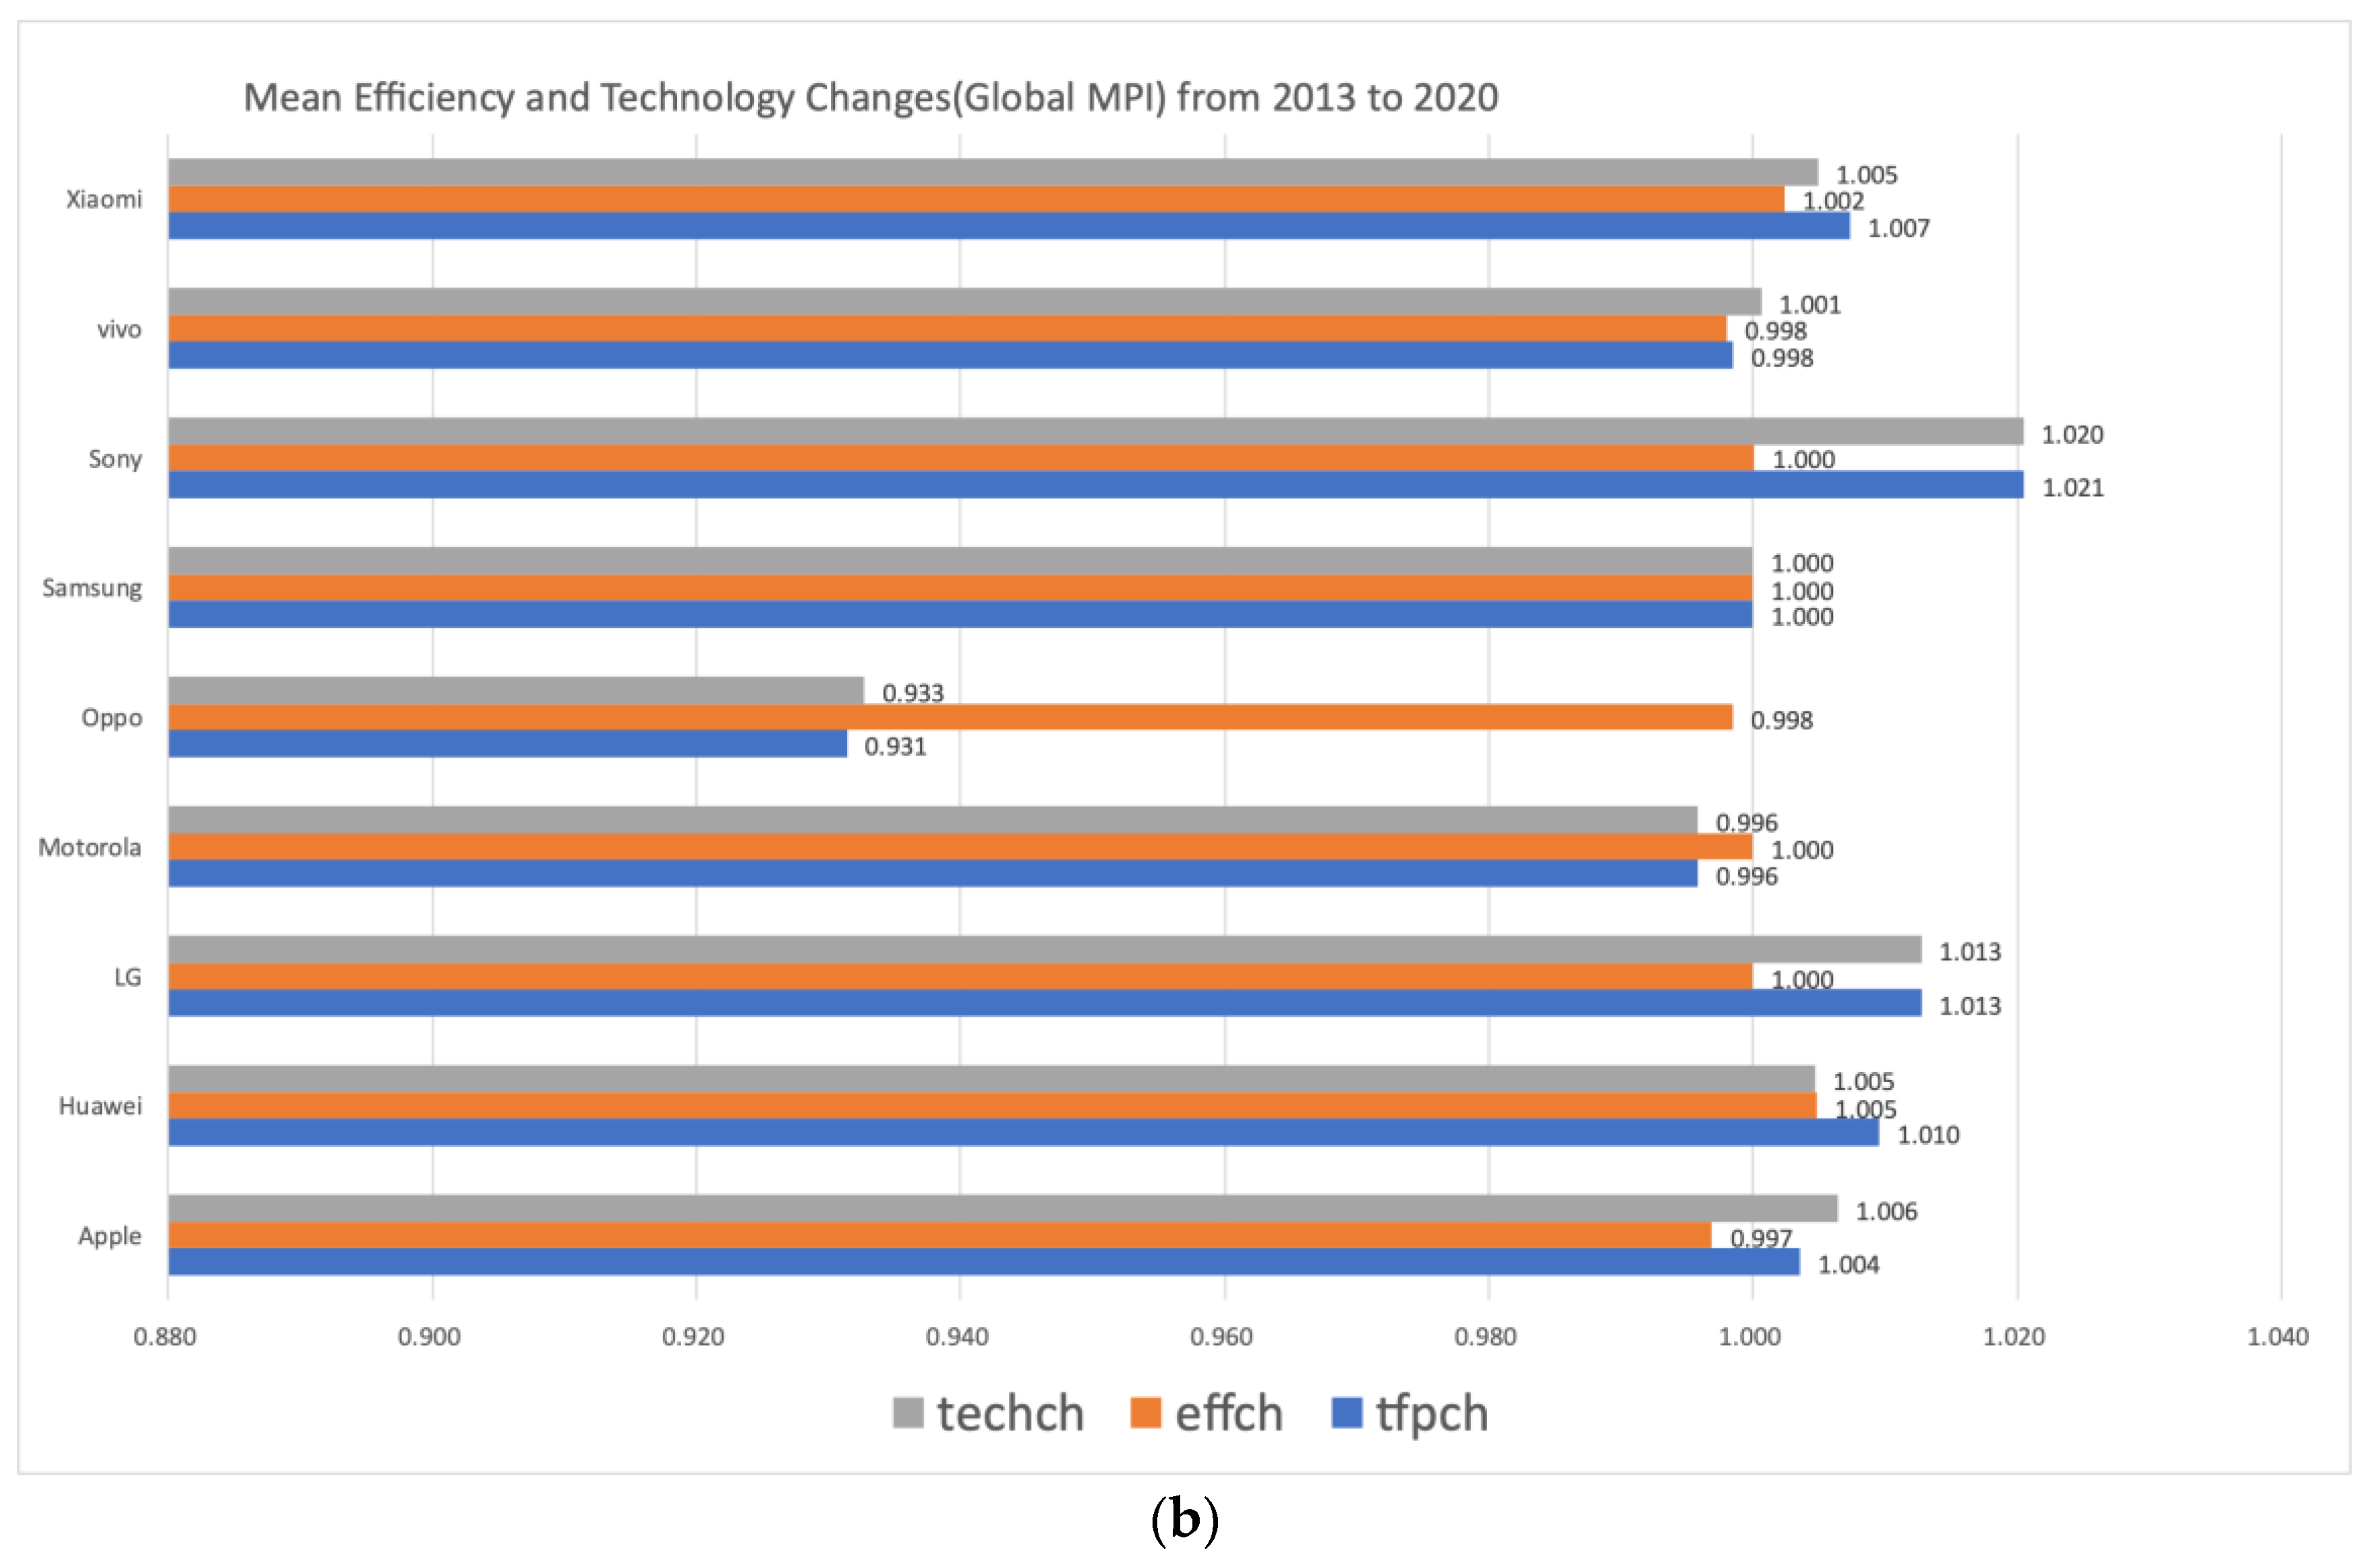
2.4. Efficiency and Technology Change Analysis Using Malmquist Index

The Malmquist Productivity Index (MPI) measures the productivity changes along with time variations and can be decomposed into changes in efficiency and technology with DEA, such as a nonparametric approach. Productivity decomposition into technical change and efficiency catch-up necessitates the use of a contemporaneous version of the data and the time variants of technology in the study period. The MPI can be expressed in terms of distance function (E) as Equations (6) and (7) using the observations at time t and t + 1 [40].
MPI I t = E I t ( x t + 1 , y t + 1 ) E I t ( x t , y t )
MPI I t + 1 = E I t + 1 ( x t + 1 , y t + 1 ) E I t + 1 ( x t , y t )
where I denotes the orientation of MPI model.
The geometric mean of two MPI in Equations (6) and (7) gives Equation (8).
MPI I G = ( MPI I t MPI I t + 1 ) 1 2 = [ ( E I t ( x t + 1 , y t + 1 ) E I t ( x t , y t ) ) · ( E I t + 1 ( x t + 1 , y t + 1 ) E I t + 1 ( x t , y t ) ) ] 1 / 2
The input oriented geometric mean of MPI can be decomposed using the concept of input oriented technical change (TECHCH) and input oriented efficiency change (EFFCH) as given in Equation (9).
MPI I G = EFFCH I · TECHCH I G = ( E I t + 1 ( x t + 1 , y t + 1 ) E I t ( x t , y t ) ) · [ ( E I t ( x t , y t ) E I t + 1 ( x t , y t ) ) · ( E I t ( x t + 1 , y t + 1 ) E I t + 1 ( x t + 1 , y t + 1 ) ) ] 1 / 2
The first and second terms represent the efficiency change and the technology change, respectively. MPI given by Equations (8) and (9) can be defined using DEA, such as distance function. That is, the components of MPI can be driven from the estimation of distance functions defined on a frontier technology. Fare, Grosskopf, Norris, and Zhang [40] provided the formal derivation of MPI and it is the most popular method among the various methods that have been developed to estimate a production technology [41]. By utilizing both CRS and VRS DEA frontiers to estimate the distance functions in Equation (9), the technical efficiency can be decomposed into scale efficiency and pure technical efficiency components. A scale efficiency change (SECH) is given in Equation (10).
SECH = [ ( E vrs t + 1 ( x t + 1 , y t + 1 ) / E crs t + 1 ( x t + 1 , y t + 1 ) E vrs t + 1 ( x t , y t ) / E crs t + 1 ( x t , y t ) ) · ( E vrs t ( x t + 1 , y t + 1 ) / E crs t ( x t + 1 , y t + 1 ) E vrs t ( x t , y t ) / E crs t ( x t , y t ) ) ] 1 / 2
Additionally, a pure efficiency change (PECH) is given in Equation (11).
PECH = E vrs t + 1 ( x t + 1 , y t + 1 ) E crs t ( x t , y t )  
When measuring changes in productivity, if you measure changes in production changes organized by year, transitivity is not established so that you can compose production changes including data for all periods. Global Malmquist productivity index (GMPI) constructs a production set that includes all data from all time periods and measures the change in productivity relative to the boundaries of the production set [34,40,41,42].
MPI G t , t + 1 = E I G ( x t + 1 , y t + 1 ) E I G ( x t , y t )
While MPI can measure productivity changes over two years, Global MPI can analyze productivity changes over three years or more. In this study, the productivity change of smartphones by year was analyzed through MPI, and the relative productivity change of each smartphone in the overall market was analyzed through Global MPI.

3. Data and Results

3.1. Date and Models

In this study, the rate of technological change was calculated using the technical data of smartphones, which are evaluated to have a high rate of technological development. Smartphone manufacturers for this study are selected considering dual-use technology, global market share, and growth rate [15,43,44,45,46]. The main data sources are from the websites https://www.kaggle.com/msainani/gsmarena-mobile-devices (accessed on 13 February 2022) and www.gsmarena.com (accessed on 3 March 2022).
The dataset, initially introduced by Sainani [45], has 10,105 observations that include performance and characteristics parameters of smartphone data that were firstly flown from 1994 to 2020. Missing values are supplemented if there is data provided by the GSMARENA site [46], and smartphone models with insufficient data necessary for analysis are deleted, and data are constructed focusing on representative models of each manufacturer. Table 1 shows the final smartphone dataset used for the analysis. The analysis of this study covered technical data of 107 smartphones released between 2005 and 2020.
In the case of TFDEA application, an output-oriented VRS model was used in consideration of previous studies and the characteristics of the model [24,25,28]. The input variables are price and body weight, and output variables are network speed (ntwk), display resolution (resolution), battery capacity (btrycpcty), sensors (sensors), CPU speed (cpus), and primary camera performance (pcamp).
As analysis software, TFDEA R program of Shott and Lim [15] and Stata programs, dea.ado, tfdea.ado, malmq.ado, supereff.ado, of Lee [16,17,42] were used in parallel.
Smartphone specification data were selected in terms of performance required for the military use of commercial products of interest in this study, and input/output variables were determined as follows. Although it is the leading technology for commercial smartphones, the military requirement may be low, and conversely, it may not be considered important in commercial smartphones but may have high military requirements. In this study, performance variables in the military field were selected in consideration of the performance parameters of military radios presented in Jane’s Defense Data Service (JDDS). The performance indicators of military radios included frequency range, operable channels, display performance, battery duration, sensitivity, weight, operable temperature, size, and audio output in common. Table 2 shows the input and output variables used in the analysis. Srivastava [47] was referred to quantify qualitative variable values.
  • DMU: name of the smartphone
  • year: year of smartphone introduction
  • price: retail price announced in EUD
  • bdywgt: body weight in kg
  • ntwk: network bands in generation
  • scrnsize: display size in square inches
  • resolution: display resolution in ppi
  • sensors: sensors in generation
  • ntwk.1: network speed in Mbps
  • cpus: cpu speed in MHz
  • pcamp: main camera performance in MP
  • btycpcty: battery capacity in mAh
  • comlev: WLAN in generation
The screen of the smartphone takes over the role of a video display and information input device. There is a limit that it is difficult to use the communication function of a commercial smartphone in military operations, but there is no better alternative to a high-performance personal computer dedicated to information processing. It is of interest to see how the higher military requirements, such as military security requirements, than commercial products will affect the technological change of smartphones in the future.

3.2. Results

3.2.1. Predicting Smartphone Technology

We inference ROC using smartphone data until 2017 and forecast a first launch date afterward. A result of tfdea using smartphone data is shown in Table 3.
In Table 3, the first Column is the name of each DMUs’ manufacturer. The Release year is DMU k’s first release date. Column Efficiency release is a DEA efficiency estimator at the time of each DMU released. Column theta_ t f is an efficiency estimator at the time of t f . Column current (Effective date) is the effective date of each DMU. Additionally, column ROC is a measured ROC of DMUs, which was an SOA at t k but changed to a non-SOA when new DMUs appeared. SROC is an average of each ROC and the number of DMUs chosen to infer ROC. There were 80 DMUs between 2005 and 2017, and 37 DMUs were changed from SOA to non-SOA. In total, 22 among 37 DMUs belonged to the period from 2005 to 2011, which means that there were many cases of new smartphone products being released and withdrawn at that time. A total of 43 other DMUs stayed as SOAs in 2017, so they were excluded when measuring ROC. The SROC of smartphones from 2005 to 2017 is 1.07.
The A1200 smartphone made by Motorola has an efficiency value of 1 at the time of release in 2005 and an efficiency value of 1.7837 for the production frontier in 2017, so the rate of technological change is calculated as 1.08. The ROC from 2005 to 2012 was analyzed as 1.09, and the ROC from 2013 to 2017 was analyzed as 1.05. The column “date forecast (tf_exp)” shows the forecasting results of target DMUs. There was no difference between the two groups as a result of statistical testing between the predictions from 2018 to 2020 and the release year. From the output of the two-sample Wilcoxon rank-sum (Mann–Whitney) test, we see that we fail to reject the null hypothesis that the populations are the same at a 0.05 significance level. These results indicate that the rate of SOA progress up to 2017 surpasses the rate of technological change from 2018 to the present.
Samsung’s Galaxy S20 5G, launched in 2020, is in use by the ROK armed forces, and it can be assumed that the 2021 release year is to meet high military requirements. On the other hand, Apple’s expected release year of the iPhone SE (2000) model was 2017, but it was actually released in 2020. Although the iPhone SE (2000) is not a flagship model, it can be assumed that it is intended to broaden the base of consumers. To find out in more detail about the technological change of smartphones by year, the following section analyzes the productivity change.
The discrepancy between the predicted value and the actual value in Table 3 means that the market launch of a product is not determined solely by technological superiority but is a product of various business environments. Despite these limitations, in the long run, technological forecasting can recognize opportunities and challenges through scientific methods and predict technological limitations by performing technological forecasting. Separately from this study, multiple regression analysis was performed by selecting the dependent variable as the product release year and the independent variable as the variable used in TFDEA. Because the analysis conditions are different, the results of the two methodologies cannot be compared, but the results of the TFDEA for the year of release are not rejected.

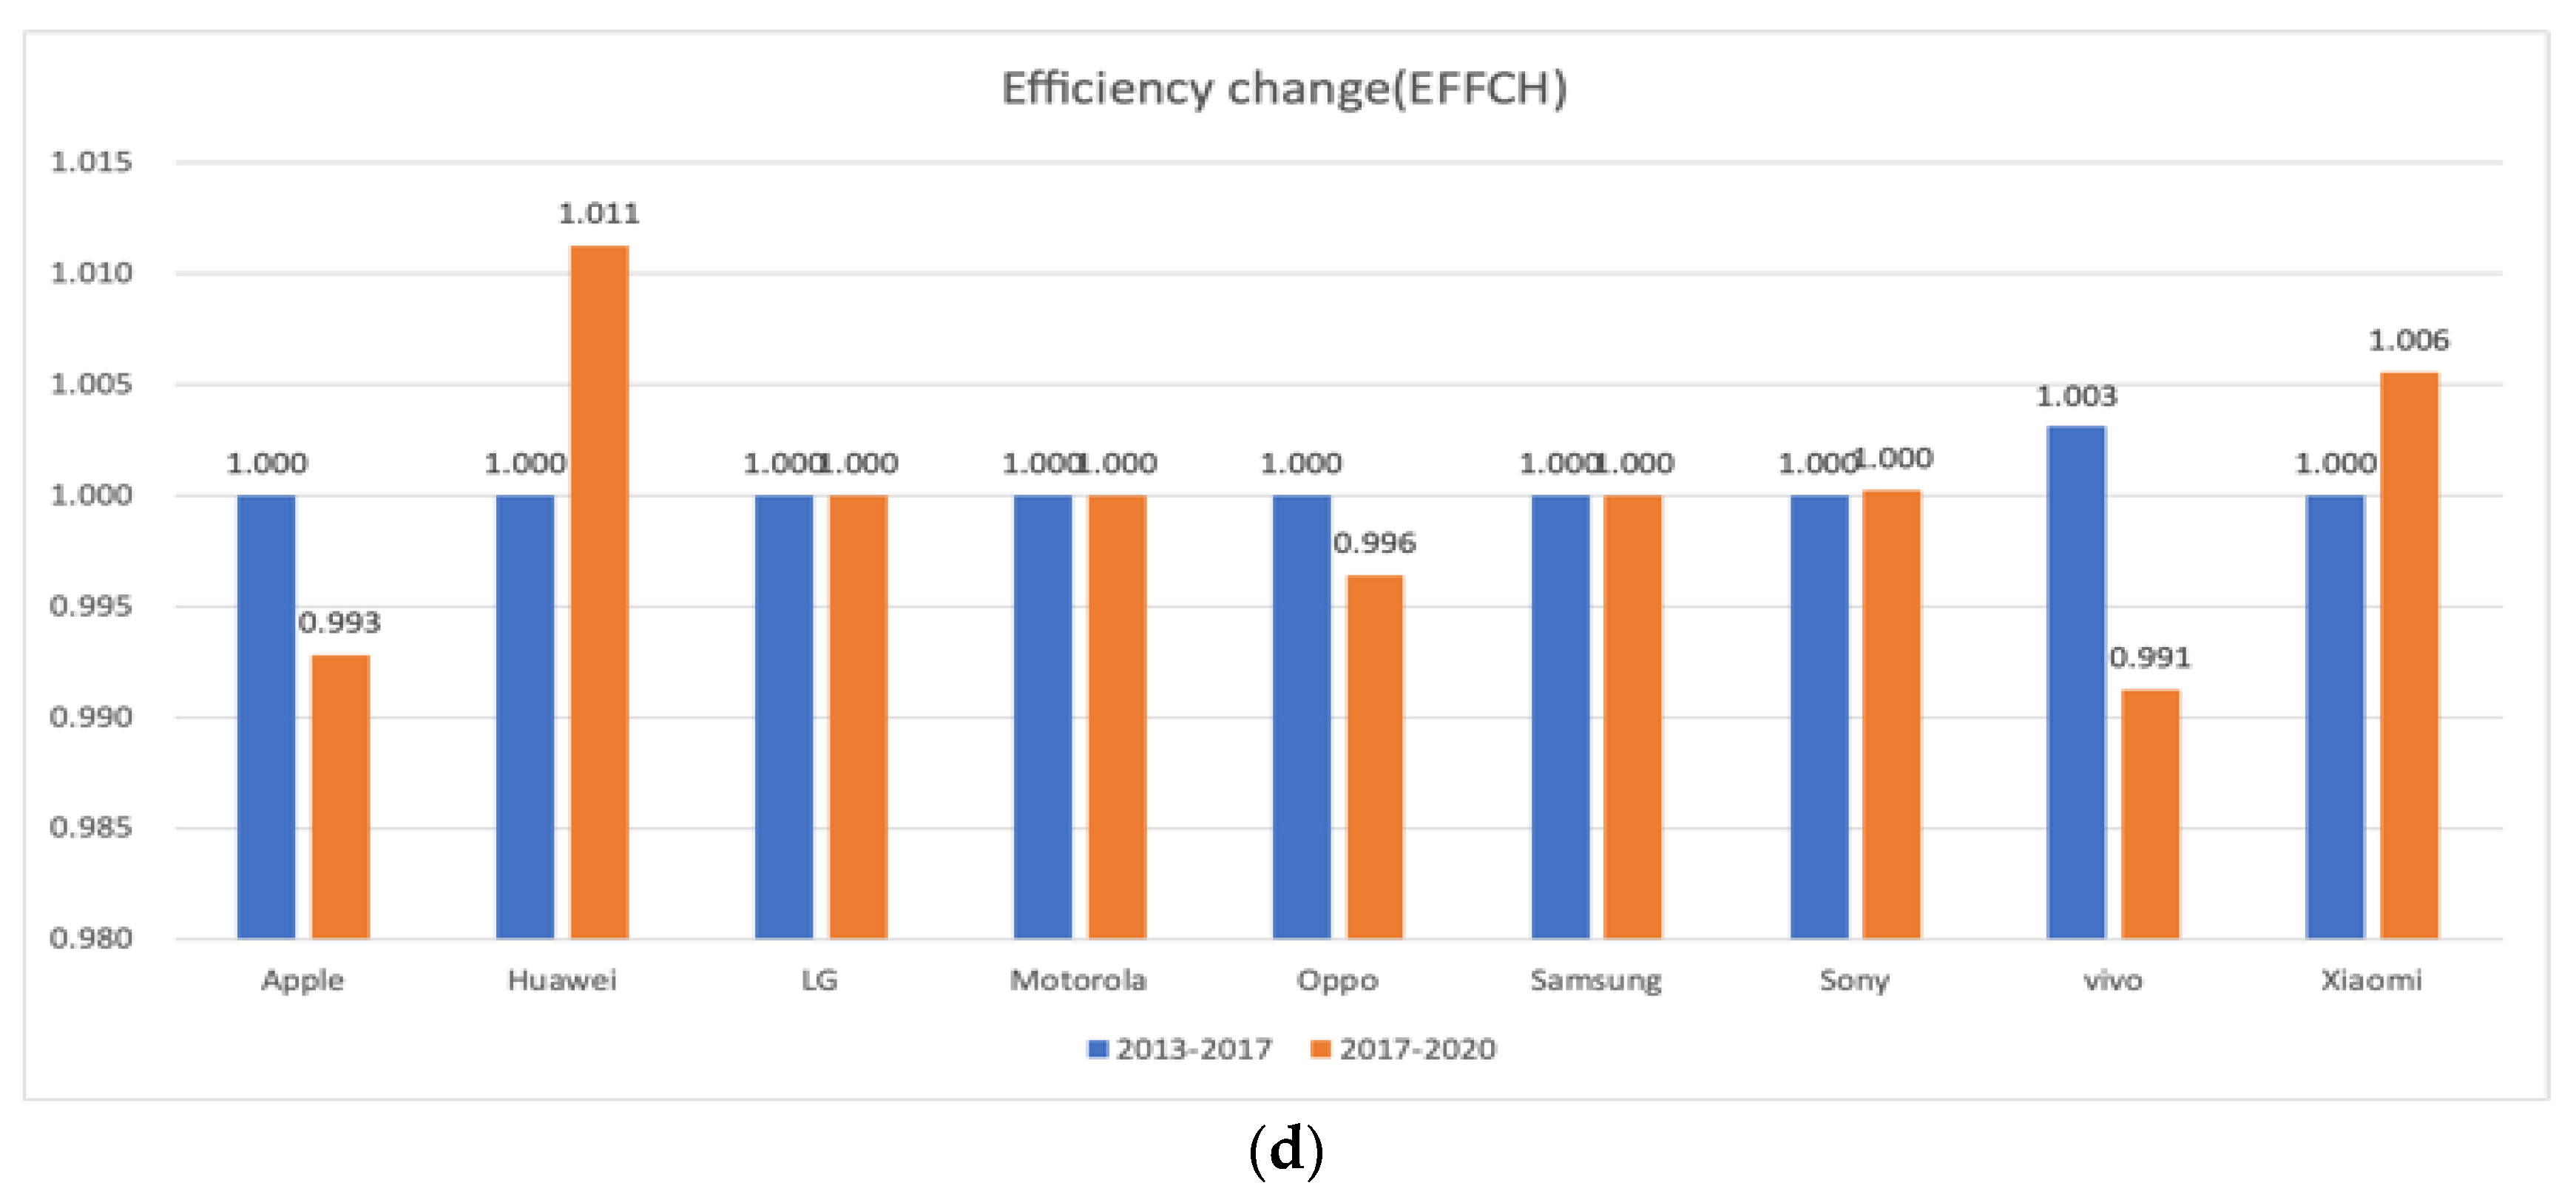
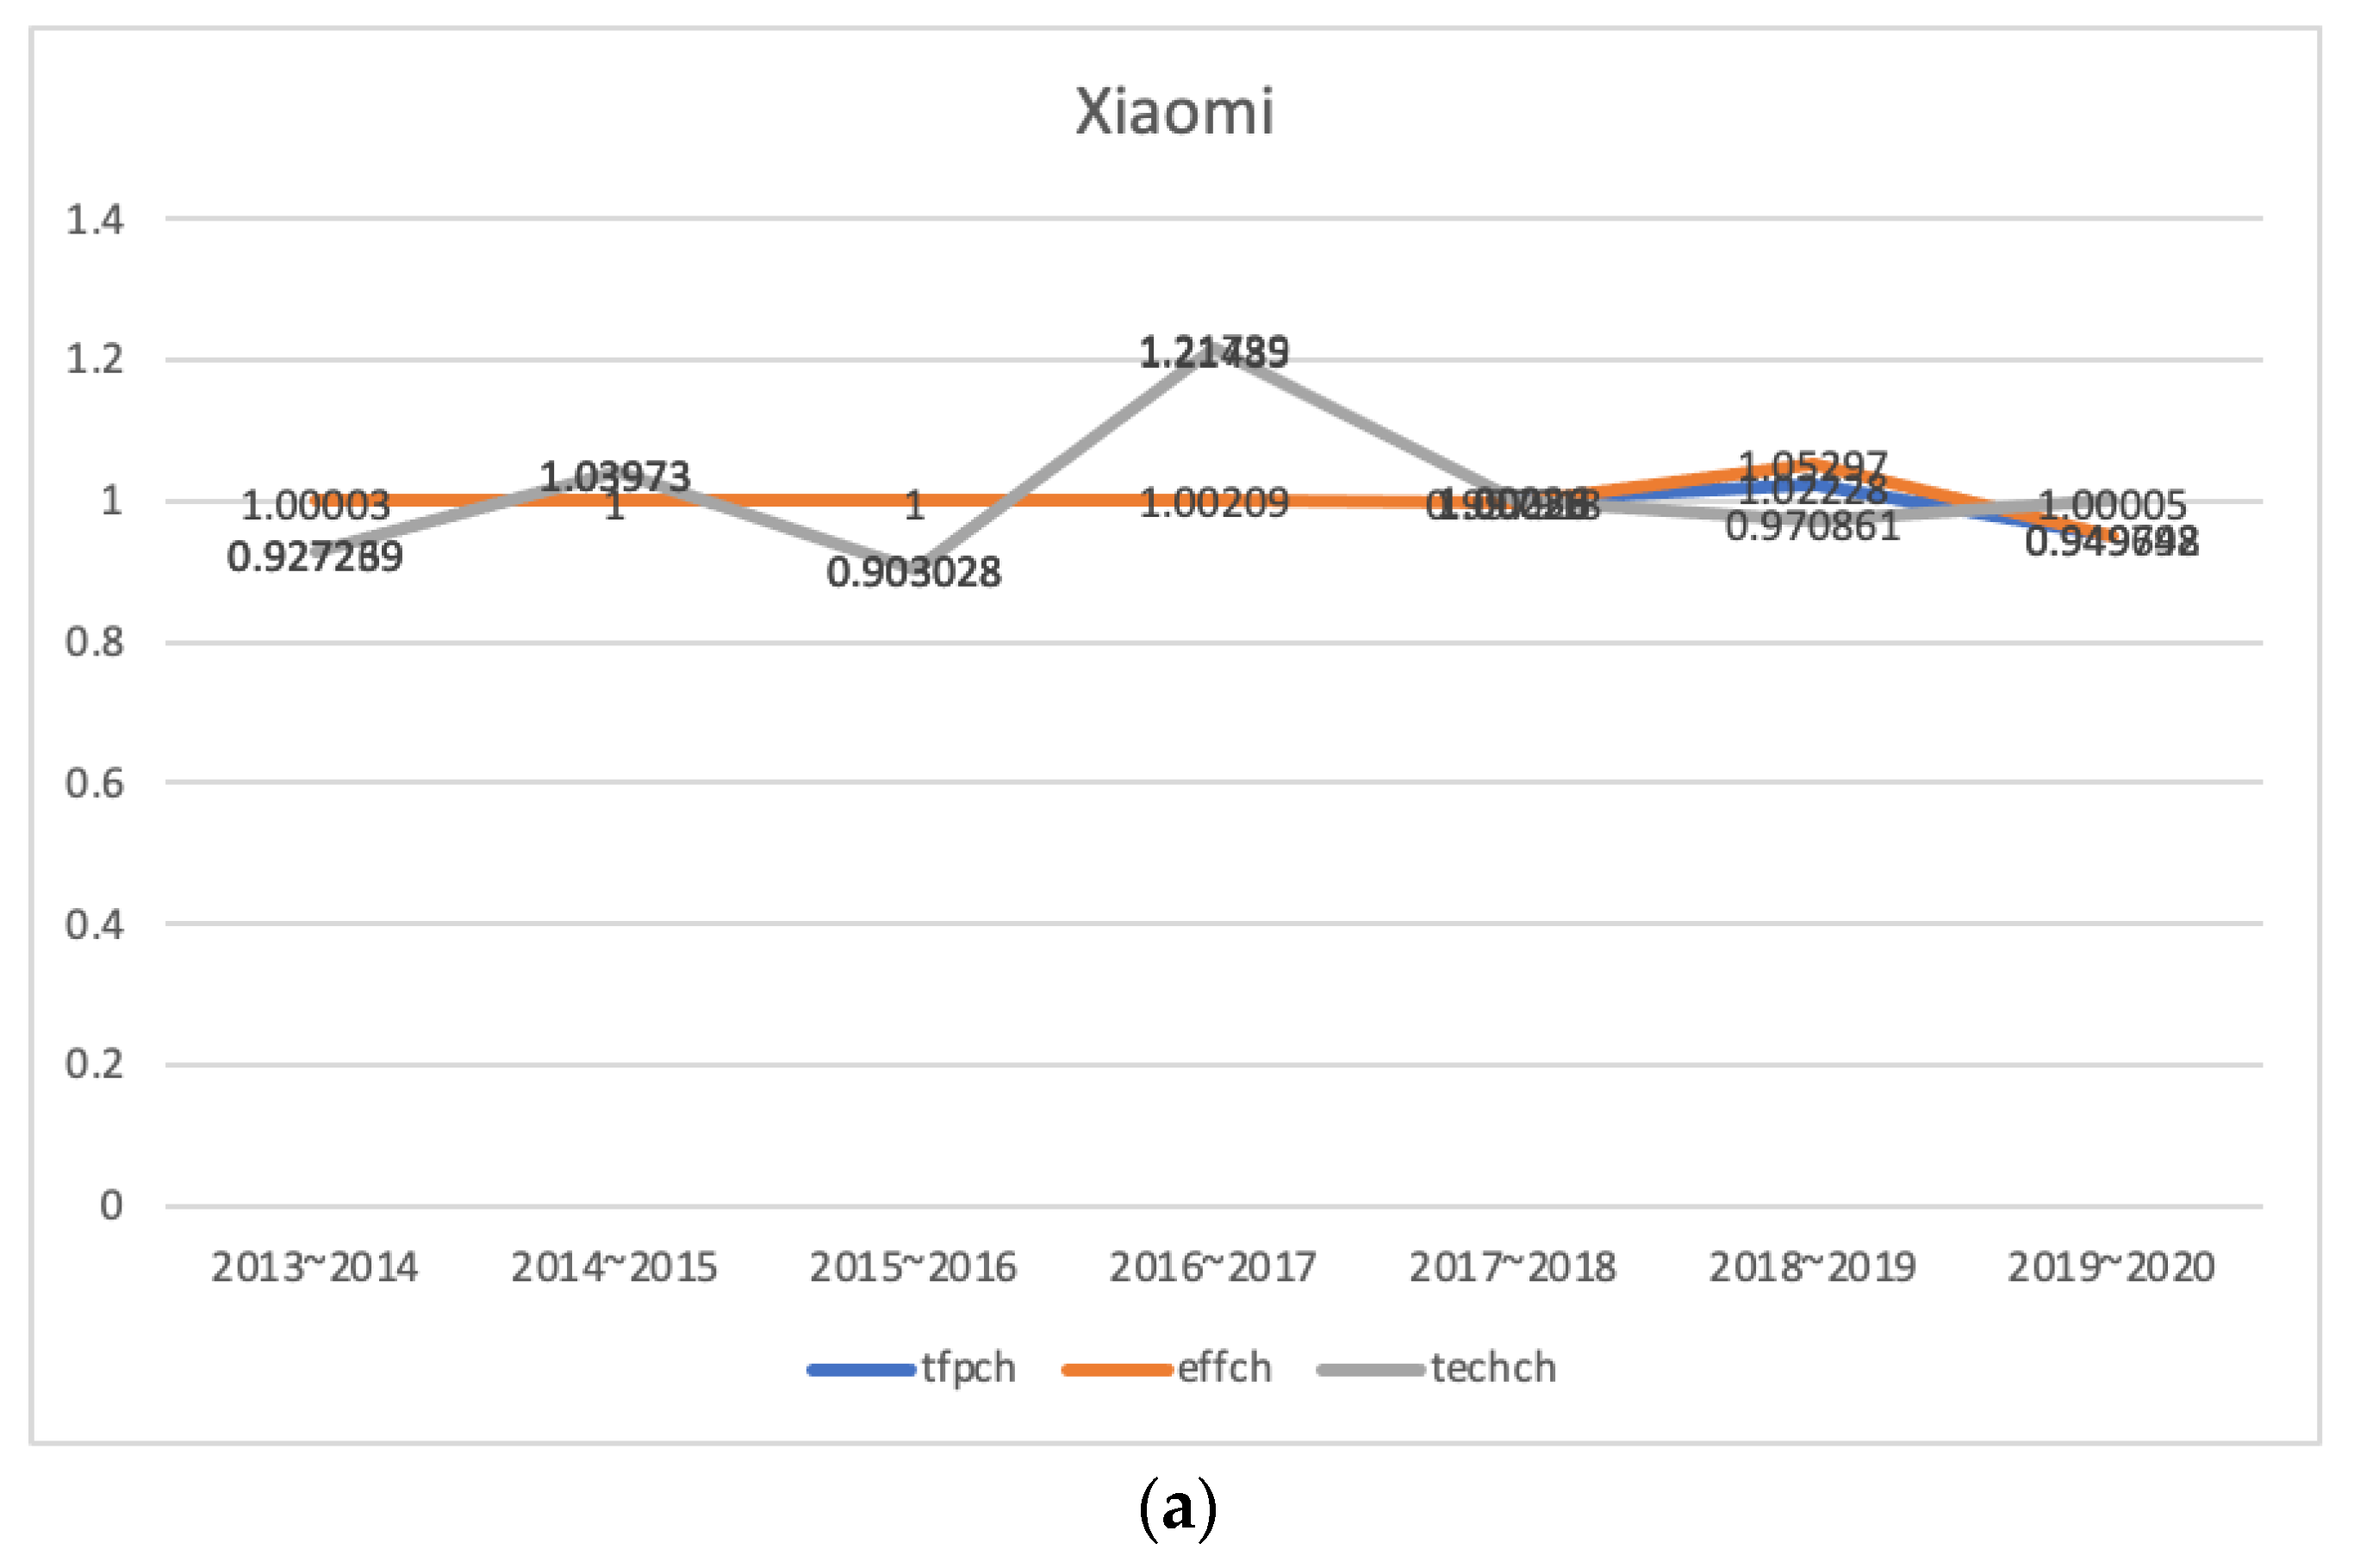
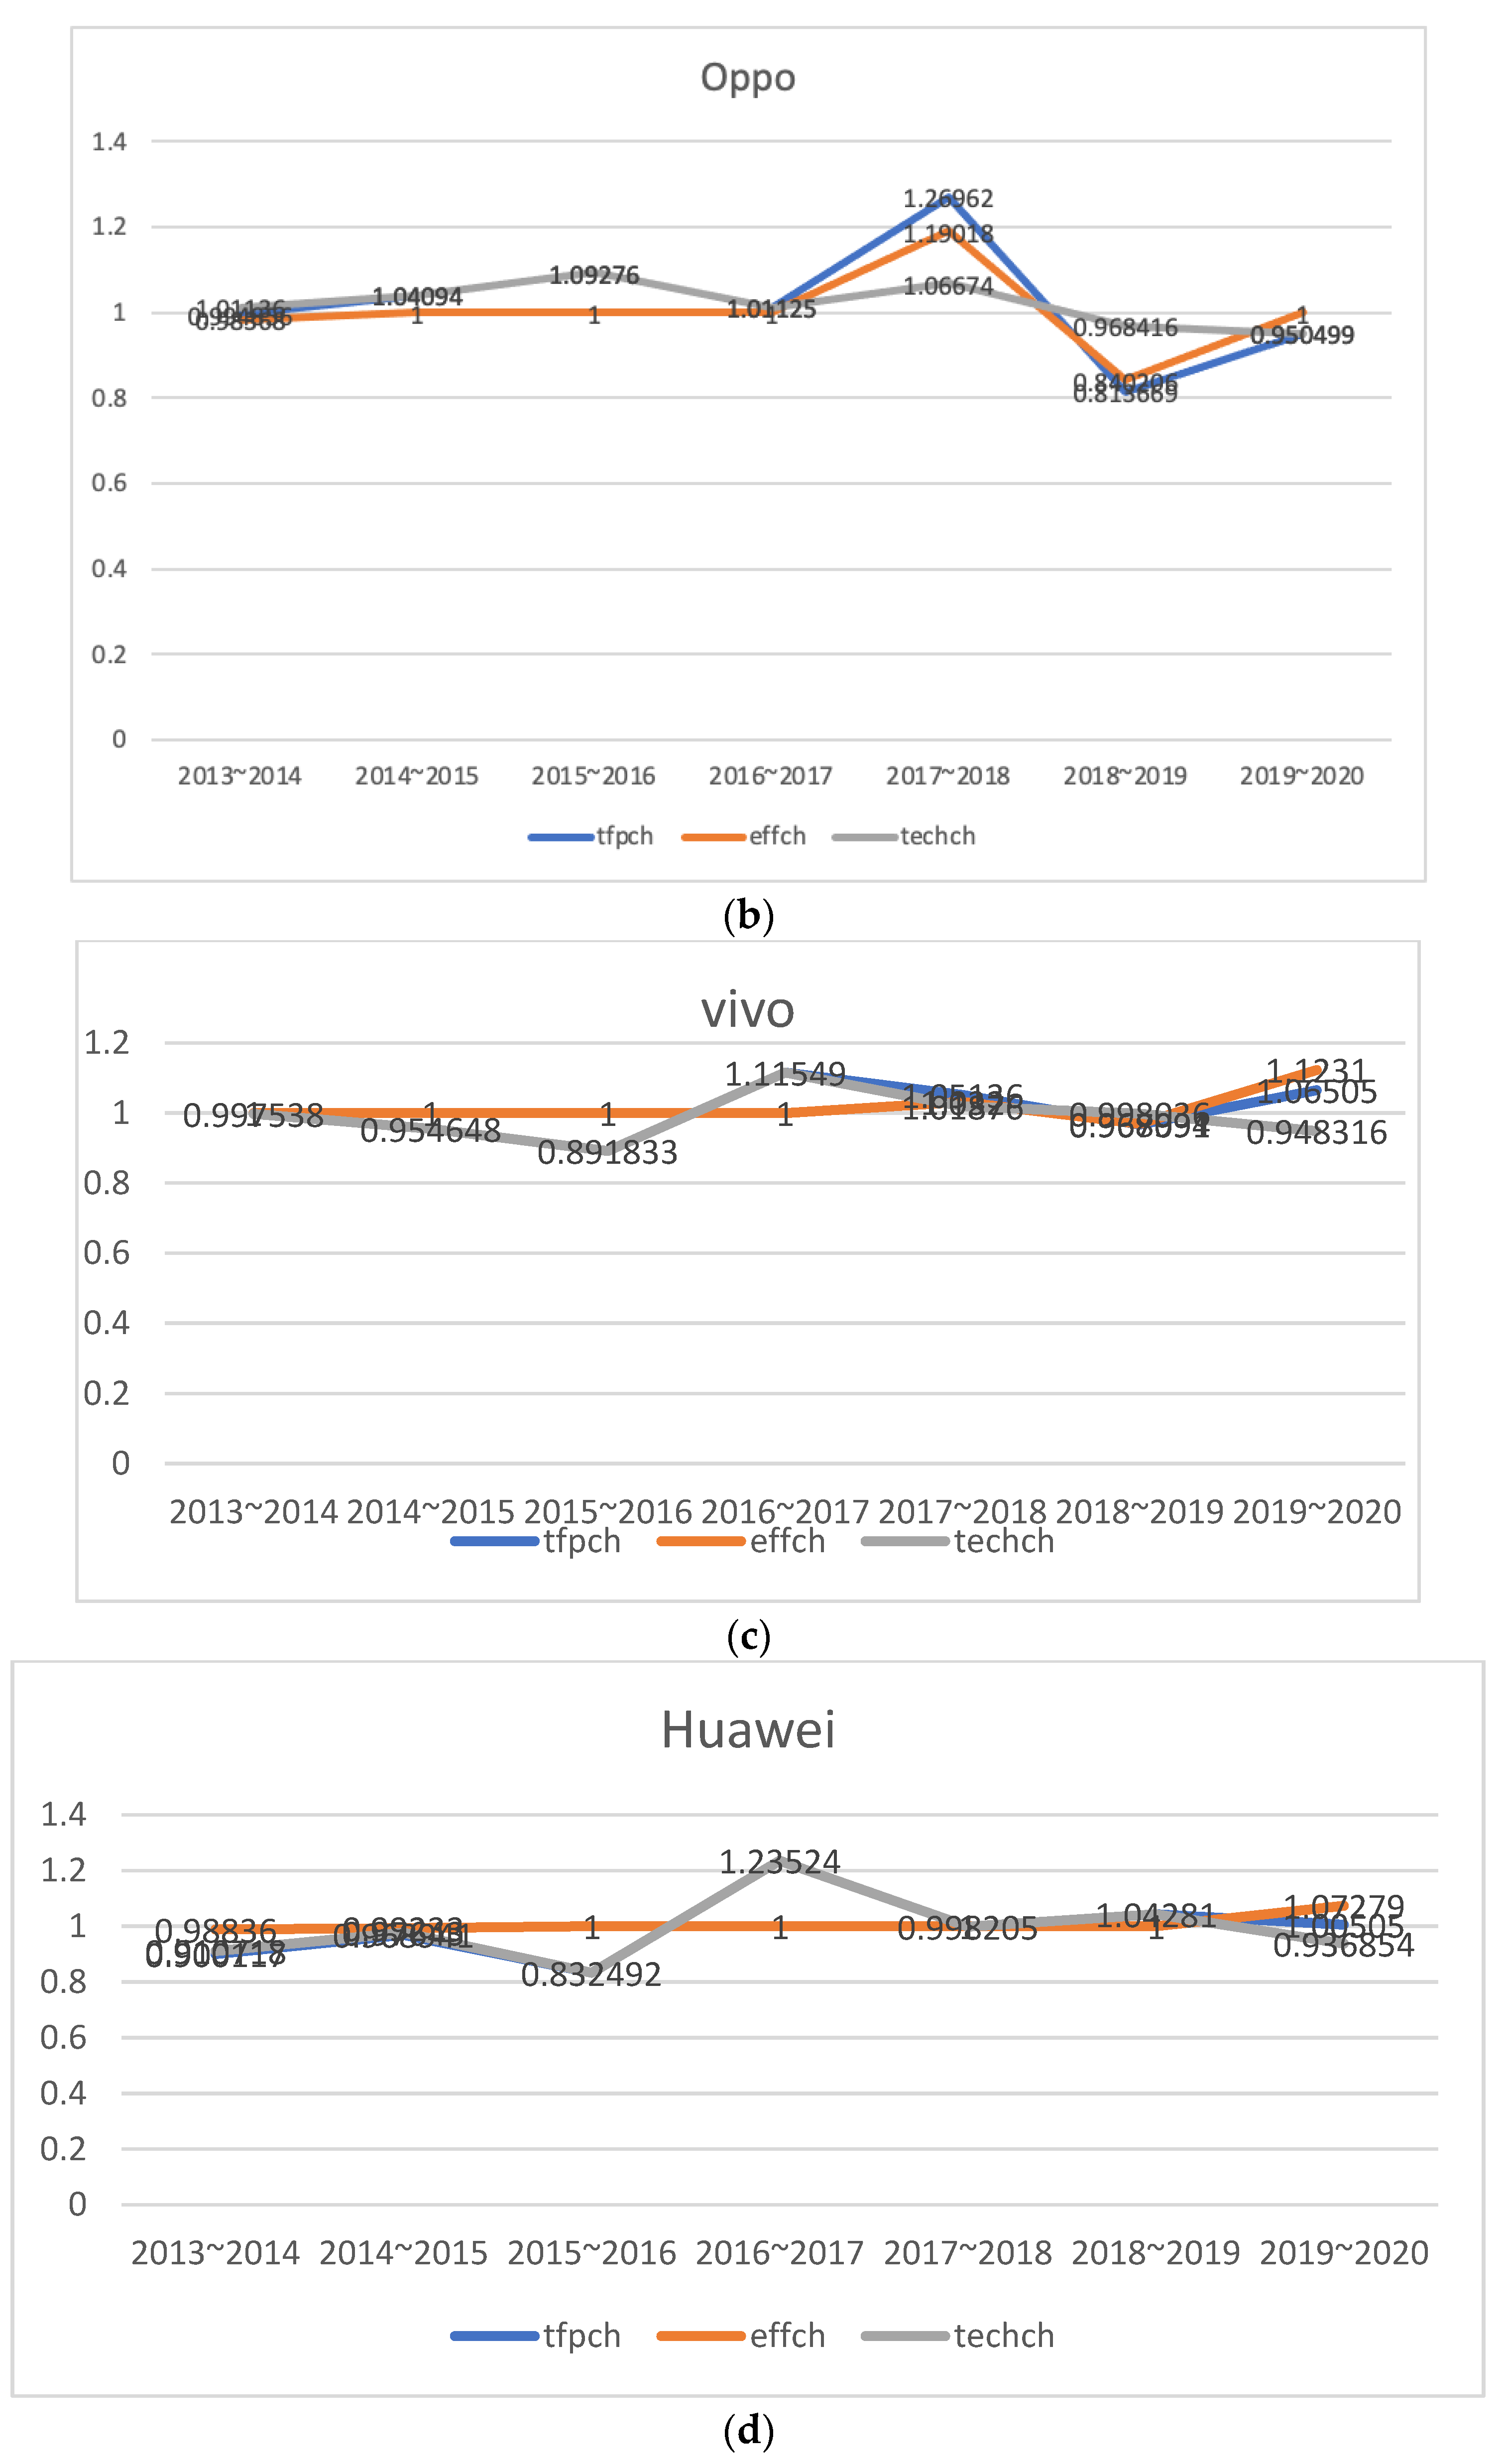
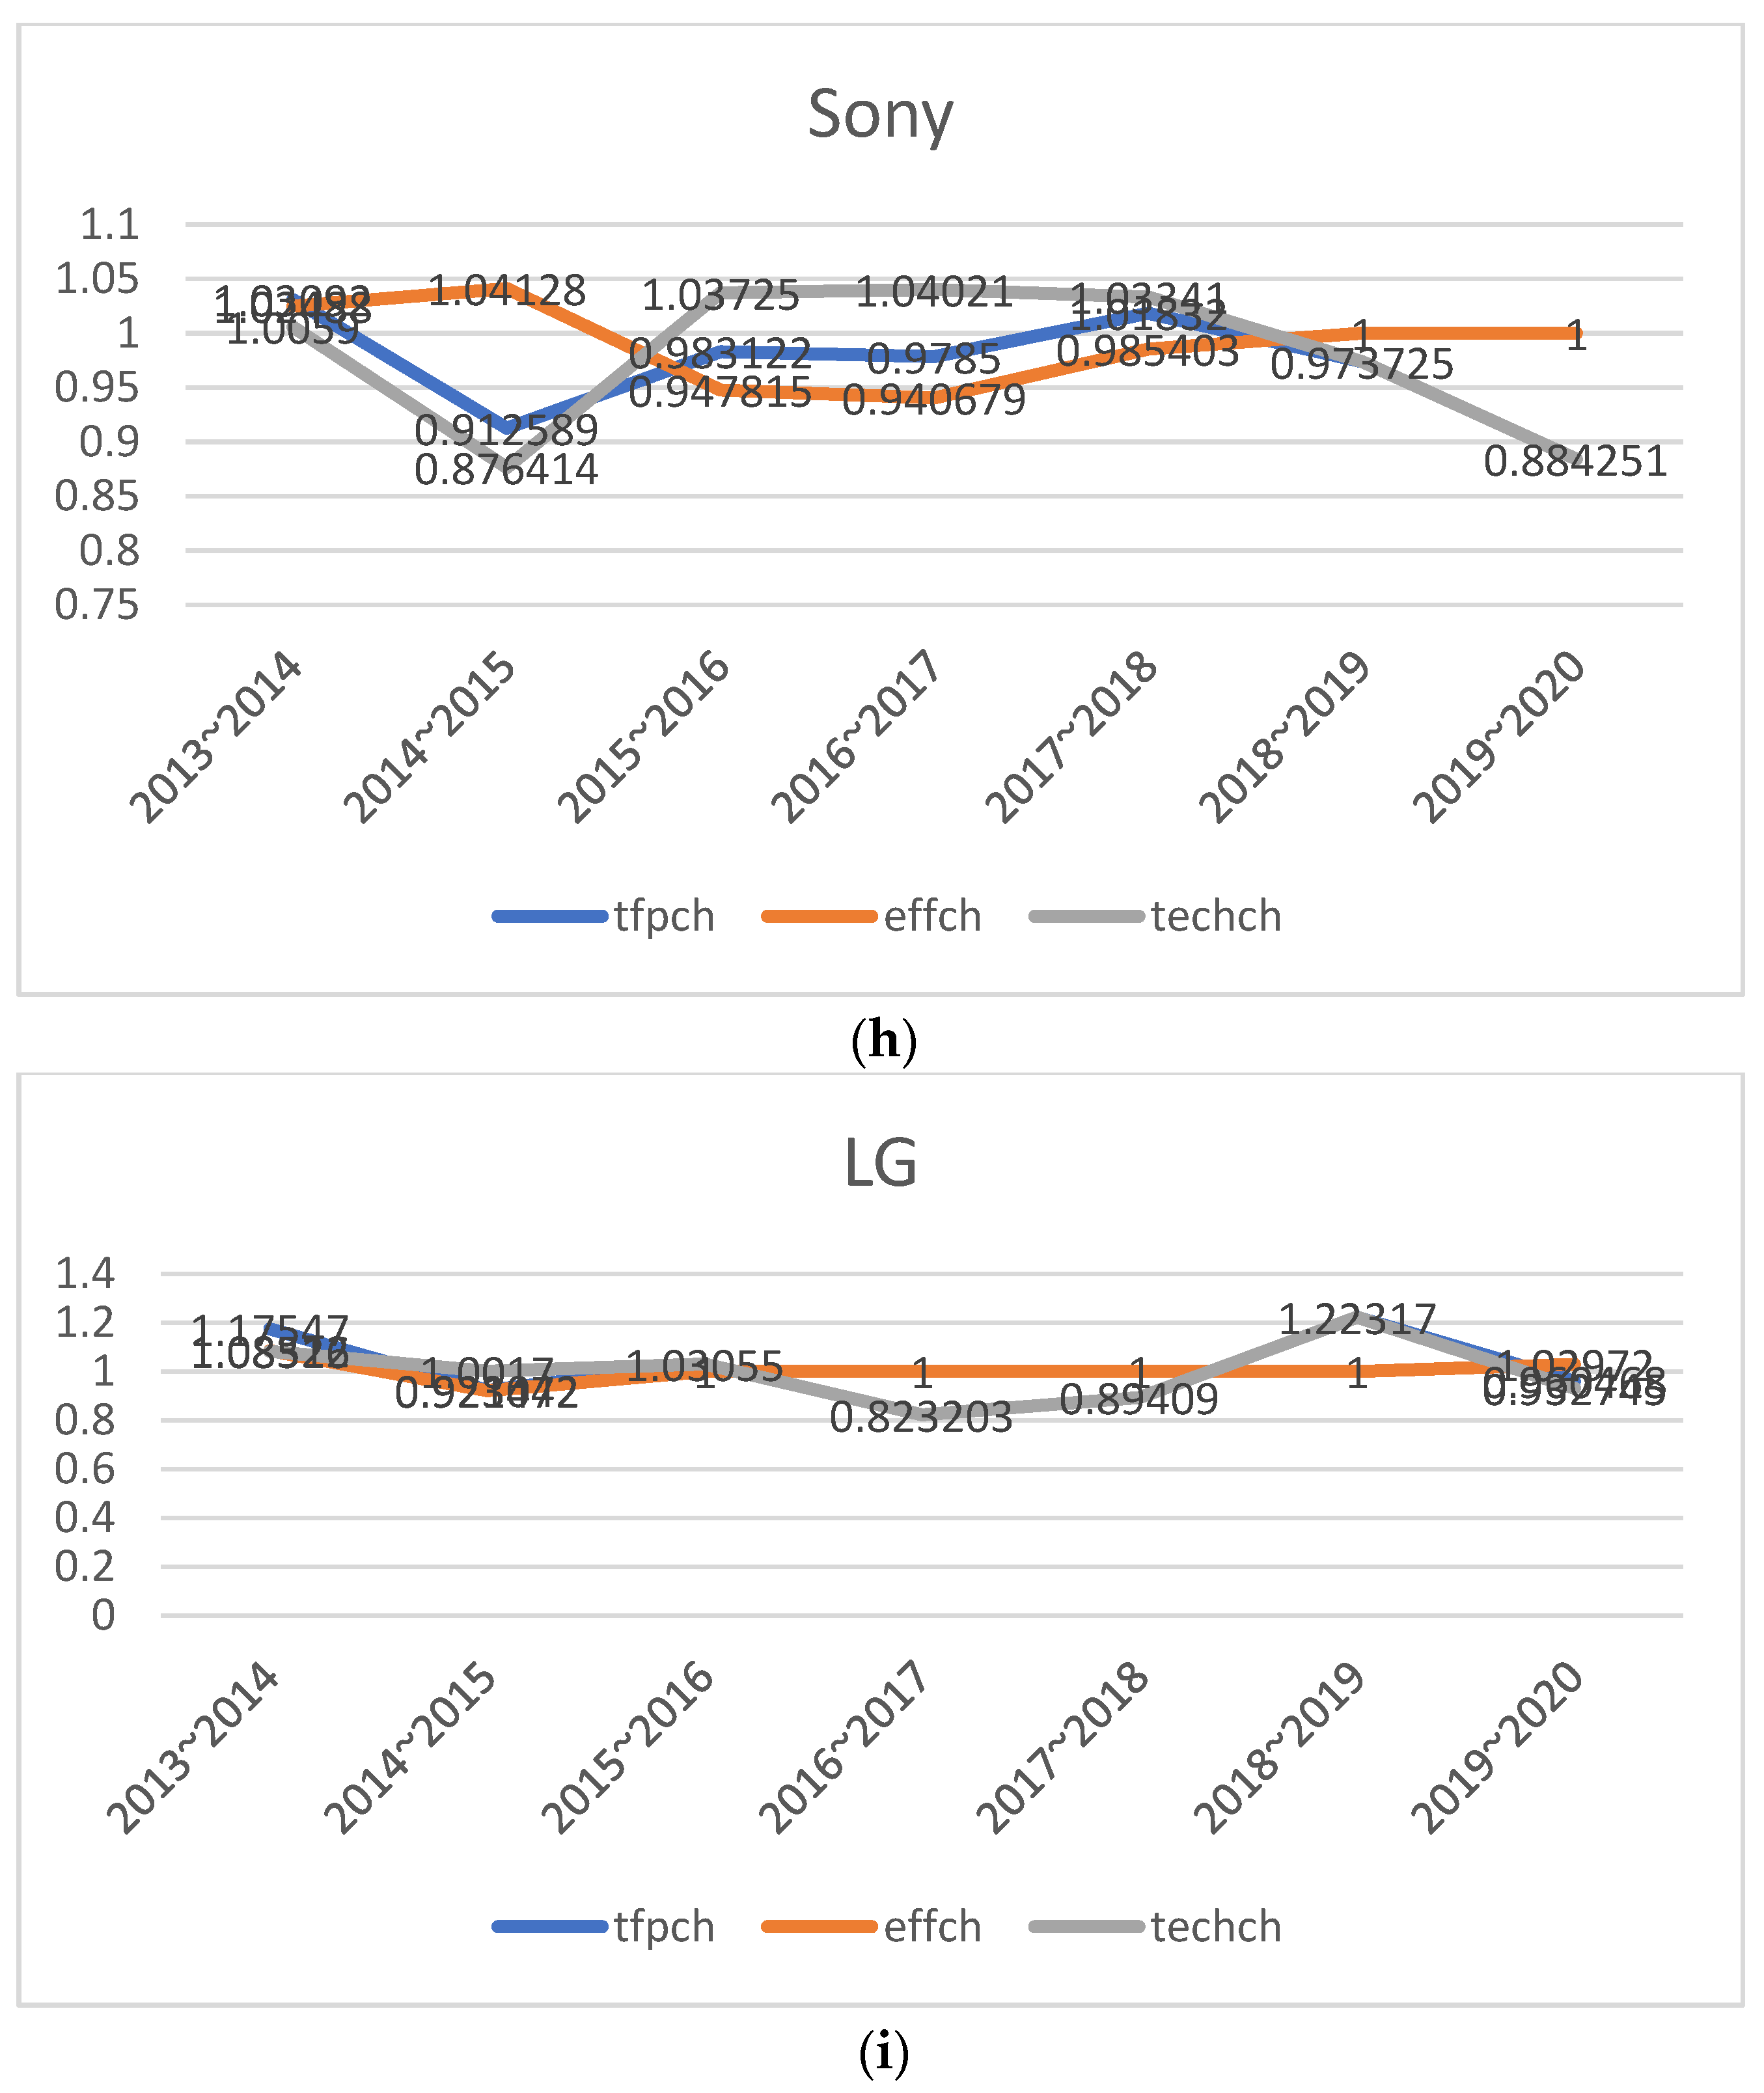
3.2.2. Efficiency and Technology Change Analysis

Table 4 shows the results of measuring productivity changes, technological changes, and efficiency changes using 9 companies as panel data from 2013 to 2020, subset data of Table 2. For Malmquist analysis, Stata code was used, and the command is as follows.
  • malmq price bdywgt = ntwk cpus pcamp sensors btycpcty, ort (out) rts (bcc) period (year)
The period is a variable indicating the year for measuring the change in productivity from period t to t + 1. tfpch, effch, and techch are variables corresponding to productivity change, efficiency change, and technological change presented in Equations (6)–(9). The average tfpch for the entire period was 1.0154, the efficiency change was 1.0036, and the technology change was 1.0107. It means that progress has been made in all aspects of total factor productivity, technological change, and efficiency change.
Figure 2 examines total factor productivity, technological change, and efficiency change by smartphone maker. In Figure 2a shows the mean efficiency and technology changes for the period of 2013–2020 using Malmquist productivity index and Figure 2b using global Malmquist productivity index.
Xiaomi was the fourth company among the sample in the period to lead technological progress and improve productivity while maintaining efficiency. Vivo continued its upward trend after achieving significant technological advances and efficiency gains in 2017 and 2018, with efficiency gains being key prior to 2016. While Sony retains the momentum of technological and efficiency gains it achieved before 2014, overall, it was rated as a productivity, efficiency, and technological setback relative to SOA. Samsung has improved productivity through technological advances while maintaining the status quo in all respects. Oppo is entering the global market through strong efficiency improvements, i.e., improved price/performance ratio, which itself identifies productivity gains through technological advances. Motorola maintained the status quo until 2018, but the evaluation of edge+ released in 2019 recognized the improvement of cost–performance ratio in the global market, and it is evaluated that there was technological progress compared to Motorola’s own products. Looking at the accumulated results, LG seems to be in a normal situation overall, but it seems to be an optical illusion in 2019 following a large productivity decline over the two years of 2016–2018. Huawei maintains its position in the global market with efficiency improvement as its main strength. Apple is trying to improve productivity through technological advances, but in the global market, efficiency was assessed as temporarily regressing in 2020.
Figure 3 compares average productivity, efficiency, and technological change before and after 2017. Figure 3a is a graph showing the efficiency change and technological change before and after 2017. The red arrow indicates that both the efficiency change and the technological change have regressed, the blue color indicates the progress, and the dotted line indicates that any one has advanced or regressed. Huawei is the only company that has advanced in both technological change and efficiency change. On the other hand, Vivo and Apple have regressed in both efficiency changes and technological changes. Further research is needed to interpret the cause. In other words, if the price of a product is lowered, the change in efficiency can be larger, and if the product’s technology level is already high, the price of the product can be higher. Although the average degree of technological change and efficiency change decreased, it was found that there was a difference in the degree depending on the smartphone.
Notably, the companies that achieved productivity gains compared to before 2017 were Huawei, Oppo, and Motorola. The companies that achieved the efficiency improvement were Huawei and Xiaomi. Companies that achieved technological advances were Huawei, Motorola, and Oppo. Apple, Vivo, and Sony have largely gone backwards compared to SOA. In the Malmquist analysis, only the global Malmquist productivity index, which satisfies transitivity, was analyzed, and thus there is a limit in drawing conclusions about the company’s product differentiation strategy. However, the dynamic aspects of technological change and efficiency change of companies contributing to the global production frontier can be confirmed.
Figure 4 is a graph showing the changes in productivity, efficiency, and technology by year for major brand companies. Chinese companies such as Xiaomi, Oppo, Vivo, and Huawei are trying to improve productivity through technological advances while maintaining high efficiency in terms of price/performance. Samsung is characterized by dynamics in which technological change, efficiency change, and productivity change are integrated and elastically. Apple maintains a stable level of technological change, while efficiency changes are driving the dynamics. Motorola and LG, which have market influence in the North American market, have in common that they have stable efficiency changes, but while Motorola is maintaining stable technological changes, LG has large fluctuations. Sony has been regressing in technological change since 2018, and it is interested in how much it will maintain the driving force of technological progress achieved during 2015–2017.

4. Conclusions

We analyzed smartphone launch data from 2005 to 2020 to predict the adoption of smartphone technology and discuss the pace of technological change. It has been identified that the market is undergoing reorganization as new smartphone models expand the market and increase their price/technical performance. In particular, it was found that China’s Huawei, Xiaomi, Oppo, and Vivo, followed by Apple and Samsung, the strong smartphone players in the market, are achieving SOA through technological change as well as efficiency change.
The average rate of technology change of smartphone from 2005 to 2017 is 1.07 and since after 2013, 32 smartphones out of 45 that were SOA at the time of release maintained the SOA status until 2017. Of the 28 smartphones released between 2008 and 2012, 7 remained SOA. If the technology change rate is greater than 1, it means that the SOA change by technological progress is being expanded. Additionally, the change in the number of smartphones from SOA state to non-SOA state requires confirmation of whether the market has stabilized as a major producer or whether overall technology congestion or market diversification is in progress.
As a result of analyzing the rate of technological change, productivity change, efficiency change, and technological change of the company to be analyzed, it was found that it can be sufficiently referenced in selecting vendors to apply civilian technology to the defense sector. For example, the U.S. Department of Defense and the Korean Ministry of National Defense promoted joint development of smartphones through a business agreement with Samsung in 2020, which is positive for decision-making in that Samsung has developed flexibly through productivity changes, technological changes, and efficiency changes.
However, the technology forecasting methodology does not predict that LG will withdraw from the smartphone market in 2021. Therefore, we need to know that companies develop product technology at a strategic level and even consider exiting the business, and it is necessary to try to identify factors that can influence strategic decision-making through technology forecasting. Additionally, further discussion is needed on the development of the technology prediction methodology for disruptive technology and technology prediction based on the purpose for military application. In this respect, these will be the limitations of the technical prediction methodology and an opportunity for new research. For example, it is of interest to see how the higher military requirements such as military security requirements than commercial products will affect the technological change dual-use technology in the future. Research on the military’s ability to absorb superior civilian technology and measures of open innovation for the spin-on technology development will also be important.
The nature of the practical and professional application of the technology under study implies the existence of additional functions and extensions, which significantly limit the price competitiveness of such products in the commercial market. Discussion on the desirable direction of technological innovation or distortion of the market by defense R & D investment is beyond the scope of this study, but a separate discussion will be necessary, like the recent ethical and legal discussion on autonomous weapons systems. By pointing out the limitations of exploratory research methodologies and grafting normative techniques to predict technologies that satisfy military requirements, we tried to satisfy the author’s need for the visibility of the TFDEA approach. If a technical point of view not considered in this study is added, the result of technical prediction itself may become meaningless. Therefore, to find meaning in the results of this study, it is necessary to limit the search for technological products in the market that can meet the clearly required military performance goals.
In addition, we provided an author-written Stata program of TFDEA and verified our program and found that it is acceptable to compare with the existing one. Because TFDEA is one of the younger forecasting methodologies in Technometrics, only a few programs are available. We extend the accessibility of TFDEA by suggesting the Stata TFDEA module.

Supplementary Materials

The following are available online at [16,17]: http://sourceforge.net/p/deas/code/HEAD/tree/trunk/ (accessed on 10 March 2022) dea.ado, malmq.ado, dea_supereff.ado module.

Author Contributions

Conceptualization, C.L. and S.K.; methodology, C.L. and B.J.; software, C.L. and B.J.; validation, C.L. and S.K.; formal analysis, S.K., D.H. and C.L.; investigation, D.H. and C.L.; resources, S.K. and C.L.; data curation, D.H., C.L. and S.K.; writing—original draft preparation, S.K., C.L. and B.J.; writing—review and editing, S.K., D.H. and C.L. All authors have read and agreed to the published version of the manuscript.

Funding

This research received no external funding.

Institutional Review Board Statement

Not applicable.

Informed Consent Statement

Not applicable.

Data Availability Statement

Data available in a publicly accessible repository.

Acknowledgments

The authors would like to thank Daniel J. Lee for introducing and helping with data collection techniques.

Conflicts of Interest

The authors declare no conflict of interest.

References

  1. Samsung. The Military Smartphone Tested and Proven by Operators. Available online: https://www.samsung.com/us/business/solutions/industries/government/tactical-edition/ (accessed on 16 August 2021).
  2. Lee, K.R. A study on The Management over Embedded Software in Weapon Systems. Mil. Oper. Res. Soc. Korea 2015, 41, 15–28. [Google Scholar]
  3. Lee, K.R.; Lee, C.J. A Study on Performance Evaluation of Parts Localization in Weapon Systems. J. Korea Assoc. Def. Ind. Stud. 2014, 21, 211–231. [Google Scholar]
  4. Lee, K.R.; Lim, K.J.; Lee, C.J. The Performance Analysis of the Military and Commercial Specification Unification Project. J. Korea Assoc. Def. Ind. Stud. 2012, 19, 54–73. [Google Scholar]
  5. Jang, W.J.; Lee, C.J. A study on the Application of Open Innovation Concept for the Defense Science and Technology Innovation. J. Korea Technol. Innov. Soc. 2009, 12, 312–334. [Google Scholar]
  6. Ministry of Defense (MOD). Defense S&T Promotion Policy 2014~2028; Defense Publication Support Group: Seoul, Korea, 2014.
  7. Ministry of Defense (MOD). Defense S&T Promotion Policy 2019~2033; Defense Publication Support Group: Seoul, Korea, 2019.
  8. ICMTC. Available online: https://www.icmtc.re.kr/mps (accessed on 9 September 2021).
  9. CISA. A Guide to Critical Infrastructure Security and Resilience. Available online: https://www.cisa.gov/sites/default/files/publications/Guide-Critical-Infrastructure-Security-Resilience-110819-508v2.pdf (accessed on 7 March 2022).
  10. Defense Disaster Management Directive. Available online: https://www.law.go.kr/LSW/admRulLsInfoP.do?admRulSeq=2100000199050 (accessed on 6 March 2022).
  11. Strategy Analytics. Half the World Owns a Smartphone. Available online: https://www.strategyanalytics.com/access-services/devices/mobile-phones/smartphone/smartphones/reports/report-detail/half-the-world-now-owns-a-smartphone (accessed on 9 September 2021).
  12. National Research Council. Persistent Forecasting of Disruptive Technologies; The National Academies Press: Washington, DC, USA, 2010. [Google Scholar] [CrossRef]
  13. The Korea Herald. Military to use Samsung smartphone-based combat information device. Available online: http://www.koreaherald.com/view.php?ud=20201204000212 (accessed on 12 February 2022).
  14. Ministry of National Defense (MOD). Parts Obsolescence Management Work Order. Available online: https://www.law.go.kr/LSW/admRulLsInfoP.do?admRulSeq=2100000178980 (accessed on 5 September 2021).
  15. Shott, T.; Lim, D.-J. TFDEA: Technology Forecasting Using DEA. Available online: https://rdrr.io/cran/TFDEA/ (accessed on 7 September 2021).
  16. Lee, C. Data Envelopment Analysis Using Stata. Available online: https://sourceforge.net/p/deas/code/HEAD/tree/trunk/ (accessed on 9 September 2021).
  17. Ji, Y.-b.; Lee, C. Data envelopment analysis. Stata J. 2010, 10, 267–280. [Google Scholar] [CrossRef] [Green Version]
  18. Watts, R.-J.; Porter, A.-L. Innovation forecasting. Technol. Forecast. Soc. Chang. 1997, 56, 25–47. [Google Scholar] [CrossRef]
  19. Martino, J.-P. Technological Forecasting for Decision Making; McGraw-Hill, Inc.: New York, NY, USA, 1993. [Google Scholar]
  20. Cho, Y.; Daim, T. Technology Forecasting Methods. In Research and Technology Management in the Electricity Industry; Green Energy and Technology; Daim, T., Oliver, T., Kim, J., Eds.; Springer: London, UK, 2013; pp. 67–112. [Google Scholar]
  21. Anderson, T.; Hollingsworth, K.; Inman, L. Assessing the rate of change in the enterprise database system market over time using DEA. In Proceedings of the PICMET ‘01. Portland International Conference on Management of Engineering and Technology, Portland, OR, USA, 29 July–2 August 2001; Volume 2, pp. 384–390. [Google Scholar]
  22. Inman, O.L.; Anderson, T.R.; Harmon, R.R. Predicting U.S. jet fighter aircraft introductions from 1944 to 1982: A dogfight between regression and TFDEA. Technol. Forecast. Soc. Chang. 2006, 73, 1178–1187. [Google Scholar] [CrossRef] [Green Version]
  23. Anderson, T.R.; Daim, T.U.; Kim, J. Technology forecasting for wireless communication. Technovation 2008, 28, 602–614. [Google Scholar] [CrossRef] [Green Version]
  24. Lim, D.-J.; Anderson, T.R.; Inman, O.L. Choosing effective dates from multiple optima in Technology Forecasting using Data Envelopment Analysis (TFDEA). Technol. Forecast. Soc. Chang. 2014, 88, 91–97. [Google Scholar] [CrossRef] [Green Version]
  25. Lim, D.-J.; Anderson, T.R. Improving forecast accuracy by a segmented rate of change in technology forecasting using data envelopment analysis (TFDEA). In Proceedings of the PICMET ‘14 Conference: Portland International Center for Management of Engineering and Technology; Infrastructure and Service Integration, Kanazawa, Japan, 27–31 July 2014; pp. 2903–2907. [Google Scholar]
  26. Lim, D.-J.; Jahromi, S.R.; Anderson, T.R.; Tudorie, A.-A. Comparing technological advancement of hybrid electric vehicles (HEV) in different market segments. Technol. Forecast. Soc. Chang. 2014, 97, 140–153. [Google Scholar] [CrossRef] [Green Version]
  27. Lim, D.-J.; Anderson, T.R.; Shott, T. Technological forecasting of supercomputer development: The March to Exascale computing. Omega 2015, 51, 128–135. [Google Scholar] [CrossRef] [Green Version]
  28. Lamb, A.-M.; Anderson, T.; Daim, T. Difficulties in R & D target-setting addressed through technology forecasting using data envelopment analysis. In Proceedings of the PICMET 2010 Technology Management for Global Economic Growth, Phuket, Thailand, 18–22 July 2010; pp. 1–9. [Google Scholar]
  29. Jung, B.K.; Kim, H.C.; Lee, C. A Study on Technology Forecasting of Unmanned Aerial Vehicles (UAVs) Using TFDEA. J. Korea Technol. Innov. Soc. 2016, 19, 799–821. [Google Scholar]
  30. Farrell, M.J. The measurement of productive efficiency. J. R. Stat. Soc. Ser. A 1957, 120, 253–290. [Google Scholar] [CrossRef]
  31. Charnes, A.; Cooper, W.W.; Rhodes, E. Measuring the efficiency of decision making units. Eur. J. Oper. Res. 1978, 2, 429–444. [Google Scholar] [CrossRef]
  32. Banker, R.D.; Charnes, A.; Cooper, W.W. Some Models for Estimating Technical and Scale Inefficiencies in Data Envelopment Analysis. Manag. Sci. 1984, 30, 1078–1092. [Google Scholar] [CrossRef] [Green Version]
  33. Shephard, R.W. Theory of Cost and Production Functions; Princeton University: Princeton, NY, USA, 1970. [Google Scholar]
  34. Lee, J.-D.; Oh, D.-H. Theory of Efficiency Analysis: Data Envelopment Analysis, 2nd ed.; JiPhil Publishing: Paju-si, Korea, 2012. [Google Scholar]
  35. Available online: https://www.dictionary.com/browse/efficient (accessed on 6 September 2021).
  36. Dodson, E.N. A general approach to measurement of the state of the art and technological advance. Technol. Forecast. 1970, 1, 391–408. [Google Scholar] [CrossRef]
  37. Inman, O.L. Technology Forecasting Using Data Envelopment Analysis. Ph.D. Thesis, Portland State University, Portland, OR, USA, 2004. [Google Scholar]
  38. Andersen, P.; Petersen, N.C. A procedure for ranking efficient units in data envelopment analysis. Manag. Sci. 1993, 39, 1261–1264. [Google Scholar] [CrossRef]
  39. Rousseau, J.J.; Semple, J.H. Radii of classification preservation in data envelopment analysis: A case study of ‘Program Follow-Through’. J. Oper. Res. Soc. 1995, 46, 943–957. [Google Scholar] [CrossRef]
  40. Fare, R.; Grosskopf, S.; Norris, M.; Zhang, Z. Productivity Growth, Technical Progress, and Efficiency Change in Industrialized Countries. Am. Econ. Rev. 1994, 84, 66–83. [Google Scholar]
  41. Coelli, T.J.; Rao, D.S.P.; O’Donnell, C.J.; Battese, G.E. An Introduction to Efficiency and Productivity Analysis, 2nd ed.; Springer Science & Business Media: Berlin, Germany, 2005; pp. 109–113. [Google Scholar]
  42. Lee, C.J. Malmquist Productivity Analysis using DEA frontier in Stata. In Proceedings of the 2011 Stata Conference Chicago, Chicago, IL, USA, 14–15 July 2011; Available online: https://www.stata.com/meeting/chicago11/ (accessed on 9 March 2022).
  43. Statista. Global Smartphone Market Share from 4th Quarter 2009 to 2nd Quarter 2021. Available online: https://www.statista.com/statistics/271496/global-market-share-held-by-smartphone-vendors-since-4th-quarter-2009/ (accessed on 12 August 2021).
  44. IDC. Smartphone Market Share. Available online: https://www.idc.com/promo/smartphone-market-share (accessed on 3 May 2021).
  45. Sainani, M. GSMarena Mobile Phone Devices: 10,000+ Mobile Device Specifications Scraped from the GSMARENA Website. Available online: https://www.kaggle.com/msainani/gsmarena-mobile-devices (accessed on 3 August 2021).
  46. GSMARENA. Available online: https://www.gsmarena.com/ (accessed on 12 December 2021).
  47. Srivastava, S.; Misra, M. Assessing and forecasting technology dynamics in smartphones: A TFDEA approach. Technol. Anal. Strateg. Manag. 2016, 28, 783–797. [Google Scholar] [CrossRef]
Figure 1. Desired defense production frontier.
Applsci 12 03207 g001
Figure 2. Mean efficiency and technology changes for the period of 2013–2020: (a) MPI; (b) Global MPI.
Applsci 12 03207 g002aApplsci 12 03207 g002b
Figure 3. Comparison of productivity changes by period using global MPI: (a) transition of technology change and efficiency change. The figure is displayed in the form of “Company name year, efficiency change, technological change”. For example, “Samsung1317, 1.0, 1.1” means “Samsung’s average efficiency change from 2013 to 2017 is 1.0, and technological change is 1.1”; (b) productivity change for the period of 2013–2017 and 2017–2020; (c) technology change for the period of 2013–2017 and 2017–2020; (d) efficiency change for the period of 2013–2017 and 2017–2020.
Applsci 12 03207 g003aApplsci 12 03207 g003b
Figure 4. Dynamics of efficiency and technology changes: (a) Xiaomi; (b) Oppo; (c) Vivo; (d) Huawei; (e) Samsung; (f) Apple; (g) Motorola; (h) Sony; (i) LG.
Applsci 12 03207 g004aApplsci 12 03207 g004bApplsci 12 03207 g004cApplsci 12 03207 g004d
Table 1. Smartphone Dataset from 2005 to 2020.
OEMDMUYearPriceBody weightNetwork BandScreen SizeResolutionSensorsNetwork SpeedCPU SpeedCamera PerformanceBattery CapacityWLAN Genaration
1MotorolaA1200200516012212.476,80010.53120.18500.1
2LGU83020061609322.276,80012118000.1
3MotorolaRAZR V3xx200616010722.276,8001210.19400.1
4Samsungi607 BlackJack200624010522.376,800112200.112000.1
5AppleiPhone200742013513.5153,60020.54120.114002
6LGU96020077012322.276,8001210.110000.1
7MotorolaRIZR Z10200715011922.276,80012300111300.1
8Samsungi780200715012022.55102,400126240.114802
9AppleiPhone 3G20089013323.5153,600214120.111502
10LGKF900 Prada20081401302396,00014129502
11MotorolaRAZR2 V9x200813012522.276,8001210.19500.1
12Samsungi900 Omnia200816012223.296,00014624114402
13MotorolaXT701200923014023.7409,92037600114202
14AppleiPhone 3GS200911013523.5153,600346000.112192
15HuaweiU8220200923013523.5153,6001510.115002
16LGGM75020092901202396,000155280.115002
17SamsungI7500 Galaxy2009140116.723.2153,60026528115002
18AppleiPhone 4201020013723.5614,400461000214204
19HuaweiU9000 IDEOS X620109014324.1384,000481000114005
20LGOptimus 2X201015013924384,000461000115005
21MotorolaDROID PRO XT610201011013443.1153,600371000114205
22SamsungM110S Galaxy S201022012124384,0003610000.115003
23AppleiPhone 4s201119014043.5614,400481000214324
24HuaweiM886 Mercury201111013924409,920451400219004
25LGOptimus 4G LTE P935201122013534.5921,6004131500118306
26MotorolaRAZR XT910201122012724.3518,400381200117806
27SamsungI9100 Galaxy S II201117011624.3384,0004121200116508
28OppoFind201210012524.3384,0004121500315004
29AppleiPhone 5201234011254727,0404261300214406
30HuaweiAscend P1 LTE201215013534.3518,4004251500220006
31LGOptimus Vu F100S201224016845786,4324141500120808
32MotorolaDROID RAZR MAXX HD201227015754.7921,6004141500133008
33SamsungI9300 Galaxy S III201219013324.8921,6005121400121008
34SonyXperia T LTE201235014834.55921,6004251500118508
35XiaomiMi 2201225014524.3921,6004241500220004
36vivoY15201311013024.5409,92031.51300119004
37OppoR1 R829T201330014015921,6003121300324106
38AppleiPhone 5s201333011254727,0405261300215606
39HuaweiAscend P6201323012034.7921,6005251500220006
40LGG2201327014355.22,073,6004262260230009
41MotorolaMoto X201325013034.7921,6006261700322008
42SamsungI9502 Galaxy S42013460132252,073,6008241600226009
43SonyXperia Z12013330170352,073,6004252200330009
44XiaomiMi 32013200145252,073,6004242300230507
45vivoX5201422914135921,60041.81500322507
46AppleiPhone 6201436012954.71,000,5006261400218107
47HuaweiAscend Mate7 Monarch2014500185362,073,6005251800341008
48LGG3201430014935.53,686,4004252500330009
49MotorolaNexus 6201442018445.963,686,4005252700332209
50SamsungGalaxy S5201425014535.12,073,6008252500328008
51SonyXperia Z3201418015235.22,073,6005252500331009
52OppoR5201440015535.22,073,6003131700320007
53XiaomiMi 4 LTE2014230149352,073,6004252500330809
54AppleiPhone 6s201550014354.71,000,5006261840217157
55HuaweiP8lite201517013135921,6003251200322005
56LGV10201525019235.73,686,4007251800330009
57MotorolaDroid Turbo 22015330170.155.43,686,4004262000237607
58SamsungGalaxy S6201528013835.13,686,4008252100325508
59SonyXperia Z5201522015435.22,073,6006262000329009
60OppoR72015360147352,073,6003131500323206
61vivoX62015322135.535.22,073,6005131700324004
62XiaomiMi 4i2015260130352,073,6004251700331208
63AppleiPhone 7201655013854.71,000,5006262340219607
64HuaweiP9 lite201621014735.22,073,6005252000230005
65LGV20201635017435.73,686,4007262150332009
66MotorolaMoto Z201622013655.53,686,4005262150326008
67SamsungGalaxy S7201629015235.13,686,4008252300330008
68SonyXperia XZ201625016135.22,073,6007252150329009
69OppoR9s201645014555.52,073,6005252000330108
70vivoX9201646015445.52,073,6004252000330508
71XiaomiMi 5s201625014555.152,073,6006252150332009
72AppleiPhone 8201770014834.71,000,5006262390218217
73HuaweiMate 10 Pro2017400178362,332,8006252400440009
74OppoR11s201745015356.012,332,8005252200332008
75LGV302017420158364,147,2007252450333009
76MotorolaMoto G5S201715015735.22,073,6005251400330006
77SamsungGalaxy S8201739015535.84,262,4009252300330008
78SonyXperia XZ1201726015535.22,073,6007252450327009
79vivoX20201739015946.012,332,8005252200332508
80XiaomiMi 6201733016835.152,073,6006252450333509
81OppoR15201846017546.282,462,4005252000334508
82AppleiPhone XR201885019456.11,483,7766252500229427
83HuaweiMate 20 Pro201888018936.394,492,8007252600442009
84LGV40 ThinQ201880016956.44,492,8006252700333009
85MotorolaMoto G6201818016755.72,332,8005251800330007
86SamsungGalaxy S9201849016355.84,262,4009252700330008
87SonyXperia XZ2201846019835.72,332,8007252700331809
88vivoX232018500160.546.412,527,2004252000334008
89XiaomiMi 8201838017546.212,427,8407252800334009
90XiaomiMi 9 Pro 5G201960019656.392,527,2005262960340009
91OppoReno3 5G201944018166.42,592,0005262200340259
92AppleiPhone 11201961419456.11,483,7766262650231108
93HuaweiP30 Pro201988019236.472,527,2006252600442008
94LGV50 ThinQ 5G201995018356.44,492,8006262840340009
95MotorolaMoto G7 Power201921019336.21,130,4005251800350004
96SamsungGalaxy S10 5G201928719856.74,377,6008252730345009
97SonyXperia 12019100018036.56,312,9607252840433309
98vivoX302019420196.556.442,592,0005262200343508
99XiaomiMi 10 Pro 5G202074420846.672,527,20062628403450010
100OppoReno4 5G202037018366.432,592,0005262400340008
101SonyXperia 1 II20201117181.446.56,312,96072628405400010
102HuaweiP40 Pro202075720946.583,168,0007262860442009
103LGV60 ThinQ 5G202070021366.82,656,80062628403500010
104MotorolaEdge+2020120020366.72,527,2006262840250009
105SamsungGalaxy S20 5G202067416366.24,608,0006262730340009
106AppleiPhone SE (2020)202040314854.71,000,5006262650318218
107vivoX50 Pro2020430181.556.562,566,0806262400343158
Table 2. Selected inputs and outputs.
InputOutputs
Price in EUD (price)Network bands-2G–5G (ntwk)
Display size in inches (scrnsize)
Body weight in g (bdywgt)Display resolution in pixels (resolution)
Sensors (sensor)
Network speed in Mbps(ntwk.1)
CPU speed in MHz (cpus)
Main camera performance (pcamp)
Battery capacity in mAh (btycpcty)
Communication WLAN (comlev)
Table 3. Model forecasting results of smartphones with tf (2017) specification.
OEMDMURelease YearEfficiency Releasetheta_tf (1/Eff Frontier)roccurrent (Effective Date)sroc ForecastDate Forecast (tf_exp)
1MotorolaA1200200511.7837088871.0841152012.165
2LGU830200611 2006
3MotorolaRAZR V3xx200611.3549652631.1296532008.492
4Samsungi607 BlackJack200611.4462227841.0981732009.94
5AppleiPhone200711.5571429421.0515372015.812
6LGU960200711 2007
7MotorolaRIZR Z10200711.5747056911.1552972010.145
8Samsungi780200711.5210302971.1070632011.123
9AppleiPhone 3G200811.0590663551.0295472009.971
10LGKF900 Prada200811.4999999251.0789892013.333
11MotorolaRAZR2 V9x200811.5578024951.2178632010.249
12Samsungi900 Omnia200811.3842577781.0810712012.171
13MotorolaXT701200911.4961096661.0592512015.999
14AppleiPhone 3GS200911.225775911.0850872011.493
15HuaweiU8220200911.5571429421.0671652015.812
16LGGM750200911.5396826251.102942013.405
17SamsungI7500 Galaxy200911.2107796681.1136712010.777
18AppleiPhone 4201011.4483685581.088152014.385
19HuaweiU9000 IDEOS X6201011 2010
20LGOptimus 2X201011.2157540331.0447962014.458
21MotorolaDROID PRO XT610201011 2010
22SamsungM110S Galaxy S201011.1800000381.0567222013
23AppleiPhone 4s201111.1545454981.0499992013.945
24HuaweiM886 Mercury201111.066176511.0809172011.824
25LGOptimus 4G LTE P935201111.2106666511.0406312015.8
26MotorolaRAZR XT910201111.170232561.0503522014.2
27SamsungI9100 Galaxy S II201111 2011
28OppoFind201211 2012
29AppleiPhone 5201211 2012
30HuaweiAscend P1 LTE201211 2012
31LGOptimus Vu F100S201211.1169990611.0291542015.85
32MotorolaDROID RAZR MAXX HD201211 2012
33SamsungI9300 Galaxy S III201211.0465998591.0188962014.433
34SonyXperia T LTE201211.0399999581.0628622012.643
35XiaomiMi 2201211.083333361.0791122013.051
36vivoY15201311 2013
37OppoR1 R829T201311.0595238371.0225292015.595
38AppleiPhone 5s201311 2013
39HuaweiAscend P6201311 2013
40LGG2201311 2013
41MotorolaMoto X201311 2013
42SamsungI9502 Galaxy S4201311 2013
43SonyXperia Z1201311.0296735441.0106872015.751
44XiaomiMi 3201311.0240287321.0168632014.42
45vivoX5201411.0621209021.0394522015.558
46AppleiPhone 6201411 2014
47HuaweiAscend Mate7 Monarch201411.0007257261.0002432016.982
48LGG3201411 2014
49MotorolaNexus 6201411 2014
50SamsungGalaxy S5201411 2014
51SonyXperia Z3201411 2014
52OppoR5201411.116310141.043152016.605
53XiaomiMi 4 LTE201411.0006498221.0170882014.038
54AppleiPhone 6s201511 2015
55HuaweiP8lite201511 2015
56LGV10201511 2015
57MotorolaDroid Turbo 2201511 2015
58SamsungGalaxy S6201511 2015
59SonyXperia Z5201511 2015
60OppoR7201511.1011904861.0999422016.012
61vivoX6201511.0139282311.0541542015.262
62XiaomiMi 4i201511 2015
63AppleiPhone 7201611 2016
64HuaweiP9 lite20160.970297 2017
65LGV20201611 2016
66MotorolaMoto Z201611 2016
67SamsungGalaxy S7201611 2016
68SonyXperia XZ201611.013820297 2014.718
69OppoR9s201611 2016
70vivoX9201611.0313460091.153342016.216
71XiaomiMi 5s201611 2016
72AppleiPhone 8201711 2017
73HuaweiMate 10 Pro201711 2017
74OppoR11s201711 2017
75LGV30201711 2017
76MotorolaMoto G5S201711 2017
77SamsungGalaxy S8201711 2017
78SonyXperia XZ1201711 2017
79vivoX20201711 2017
80XiaomiMi 620170.9898305 2017
81OppoR152018 20171.0700132017.65
82AppleiPhone XR2018 2015.5381.0700132017.278
83HuaweiMate 20 Pro2018 20171.0700132019.877
84LGV40 ThinQ2018 2015.361.0700132018.658
85MotorolaMoto G62018 2014.8781.0700132017.072
86SamsungGalaxy S92018 2016.2761.0700132019.573
87SonyXperia XZ22018 2014.3641.0700132015.532
88vivoX232018 20171.0700132017.953
89XiaomiMi 82018 2014.5941.0700132015.924
90XiaomiMi 9 Pro 5G2019 2014.8011.0700132017.314
91OppoReno3 5G2019 2015.21.0700132018.497
92AppleiPhone 112019 2015.2981.0700132017.347
93HuaweiP30 Pro2019 2014.8821.0700132017.751
94LGV50 ThinQ 5G2019 2015.9491.0700132019.29
95MotorolaMoto G7 Power2019 2015.9541.0700132017.776
96SamsungGalaxy S10 5G2019 2015.3821.0700132018.68
97SonyXperia 12019 20171.0700132022.804
98vivoX302019 2016.9111.0700132017.985
99XiaomiMi 10 Pro 5G2020 2015.571.0700132017.71
100OppoReno4 5G2020 2015.21.0700132018.497
101SonyXperia 1 II2020 20171.0700132023.834
102HuaweiP40 Pro2020 2014.5361.0700132018.346
103LGV60 ThinQ 5G2020 2014.51.0700132020.492
104MotorolaEdge+2020 2015.7151.0700132019.181
105SamsungGalaxy S20 5G2020 2014.4731.0700132021.647
106AppleiPhone SE (2020)2020 2014.51.0700132017.797
107vivoX50 Pro2020 2016.9741.0700132018.421
Table 4. Results of Malmquist Productivity Analysis.
PeriodDMUtfpcheffchtechch
12013~2014vivo0.99753810.997538
22013~2014Oppo0.9948560.983681.01136
32013~2014Apple1.0326911.03269
42013~2014Huawei0.9001170.988360.910718
52013~2014LG1.175471.085221.08316
62013~2014Motorola0.90710810.907108
72013~2014Samsung0.85126710.851267
82013~2014Sony1.030921.024881.0059
92013~2014Xiaomi0.9272691.000030.927239
102014~2015vivo0.95464810.954648
112014~2015Oppo1.0409411.04094
122014~2015Apple1.005311.0053
132014~2015Huawei0.9689410.992330.97643
142014~2015LG0.9230420.9214721.0017
152014~2015Motorola1.1277711.12777
162014~2015Samsung1.339631.130771.1847
172014~2015Sony0.9125891.041280.876414
182014~2015Xiaomi1.0397311.03973
192015~2016vivo0.89183310.891833
202015~2016Oppo1.0927611.09276
212015~2016Apple1.150641.146521.00359
222015~2016Huawei0.83249210.832492
232015~2016LG1.0305511.03055
242015~2016Motorola1.0395911.03959
252015~2016Samsung0.8453980.9020840.93716
262015~2016Sony0.9831220.9478151.03725
272015~2016Xiaomi0.90302810.903028
282016~2017vivo1.1154911.11549
292016~2017Oppo1.0112511.01125
302016~2017Apple0.9139490.8722021.04786
312016~2017Huawei1.2352411.23524
322016~2017LG0.82320310.823203
332016~2017Motorola0.95914510.959145
342016~2017Samsung0.9898610.9803451.00971
352016~2017Sony0.97850.9406791.04021
362016~2017Xiaomi1.217391.002091.21485
372017~2018vivo1.051361.0321.01876
382017~2018Oppo1.269621.190181.06674
392017~2018Apple1.0481311.04813
402017~2018Huawei0.99820510.998205
412017~2018LG0.8940910.89409
422017~2018Motorola0.99703110.997031
432017~2018Samsung1.276361.157961.10225
442017~2018Sony1.018320.9854031.03341
452017~2018Xiaomi1.000280.9979181.00236
462018~2019vivo0.9670910.9689940.998036
472018~2019Oppo0.8136690.8402060.968416
482018~2019Apple1.138681.054021.08032
492018~2019Huawei1.0428111.04281
502018~2019LG1.2231711.22317
512018~2019Motorola0.97388310.973883
522018~2019Samsung0.8175160.8635750.946665
532018~2019Sony0.97372510.973725
542018~2019Xiaomi1.022281.052970.970861
552019~2020vivo1.065051.12310.948316
562019~2020Oppo0.95049910.950499
572019~2020Apple0.7914470.9487440.834204
582019~2020Huawei1.005051.072790.936854
592019~2020LG0.9604681.029720.932745
602019~2020Motorola1.4279311.42793
612019~2020Samsung1.266421.000021.2664
622019~2020Sony0.88425110.884251
632019~2020Xiaomi0.9497420.9496981.00005
Publisher’s Note: MDPI stays neutral with regard to jurisdictional claims in published maps and institutional affiliations.

