
Inkjet-Printed Flexible Strain-Gauge Sensor on Polymer Substrate: Topographical Analysis of Sensitivity


Abstract
:1. Introduction
2. Experimental
2.1. Materials
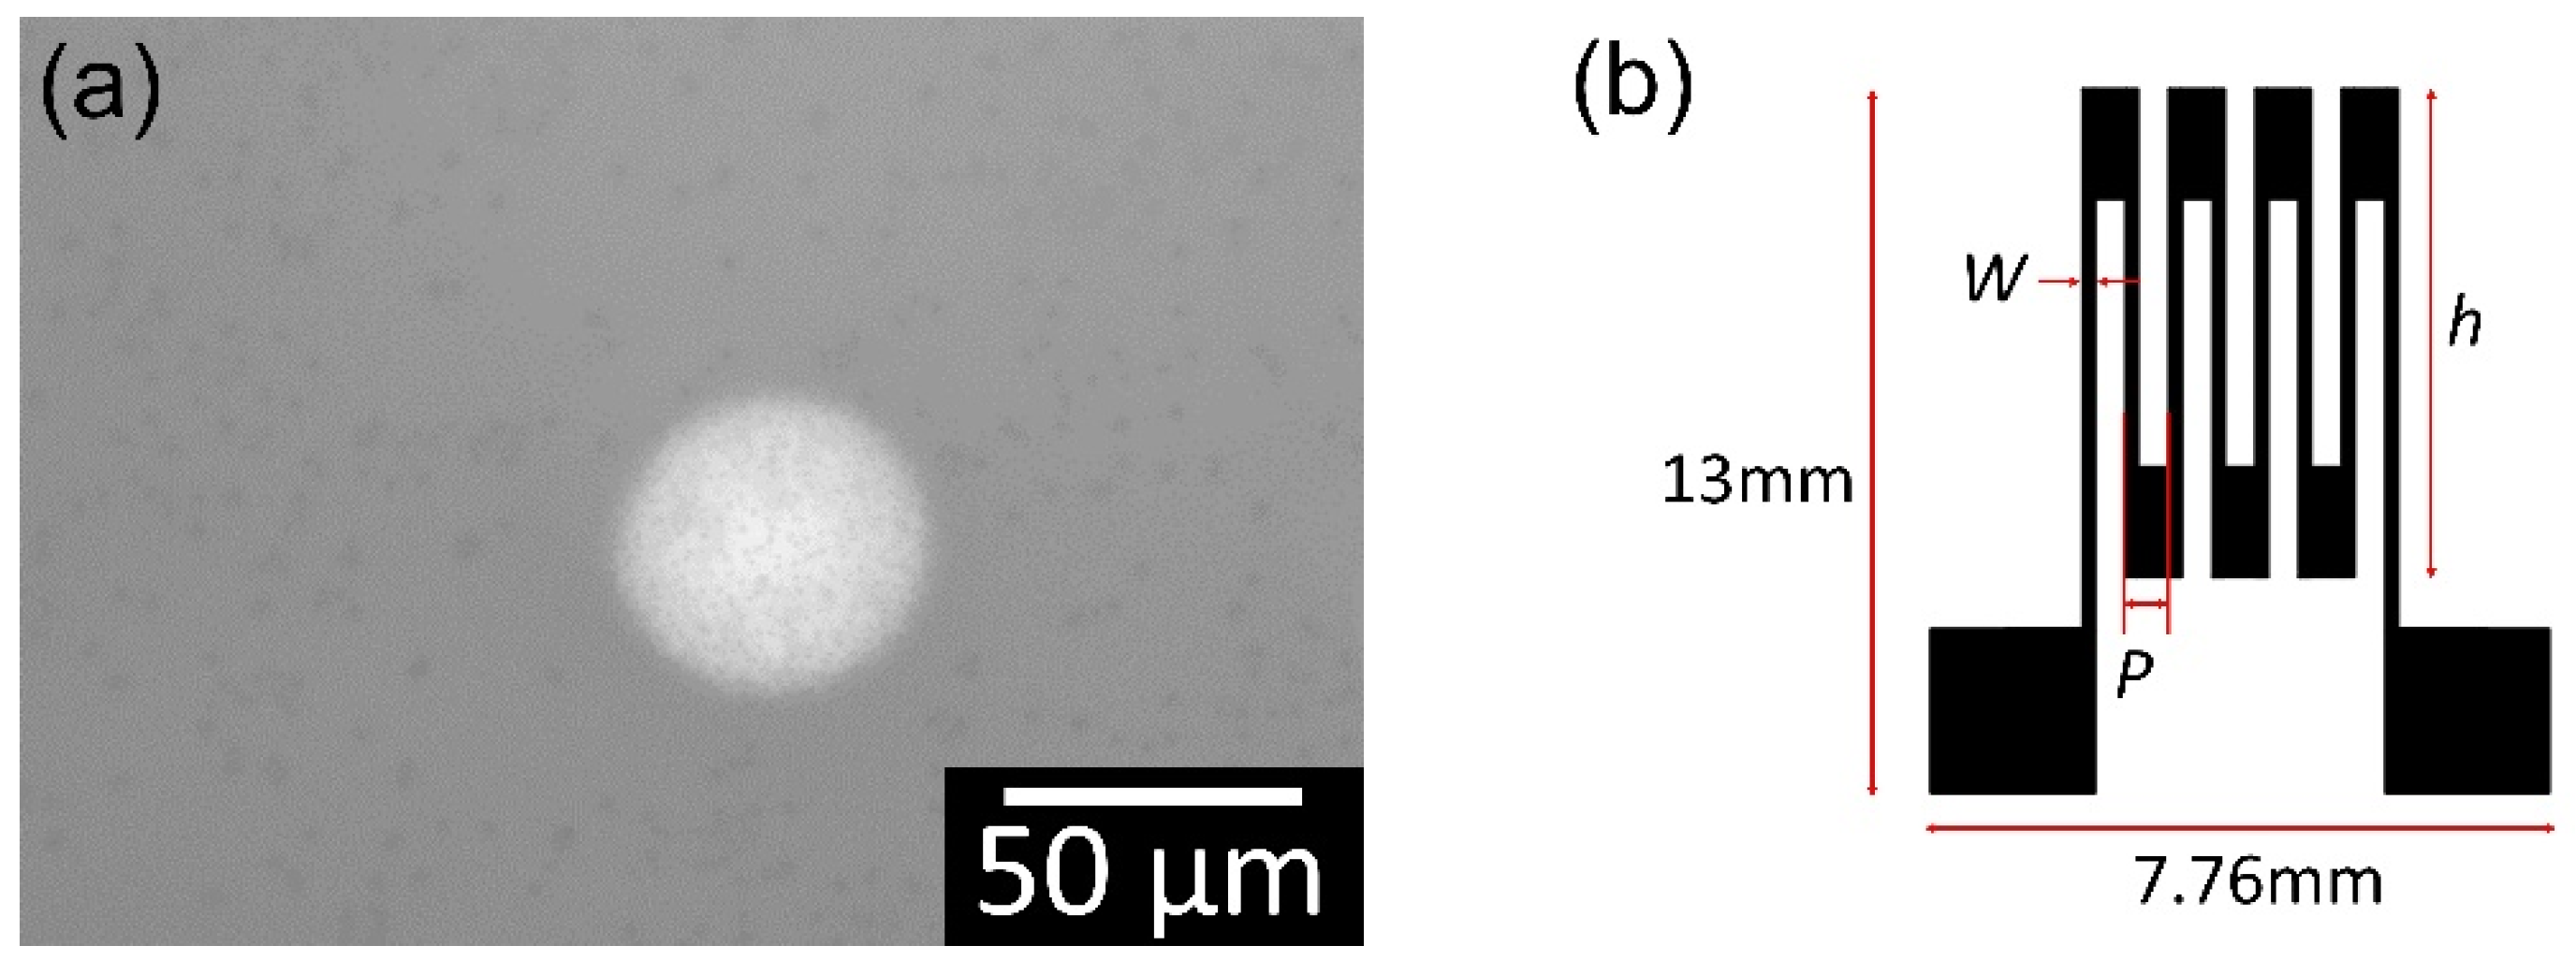
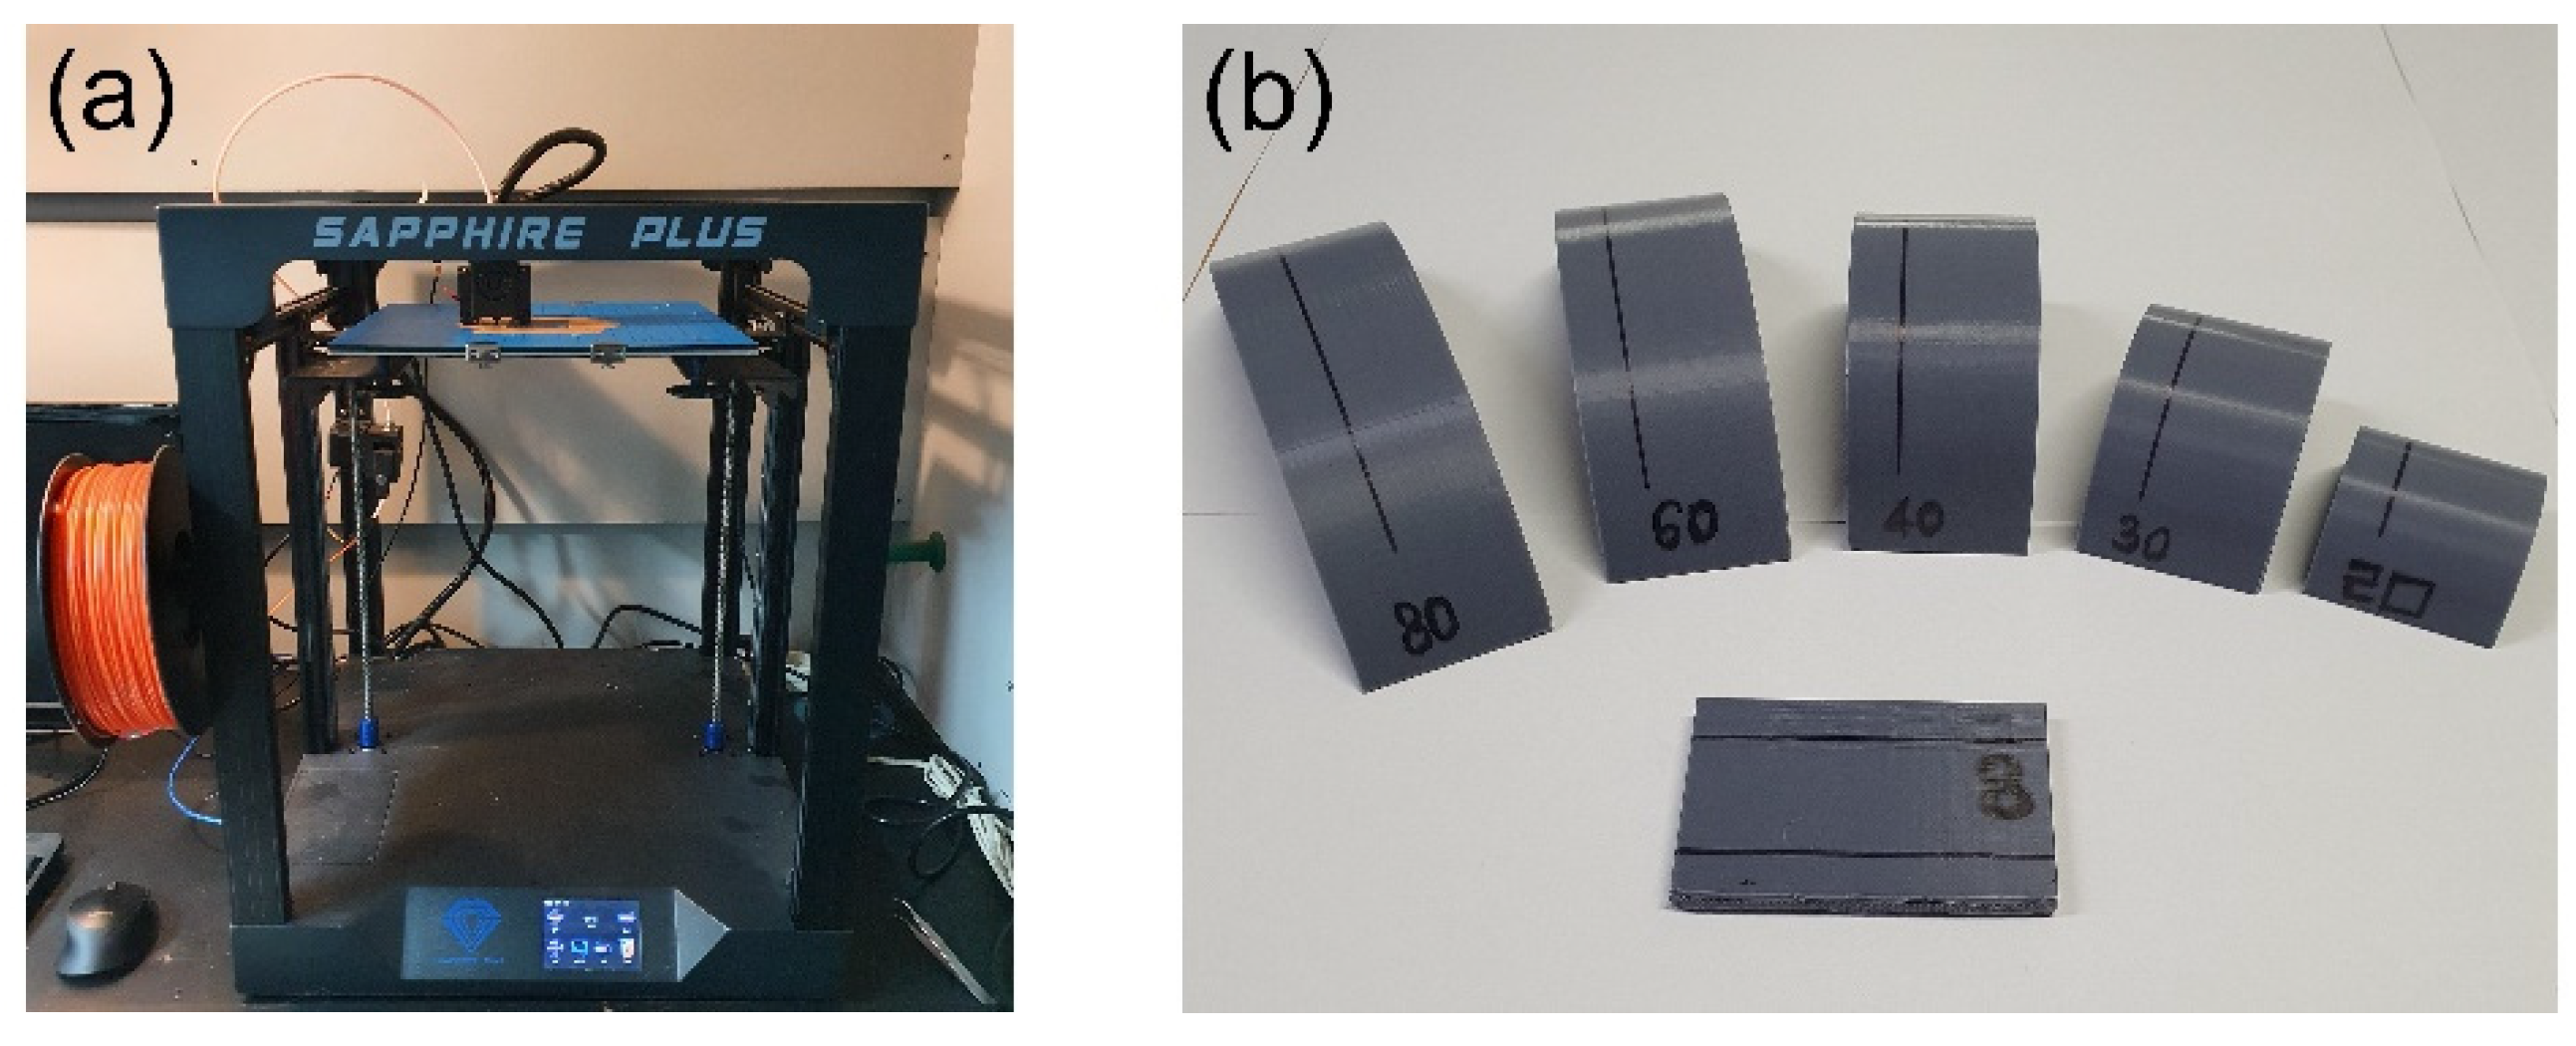
2.2. Fabrication
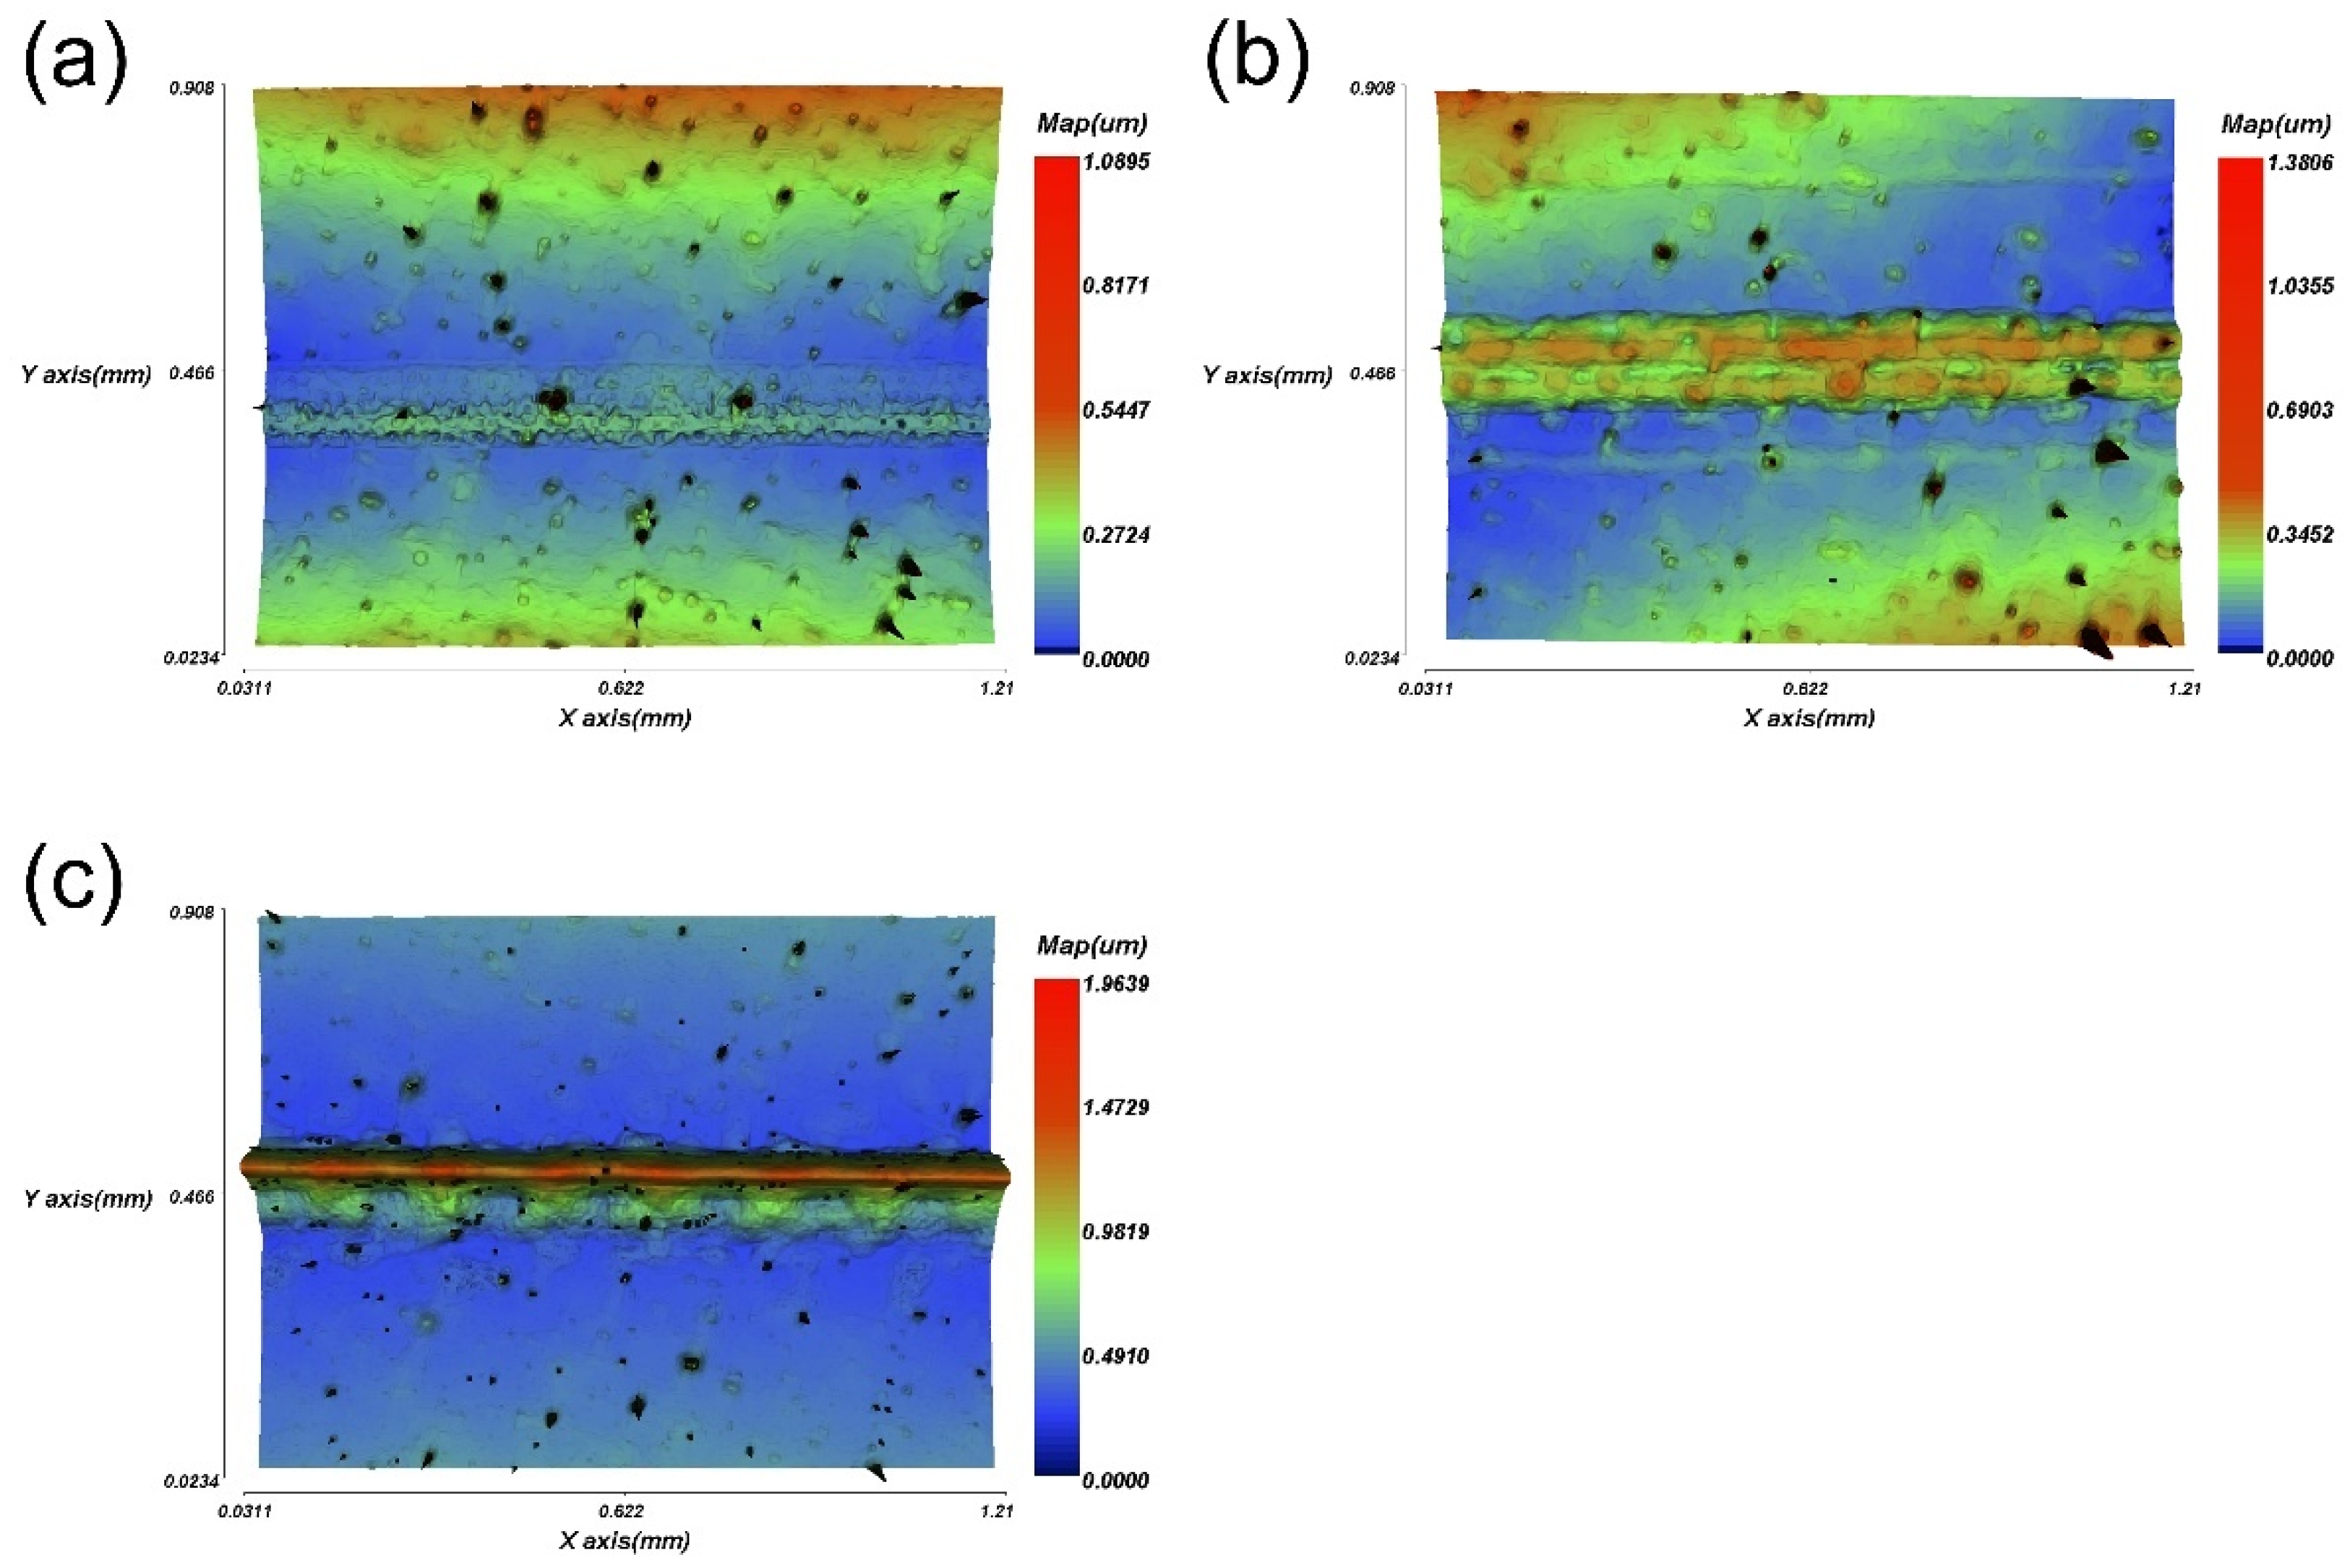
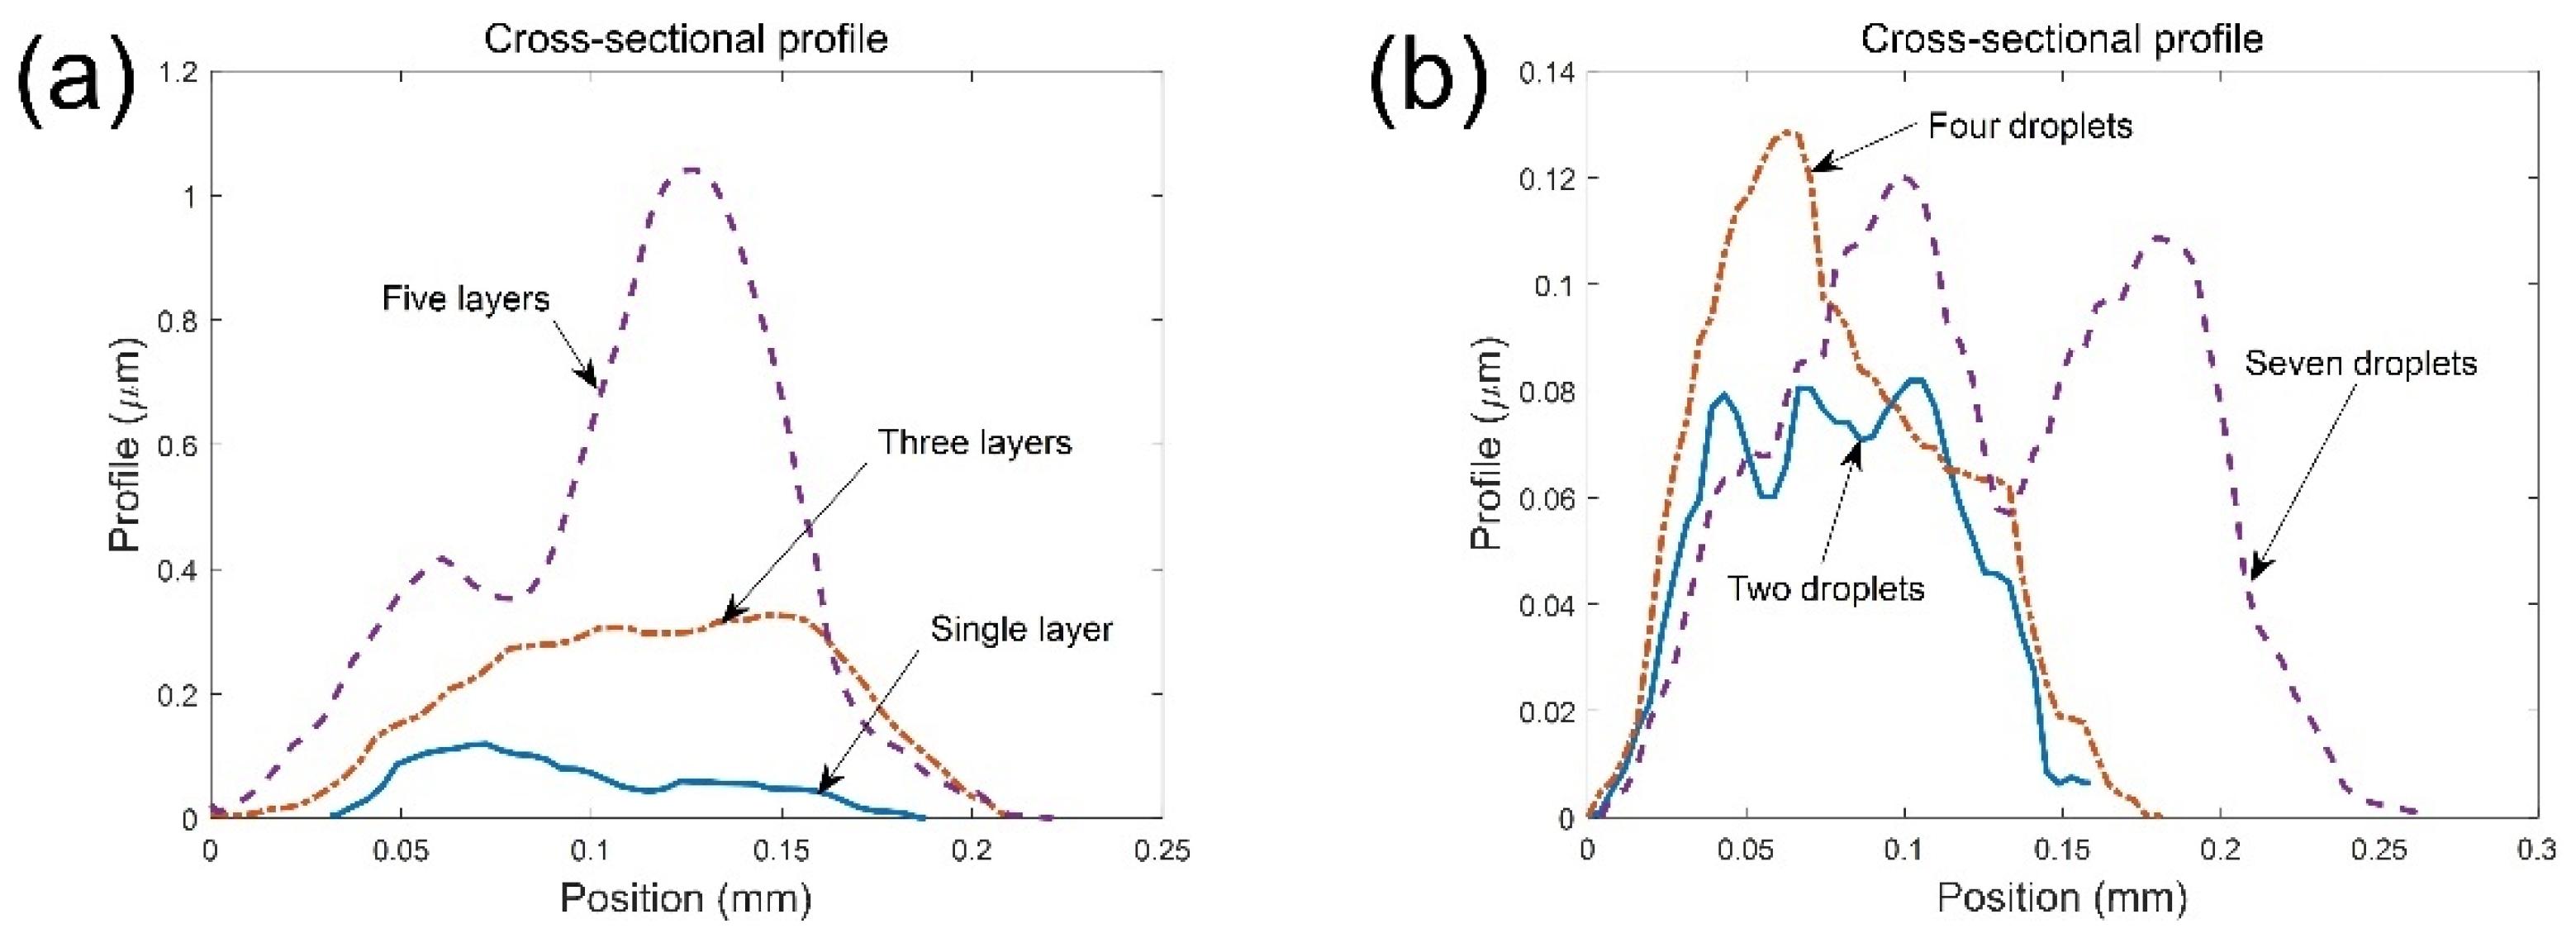
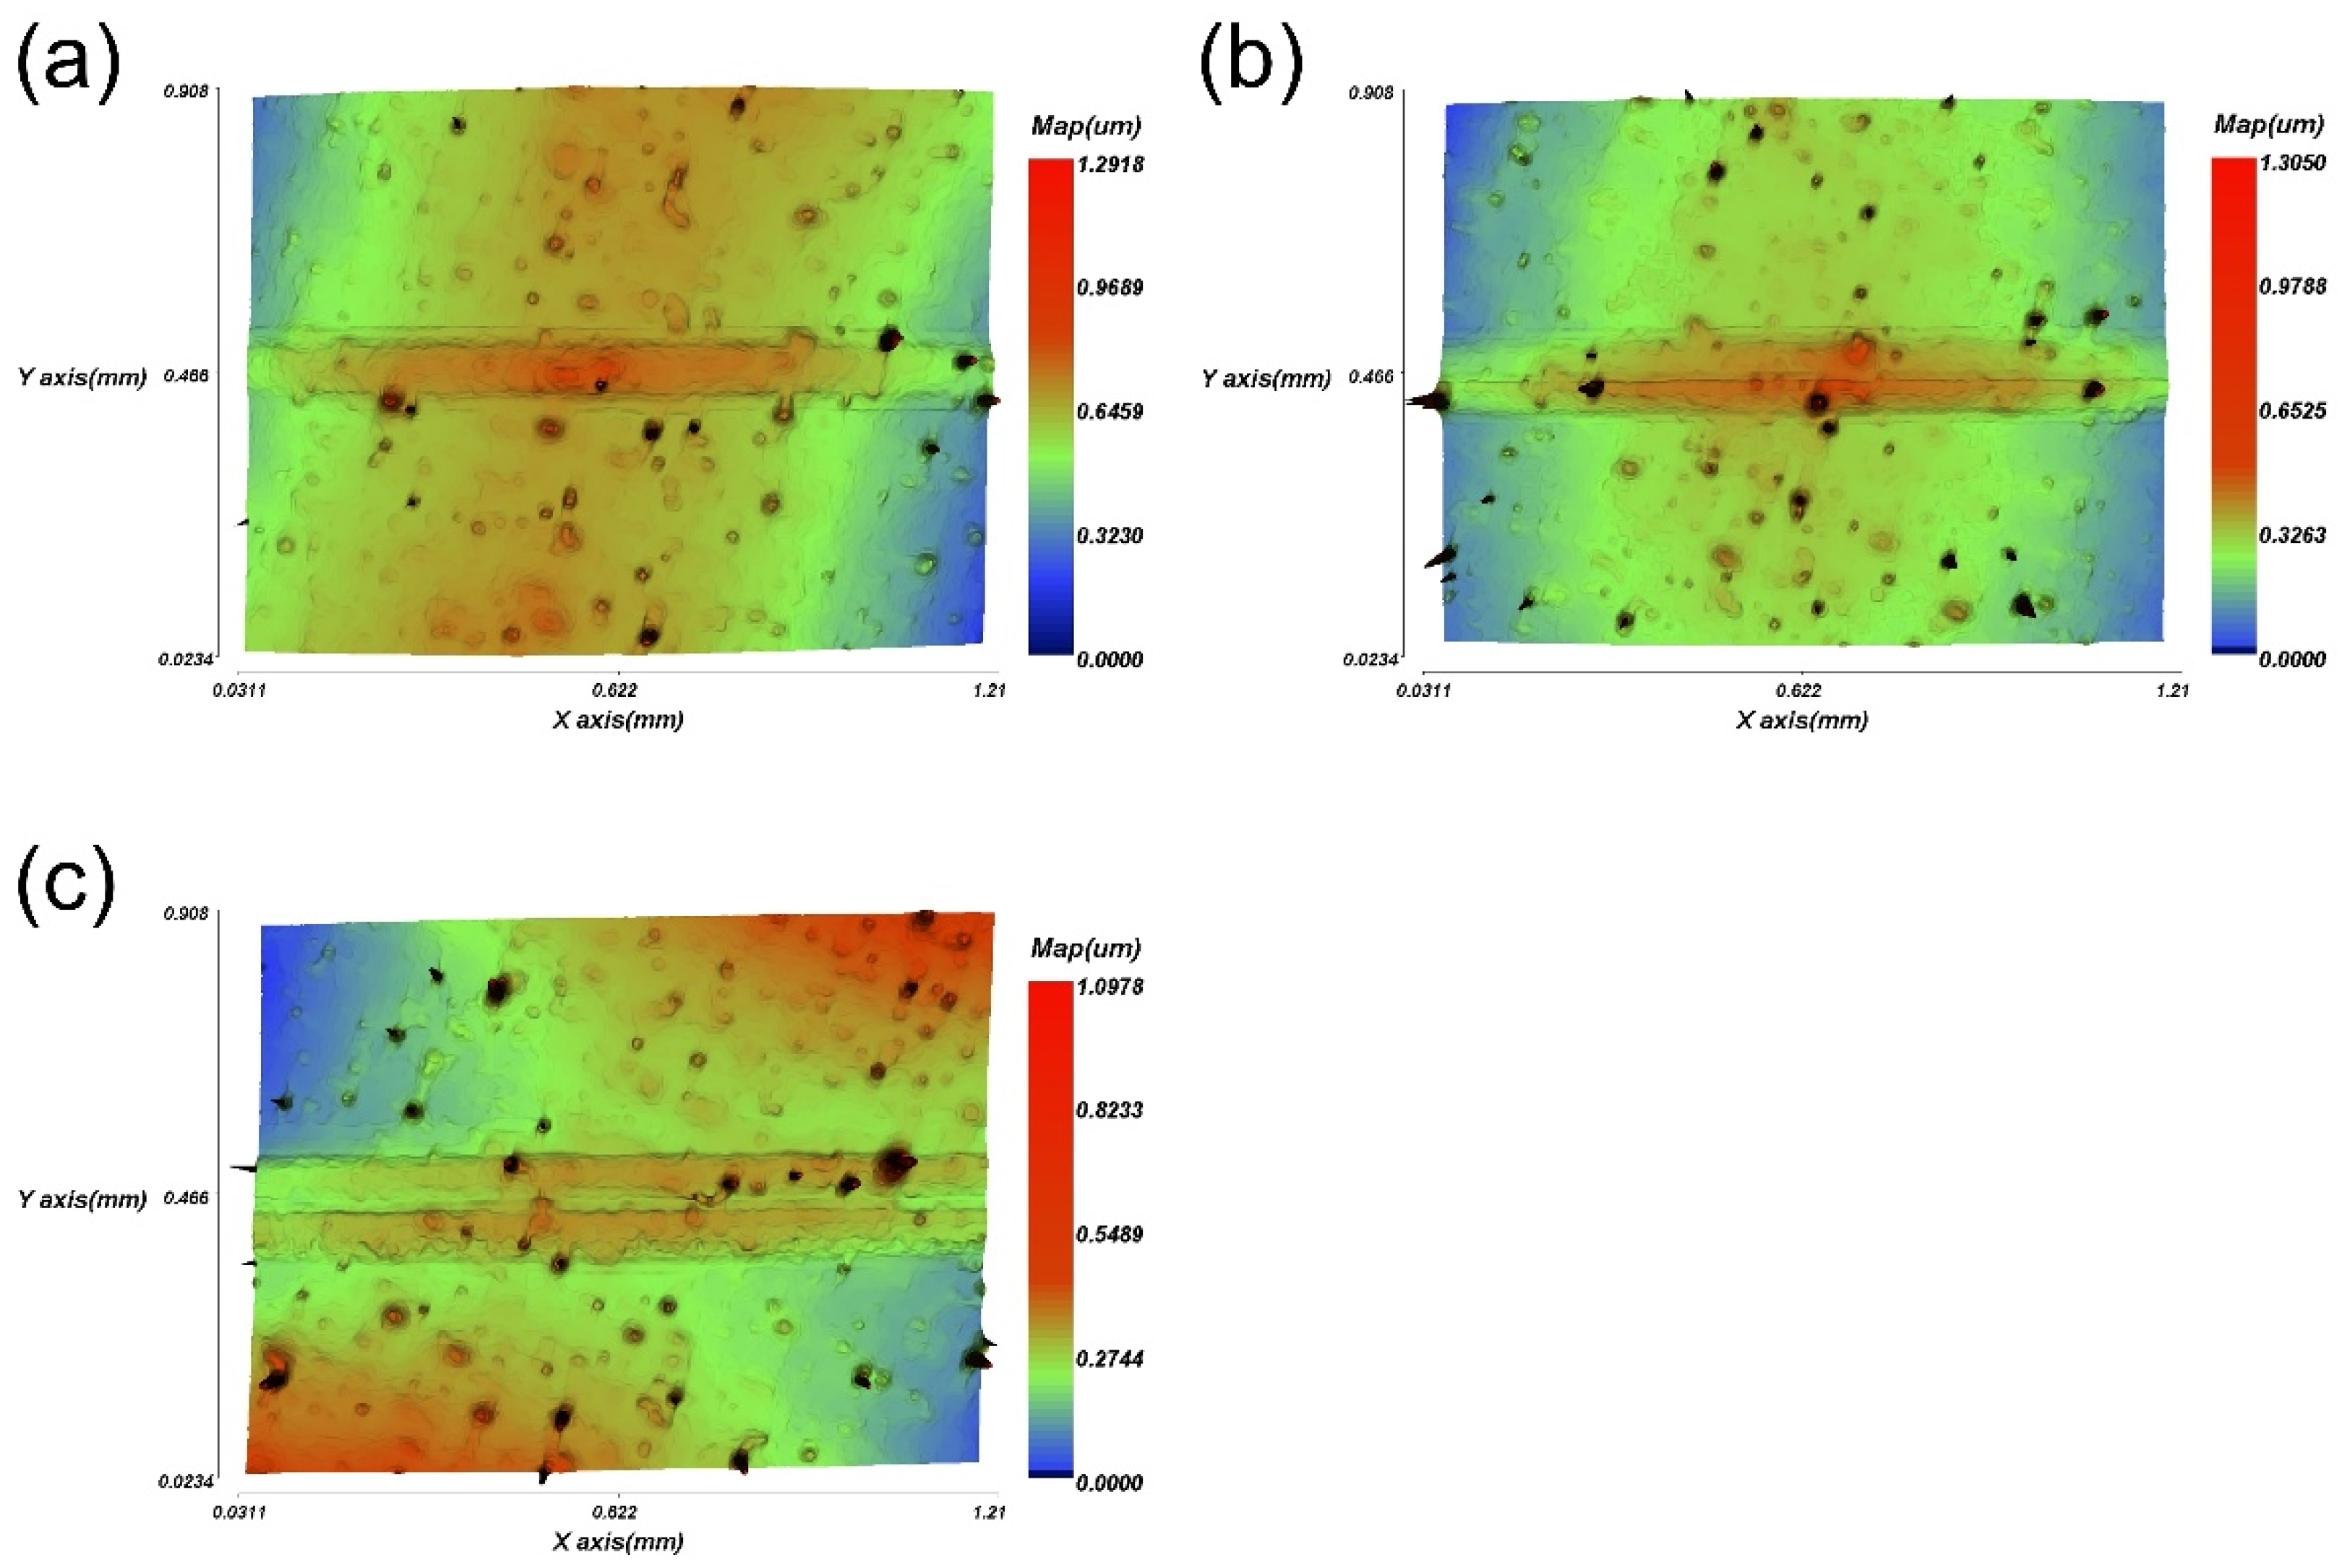
2.3. Characteristics
2.4. Statistical Analysis
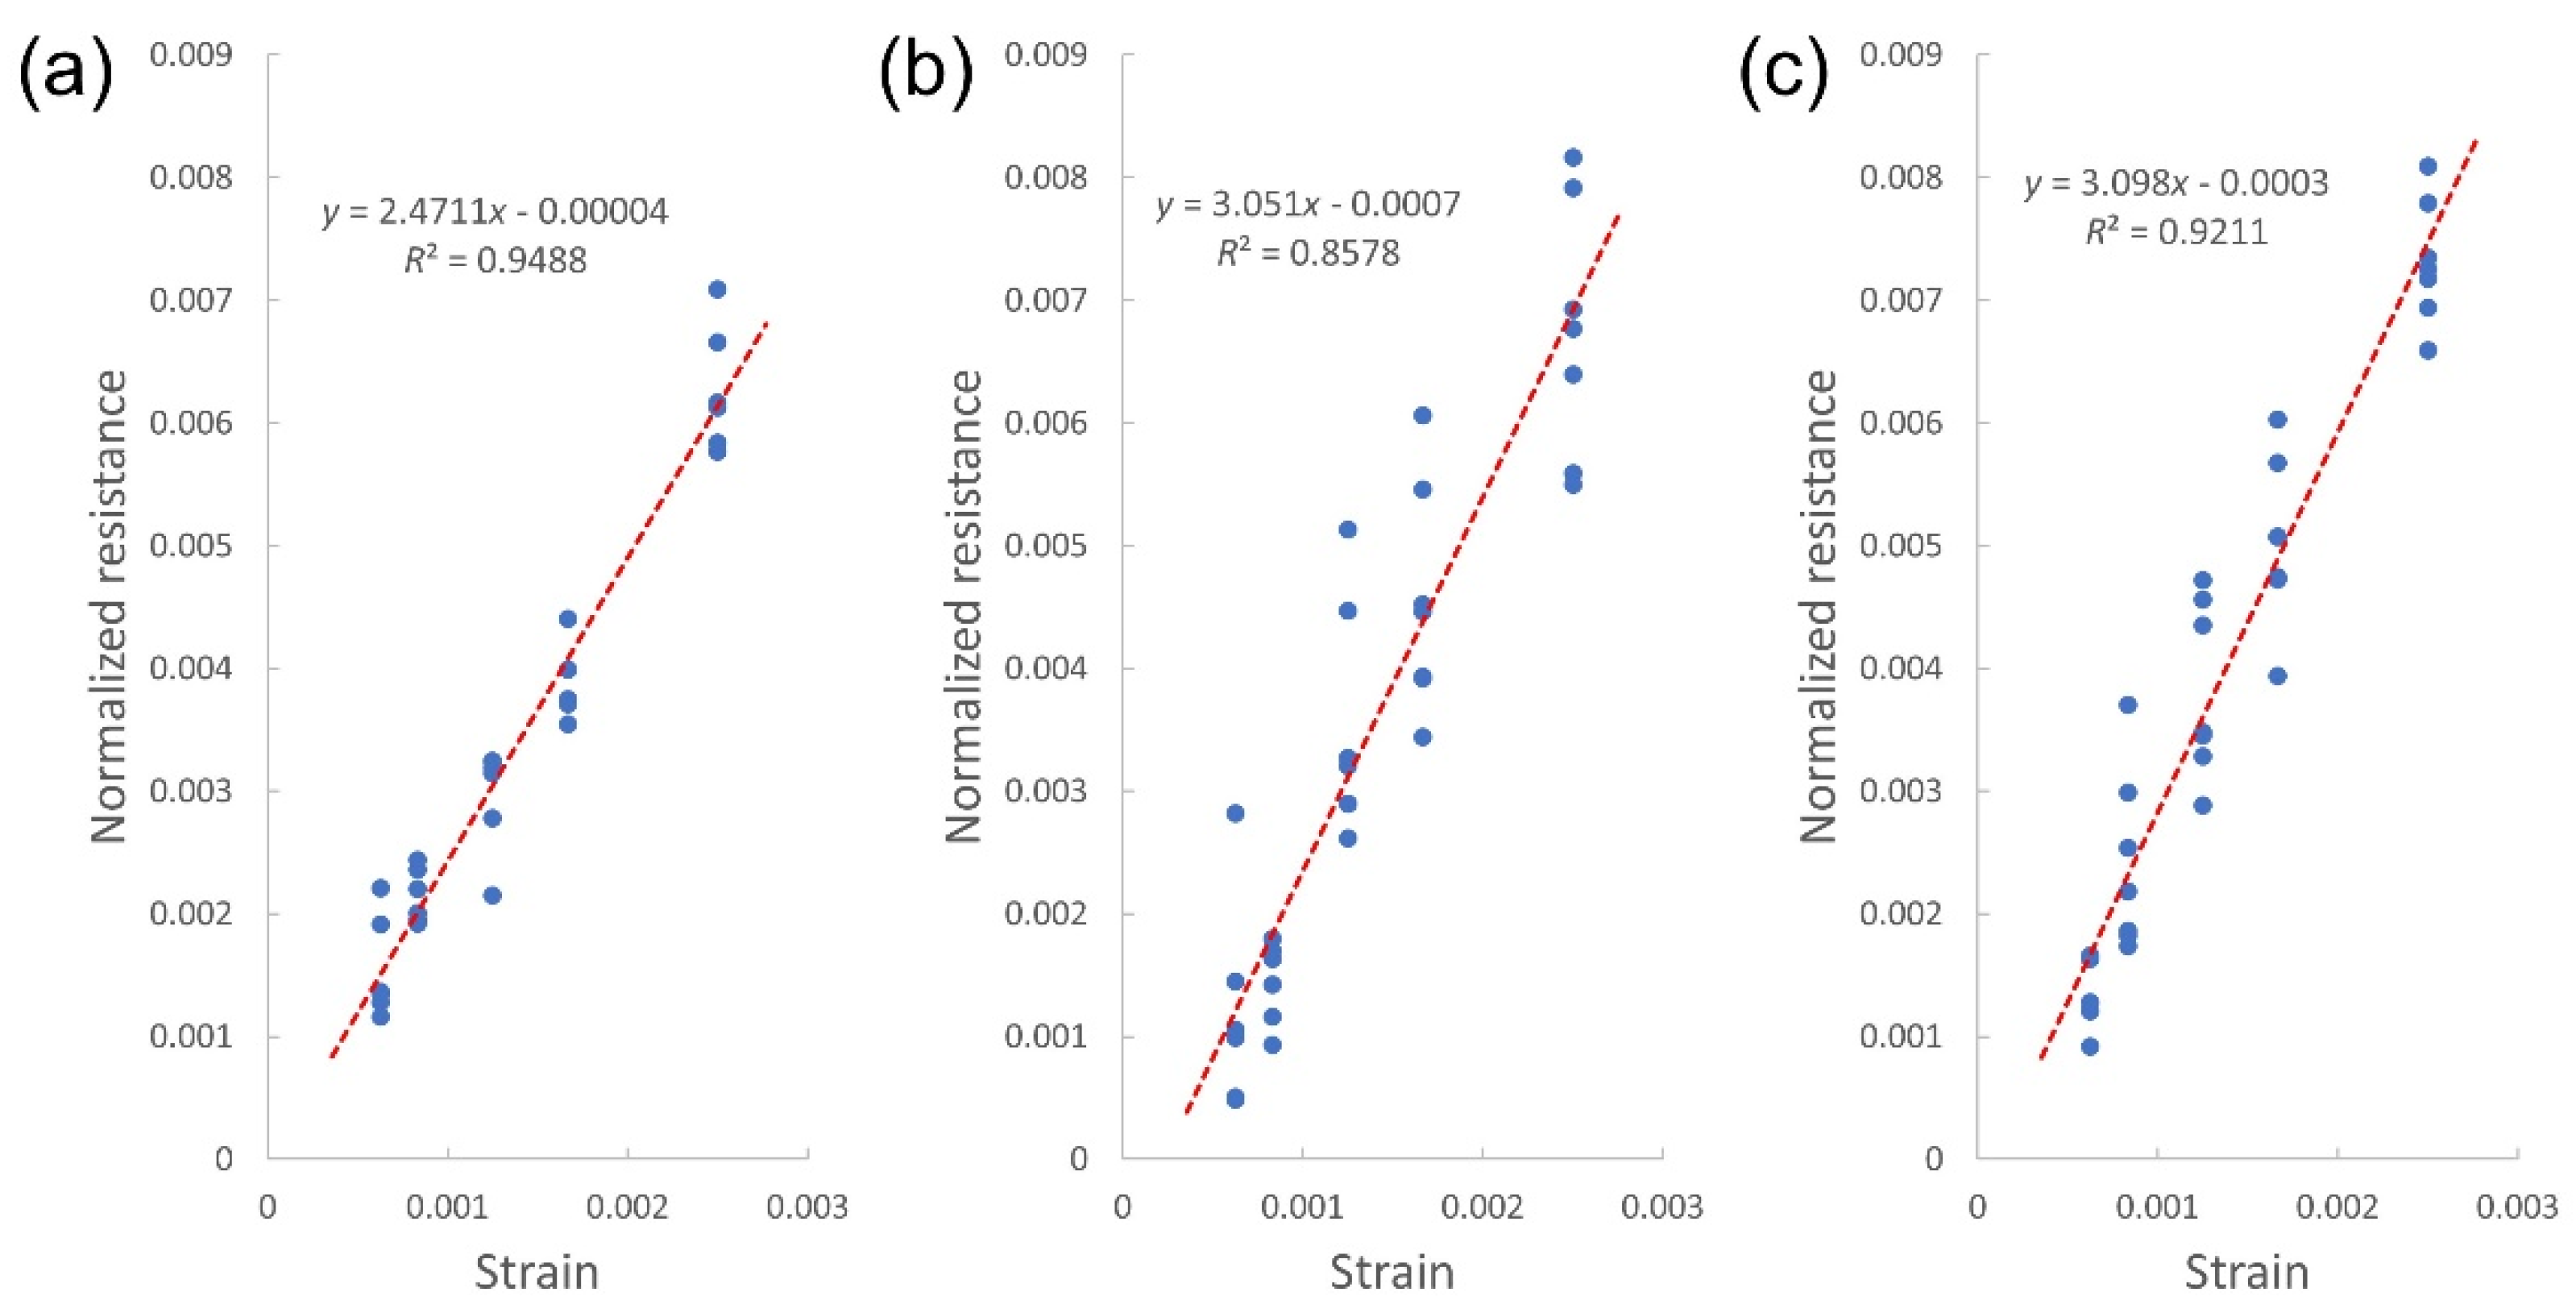
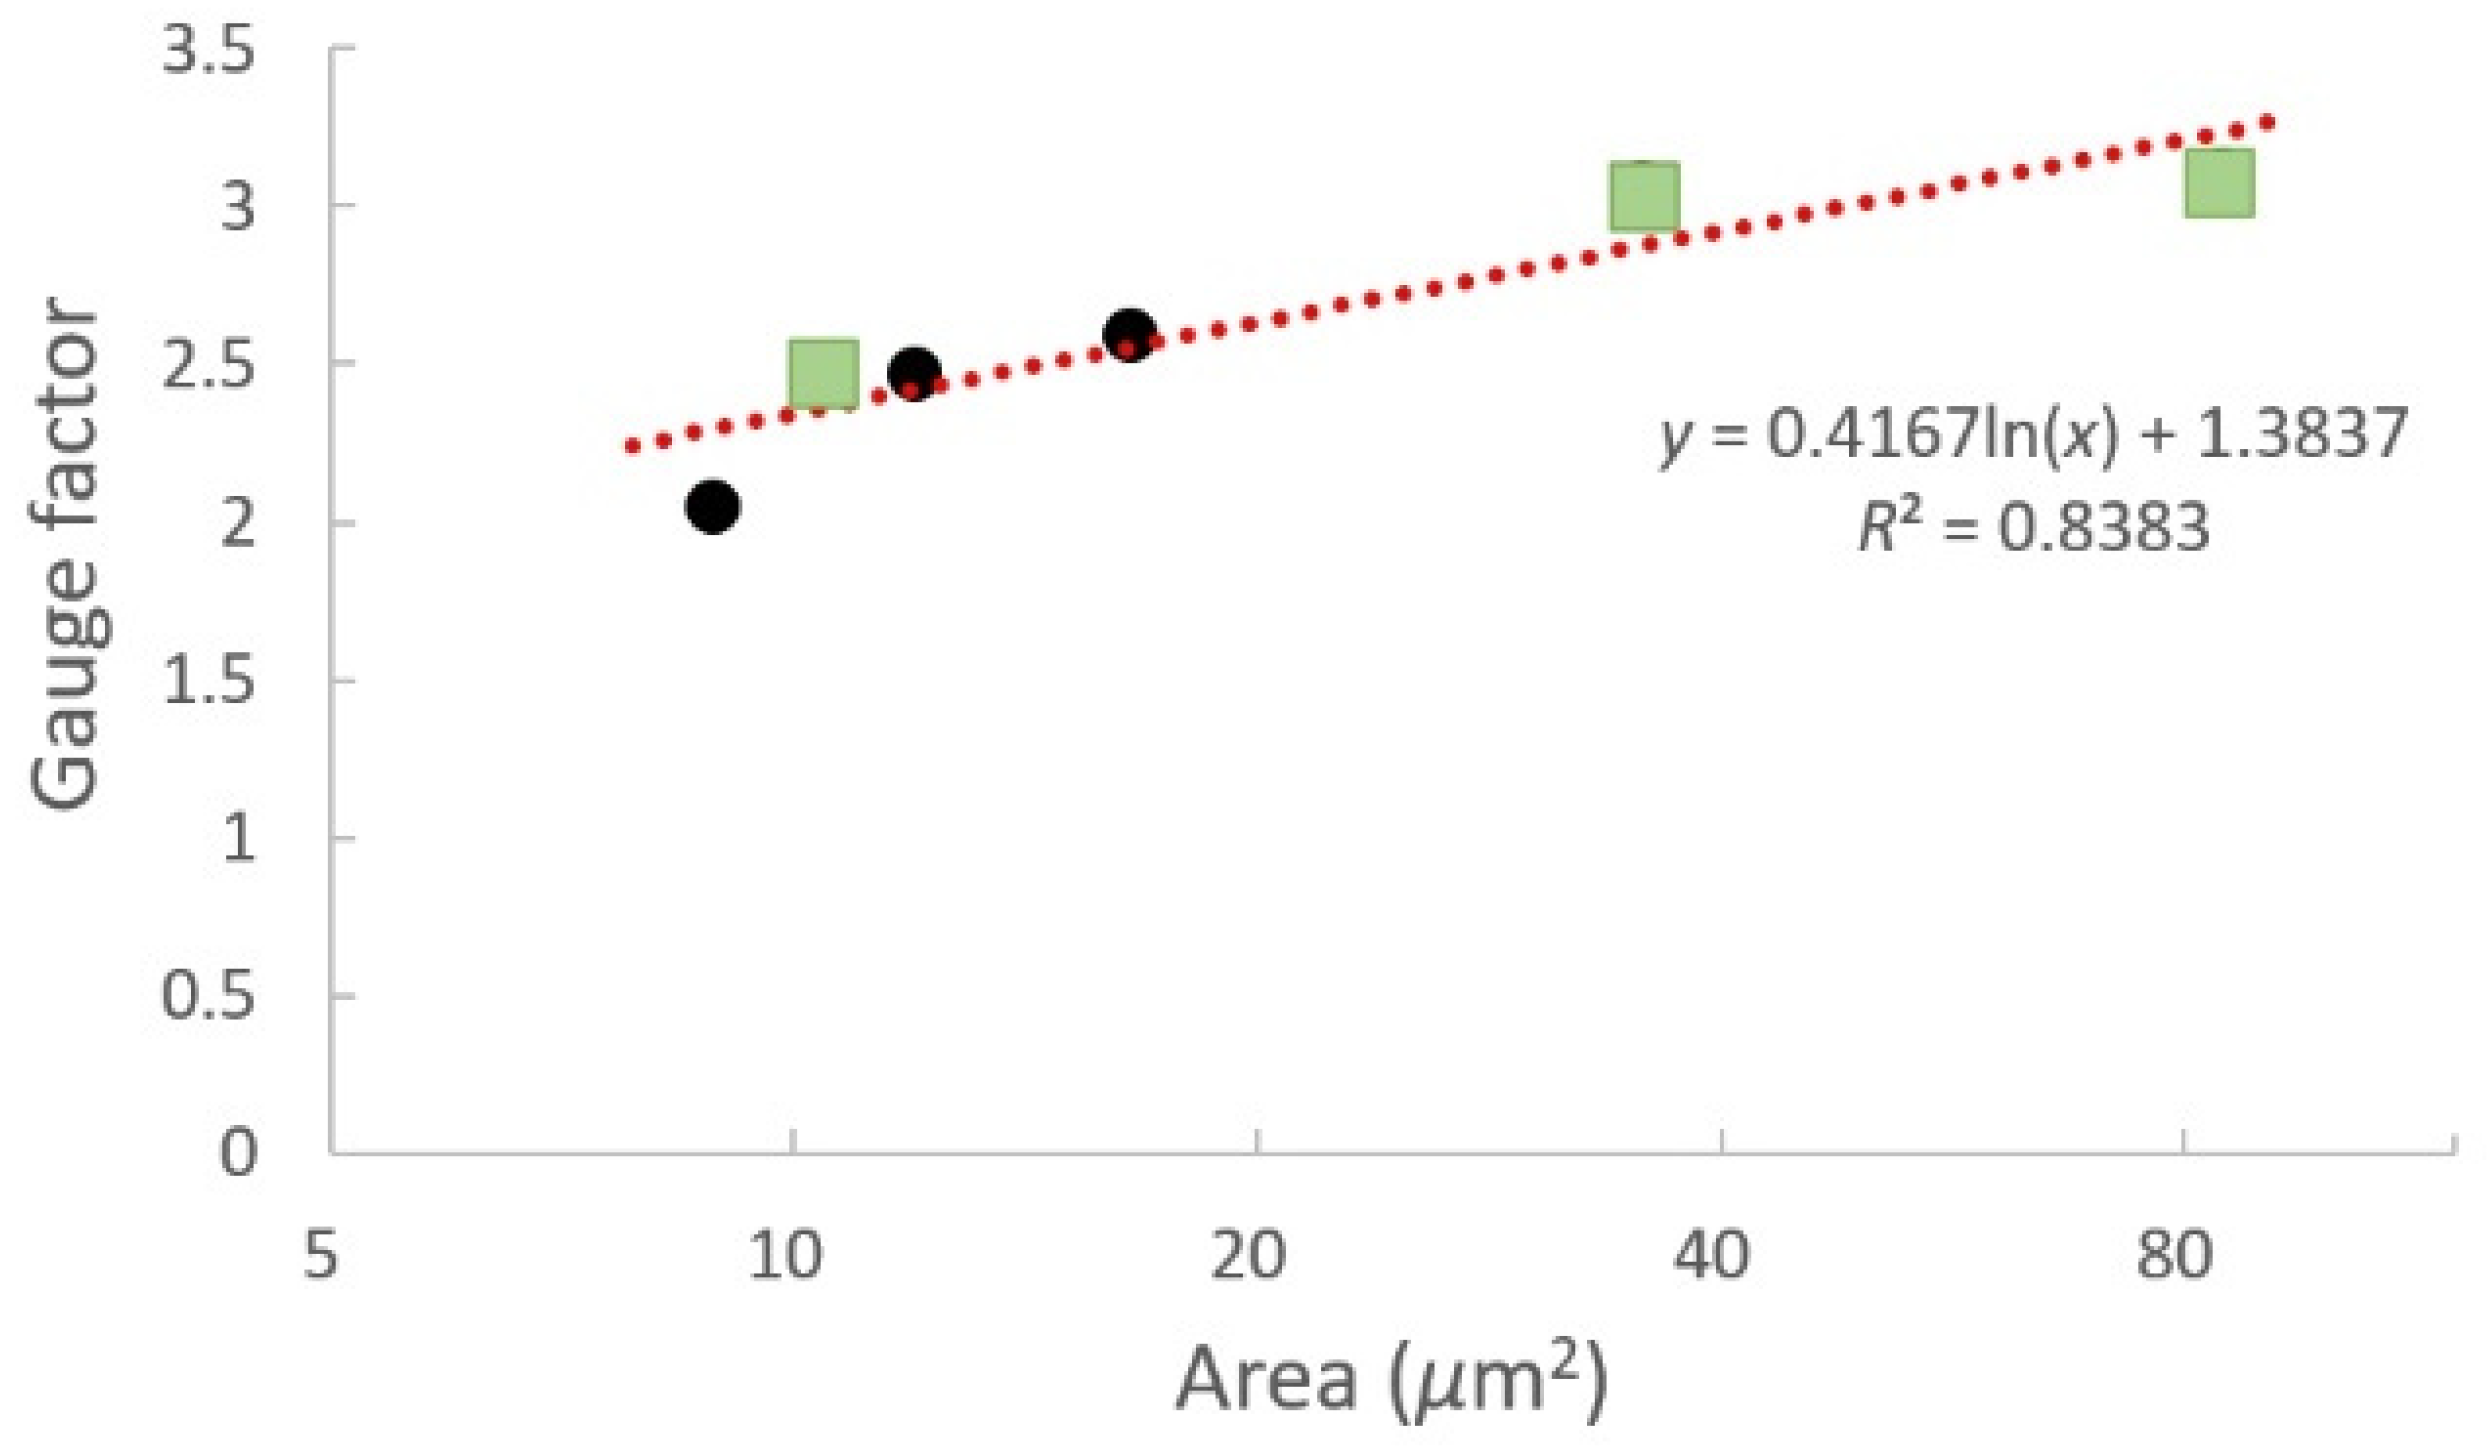
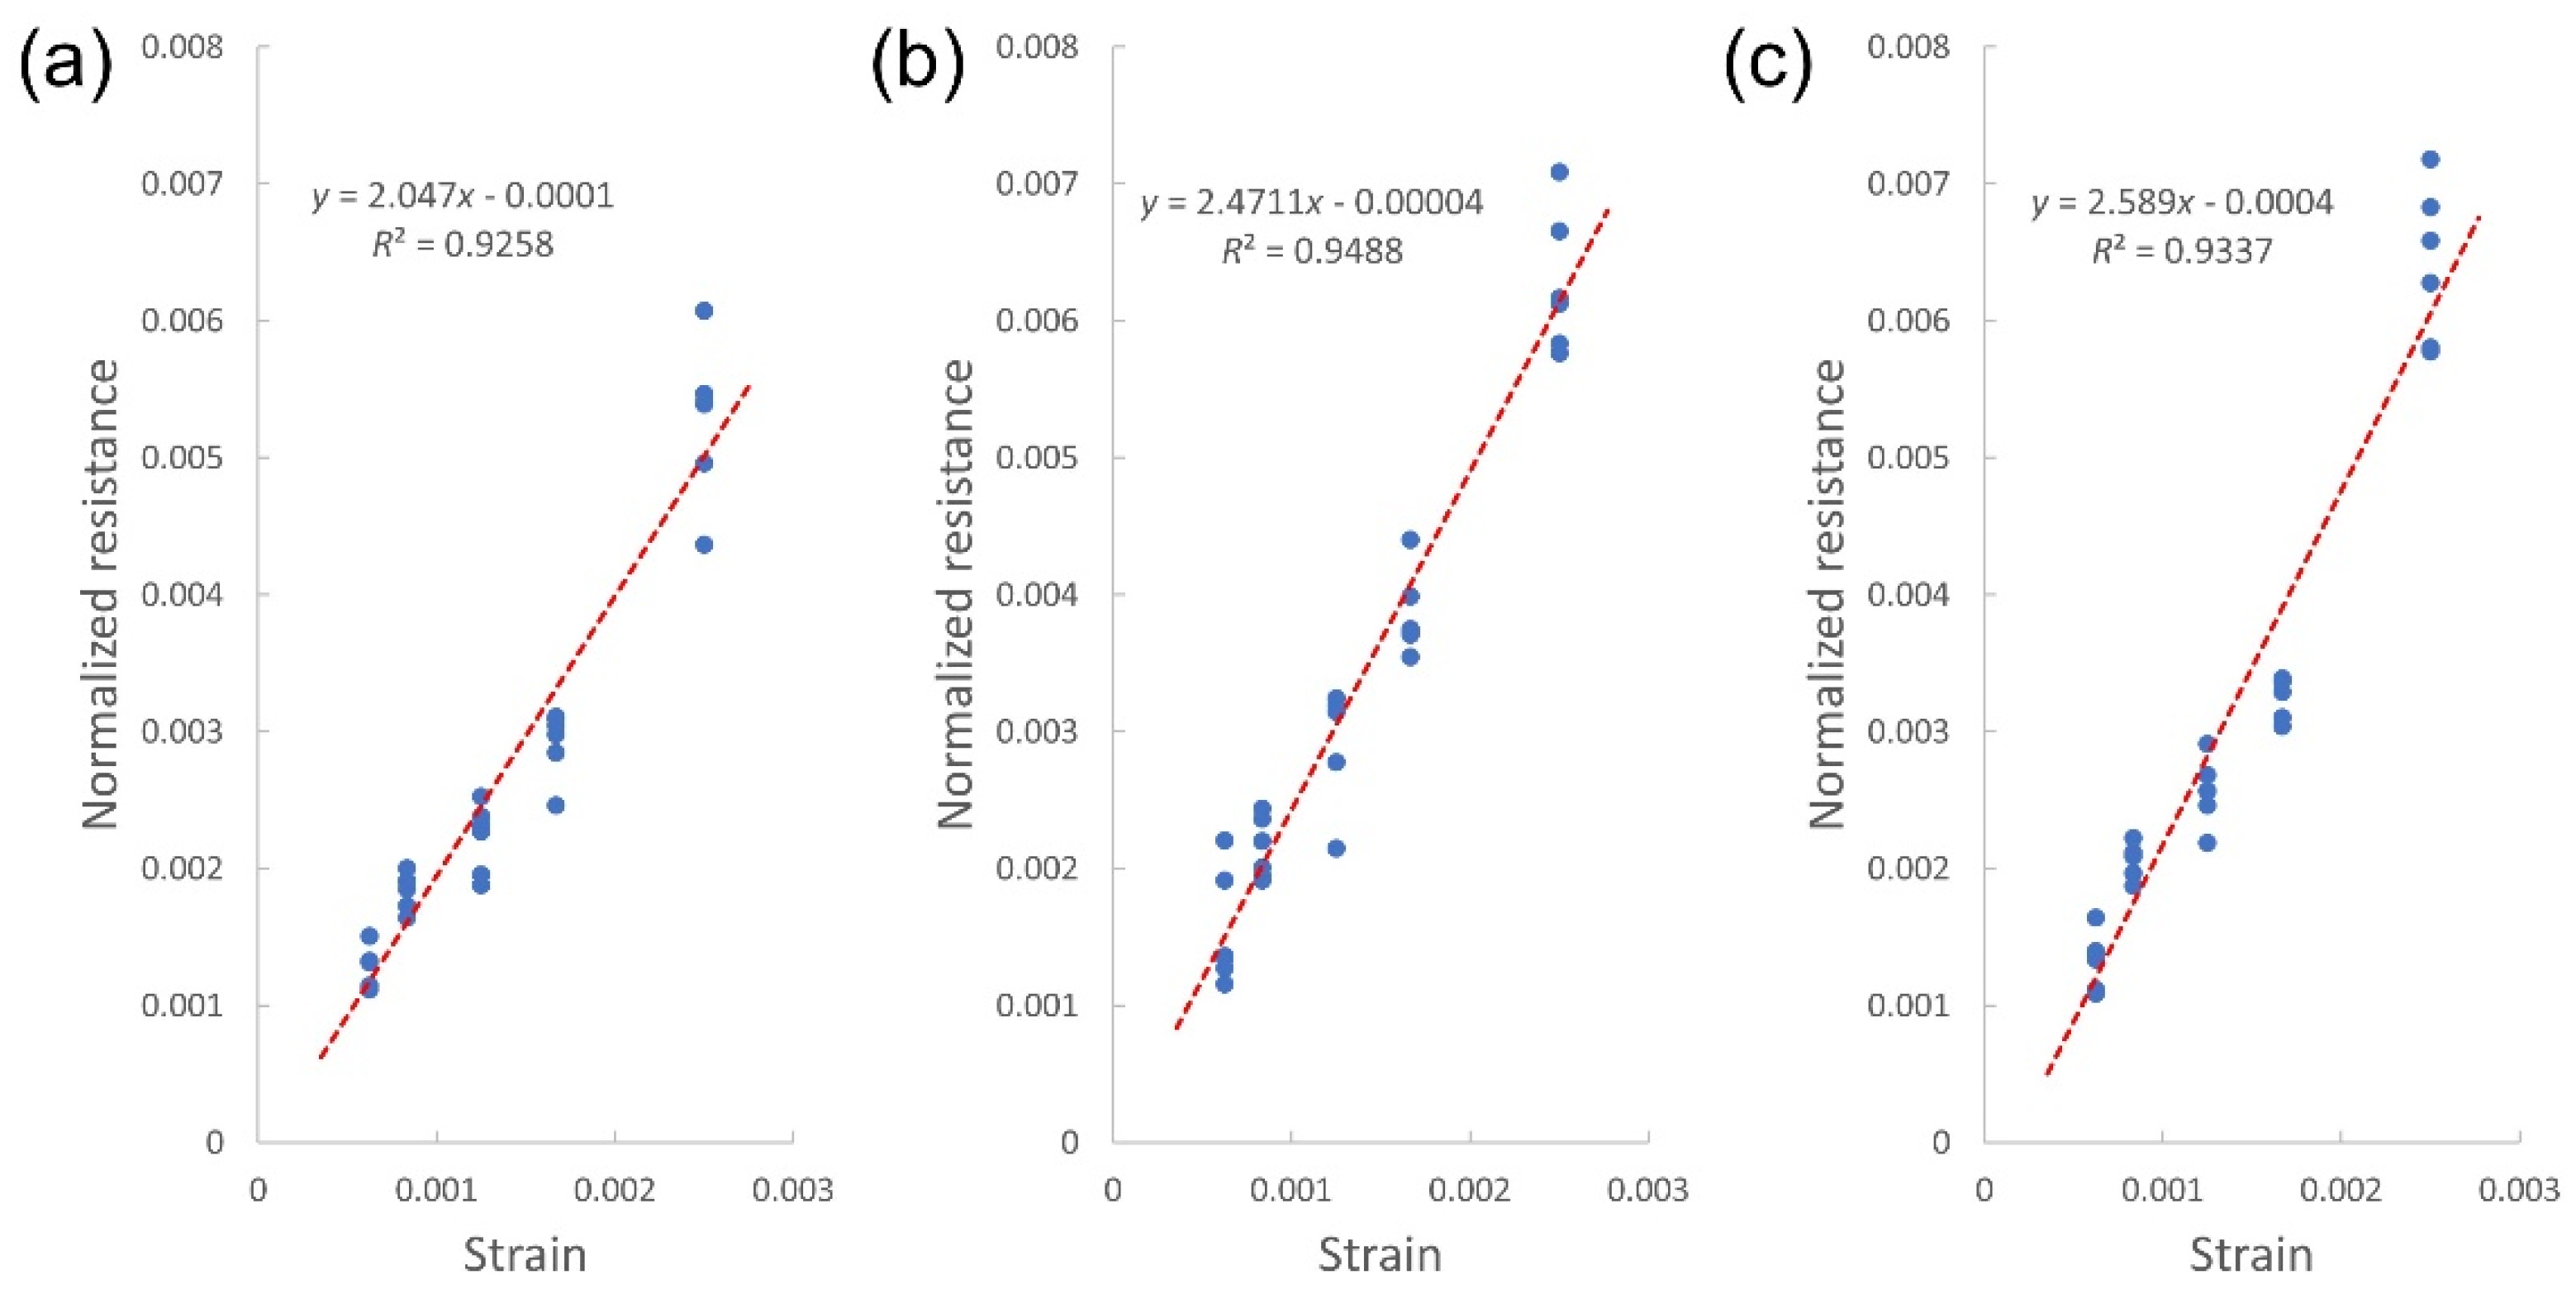
3. Results and Discussion
4. Conclusions
Author Contributions
Funding
Conflicts of Interest
References
- Albert, E.B. The Structures of Strain Gauge Transducers: An Introduction. IEEE Trans. Ind. Appl. 1969, 5, 90–94. [Google Scholar]
- Vinogradov, R.I. Strain-gauge pressure transducers of a new design. Meas. Tech. 1962, 5, 471–474. [Google Scholar] [CrossRef]
- Khan, S.; Ali, S.; Khan, A.; Ahmed, M.; Wang, B.; Bermak, A. Inkjet printing of multi-stripes based deflection monitoring sensor on flexible substrate. Sens. Actuators A Phys. 2021, 323, 112638. [Google Scholar] [CrossRef]
- Anderson, N.; Szorc, N.; Gunasekaran, V.; Joshi, S.; Jursich, G. Highly sensitive screen printed strain sensors on flexible substrates via ink composition optimization. Sens. Actuators A Phys. 2019, 290, 1–7. [Google Scholar] [CrossRef]
- Li, S.; Park, J.G.; Wang, S.; Liang, R.; Zhang, C.; Wang, B. Working mechanisms of strain sensors utilizing aligned carbon nanotube network and aerosol jet printed electrodes. Carbon 2014, 73, 303–309. [Google Scholar] [CrossRef]
- Bisconti, F.; Giuri, A.; Suhonen, R.; Kraft, T.M.; Ylikunnari, M.; Holappa, V.; Po, R.; Biagini, P.; Savoini, A.; Marra, G.; et al. One-step polymer assisted roll-to-roll gravure-printed perovskite solar cells without using anti-solvent bathing. Cell Rep. Phys. Sci. 2021, 2, 100639. [Google Scholar] [CrossRef]
- Park, J.; Nam, D.; Park, S.; Lee, D. Fabrication of flexible strain sensors via roll-to-roll gravure printing of silver ink. Smart Mater. Struct. 2018, 27, 085014. [Google Scholar] [CrossRef]
- Yi, Y.; Wang, B.; Bermak, A. A low-cost strain gauge displacement sensor fabricated via shadow mask printing. Sensors 2019, 19, 4713. [Google Scholar] [CrossRef] [Green Version]
- Enser, H.; Kulha, P.; Sell, J.K.; Michaela, S.L.; Strauß, B.; Hilber, W.; Jakoby, B. Printed strain gauges embedded in organic coatings—Analysis of gauge factor and temperature dependence. Sens. Actuators A Phys. 2018, 276, 137–143. [Google Scholar] [CrossRef]
- Borghetti, M.; Serpelloni, M.; Sardini, E.; Casas, O. Multisensor System for Analyzing the Thigh Movement During Walking. IEEE Sens. J. 2017, 17, 4953–4961. [Google Scholar] [CrossRef]
- Shakeel, M.; Khan, W.A.; Rahman, K. Fabrication of cost effective and high sensitivity resistive strain gauge using DIW technique. Sens. Actuators A Phys. 2017, 258, 123–130. [Google Scholar] [CrossRef]
- Zhang, Z.; Si, T. Controllable assembly of silver nanoparticles based on the coffee-ring effect for high-sensitivity flexible strain gauges. Sens. Actuators A Phys. 2017, 264, 188–194. [Google Scholar] [CrossRef]
- Ali, M.M.; Maddipatla, D.; Narakathu, B.B.; Chlaihawi, A.A.; Emamian, S.; Janabi, F.; Bazuin, B.J.; Atashbar, M.Z. Printed strain sensor based on silver nanowire/silver flake composite on flexible and stretchable TPU substrate. Sens. Actuators A Phys. 2018, 274, 109–115. [Google Scholar]
- Barmpakos, D.; Tsamis, C.; Kaltsas, G. Multi-parameter paper sensor fabricated by inkjet-printed silver nanoparticle ink and PEDOT:PSS. Microelectron. Eng. 2020, 225, 111266. [Google Scholar]
- Zymelka, D.; Yamashita, T.; Takamatsu, S.; Itoh, T.; Kobayashi, T. Printed strain sensor with temperature compensation and its evaluation with an example of applications in structural health monitoring. Jpn. J. Appl. Phys. 2017, 56, 05EC02. [Google Scholar] [CrossRef] [Green Version]
- Guo, Z.; Xu, J.; Chen, Y.; Guo, Z.; Yu, P.; Liu, Y.; Zhao, J. High-sensitive and stretchable resistive strain gauges: Parametric design and DIW fabrication. Compos. Struct. 2019, 223, 110955. [Google Scholar] [CrossRef]
- Enser, H.; Sell, J.K.; Hilber, W.; Jakoby, B. Printed strain sensors in organic coatings: In depth analysis of sensor signal effects. Sens. Actuators A Phys. 2018, 281, 258–263. [Google Scholar] [CrossRef]
- Zhang, Y.; Anderson, N.; Bland, S.; Nutt, S.; Jursich, G.; Joshi, S. All-printed strain sensors: Building blocks of the aircraft structural health monitoring system. Sens. Actuators A Phys. 2017, 253, 165–172. [Google Scholar] [CrossRef] [Green Version]
- Hibbeler, R.C. Mechanics of Materials, 8th ed.; Pearson Prentice Hall: Hoboken, NJ, USA, 2011; pp. 281–294. [Google Scholar]
- Deegan, R.D.; Bakajin, O.; Dupont, T.F.; Huber, G.; Nagel, S.R.; Witten, T.A. Capillary flow as the cause of ring stains from dried liquid drops. Nature 1997, 389, 827–829. [Google Scholar] [CrossRef]
- Soltman, D.; Subramanian, V. Inkjet-Printed Line Morphologies and Temperature Control of the Coffee Ring Effect. Langmuir 2008, 24, 2224–2231. [Google Scholar] [CrossRef]
- Su, S.; Rao, Q.; He, Y.; Xie, W. Effects of porosity on tensile mechanical properties of porous FeAl intermetallics. Trans. Nonferr. Met. Soc. China 2020, 30, 2757–2763. [Google Scholar] [CrossRef]
- Chen, J.; Liu, X.; Tian, Y.; Zhu, W.; Yan, C.; Shi, Y.; Kong, L.B.; Qi, H.J.; Zhou, K. 3D-Printed Anisotropic Polymer Materials for Functional Applications. Adv. Mater. 2021, 34, 2102877. [Google Scholar] [CrossRef] [PubMed]
- Maroti, P.; Varga, P.; Abraham, H.; Falk, G.; Zsebe, T.; Meiszterics, Z.; Mano, S.; Csernatony, Z.; Rendeki, S.; Nyitrai, M. Printing orientation defines anisotropic mechanical properties in additive manufacturing of upper limb prosthetics. Mater. Res. Express 2019, 6, 035403. [Google Scholar] [CrossRef]


| Topography | Mean (Ω) | SD (Ω) | %CV | p | |
|---|---|---|---|---|---|
| Stacked layers | Five layers | 111.04 | 3.08 | 2.8 | 0.136 |
| Three layers | 273.23 | 8.21 | 3.0 | 0.639 | |
| Single layer | 774.00 | 18.36 | 2.4 | 0.069 | |
| Width | Seven droplets | 410.87 | 15.52 | 3.8 | 0.304 |
| Four droplets | 580.41 | 11.39 | 2.0 | 0.477 | |
| Two droplets | 927.78 | 15.02 | 1.6 | 0.687 | |
| Topography | Mean Width (μm) | Mean Thickness (nm) | Area (μm2) | Gauge Factor | |
|---|---|---|---|---|---|
| Stacked layers | Five layers | 209.39 | 404.36 | 84.67 | 3.098 |
| Three layers | 203.15 | 175.08 | 35.57 | 3.051 | |
| Single layer | 163.34 | 63.52 | 10.37 | 2.471 | |
| Width | Seven droplets | 266.60 | 62.12 | 16.56 | 2.589 |
| Four droplets | 175.29 | 68.23 | 11.96 | 2.471 | |
| Two droplets | 151.59 | 58.42 | 8.86 | 2.047 | |
Publisher’s Note: MDPI stays neutral with regard to jurisdictional claims in published maps and institutional affiliations. |
© 2022 by the authors. Licensee MDPI, Basel, Switzerland. This article is an open access article distributed under the terms and conditions of the Creative Commons Attribution (CC BY) license (https://creativecommons.org/licenses/by/4.0/).
Share and Cite
Kang, H.; Kim, S.; Shin, J.; Ko, S. Inkjet-Printed Flexible Strain-Gauge Sensor on Polymer Substrate: Topographical Analysis of Sensitivity. Appl. Sci. 2022, 12, 3193. https://doi.org/10.3390/app12063193
Kang H, Kim S, Shin J, Ko S. Inkjet-Printed Flexible Strain-Gauge Sensor on Polymer Substrate: Topographical Analysis of Sensitivity. Applied Sciences. 2022; 12(6):3193. https://doi.org/10.3390/app12063193
Chicago/Turabian StyleKang, Hyunkyoo, Seokjin Kim, Jaehak Shin, and Sunglim Ko. 2022. "Inkjet-Printed Flexible Strain-Gauge Sensor on Polymer Substrate: Topographical Analysis of Sensitivity" Applied Sciences 12, no. 6: 3193. https://doi.org/10.3390/app12063193
APA StyleKang, H., Kim, S., Shin, J., & Ko, S. (2022). Inkjet-Printed Flexible Strain-Gauge Sensor on Polymer Substrate: Topographical Analysis of Sensitivity. Applied Sciences, 12(6), 3193. https://doi.org/10.3390/app12063193