
A Data Processing Framework for Polar Performance Diagrams

Abstract
:1. Introduction
- different representations of polar diagrams for different purposes;
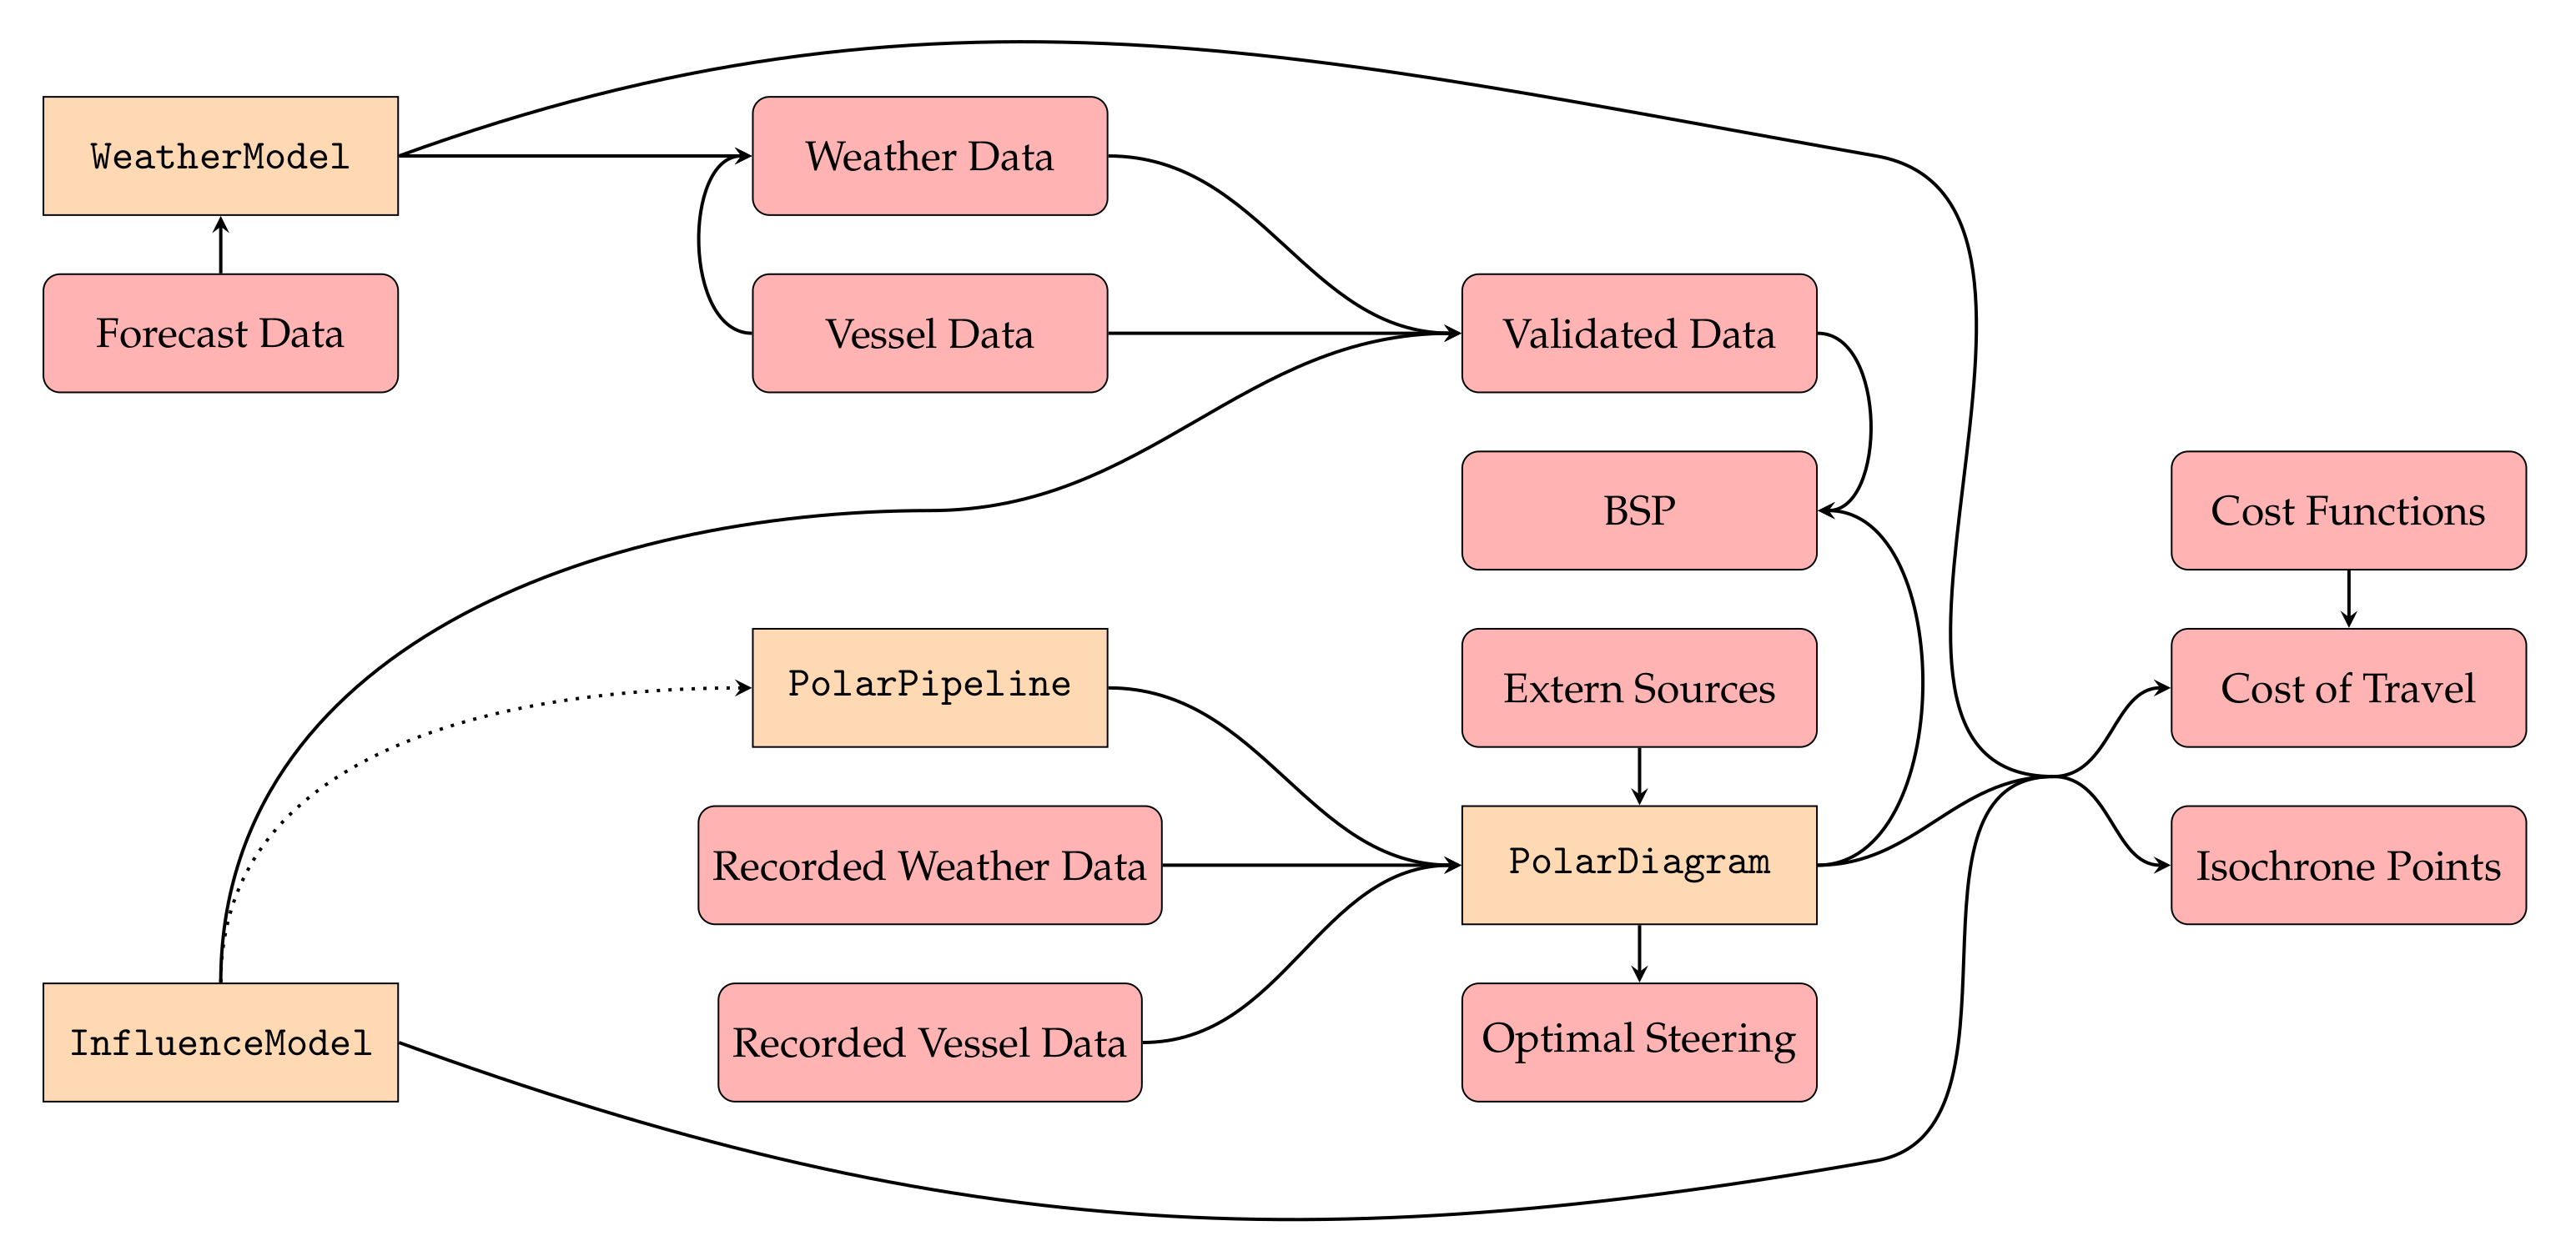
- a pipeline model for the modular creation of polar diagrams from real-world data;
- different methods of visualisation, for example for scientific publications;
- suggestions for optimal steering using convex hull computations;
- computation of travelling cost (with custom cost functions) considering the weather conditions at each point;
- computation of isochrone points, considering the weather conditions at each point;
- a modular design for easy extensions and customisations;
- lastly, our Python package is compatible with several established data formats and Python libraries.
2. Problem Formulations and Theoretical Backgrounds
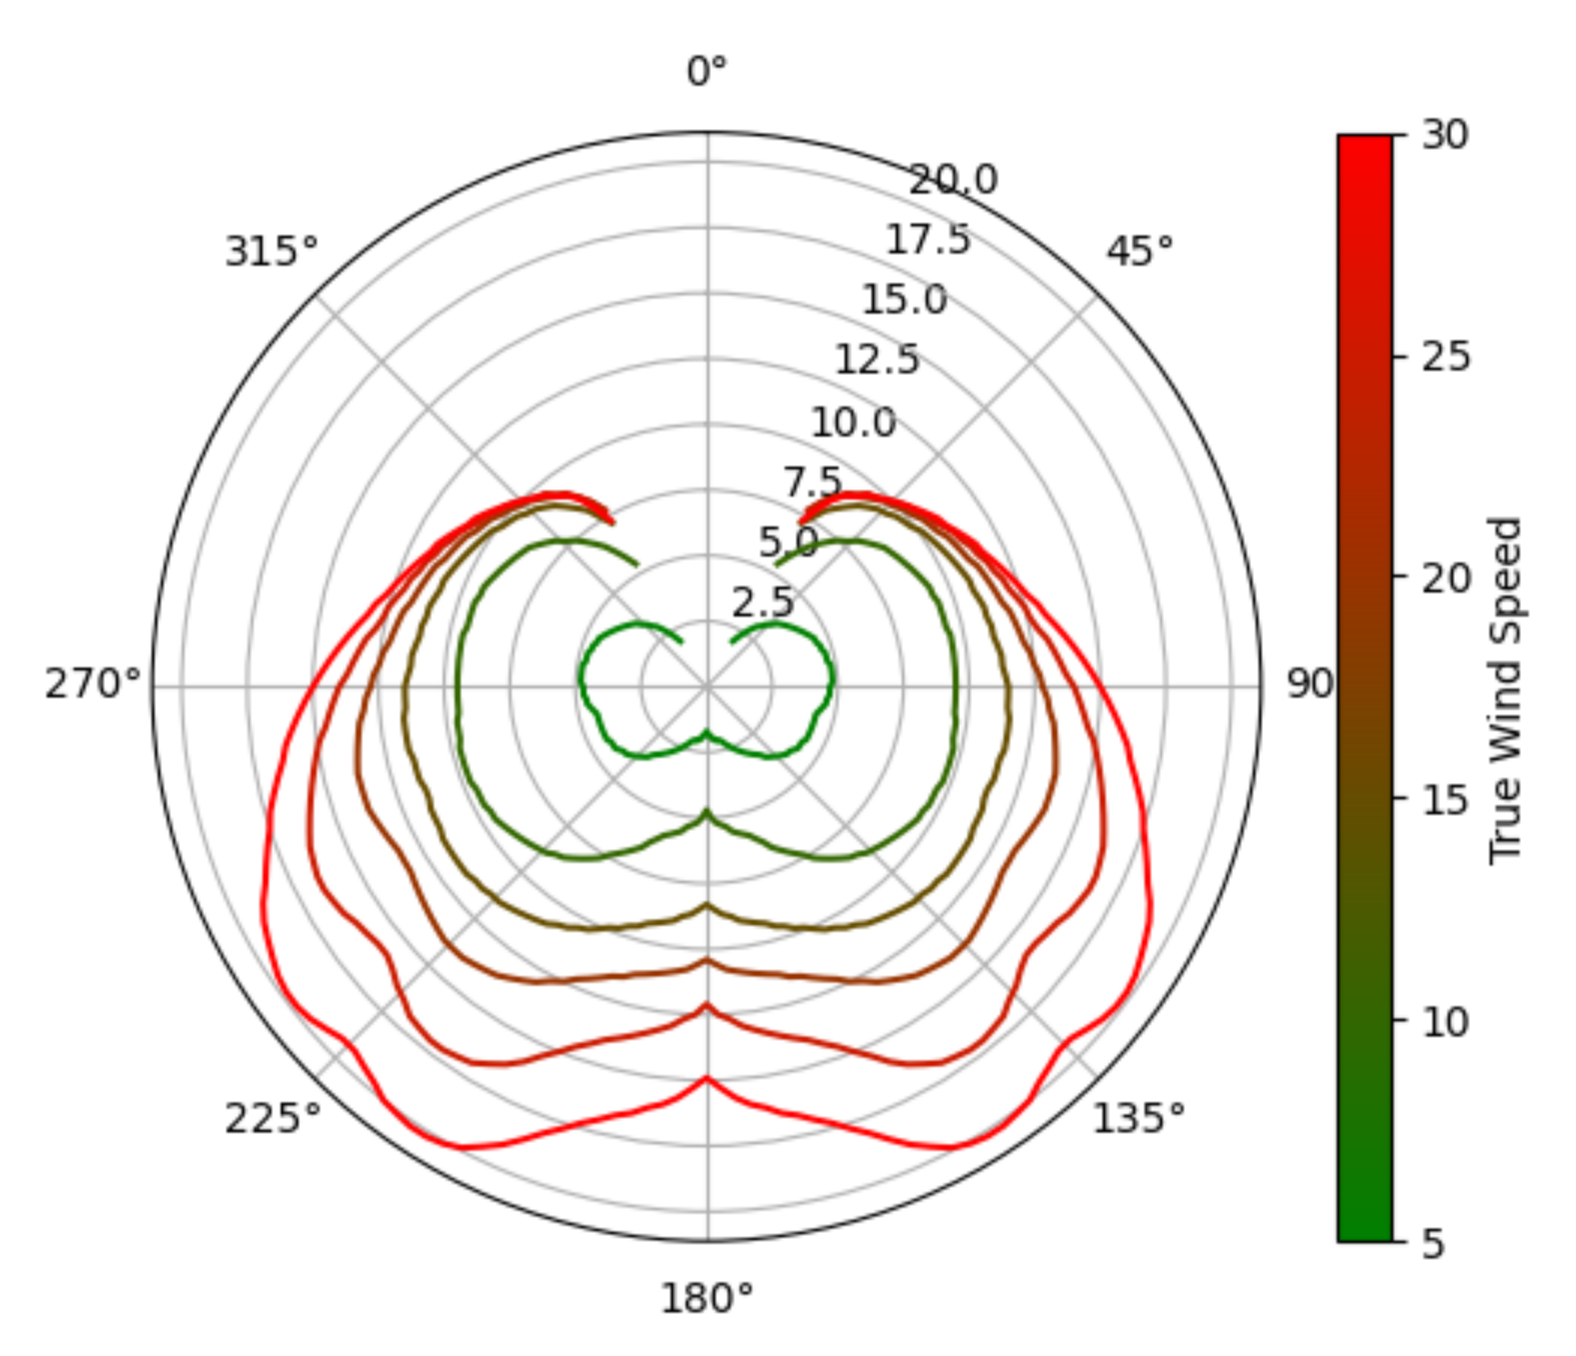
2.1. Representations for Different Purposes
2.2. Evaluation and Visualisation
2.3. From Real World Data to Polar Diagrams
2.4. Optimal Manoeuvres
2.5. Weather Routing—An Application of Polar Diagrams
2.5.1. Graph Based Algorithms
2.5.2. Isochrone Methods
3. The hrosailing Framework
3.1. Representation for Different Purposes
- Can a human (trained in sailing), with a printed version of the raw data, easily use the polar diagram to suggest optimal steering of the corresponding vessel?
- Can a human (not trained in programming) at least read and understand a printed version of the data?
- Can the data be used in conjunction with other software such as OpenCPN [19]?
- Is the computation of a BSP value for given (TWA, TWS) values independent of interpolation methods?
- Can the polar diagram easily be adapted when new information is given?
- Are the respective polar plots smooth and therefore (possibly) more realistic?
- Is there nearly complete information for a collection of slices?
- Theoretically, is the polar diagram capable to adapt to (probably incomplete) real world measurement data?
3.2. Evaluation and Visualisation
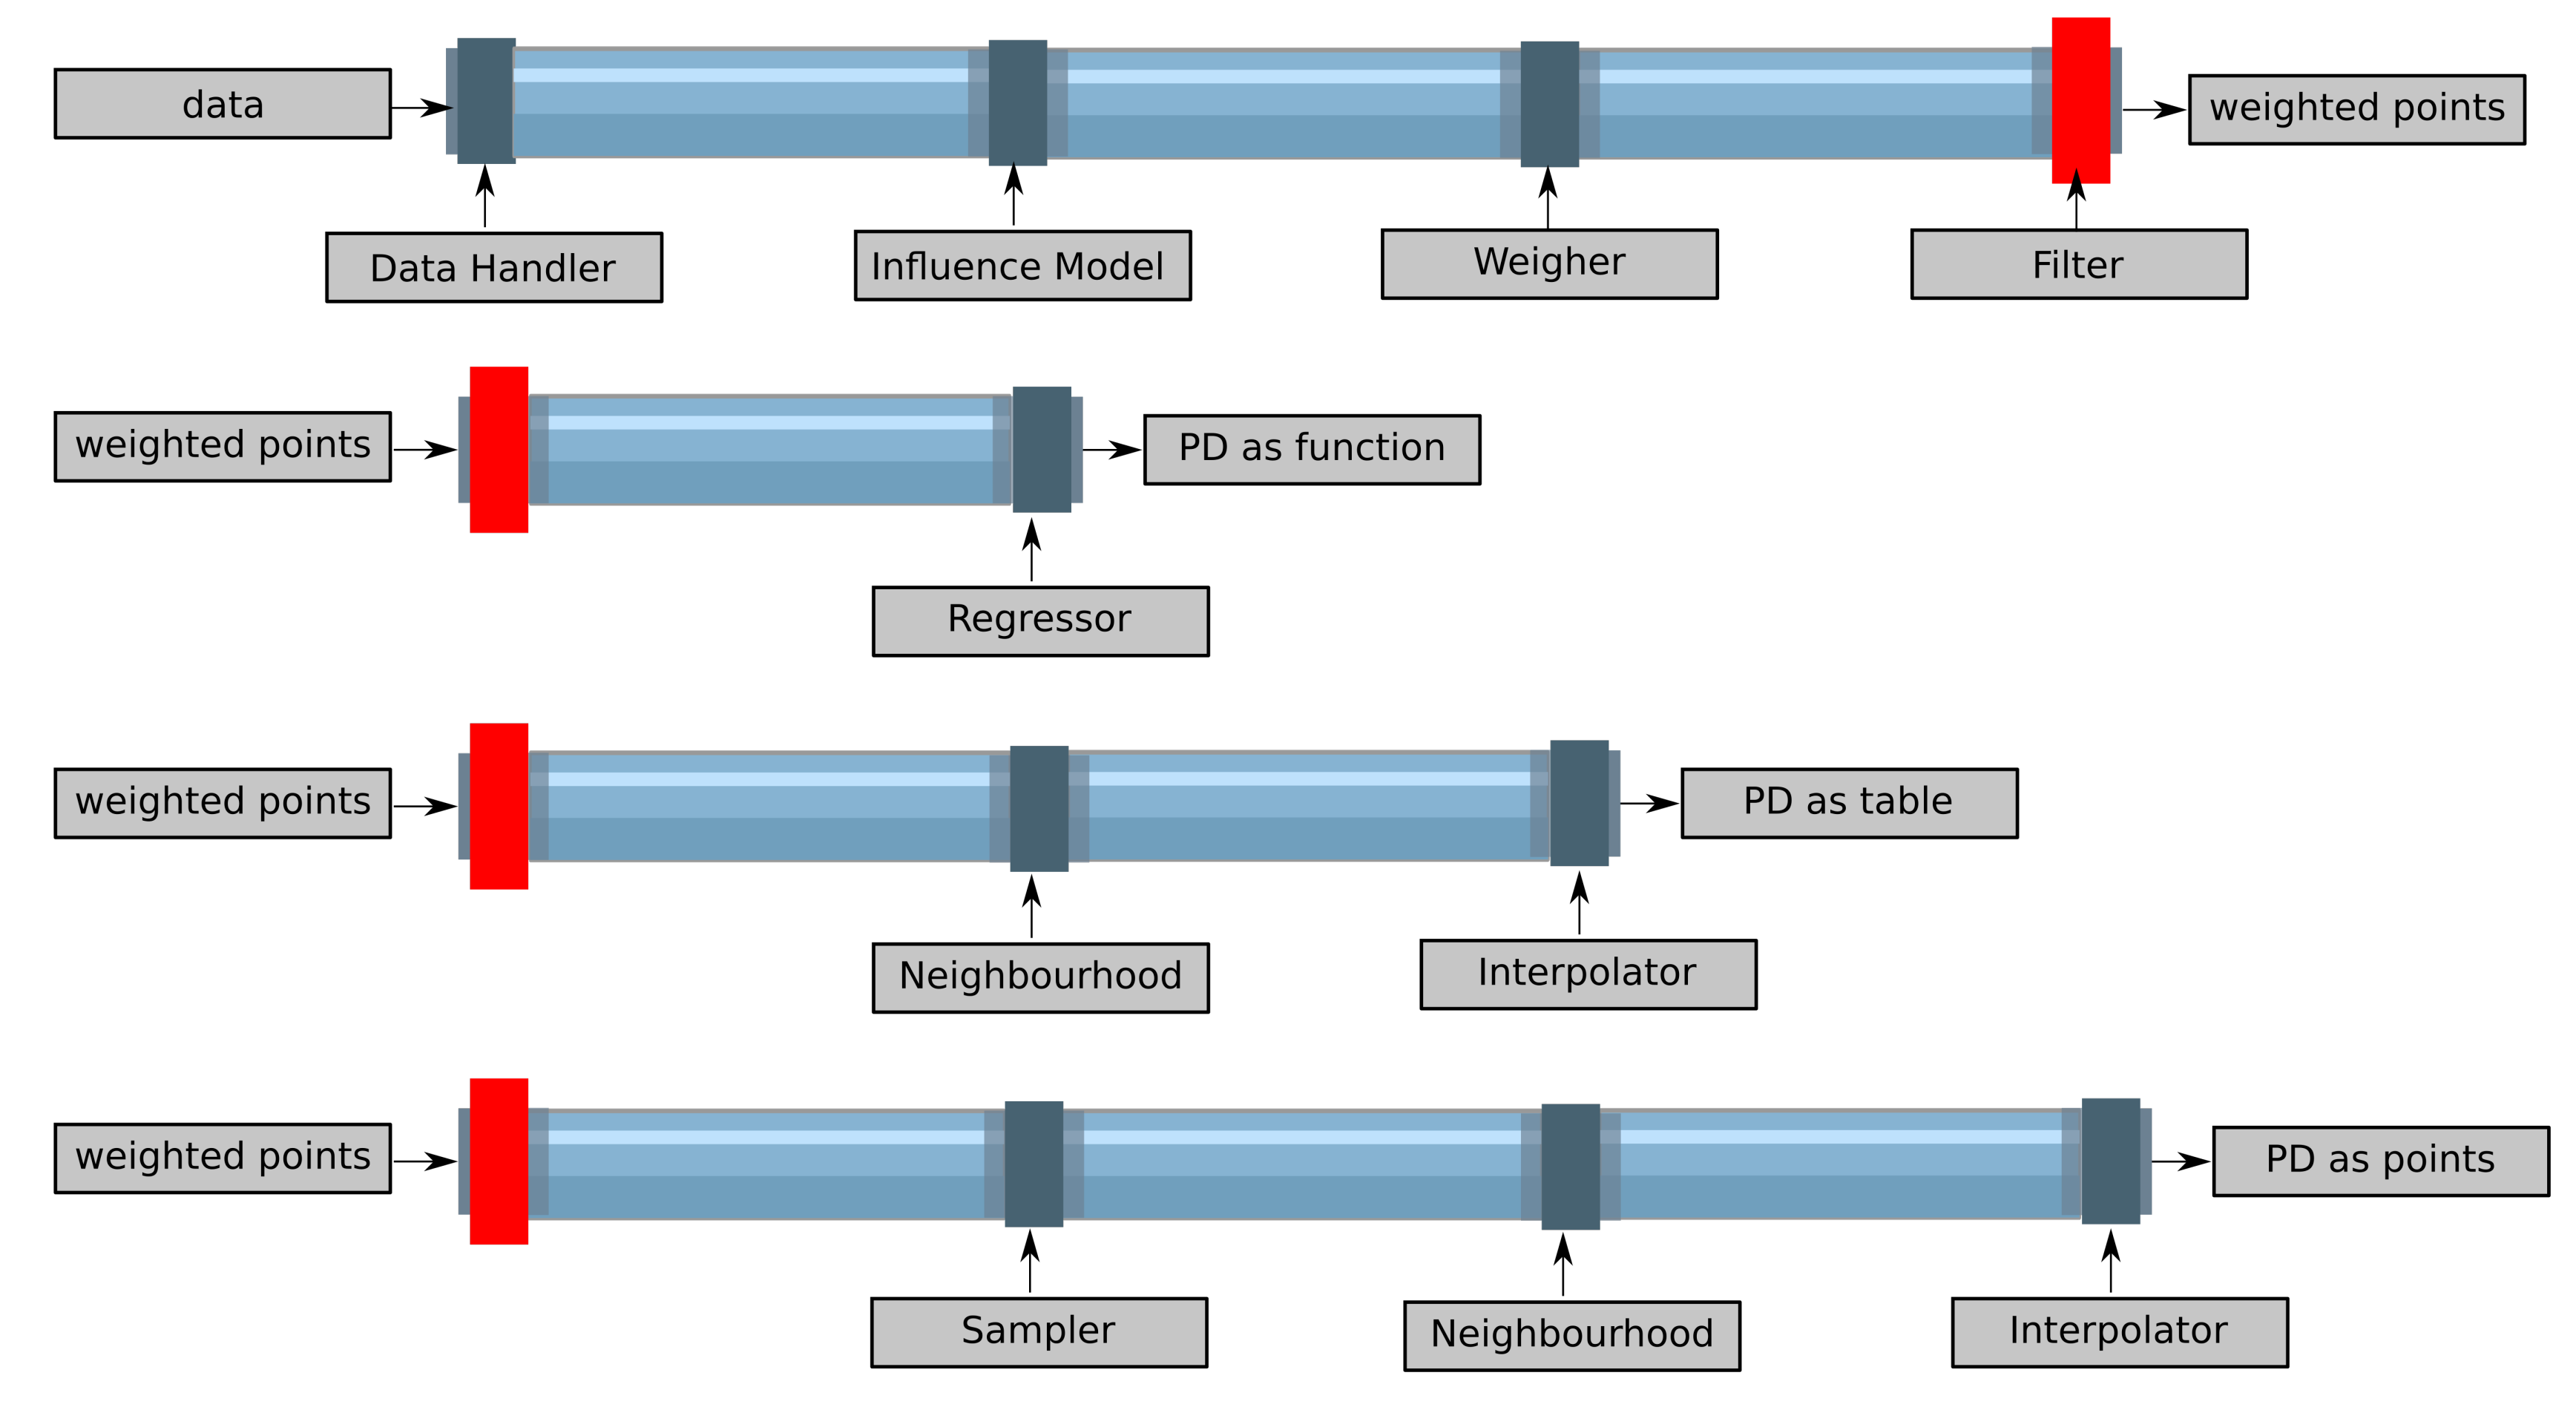
3.3. From Real World Measurements to Polar Diagrams
- DataHandler for csv-files, arrays and files containing NMEA sentences;
- CylindricMeanWeigher which produces higher weights for points whose BSP is roughly the mean of the BSP points in a given cylindric neighbourhood andCylindricMemberWeigher which produces higher weights for points with more neighbours in a cylindric neighbourhood;
- FluctuationWeigher which assigns low weights for data which strongly fluctuates in time (locally) and high weights for data which is nearly constant in time (also locally);
- BoundFilter which only keeps points whoose weights surpass a given threshold and QuantileFilter which keeps a given percentage of the weighed points;
- classical interpolators, such as the inverse distance interpolator for nongridded data and the improved inverse distance interpolator [20];
- a more general interpolator, namely the ArithmeticMeanInterpolator, i.e., I calculates the weighted mean with weights for each point ;
- sampling methods such as Fibonacci samples (inspired by [24]) and Archimedean samples (inspired by [25]), these produce sample points in the convex hull of available (TWS, TWA) data points with equidistantly distributed angles on the spiraland equidistantly distributed points on the spiral respectively;
- neighbourhoods such as Ball, Ellipsoid, Cuboid or Polytope;
- multiple model functions representing common types of polar diagrams.
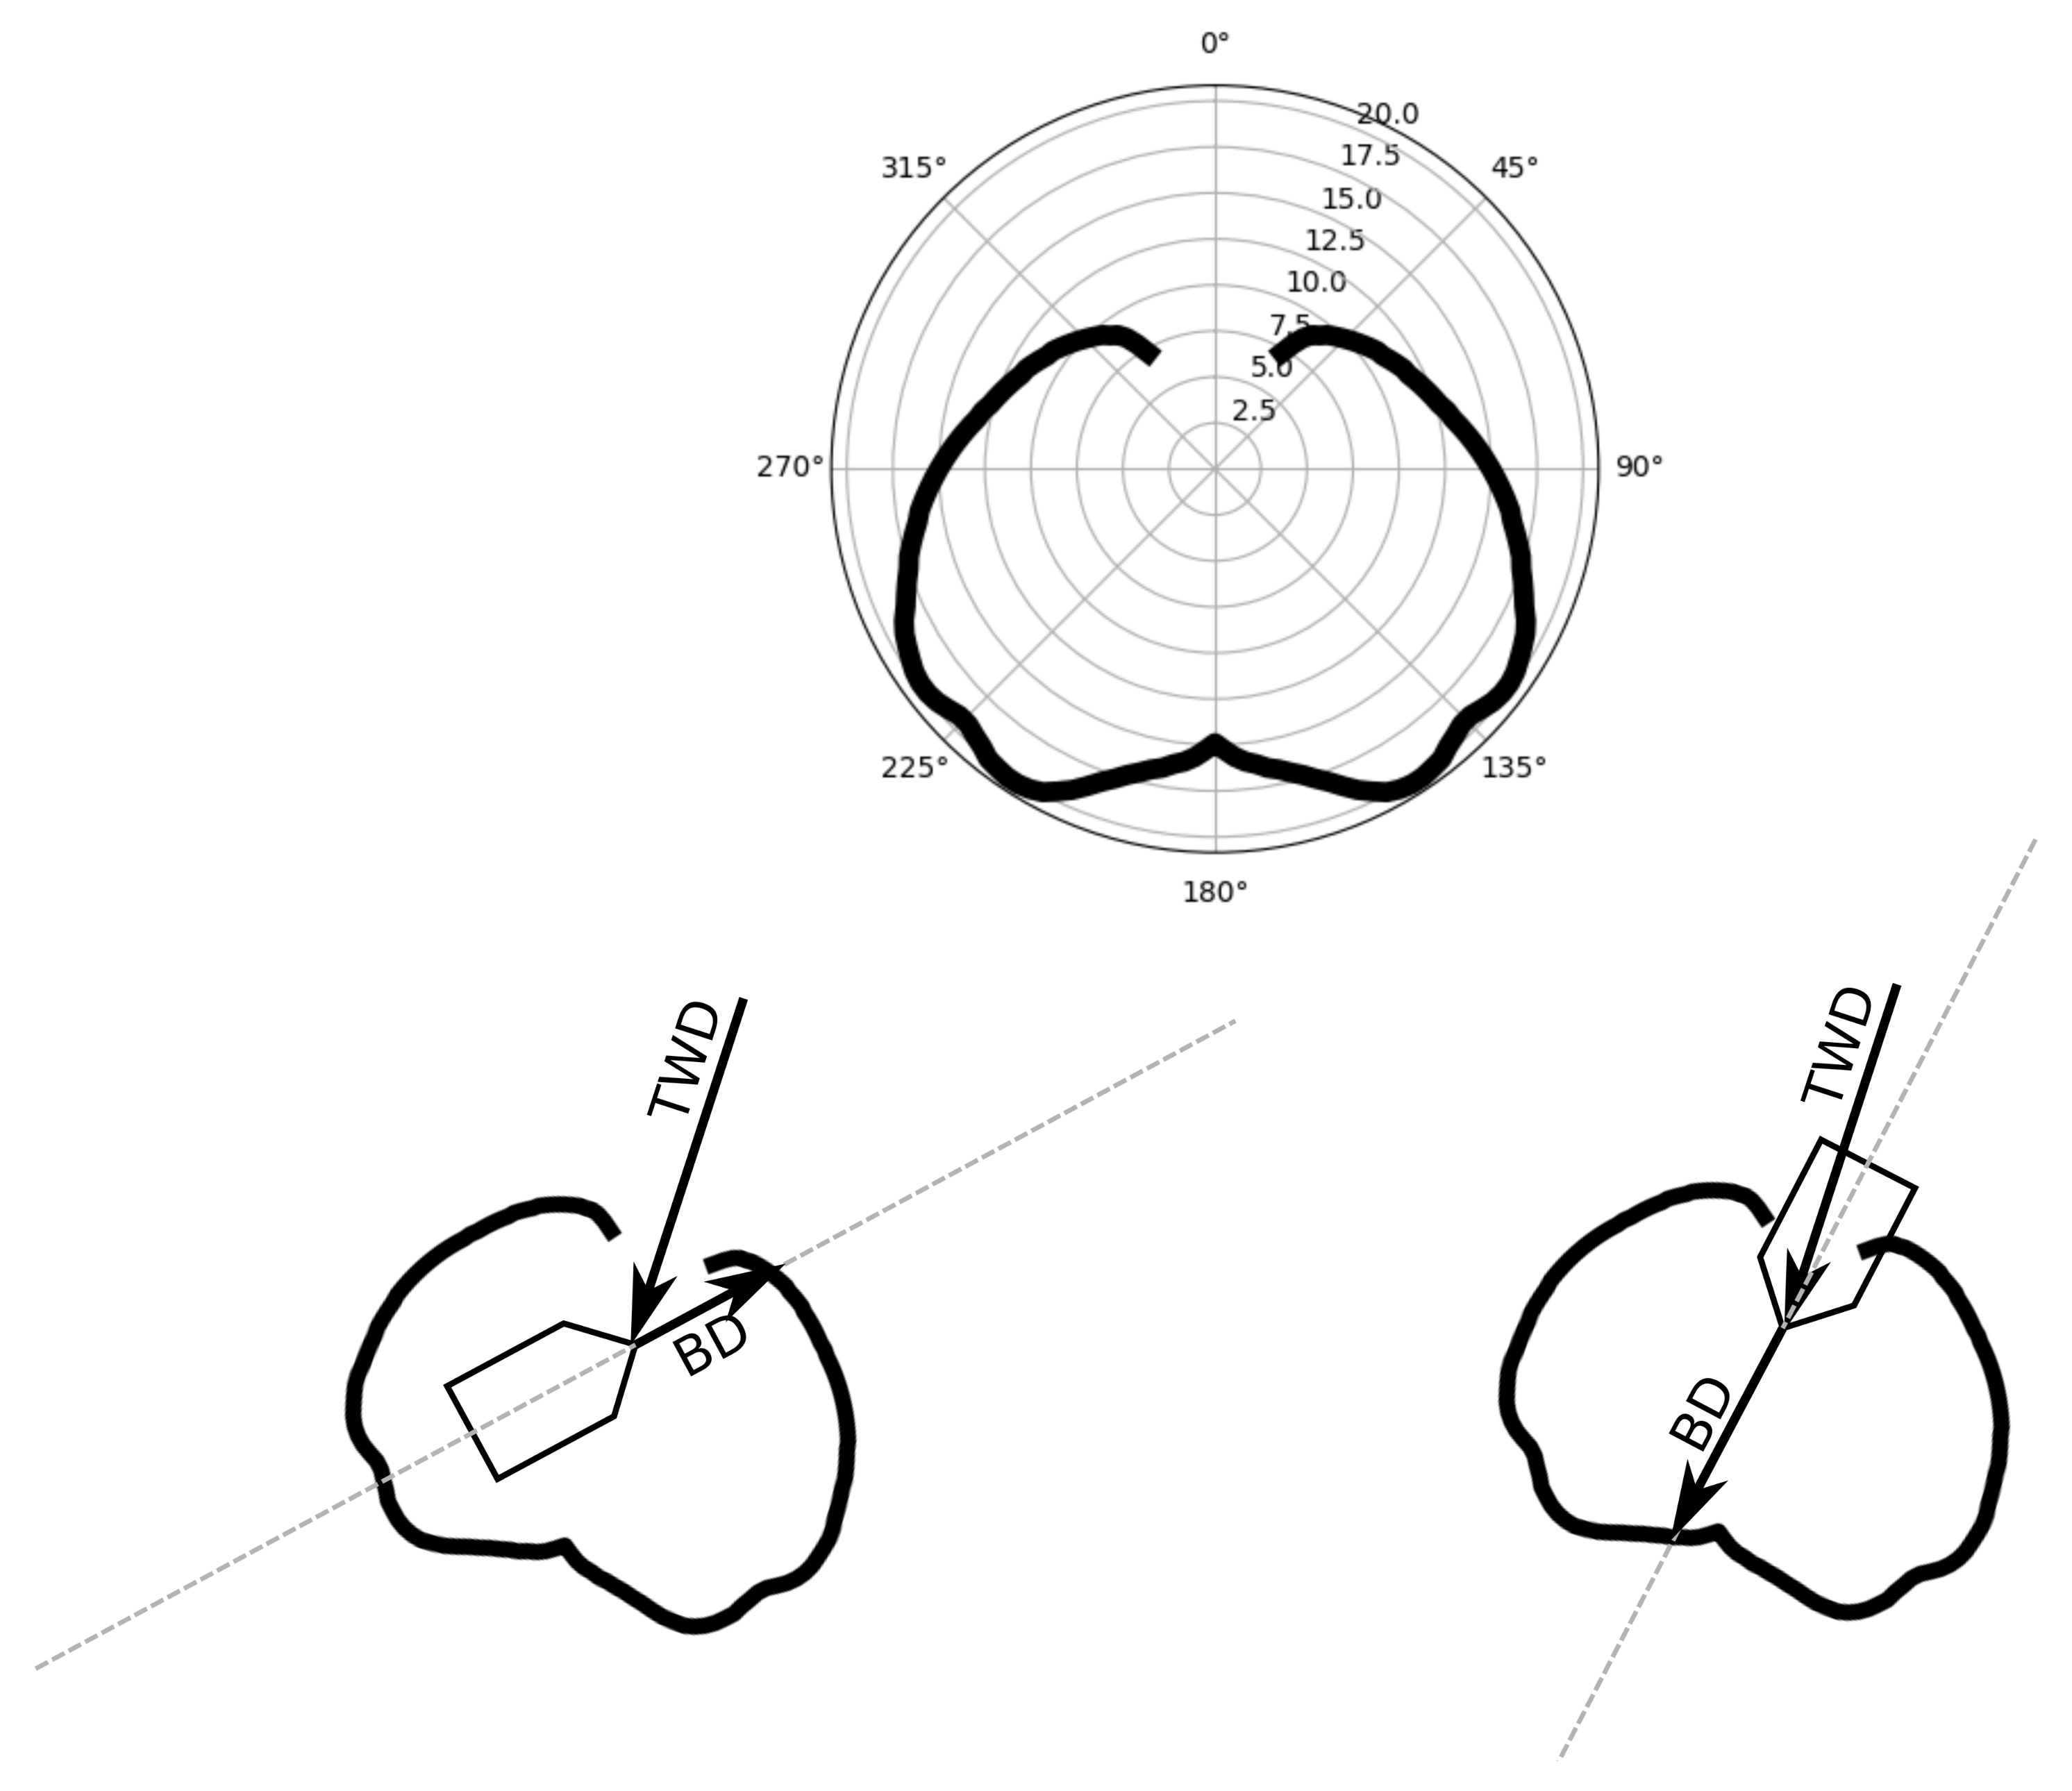
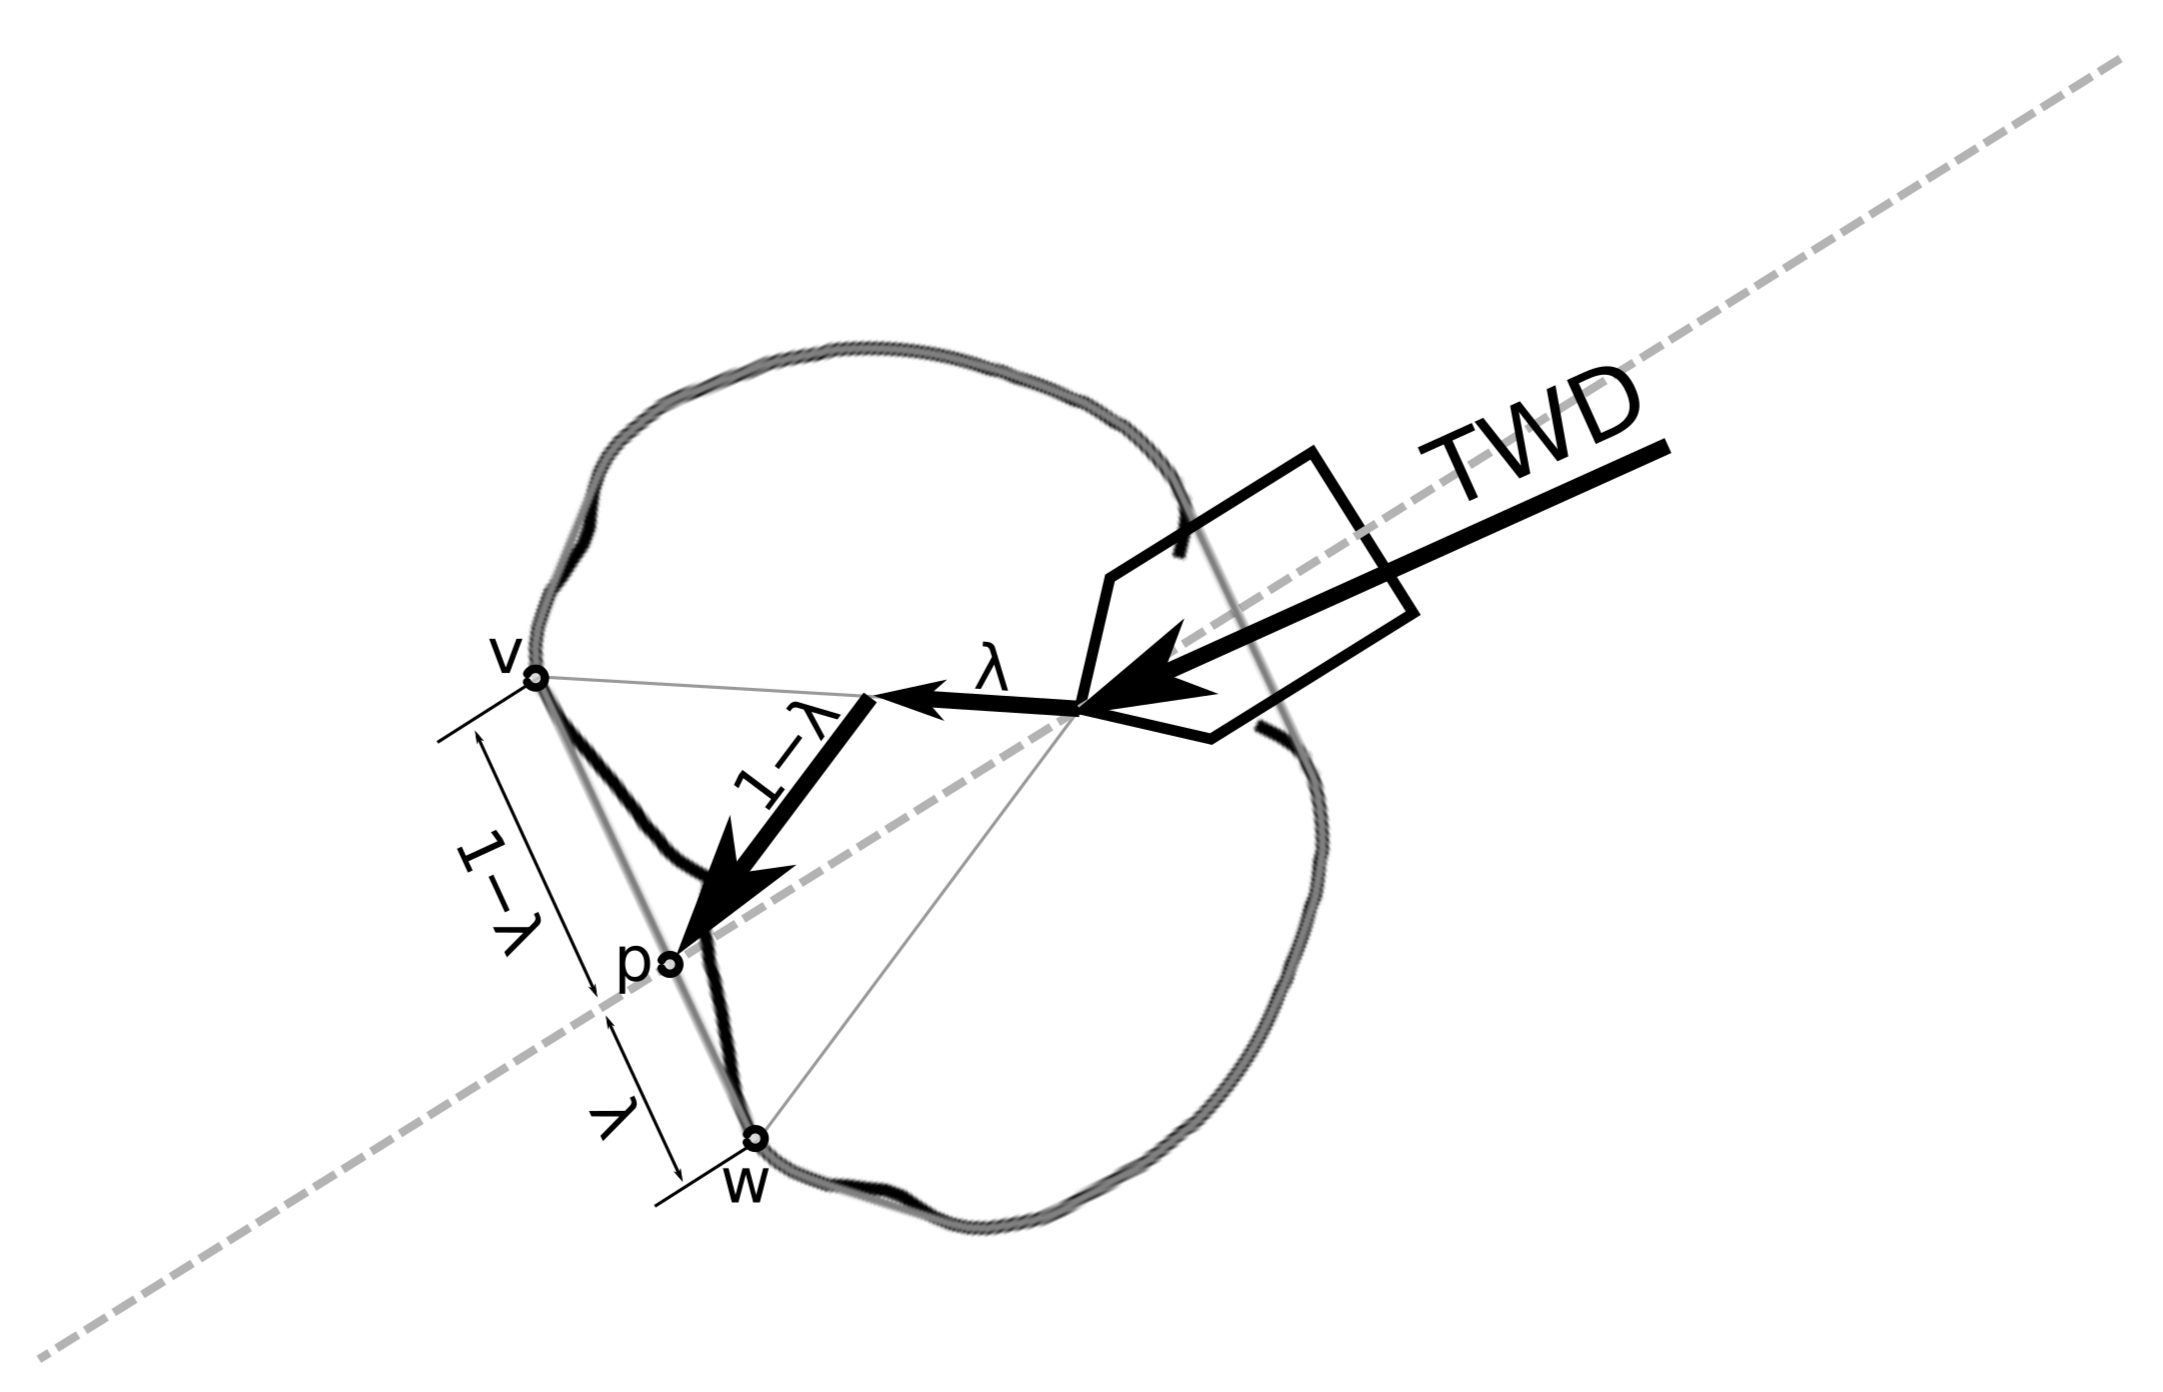
3.4. How to Use the Convex Hull of a Polar Diagram Slice for Optimal Manoeuvres
3.5. Weather Model
3.6. Computing Costs of Travel
- absolute costs , depending on the conditions at the start point, the conditions of the end point, the total travel time and the total travel duration;
- relative costs , which is a density function depending on position and time.
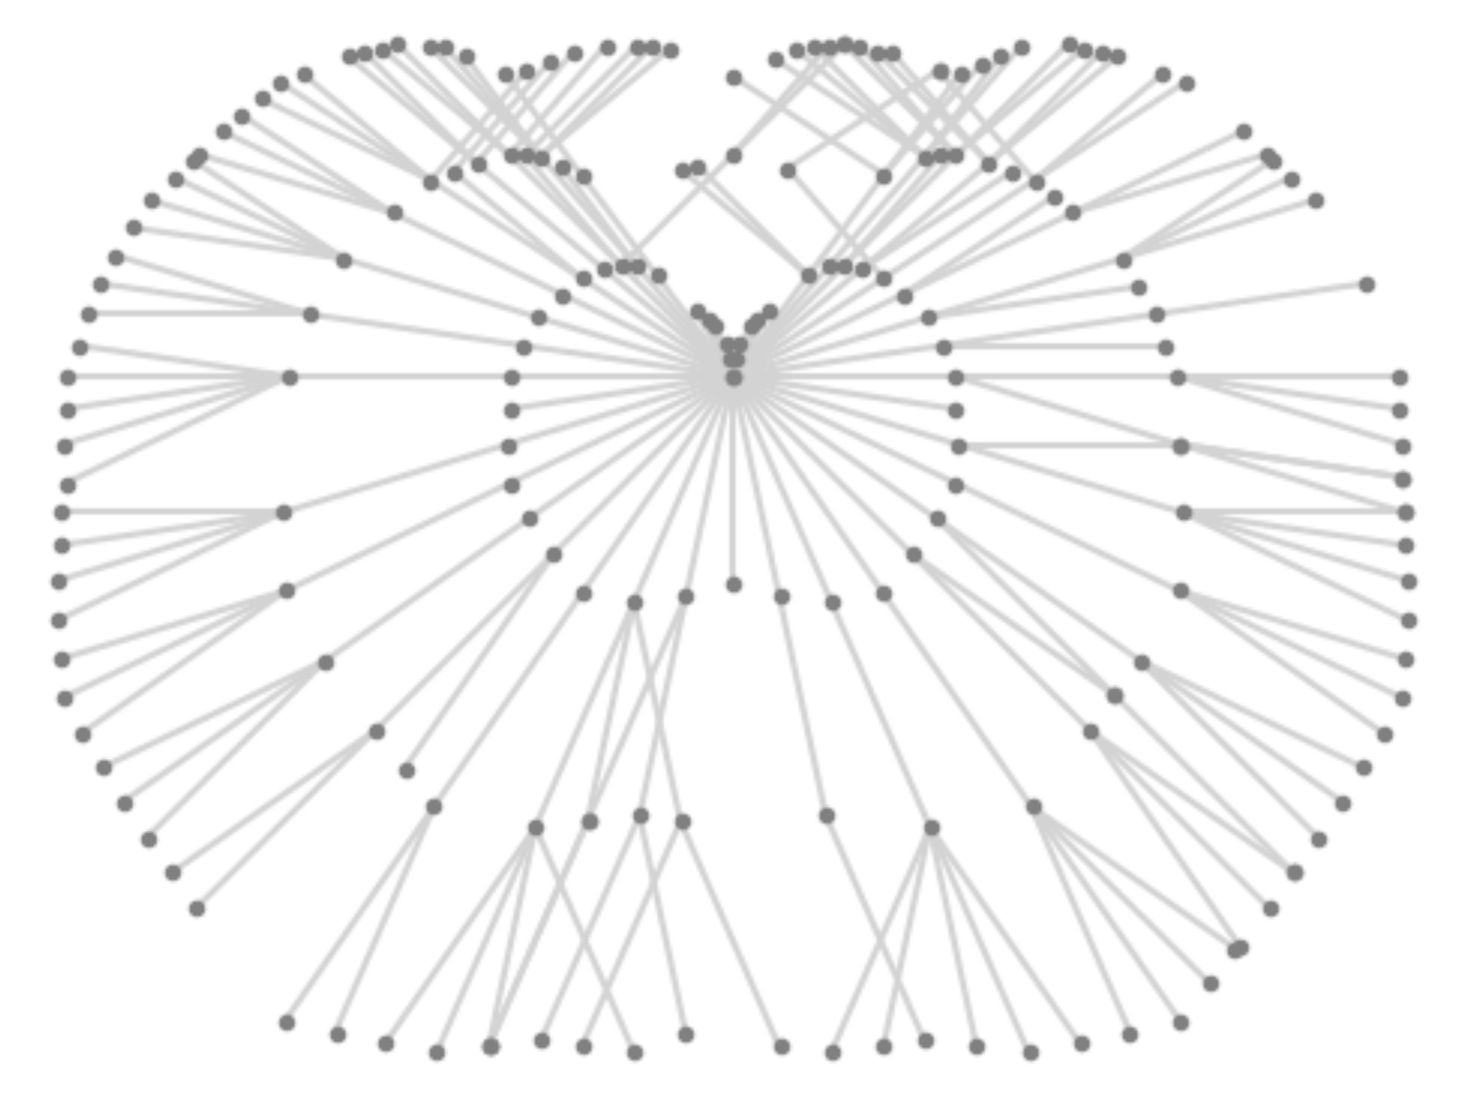
3.7. Computation of Isochrones
| Algorithm 1 Compute Isochrones |
Require: as described above m a lower bound on the number of sample points used Ensure:B such that and B is in direction w from A ▹ heuristic for an initial value whiledo if then ▹ reset values and restart with smaller step size end if end while ▹ Small correction of the last step |
4. The hrosailing Package
4.1. How to Install
4.2. Dependencies and Compatibility
- Python 3.7, 3.8 or 3.9 has to be installed;
- Python package NumPy compatible with version 1.21.2;
- Python package SciPy compatible with version 1.7.1;
- Python package Matplotlib compatible with version 3.4.3;
- Python package pynmea2 compatible with version 1.18.0 (only when working with NMEAFileHandler).
- files containing NMEA sentences;
- csv files of polar diagrams in formats used by the ORC and OpenCPN respectively, as well as other established formats;
- NumPy arrays.
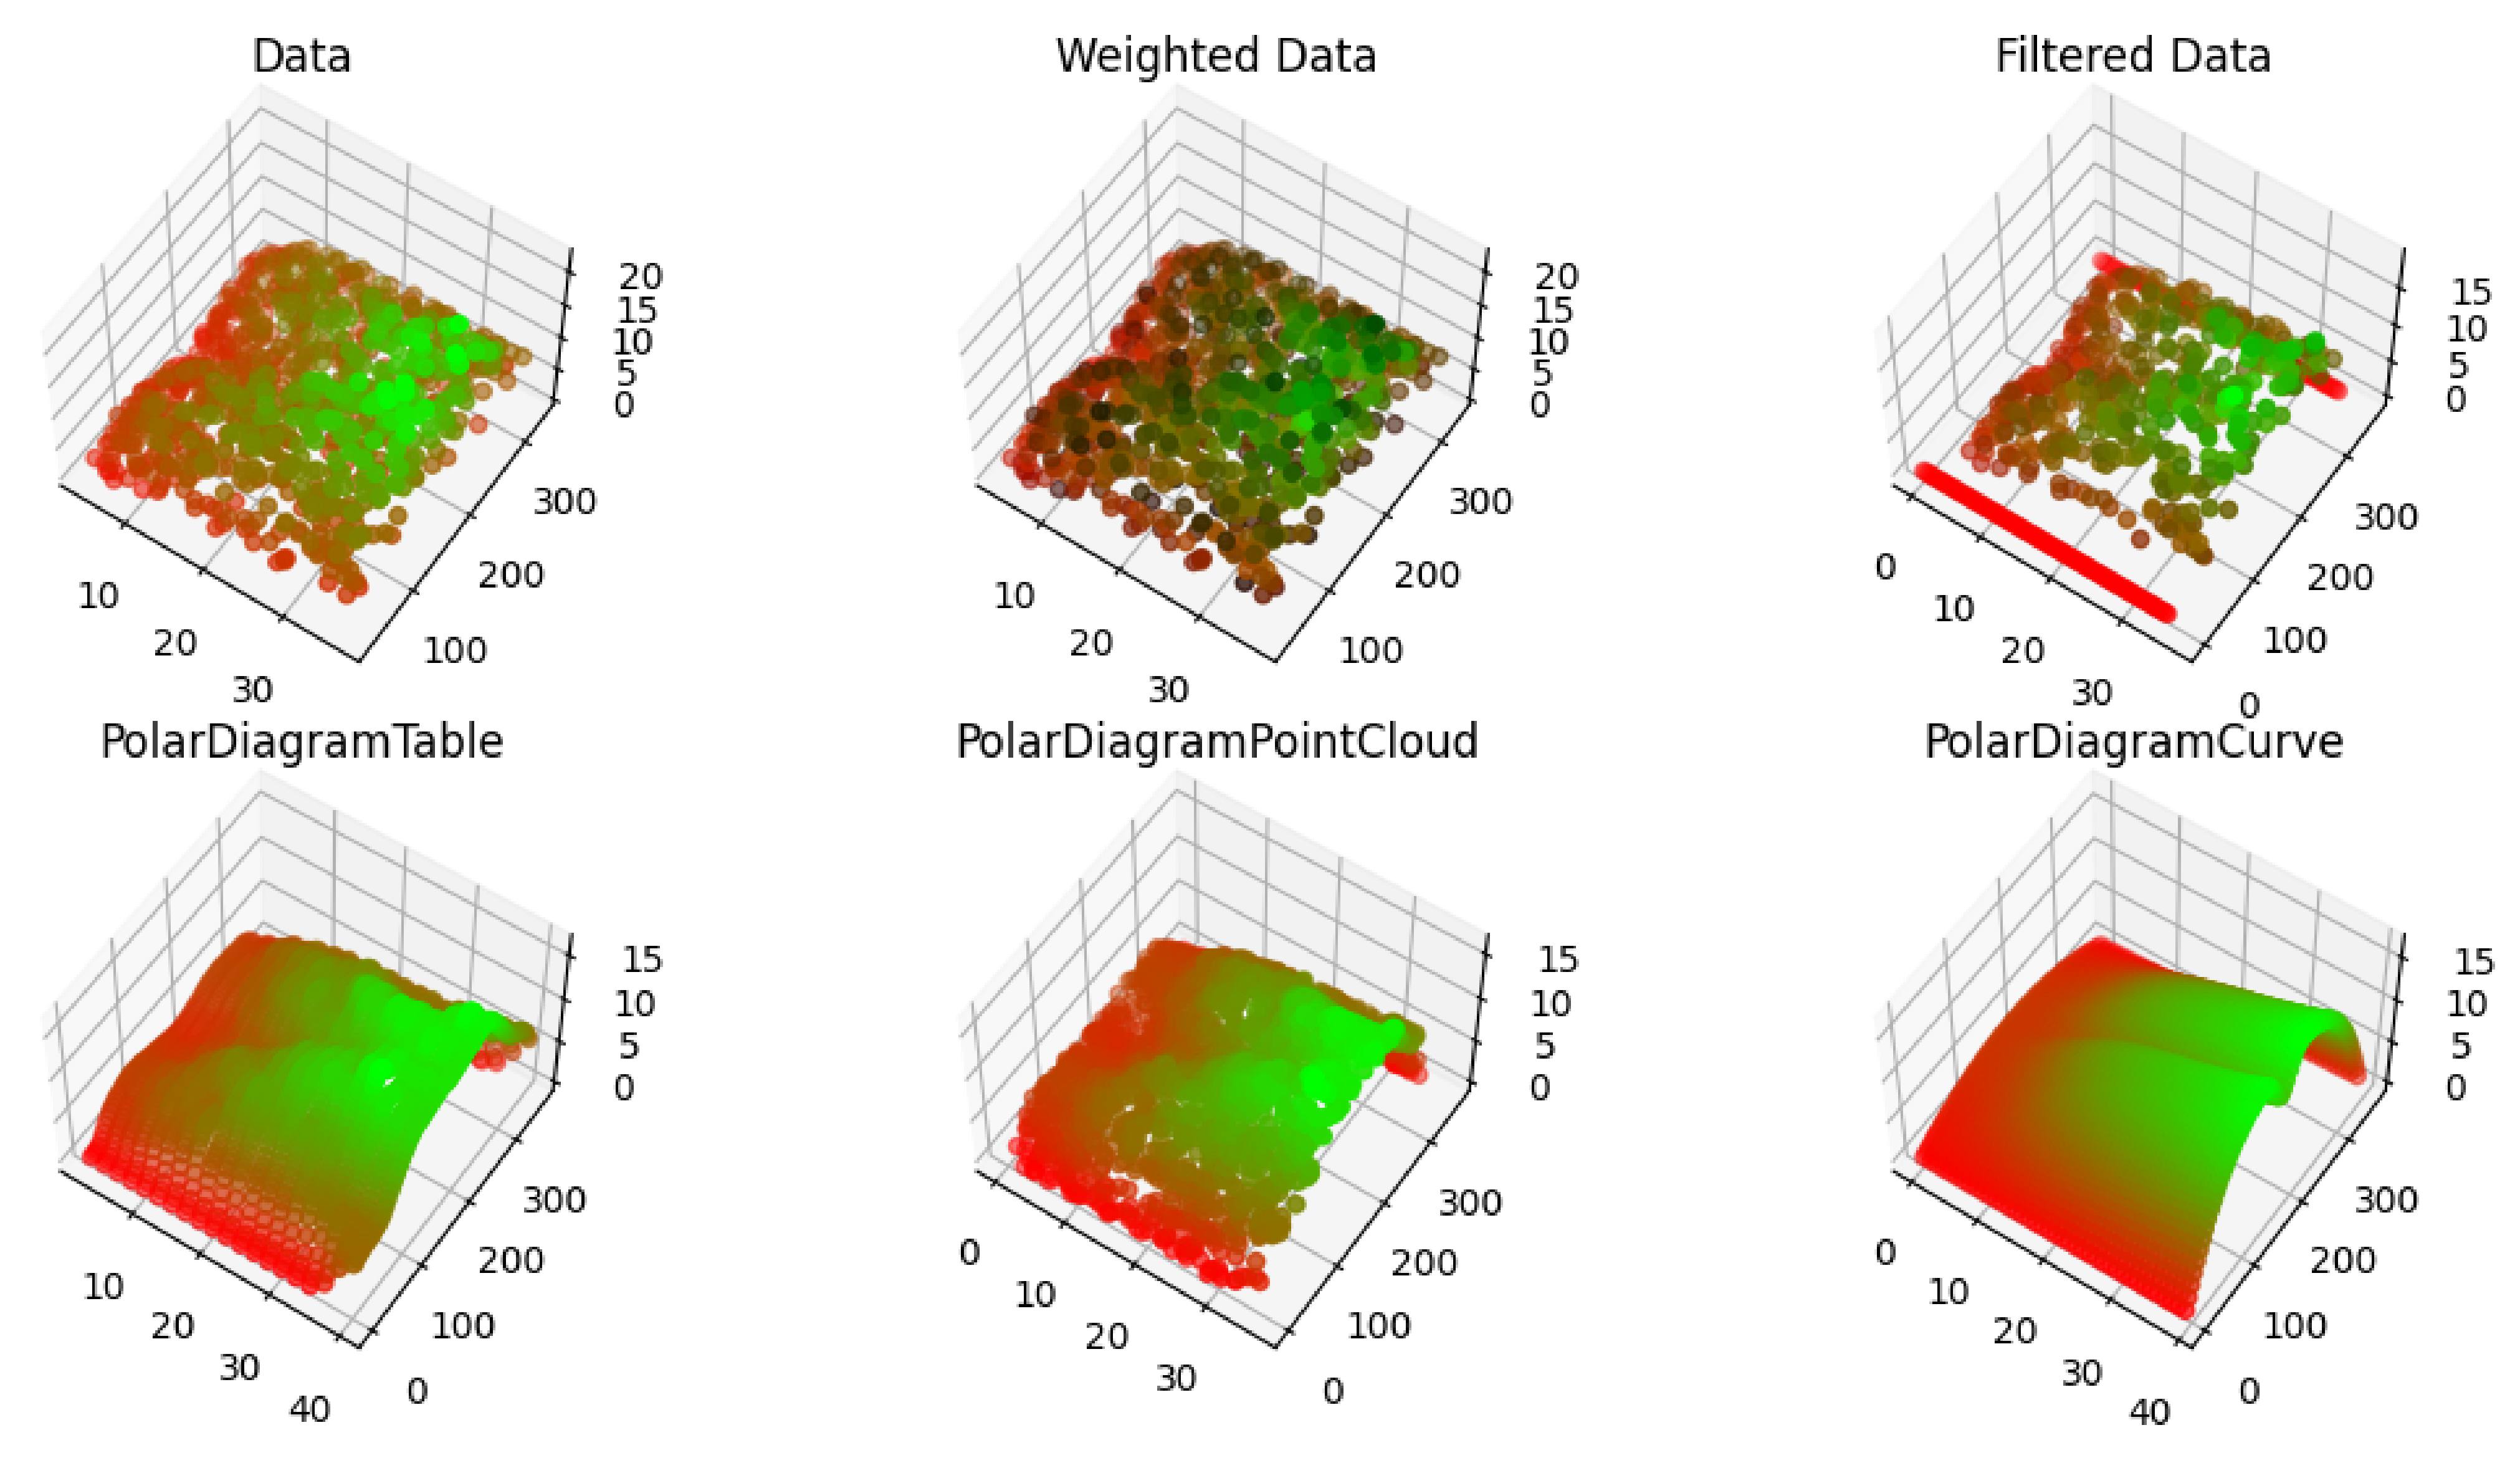
4.3. Example of Use
4.3.1. PolarPipeline
     $GPVHW,,T,,,11.11,,,,∗39
     $GPMWV,163.80,T,19.04,N,A,∗33
     $GPVHW,,T,,,4.14,,,,∗0A
     $GPMWV,113.57,T,4.21,N,A,∗33
fromhrosailing.pipelineimport PolarPipeline, TableExtension
from hrosailing.pipelinecomponents import NMEAFileHandler
handler = NMEAFileHandler(
    sentences=[″VHW″, ″MWV″],
    attributes=[″Wind speed″, ″Wind angle″, ″Water speed knots″]
)
pipeline = PolarPipeline(
    handler=handler,
    extension=TableExtension()
)
pd = pipeline(″example.nmea″)
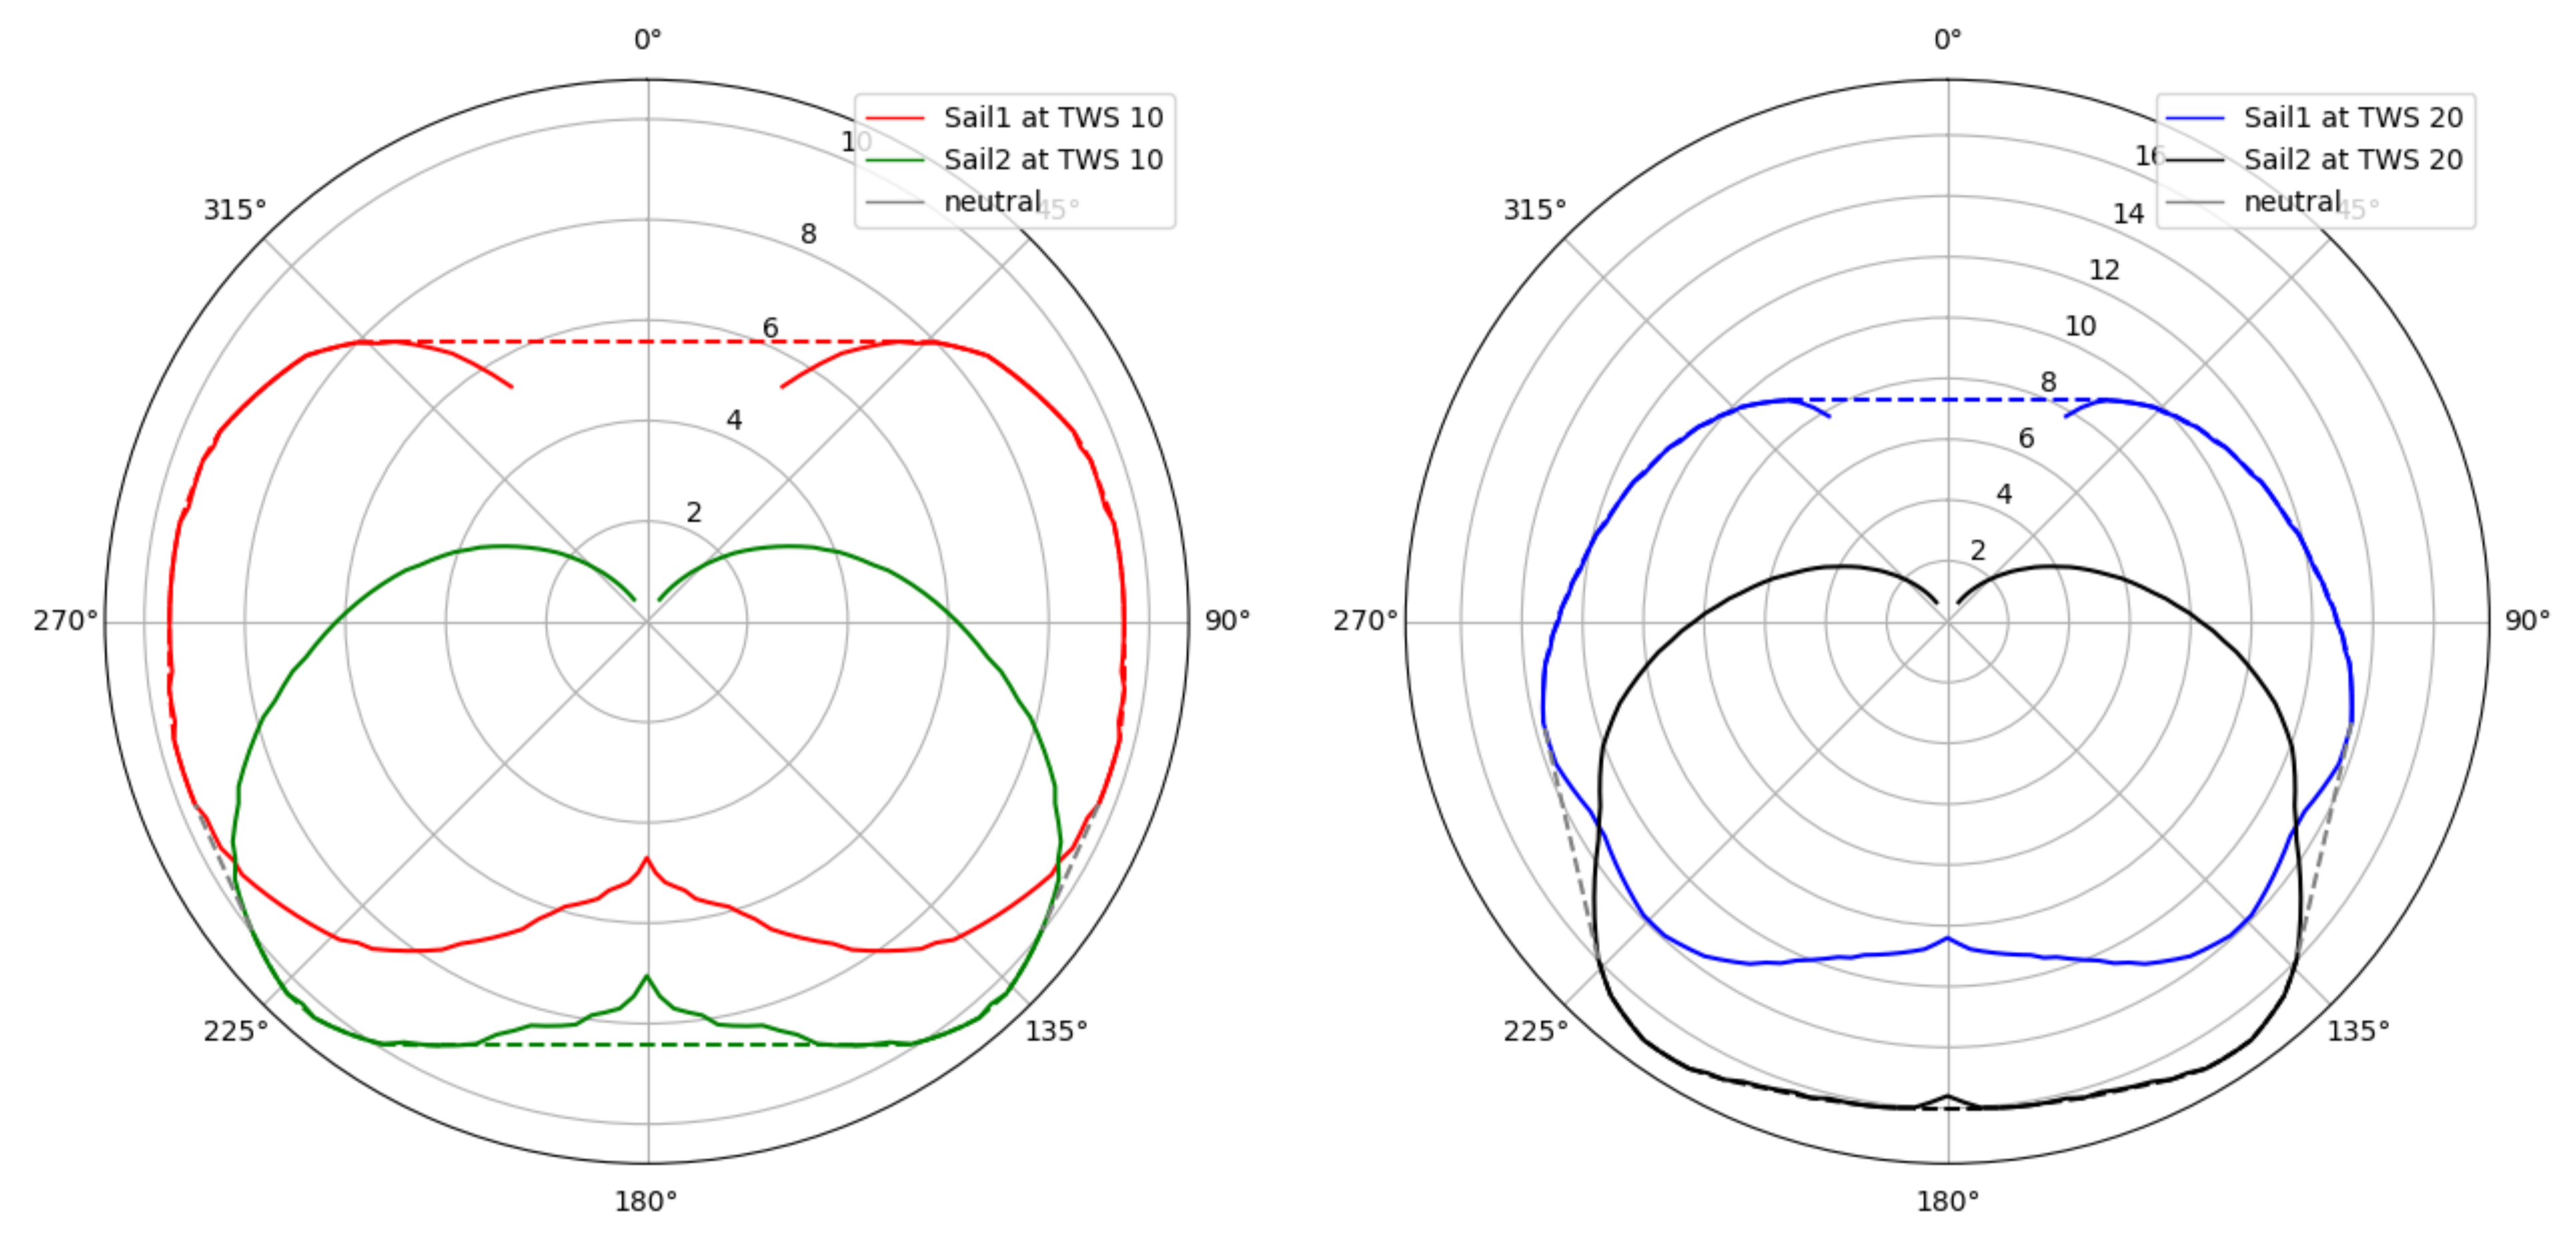
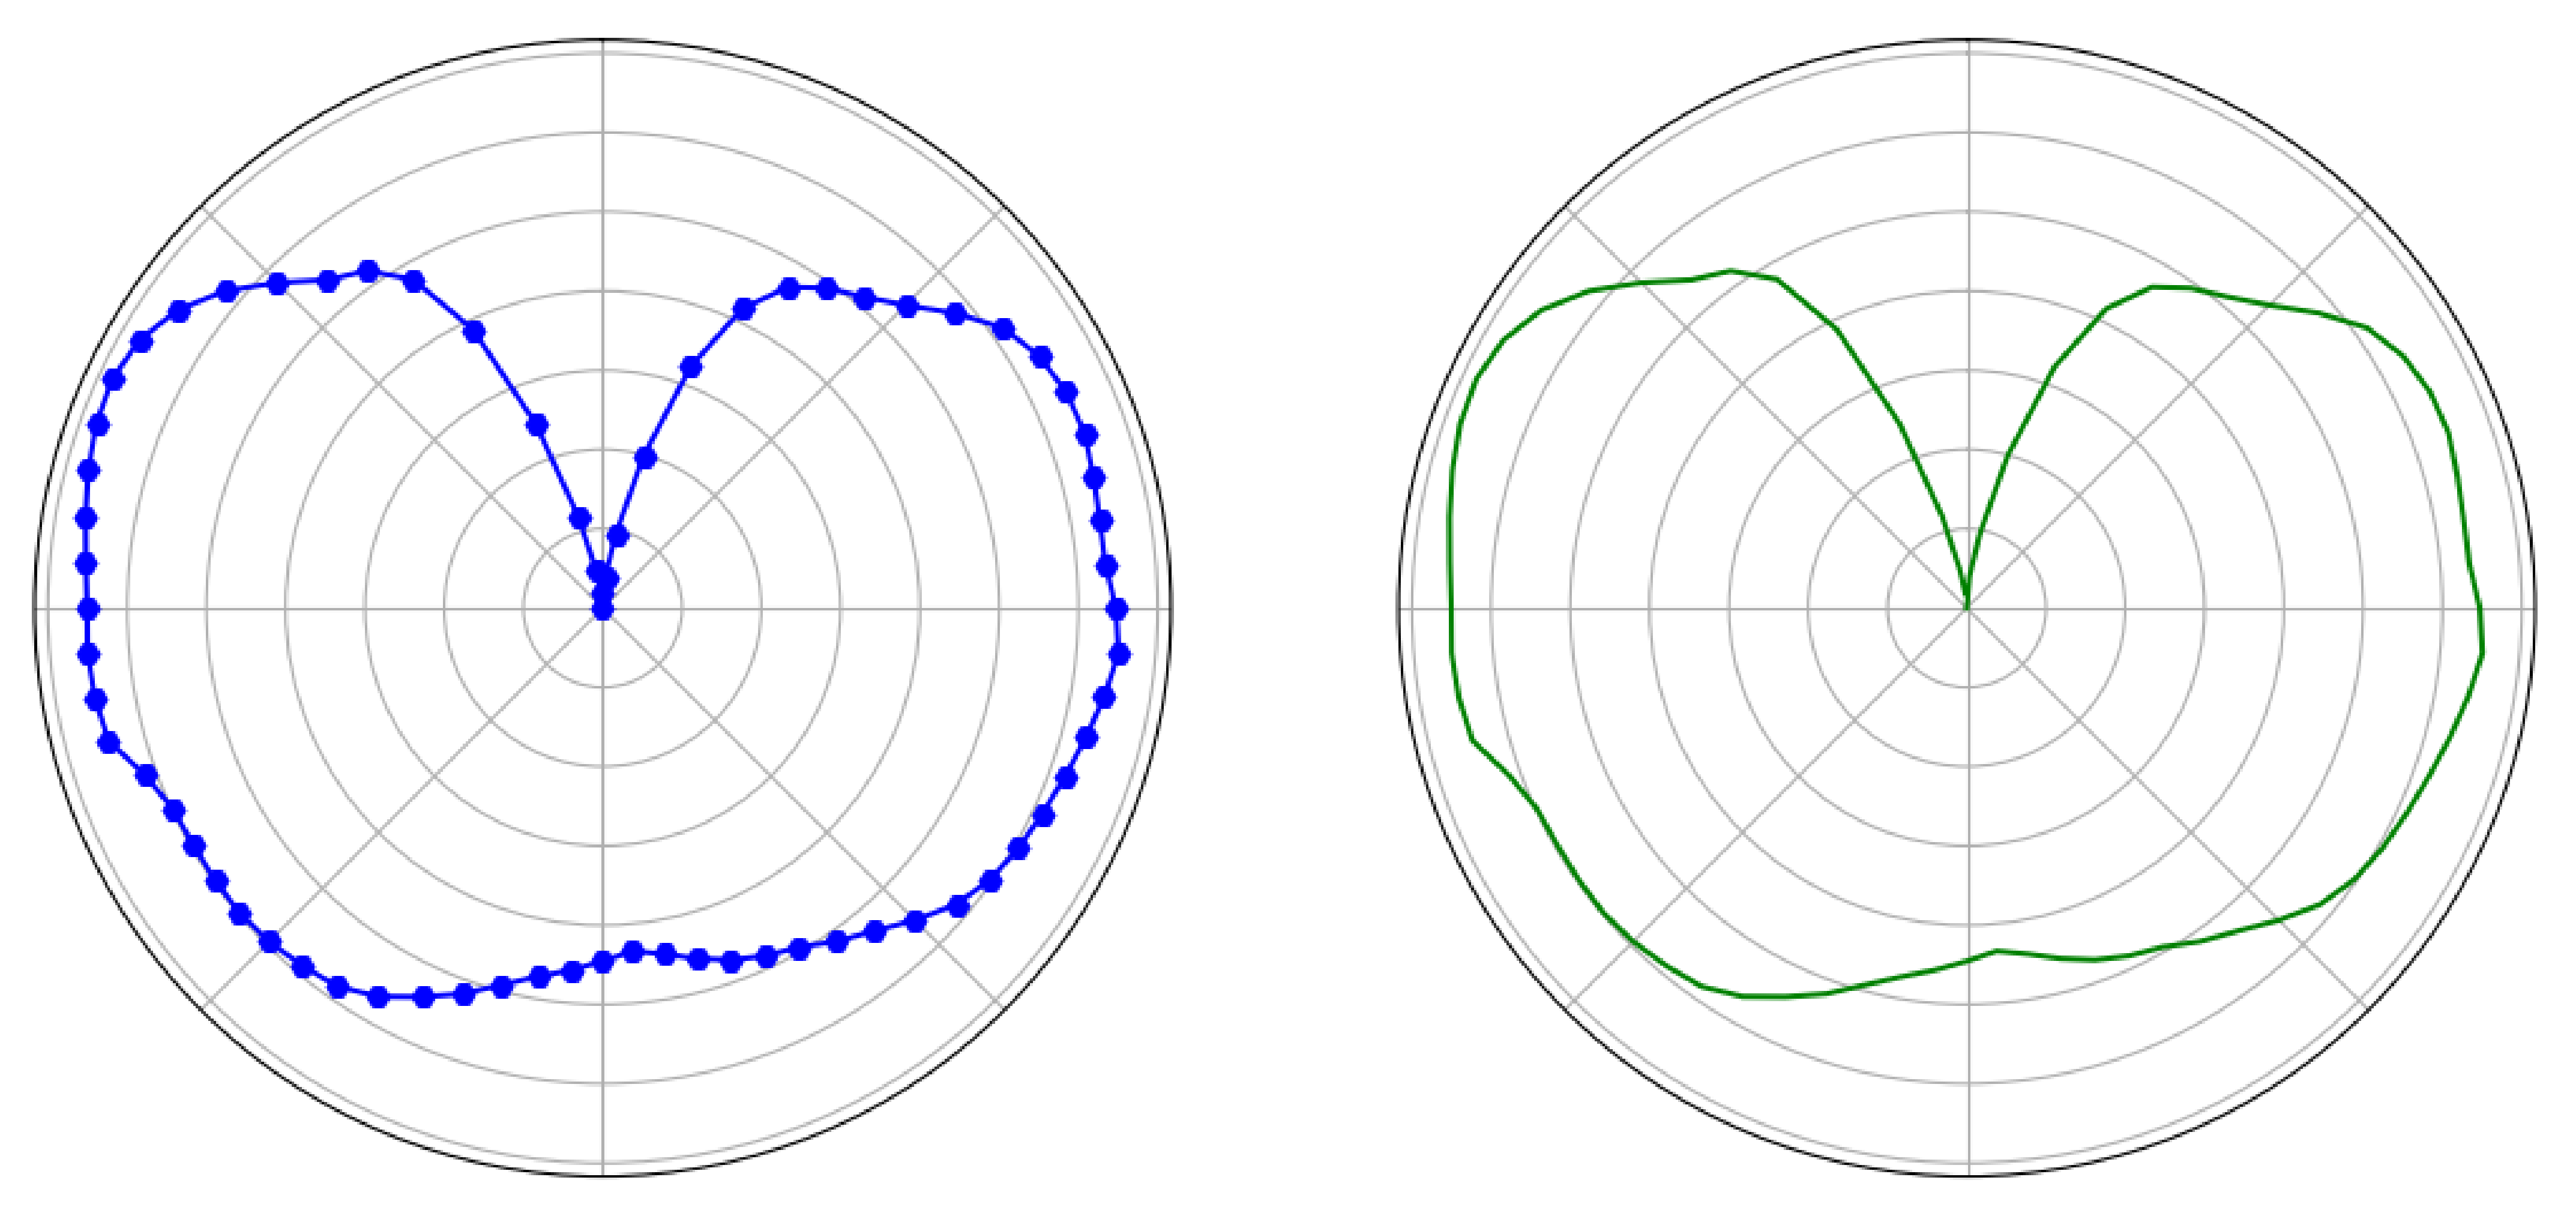
4.3.2. Visualisation
importmatplotlib.pyplotasplt
ax1 = plt.subplot(121, projection=″polar″)
ax2 = plt.subplot(122, projection=″polar″)
for ax in [ax1, ax2]:
                #remove labels from axis
                ax.set_xticklabels([])
                ax.set_yticklabels([])
pd.plot_polar(
                ws=10,
                color="blue",
                marker="H",
                ax=ax1
)
pd.plot_polar(
                ws=10,
                ls="-",
                ms=2,
                ax=ax2
)
plt.show()
4.3.3. Further Calculations with Polar Diagrams
fromhrosailing.cruisingimport convex_direction
for dirin convex_direction(pd, ws=14, direction=5):
    print(dir)
results in
Sail with an angle of 40.0 to the wind for 53.33 percent of the time
Sail with an angle of 325.0 to the wind for 46.67 percent of the time
importNumPyasnp
from hrosailing.cruising import WeatherModel
from datetime import timedelta
from datetime import datetime as dt
n, m, k, l = 500, 50, 40, 2
data = 20 ∗ (np.random.random((n, m, k, l)) - 0.5)
wm = WeatherModel(
    data=data,
    times=[dt.now() + i ∗ timedelta(hours=1) for i in range(n)],
    lats=np.linspace(40, 50, m),
    lons=np.linspace(40, 50, k),
    attrs=[″UGRID″, ″VGRID″]
)
fromdatetimeimport datetime as dt
from hrosailing.cruising import cost_cruise
cc = cost_cruise(
    pd=pd,
    start=(42, 43),
    end=(42.5, 43),
    start_time=dt.now(),
    wm=wm
)
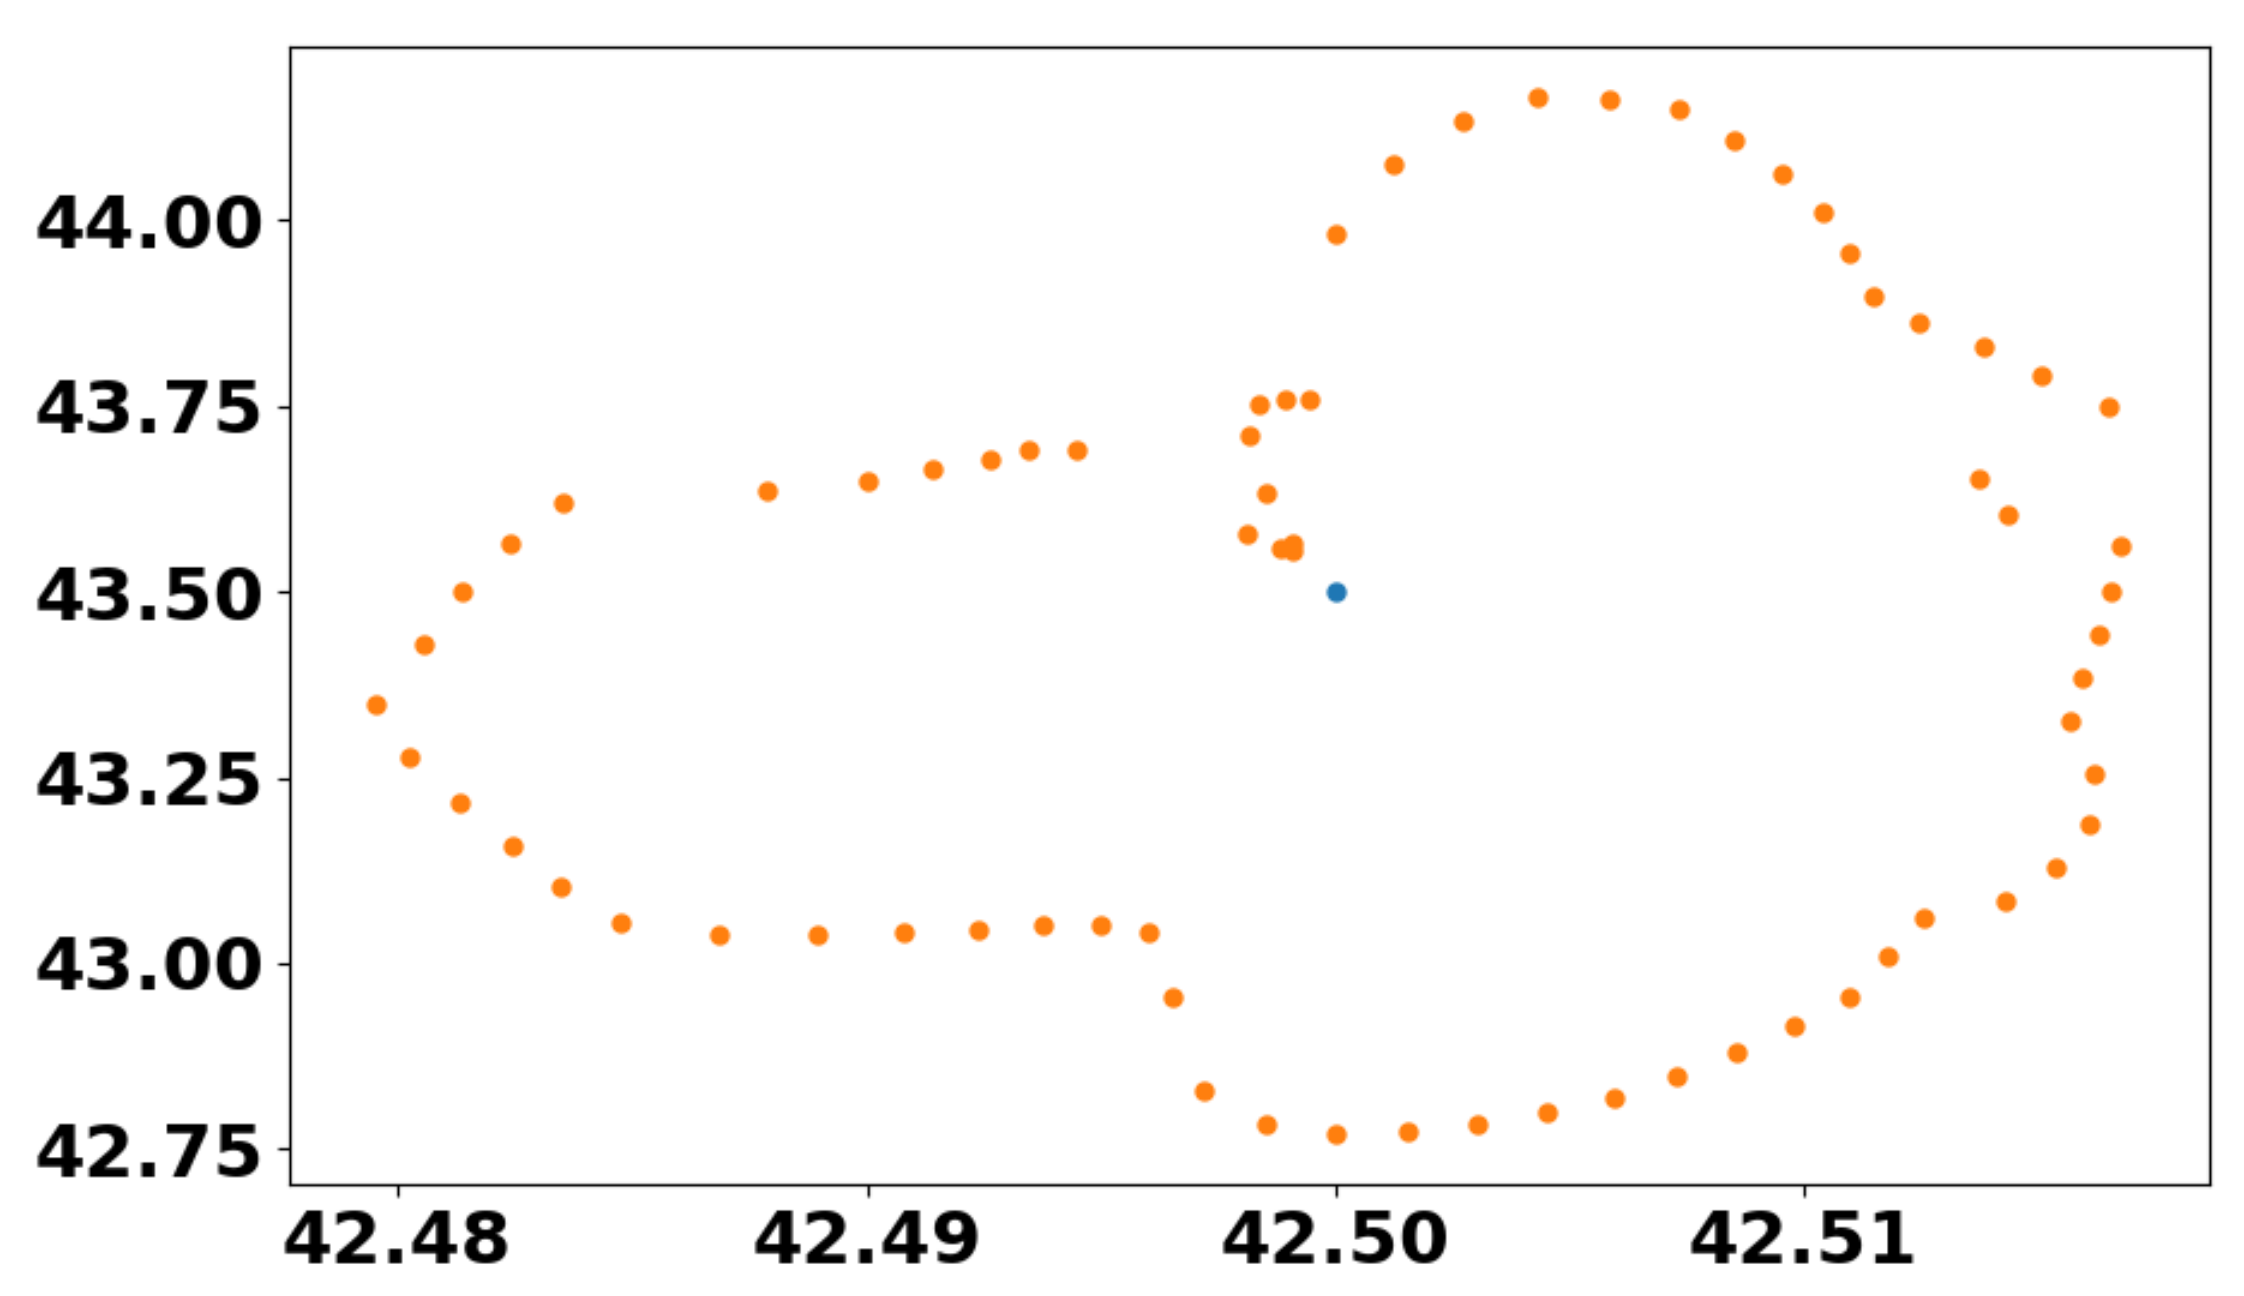
fromhrosailing.cruisingimport isochrone
from datetime import datetime as dt
ic = isochrone(
    pd=pd,
    start=(42,43),
    start_time = dt.now(),
    direction=45,
    wm=wm,
    total_time=1/3
)
This results in
((42.03, 44.44), 3.40)
5. Real-World Study Case
6. Conclusions and Possible Future Extensions
- basic weather-routing algorithms;
- handling of weather forecast data in grib format;
- use of spherical geometry for coordinates;
- machine learning algorithm to choose the right model function for PolarDiagramCurve;
- graphical interfaces;
- more specific predefined pipeline components and model functions;
- methods for online adjustments of a given polar diagram;
- support for handling vessel information.
Author Contributions
Funding
Data Availability Statement
Acknowledgments
Conflicts of Interest
Abbreviations
| AWA | apparent wind angle |
| AWD | apparent wind direction |
| BD | boat direction |
| BSP | boat speed |
| NMEA | National Marine Electronics Association |
| ORC | Offshore Sailing Congress |
| PD | polar diagram |
| RWD | relative wind direction |
| SOG | speed over ground |
| TWA | true wind angle |
| TWD | true wind direction |
| TWS | true wind speed |
| VPP | velocity prediction program |
References
- Garett, R. The Symmetry of Sailing: The Physics of Sailing for Yachtsman; Sheridan House Inc.: Davie, FL, USA, 1996. [Google Scholar]
- Püschl, W. Physik des Segelns: Wie Segeln Wirklich Funktioniert; John Wiley & Sons: Hoboken, NJ, USA, 2012. [Google Scholar]
- Aartrijk, M.L.V.; Tagliola, C.P.; Adriaans, P.W. AI on the Ocean: The RoboSail project. In Proceedings of the 15th Eureopean Conference on Artificial Intelligence, ECAI’2002, Lyon, France, 21–26 July 2002. [Google Scholar]
- Stelzer, R.; Pröll, T. Autonomous sailboat navigation for short course racing. Robot. Auton. Syst. 2008, 56, 604–614. [Google Scholar] [CrossRef]
- Philpott, A.; Mason, A. Optimising yacht routes under uncertainty. In Proceedings of the SNAME 15th Chesapeake Sailing Yacht Symposium, Annapolis, ML, USA, 26–27 January 2001. [Google Scholar]
- Życzkowski, M. Method of routing ships sailing in dedicated environment. Annu. Navig. 2017, 24, 147–160. [Google Scholar] [CrossRef] [Green Version]
- Kerhascoet, H.; Laurent, J.; Cerqueus, A.; Sevaux, M.; Senn, E.; Hauville, F.; Coneau, R. Methodology for optimal wind vane design. In Proceedings of the OCEANS 2016—Shanghai, Shanghai, China, 10–13 April 2016; pp. 1–7. [Google Scholar]
- ORC Speed Guide. Available online: http://data.orc.org/public/samples/Speed_Guide_Sample.pdf (accessed on 10 August 2021).
- ORC VPP Documentation 2016. Available online: https://www.orc.org/rules/ORC%20VPP%20Documentation%202016.pdf (accessed on 11 August 2021).
- Wilson, P. Basic Naval Architecture: Ship Stability; Springer: Berlin/Heidelberg, Germany, 2018. [Google Scholar]
- Claughton, A.; Wellicome, J.; Shenoi, R. Sailing Yacht Design: Theory, University of Southampton; Computing Service: Southampton, UK, 2006. [Google Scholar]
- Lee, H.; Park, M.; Park, S.; Rhee, S. Prediction of velocity and attitude of a yacht sailing upwind by computational fluid dynamics. Int. J. Nav. Archit. Ocean. Eng. 2016, 8, 1–12. [Google Scholar] [CrossRef] [Green Version]
- Simon, S. Generating Custom-Fit Polar Diagrams From Performance Measurements On Sailing Yachts. Master’s Thesis, Graz University of Technology, Graz, Austria, 2017. [Google Scholar]
- Życzkowski, M.; Szłapczyński, R. Multi-Objective Weather Routing of Sailing Vessels. Pol. Marit. Res. 2017, 24, 10–17. [Google Scholar] [CrossRef] [Green Version]
- Wang, H.; Mao, W.; Eriksson, L. Benchmark study of five optimization algorithms for weather routing. In Proceedings of the ASME 2017 36th International Conference on Ocean, Offshore and Arctic Engineering, Trondheim, Norway, 25–30 June 2017; p. V07BT06A023. [Google Scholar]
- Jing, W.; Liu, C.; Li, T.; Rahman, A.; Xian, L.; Wang, X.; Wang, Y.; Guo, Z.; Brenda, G.; Tendai, K. Path Planning and Navigation of Oceanic Autonomous Sailboats and Vessels: A Survey. J. Ocean. Univ. China 2020, 19, 609–621. [Google Scholar] [CrossRef]
- Weather Routing. Available online: https://routing.luckgrib.com/ (accessed on 18 August 2021).
- iso-third-sparse.jpeg. Available online: https://routing.luckgrib.com/intro/isochrones/img/iso-third-sparse.jpeg/ (accessed on 18 August 2021).
- OpenCPN. Available online: https://opencpn.org/ (accessed on 16 August 2021).
- Shepard, D. A two-dimensional interpolation function for irregularly-spaced data. In Proceedings of the 1968 23rd ACM National Conference, New York, NY, USA, 27–29 August 1968; Association for Computing Machinery: New York, NY, USA, 1968; pp. 517–524. [Google Scholar]
- NMEA 0183 Interface Standard. Available online: https://www.nmea.org/content/STANDARDS/NMEA_0183_Standard (accessed on 6 October 2021).
- Bickel, P.; Doksum, K. Mathematical Statistics—Basic Ideas and Selected Topics; CRC Press: Boca Raton, FL, USA, 2015; Volume 1. [Google Scholar]
- Boggs, P.; Rogers, J. Orthogonal distance regression. Contemp. Math. 1990, 112, 183–194. [Google Scholar]
- González, Á. Measurement of areas on a sphere using Fibonacci and latitude-longitude lattices. Math. Geosci. 2010, 42, 49–64. [Google Scholar] [CrossRef] [Green Version]
- Hüttig, C.; Stemmer, K. The spiral grid: A new approach to discretize the sphere and its application to mantle convection. Geochem. Geophys. Geosyst. 2008, 9. [Google Scholar] [CrossRef]
- Butcher, J. Numerical Methods for Ordinary Differential Equations; John Wiley & Sons, Ltd.: Chichester, UK, 2016. [Google Scholar]
- Expedition—Navigation and Sailing Software. Available online: https://www.expeditionmarine.com/ (accessed on 6 October 2021).
- ADRENA—Navigation Software to Serve Your Performance. Available online: https://www.adrena-software.com/ (accessed on 6 October 2021).
- Apache License, Version 2.0. Available online: https://www.apache.org/licenses/LICENSE-2.0 (accessed on 23 September 2021).
- Dannenberg, V.; Schüler, R. Hrosailing Version 0.9.6.2. Available online: https://github.com/hrosailing/hrosailing (accessed on 8 December 2021).
- OpenPlotter. Available online: https://openplotter.readthedocs.io/en/2.x.x/ (accessed on 8 December 2021).


| Representation | Table | PointCloud | Curve |
|---|---|---|---|
| Human usable | ✔ | ✗ | ✗ |
| Human readable | ✔ | ✔ | ✗ |
| Compatible with other software | ✔ | ✗ | ✗ |
| Independent of interpolation | ✗ | (✗) | ✔ |
| Adaptability | (✔) | ✔ | ✗ |
| Smooth polar plot | ✗ | (✗) | ✔ |
| complete slices | ✔ | ✗ | ✔ |
| adapts to real data | ✗ | ✔ | ✔ |
Publisher’s Note: MDPI stays neutral with regard to jurisdictional claims in published maps and institutional affiliations. |
© 2022 by the authors. Licensee MDPI, Basel, Switzerland. This article is an open access article distributed under the terms and conditions of the Creative Commons Attribution (CC BY) license (https://creativecommons.org/licenses/by/4.0/).
Share and Cite
Dannenberg, V.; Schüler, R.; Schürmann, A. A Data Processing Framework for Polar Performance Diagrams. Appl. Sci. 2022, 12, 3085. https://doi.org/10.3390/app12063085
Dannenberg V, Schüler R, Schürmann A. A Data Processing Framework for Polar Performance Diagrams. Applied Sciences. 2022; 12(6):3085. https://doi.org/10.3390/app12063085
Chicago/Turabian StyleDannenberg, Valentin, Robert Schüler, and Achill Schürmann. 2022. "A Data Processing Framework for Polar Performance Diagrams" Applied Sciences 12, no. 6: 3085. https://doi.org/10.3390/app12063085
APA StyleDannenberg, V., Schüler, R., & Schürmann, A. (2022). A Data Processing Framework for Polar Performance Diagrams. Applied Sciences, 12(6), 3085. https://doi.org/10.3390/app12063085