Article

Mass Cultivation of Microalgae: I. Experiences with Vertical Column Airlift Photobioreactors, Diatoms and CO2 Sequestration

1
Finnfjord AS, N-9305 Finnsnes, Norway
2
UiT The Arctic University of Norway, N-9037 Tromsø, Norway
3
NILU—Norwegian Institute for Air Research, N-9007 Tromsø, Norway
*
Author to whom correspondence should be addressed.
Appl. Sci. 2022, 12(6), 3082; https://doi.org/10.3390/app12063082
Submission received: 20 January 2022 / Revised: 14 March 2022 / Accepted: 15 March 2022 / Published: 17 March 2022

Abstract

:
From 2015 to 2021, we optimized mass cultivation of diatoms in our own developed vertical column airlift photobioreactors using natural and artificial light (LEDs). The project took place at the ferrosilicon producer Finnfjord AS in North Norway as a joint venture with UiT—The Arctic University of Norway. Small (0.1–6–14 m3) reactors were used for initial experiments and to produce inoculum cultures while upscaling experiments took place in a 300 m3 reactor. We here argue that species cultivated in reactors should be large since biovolume specific self-shadowing of light can be lower for large vs. small cells. The highest production, 1.28 cm3 L−1 biovolume (0.09–0.31 g DW day−1), was obtained with continuous culture at ca. 19% light utilization efficiency and 34% CO2 uptake. We cultivated 4–6 months without microbial contamination or biofouling, and this we argue was due to a natural antifouling (anti-biofilm) agent in the algae. In terms of protein quality all essential amino acids were present, and the composition and digestibility of the fatty acids were as required for feed ingredients. Lipid content was ca. 20% of ash-free DW with high EPA levels, and omega-3 and amino acid content increased when factory fume was added. The content of heavy metals in algae cultivated with fume was well within the accepted safety limits. Organic pollutants (e.g., dioxins and PCBs) were below the limits required by the European Union food safety regulations, and bioprospecting revealed several promising findings.

1. Introduction

Numerous recent publications have dealt with the large potential of microalgae to become future producers of energy, food and bioactive compounds [1,2,3,4,5,6,7,8,9,10,11,12]. The underlying reasons for this are that they are nutritious in terms of lipid and protein and the fact that they “grow” by binary fission (division), making them capable of doubling their biomass every day. They can also thrive in both fresh and ocean water, and as photoautotrophs they are efficient CO2 sequestration agents [13]. Microalgae thus have large potential in carbon capture and sequestration (CCS) as well as in carbon capture and utilization (CCU) processes [14,15,16]. Other promising and sometimes successful microalgae applications are (in operation, tested or planned) production of biogas, utilization of wastewater as inorganic nutrient source or production of biofuel [17,18,19].
Industrial mass production of microalgae has been pursued for more than a century and was probably first suggested and demonstrated by Beijierinck [20] with monocultures of Chlorella vulgaris. The “father” of photosynthesis, Warburg [21], also applied Chlorella sp. in his seminal CO2 assimilation experiment. After World War 2, interest in microalgae cultivation increased, and a book on the subject stated: “… [the authors] hope that this book will result in increased progress toward the large-scale culture of algae” [22]. Over the years commercial production has gained momentum in Europe, Asia, Japan, Australia and India [23], but it is mainly a few small green and blue-green species from the genera Chlorella, Spirulina, Dunaliella, Aphanizomenon, Haematococcus, Crypthecodinium and Shizochutrium that are cultivated. The global annual production is difficult to estimate but probably adds up to ca. 23,000 tons [24,25]. Considering the announced potential of microalgae to be a future source for biofuel and feed, this is highly meagre compared to the world soy production that is 360 × 106 tons. Microalgae hence amounts to only ca. 0.05‰ of world soy production. Thus, mass cultivation of microalgae compared to other land-based crops must still be considered in its infancy. The reasons for this may be diverse, but the bottom line is that the production is expensive. Microalgae are present at much higher concentrations in PBRs than in their natural environments. The annual photoautotrophic production along, e.g., the coast of Norway, amounts to 100–200 g C m−2 [26]. This equals an average production rate of merely 0.0001 g L−1 day−1 (DW). Compared to the 300–6000 times higher (0.03–0.6 g L−1 day−1 (DW) production levels aimed at in industrial PBRs [5,8,27], this illustrates some of the challenges one meets when attempting to mass cultivate microalgae for industrial purposes. Production is often hampered by complex and expensive production processes [28,29]. This especially relates to energy use (e.g., pumping, illumination, complexity of reactors and de-watering) but also to contamination, lack of temperature control, troubles with gas exchange (CO2 and O2), contamination and illumination [30,31].
Tamiya [32] stated that the production of 1 ton of Chlorella would cost about USD 520 and can therefore not compete with inexpensive proteinaceous plant materials like, e.g., soy and bean meal. This is still a relevant statement as high costs hinder production of large volumes. Microalgae therefore appear on the world market as small volume niche products [33,34], i.e., as pharmaceuticals, bioactives, nutraceuticals, vitamins, enzymes and health food [6]. We stress that here we have focused on photoautotrophic algae and not so-called heterotrophic algae that utilize organic resources [35].
Compared to the large amounts of microalgae species that exist, i.e., perhaps more than 1,000,000 in total including 200,000 diatoms [36,37], very few species have been tested out and exploited commercially. None of them have been genetically adapted (by hybridization, mutation or genetic engineering) towards economically sustainable production, as is the case with all their terrestrial agricultural counterparts [38,39].
The diatoms especially have drawn little industrial focus. Diatoms are the most important primary producers in the oceans, especially in temperate and Arctic areas and upwelling zones where the largest fisheries are [40,41]. Diatoms are considered to be important potential sources of biofuel, pharmaceuticals and food/feed [5,8,42,43]. They are also potential valuable producers of unsaturated fatty acids, especially omega-3 fatty acids [44,45,46,47]. Diatoms differ from other microalgae by lacking organic cell walls but live in houses of opaline silica, i.e., they reside in transparent glass houses ornamented with detailed nanostructures that can handle and optimize light in diverse ways [48].
Microalgae are grown either in open (pond) culture systems or closed flat plate, tubular and vertical column design PBRs. Of these, due to the greater ability to control the environment, closed types are commonly considered the most promising ones [30,49]. On the other hand, if economic analyses are included, it is the open pond type that often comes out as the most profitable type [50].
Common to the few species of microalgae that have been and are exploited in mass cultivation is that they are small [6,51,52,53,54,55,56,57]. Since they are small, they share the trait that they have a higher surface to volume ratio relative to larger microalgae cells (Table 1). When cell size increases, it logically follows that the volume of the cell increases faster than the surface area, since volume is cubed while surface area is squared. This causes a large diatom like, e.g., Coscinodiscus radiatus, to have a volume that is more than 100,000 times larger than a commonly cultivated small cell like Chlorella sp. (Table 1). Because small cells have a higher surface to volume ratio it is often reported that they possess a greater ability to absorb light and nutrients and that they therefore grow faster than large cells [58,59]. This is an oversimplified concept since other factors such as pigment type, amount, thickness, nutrient concentration, and uptake processes also play important roles [60,61]. This can cause large cells to outgrow small cells, especially when nutrient concentrations are high. Maraóón et al. [62] stated that carbon fixation per unit volume decreases with cell size in oligotrophic waters, whereas the opposite occurs in areas with high concentrations of inorganic nutrients. Cermeno et al. [61] suggested that high maximum photosynthetic efficiencies of large-sized phytoplankton might be associated with a higher PSII photochemical efficiency, characteristic of certain taxonomic groups such as diatoms.
Assuming that inorganic nutrient concentrations are sufficiently high (as they often are in photobioreactors), the most important stress factor is light, or more precisely the availability of light in space and time. According to Mie theory the diffuse scattering coefficient relative to volume of a sphere decreases with increased size [65]. According to Baker and Lavelle [66], suspensions with a mean particle size of 8.5 μm attenuate 660-nm light 15 times more efficiently than suspensions of particles with a diameter of 48 μm. Agustí [67] reported that biomass (fresh weight)-specific absorbance coefficients decreased as algal cell volume increased, regardless of the incoming irradiance, supporting the notion that reduced self-shading allows large algae to support both greater maximal biomass and production than smaller algae. In terms of optical science, large cells in light limited regimes can hence take advantage of the “package” effect. This can also be seen as a reduction in the absorption of pigmented particles relative to the absorption of the same pigments in solution [68]. Geider and Osborne [58] reported that the ratio of whole-cell to disrupted-cell absorption ranged from 0.5 to 0.7 for a small cell of Thalassiosira sp. The consequence of this is simply that the size of the microalgae will play an important role in the utilization of light, especially in densely populated commercial photobioreactors. We mean this is an important point that often has been missed during the choice of species to cultivate in photobioreactors. This “simple” fact, i.e., that self-shading can depend on particle size, has been addressed earlier [69,70]. However, it is also clear that this is modified by the fact that microalgae cells consist of several organelles of variable sizes and shapes, e.g., chloroplasts, nucleus, nucleolus, mitochondria, lipid vesicles, gas or fluid filled vacuoles and pyrenoids with varying optical properties. The cell wall can also vary (e.g., “glass” frustrule in diatoms), and the final level of reduced absorption and diffusion for each species will be a result of the number and quality of internal organelles and structures. The exact geometrical measure of a cell will only be a good measure of its optical properties in solution when the cell is completely full of material. What adds to this is that some diatoms can manipulate the wavelength of light [48].
Today’s reactors, except from vertical column designs, are constructed to handle short light depths due to the high self-shading of the small species applied [71]. These constructions are complicated and expensive devices that take up large areas vs. volume cultured. Our cultivation initiative was therefore designed to apply large cells to allow for long light depths and low self-shading. Potentially, this approach makes it possible to use (and illuminate efficiently) simple constructed columns with large volumes [64]. Another advantage related to large cells is that the harvesting process can be more efficient. The sinking speed of a sphere is ca. proportional to the square of the radius (Stokes law with a modification for shape and density). Large cells will therefore sink faster than small species if the specific cell density is higher than water, enabling, e.g., centrifugation to be more efficient [72].
If production costs could be lowered and volumes increased substantially, the potential market for algae biomass is large, as, e.g., algal biofuels and feed [39,73]. Although, if this shall be achieved, as stressed earlier, improvements related to biology and technology are required [74,75,76].
The present project was initiated in 2015 on the premise that new cost-reducing solutions were needed. When choosing species to cultivate, focus was on high photosynthetic efficiency, low self-shading, and ability to handle low temperatures. Thus, large northern/Arctic diatoms were prime candidates. The final choice of species was done after thorough literature studies as well as numerous P vs. I experiments. When choosing the reactor type, large volume, low cost and area efficacy were the guiding principles. The obvious choice here was therefore large (tank) vertical column airlift reactors with accessories, allowing for both batch and continuous culture. Finnfjord AS annually emit 300,000 tons of CO2 and 1100 tons of NOx. The aim of our project was therefore to investigate possibilities to perform sustainable circular economy and utilize factory cooling water, CO2 from fume and NOx to produce marine (diatom) biomass [10]. Analysis of chemical content, pollution and suitability of the biomass as feed/food were also planned. In recent decades, marine ingredients in Norwegian salmon feed have to a large degree been replaced by biomass of terrestrial origin [77,78], leading to, e.g., reduced polyunsaturated fatty acid (LC-PUFA) content in feed and salmon. This negatively affects the early development of salmon tissue and organs, resistance to infections and fish health [79], and it can also reduce positive health effects of omega-3 on humans [80]. Our intended prime application of the algae biomass was therefore as aquaculture feed. The present publication deals with optimization of the microalgae (diatom) cultivation process.

2. Materials and Methods

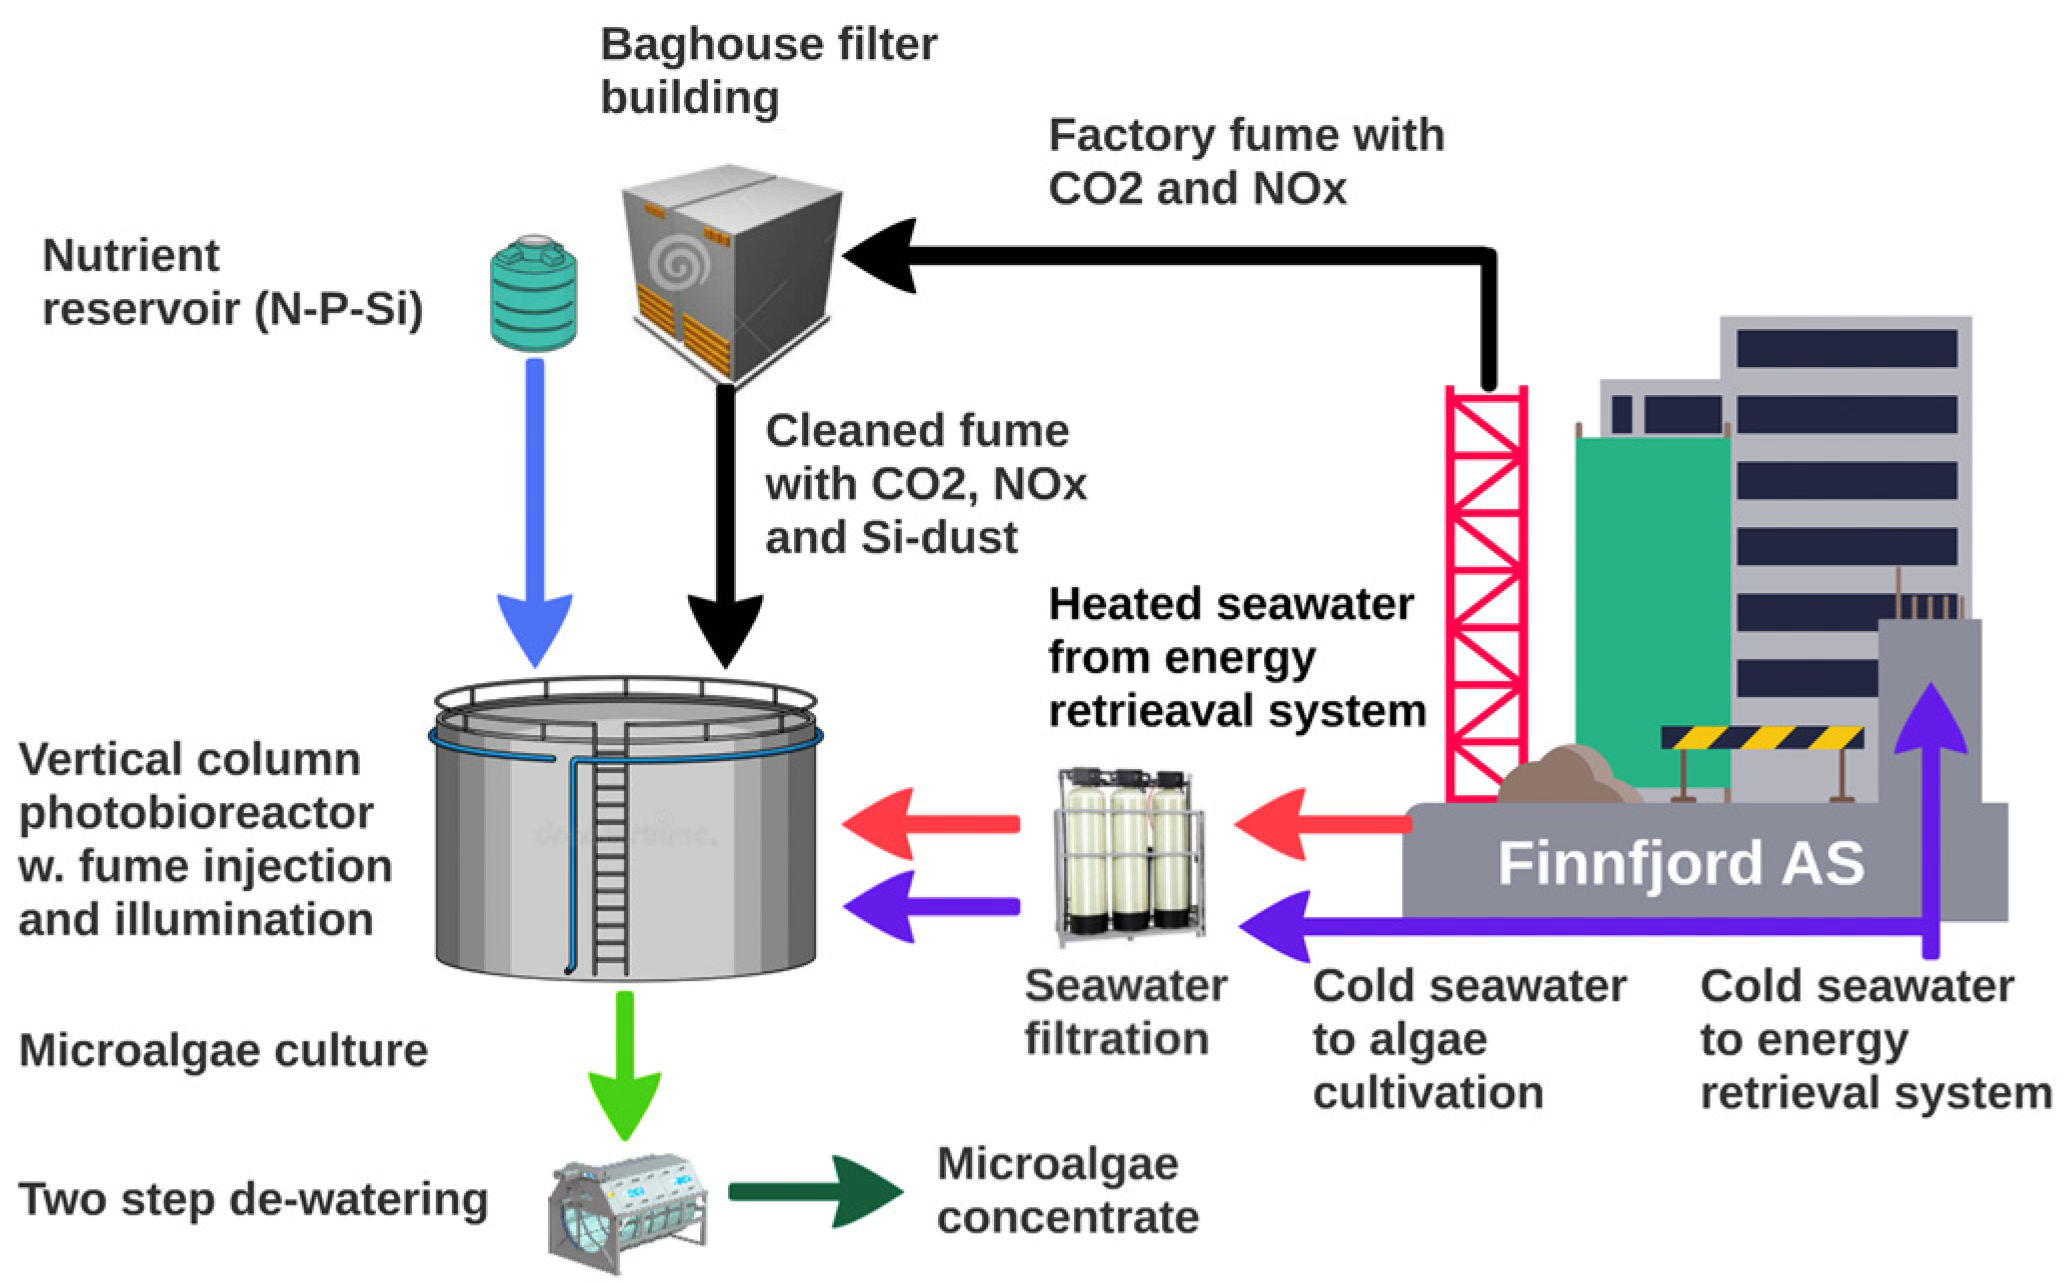
2.1. Photobioreactor Construction

The present cultivation project is an ongoing collaboration between UiT—The Arctic University of Norway in Tromsø and the ferrosilicon producing factory Finnfjord AS, situated at Finnsnes in northern Norway (69°13′47′′ N–17°58′52′′ E), i.e., well to the north of the Arctic Circle. After planning for a couple of years, experimental microalgae mass cultivation was initiated at the factory site during the spring of 2015 (Figure 1). The initiative was based on results from several years of microalgae field sampling, marine ecology studies and small-scale cultivation (150–300 L) attempts.
The main focus was on northern and/or Arctic diatoms due to their ability to handle low temperatures and light intensities [41,81,82,83,84,85]. The applied reactors were of the (open top) vertical column airlift type, i.e., cylindrical tanks with flue gas addition in the bottom layer (by a rotating gas dispersing system) and additional artificial illumination systems. The reactors have been used in repeated cultivation experiments. The aim of these experiments was to optimize the production rate, this by testing combinations of microalgae concentration and doubling rates regulated by irradiance, nutrient and CO2 addition (pH). Certain construction details, especially what concerns illumination, have been under constant revision. In 2015 experiments were performed with open cylindrical transparent plexiglas units and a 6 m3 stainless steel reactor (used diary item). In 2016 these were joined by a 6 m3 glass fiber (produced on site) and a 14 m3 stainless steel (used diary) reactor (Figure 1, Table 2). During the spring of 2018 the project entered a pre-industrial scale when a 300 m3 glass fiber reactor (produced on site) was set into functioning. The entire reactor area has a transparent acrylic roof.

2.2. Cultivation Environment and Cultivation Strategies

The cultivation medium was factory processed (cooling) seawater pumped in from 25 m depth in the outside fjord. By mixing heated and unheated water from the factory heat retrieval system we could mix the two water types with the desired temperatures. Prior to being used the water was cleaned for particles (<0.45 μm) (Figure 2, Table 2).
Inorganic plant nutrient was Yara Kristalon, which has 14% N (nitrate and ammonia) and 3.9% P (orthophosphoric acid). Si was added as dissolved sodium metasilicate. The amounts of inorganic nutrients added were adjusted according to actual growth rates and from measurements every second day. Prior to April 2020 addition was done once daily while after April this was done continuously by means of adjustable dose pumps.
Fume taken from the factory baghouse filter outlet was fed directly to the reactors with gas compressors (ordinary piston and later liquid ring ones). We cultivated both with fume added as well as with compressed air only (Figure 2).
The reactors were integrated in the production line at Finnfjord AS, and factory fume with CO2 (3–7%) and NOx (2–4 ppmv) was added with a rotating airlift (mixing) device. The reactors (0.15 m3, 0.25 m3, 2 × 6 m3, 1 × 14 m3) were run either as batch or semi-continuous type while the 300 m3 was mainly run as continuous culture.
When performing semi-continuous cultivation, volume was kept constant and each day the culture was diluted with volumes of seawater with nutrients equivalent to the harvested volume. During continuous culture the dilution rate balanced growth. The produced biomass was stored de-watered but unprocessed in a large industrial freezer container (−20 °C) prior to, e.g., inclusion in fish feed (experiments), while biomass for chemical analysis was stored in an ultra-low temperature freezer (−80 °C).

2.3. Physical Cultivation Environment, Inorganic Nutrients, Irradiance Measurements and Computations

During the cultivation sessions, water was sampled every workday (Monday–Friday and occasionally also during weekends) to measure temperature, pH, irradiance, in vivo Chla and cell concentration. Every second day, concentrations of the nutrients nitrate, nitrite, phosphate, silicate and sometimes ammonia were measured [86]. The first years (until December 2017) a Seal Analytical auto analyzer was applied, while from June 2018 we analyzed samples by using Merck kits and modifications adapted to measurement in a plate reader (Table 2). This allowed for nutrient concentrations being available 2 h after sampling, whereafter eventual adjustments in the added quantities of nutrients to the cultures could be done the same day. Occasionally in vitro Chla, oxygen and other parameters were sampled.
During cultivation sessions in the 300 m3 reactor temperature, salinity, pH, CO2, turbidity and irradiance sub-surface and incident upon the reactor were also logged continuously (Table 2). Irradiance logging was performed with a cosine atmospheric pyranometer (400–700 nm) sensor placed above the reactor, in addition to cosine and scalar (spherical) subsurface (0.7 m) 400–700 nm quantum ones (Table 2). The cultivation sessions were started using diatom cells from our own in-house stock culture collection. The species making up this collection were all isolated from the Arctic Barents Sea or the northernmost part of the North Norwegian coast. These monoclonal stock cultures are maintained and diluted with pasteurized f/2 or f/10 growth medium [87] with additional silicate added (12.3 μmol Si(OH)4 L−1) in temperature and irradiance controlled culture cabinets. Storage temperature was 6–8 °C and scalar irradiance was kept at ca. 10 μmol m−2 s−1. Photoperiod was 14:10 (L:D) and the cultures were kept in 40 mL Nunc cell cultivation flasks. When new mass cultivation sessions were started, inocula from the stock collections were transferred to 10 and 20 L polypropylene containers filled with f/10 medium. The containers were kept in culture cabinets with same temperature and photoperiod as the stock cultures while irradiance was increased to >15 μmol m−2 s−1. When cell concentrations were >ca. 20 mill L−1, the cultures were transferred to one of the 6 m3 reactors and ca. 1000 L filtrated seawater was added together with Yara Kristalon and Si-solution. Thereafter volume was added until the reactor was full and desired cell concentrations were reached. If cultivation in the 300 m3 reactor was initiated, the 6 m3 reactor thus functioned as inocula. From mid 2020, addition of factory fume to the 300 m3 was regulated with a solenoid valve that was controlled by the logged pH so that pH was kept between 7.9 and 7.5.
The spherical sensor pointed downwards (with bulb mount up) while the cosine sensor pointed upwards. In an ideal illumination situation with diffuse light from all directions, the cosine sensor should always show lower readings than the spherical one. However, in a reactor the illumination units can shadow and variable ratios between direct and diffuse radiation can occur. Therefore, in some few instances where the cosine sensor showed higher values, this was taken as mean irradiance at 0.7 m.
The diffuse light attenuation coefficient (k) of a suspension is a measure of the energy removed from a fixed-length light beam by both scattering and absorption. To find the mean irradiance in the upper 0.7 m layer of the reactor we calculated values for 0.05 m depth intervals from 0.7 m depth upwards, using our self-obtained k (diffuse extinction coefficient) vs. cell number relation (n > 100), i.e.,
        k = 2.5406 E u l e r 1.94 8 c e l l   n o .
This formula is valid for ca. 24 μm diameter cells, and when cells were larger separate similar relations were applied. Furthermore, the same formula was used, by planimetric integration of irradiance vs. depth, to calculate irradiance at 0.05 m intervals to the bottom of the reactor (from the 0.7 m value) whereafter the mean irradiance for the whole reactor (volumes varied between ca. 40 and 300 m3) was computed. From these values the actual irradiance in the reactor (daylight + from LED above surface and underwater units) was calculated by applying Equation (1) to obtain k for the different observed cell concentrations as input in the reformulated diffuse extinction coefficient equation:
I 0 = I D / Euler k D
where ID is light at depth D (m) and I0 is irradiance under the surface.

2.4. Biomass Proxies, Growth Rates, Light Utilization and CO2 Uptake

The water content of the harvested algae-paste varied with drum filter and centrifuge systems used, as well as centrifugation time. We therefore applied computed biovolume and in vivo Chla fluorescence (FL) [55] as biomass proxies during the test production runs. Dry weight (60 °C 36 h) was tested occasionally and varied between 11% and 38% with an approximated mean of ca. 22%. Occasionally in vitro Chla was also measured. Cell counting was performed according to the Utermöhl [88] method with Leica and Zeiss inverted microscopes (400× magnification) on cells fixed with Lugol’s iodine solution [89] using Nunc 4 well 1.9 mL cultivation chambers. Settling time was minimum 2 h. Cell sizes (diameter, height) were normally measured on ca. 10 cells once each week. Biovolume was thereafter computed from measurements of cell size and number according to the method in Menden-Deuer and Lessard [64]. In vitro Chla was measured according to the Holm-Hansen and Riemann [90] method with ethanol as extractant. From this cell number/biovolume/FL/Chla ratios could be established. Growth rates were registered as doublings day−1 (μ) during two-to-three-day periods:
μ = L o g 2 ( N t   ) L o g 2 ( N 0 ) t  
where μ = doublings day−1, Nt and N0 are cell numbers (or biomass) at time t and zero and t is time in days. The collected data were screened manually, and obvious outliers (excessively high biomass concentrations and doubling rates) were deleted. This amounted to 4–5% of the data.
To estimate photosynthetic efficiency, it is necessary to include the energy content of the microalgae. Platt and Irwin [91] reported caloric contents of 2.151 to 3.529 calories mg−1 DW in microalgae (diatoms) in a field spring bloom situation. Tibbetts et al. [92] reported 19–27 MJ Kg−1 dry biomass, i.e., 4.5–6.45 calories mg−1 with the highest values in blue-green and green microalgae and the lowest in a diatom. We applied 2.1 calories mg−1 (8.7 J) as a conservative estimate of the energy in our mass cultivated diatoms, this taking the measured protein and lipid content into consideration. Example computation with 1/3 of the large reactor full is a mean production value of 0.28 g L−1 day−1 DW (see Results chapter), which will therefore amount to ca. 280 × 8.7 × 100,000/86,400 = 2.85 kW (1 W = J s−1) “produced” in 24 h. During production peaks total irradiation in the reactor was 50–55,000 μmol m−2 s−1, i.e., equivalent to 14.39 kW using the conversion from Eilertsen and Holm-Hansen [93]. Light utilization was then 2.85/14.39% = 19.8% relative to total light energy delivered to the reactor. The final efficiency was calculated with different volumes in the reactor.
Estimation of potential maximum amount produced of algae biomass from CO2 in fume was calculated from several cultivation sessions from measured gas flow in pipes, CO2 content in the fume (Table 2) and an algae DW: CO2 conversion factor of 2, i.e., time × flow × pipe area × CO2 fraction in fume. Example is CO2 uptake during 24 h (86,400 s × 105 cm s−1 × 44.16 cm2 × 0.05 = 20,030 L). 1 L of CO2 at atmospheric pressure has a weight of 1.84 g, then the added CO2 can maximum be converted to 36.5 kg biomass. Harvested biomass (DW) was 12 kg. From this the logged uptake efficiency was ca. 33%. Applying measured CO2 pressure in the culture and 2 m above culture surface (but well below rim of reactor) in similar situations yielded 709 ppmv in culture and 494 ppmv above, i.e., d ppmv was 215 ppmv. This method, since the measured fluxes were stabilized over time (> 24 h), yielded a CO2 uptake efficiency of 30.03%.

2.5. Total Lipid, Lipid Class and Fatty Acids, Protein and Amino Acid Analysis, Environmental Contaminants

Extraction of lipid followed Jensen et al. [94] adapted from Folchs method [95], using 2 mL of dichloromethane:methanol (2:1 v/v) as the extractant per 100 mg of biomass [96]. The pellets were crushed using a mortar and pestle prior to extraction, and the biomass was extracted twice to maximize yield. The organic extracts were evaporated under nitrogen and the total lipid content was determined gravimetrically. Fatty acid methylation was performed using a method adapted from Christie [97], using sulfuric acid as the catalyst. Briefly, 100 μL of lipid extract (10 mg mL−1 dissolved in dichloromethane) was transferred to a 15 mL glass tube and added 800 μLof dichloromethane, 100 μL of internal standard (C17:0–0.1 mg mL−1) and 2 mL 10% H2SO4 in MeOH. The samples were then heated and kept at 100 °C for 1 h, cooled, and 3 mL hexane and 3 mL 5% NaCl in H2O was added. The resulting organic phase was transferred to 4 mL glass tubes. Following evaporation, the samples were resuspended in 100 μL of hexane and transferred to GC test tubes prior to analysis.
Fatty acid methyl esters (FAMEs) were analyzed on a GC-FID (Agilent Technologies) coupled to a Select FAME column (length 50 m, ID 0.25 μm and FT 0.25 μm, Agilent J&W Columns), using helium as the carrier gas (1.6 mL min−1). The fatty acids were quantified based on the peak area of the chromatograms divided by the area of the internal standard and converted to absolute amounts using the slopes calculated from standard curves (triplicates of 7.8125–2000 μg mL−1 of GLC 502 Free Acids, Nu-Check-Prep, Elysian, MN, USA).
The lipid class composition was analyzed by normal phase HPLC, using a Water e2795 separations module coupled to a Supelcosil™ LC-SI 5 mm (25 cm × 4.6 mm) column (Supelco HPLC products, Bellefonte, PA, USA) set to a working temperature of 40 °C. The HPLC method used was modified from [98]. Lipids were quantified on a Waters 2424 ELS detector based on the peak area in the chromatograms and converted to absolute amounts based on standard curves. The detector settings were as follows: Gain 100, nebulizer heating level set to 30%, drift tube temperature set to 45 °C and pressure set to 40 PSI. The total run time was 41 min, using the a gradient profile table. All lipid analyses including fatty acids and lipid classes were performed using five replicates.
For amino acid analysis dried microalgae (40 mg) was mixed with 0.7 mL distilled H2O, 0.5 mL 20 mM DL-norleucin (internal standard) in glass tubes with two replicates and hydrolyzed as previously described [99,100]. The amino acids were analyzed chromatographically using an ion exchange column followed by ninhydrin post column derivatization on a Biochrom 30 amino acid analyzer (Biochrom Foods 2020, 9, 1901—4 of 17 Co., Cambridge, UK). As described previously, amino acid residues were identified using the A9906 physiological amino acids standard (Sigma Chemical Co., St. Louis, MO, USA) [101]. The total amount of protein was measured as the sum of amino acid residues as recommended by [102].
All contaminant analysis were performed by NILU-Norwegian Institute for Air Research. For the analysis of polychlorinated biphenyls (PCBs), all pentachlorobenzene (PeCB), hexachlorobenzene (HCB) and pesticide samples were prepared similarly. Briefly, 1.5 g freeze-dried microalgae were mixed and homogenized with a 20-fold amount of dry Na2SO4. Prior to extraction, the samples were added to a mixture of several different isotope labelled compounds for quantification purposes. The samples were extracted with organic solvents (cyclohexane/acetone, 1:1) and concentrated, followed by a sulphuric acid clean up and fractionation on a silica column to remove interferences before analysis. The compounds were quantified using GC/HRMS (EI) and/or GC-qToF (ECNI). Proper identification and quantification were confirmed based on correct retention time, correct isotope ratio, a signal/noise ratio > 3:1 and a correct recovery of internal standard, in addition to accepted blank for the method.
For dioxins and non-ortho PCBs (no-PCBs), extraction and clean-up were performed with a semi-automated three-column system as described in detail by Nash et al. [103]. In brief, 5 g of freeze-dried tissue was homogenized with anhydrous Na2SO4, spiked with internal standards (13C-labelled polychlorinated dibenzodioxins (PCDD), polychlorinated dibenzofurans (PCDF) and coplanar PCBs) and subjected to extraction and clean up through three columns prepared with (a) activated silica and potassium silica, (b) silica and (c) activated carbon with dichloromethane (DCM) and cyclohexane (1:1) followed by DCM. Finally, the PCDD, PCDF and coplanar PCBs were eluted from the column with activated carbon using toluene. The toluene extracts were attributed to solvent exchange to hexane and further cleaned through consecutive sulphuric acid-coated silica column, followed by potassium hydroxide-coated silica column with hexane, followed by 1% DCM in hexane. 13C-labelled 1,2,3,4-TCDD recovery standard was added before analysis by HRGC-HRMS-EI (an HP5890 GC coupled to a VG AutoSpec) by monitoring at m/z of the molecular ions. The separation of the congeners was carried out on a DB-5 ms (30 m, 0.25 mm, 11 μm film thickness) fused silica.
For the analysis of perfluorinated alkylated substances (PFAS), the freeze-dried samples (0.4–0.9 g) were homogenized. Internal standards were added to the sample before it was extracted with methanol or acetonitrile using vortex and ultrasonication. After extraction the sample was concentrated followed by clean-up with emulsified carbon. The anionic PFASs were analyzed according to [103]. Quickly, the samples were analyzed by ultrahigh pressure liquid chromatography triple quadruple mass-spectrometry (UHPLC–MS/MS). Analyses were performed on a Thermo Scientific quaternary Accela 1250 pump, with a Waters Acquity UPLC HSS 3 T column (2.1 × 100 mm, 1.8 μm) coupled to a Thermo Scientific Vantage MS/MS (Vantage TSQ). Ionization was conducted in the negative electrospray ionization mode (ESI-). The QA/QC of the sample preparation and analysis was assured using mass labelled internal standards for (13C PFAS), where they were available. Quality of sample preparation and analysis for conventional PFASs was further assured with reference materials and laboratory blanks.
To analyze (heavy) metals, the samples were digested by microwave-assisted mineralization using an UltraClave. About 0.5–0.75 g of sample was weighed in TFM tubes, and 5 mL of diluted supra pure nitric acid was added. The samples were submitted to a four-step program with 220 °C as maximum temperature. After digestion, the samples were split into two aliquots, and concentrated HCl was added to the aliquot used for Hg determination. Metals were analyzed applying an ICP-MS.
For all environmental contaminant analyses, the limits of detection (LOD) were calculated for each sample, using the accepted standard method, i.e., the average of blanks plus 3 times the standard deviation for blanks. For metals, blank values were subtracted from the detected concentrations.

2.6. Bioprospecting

Prior to bioactivity testing the microalgal biomass was freeze dried, grounded using mortar and pestle and extracted overnight with ultrapure water at 4 °C. The sample was centrifuged at 4.600 rpm, and the supernatant was freeze dried and grounded. The pellet was freeze dried and extracted three times with a mixture of methanol and dichloromethane (vol:vol). The extracts were combined, filtered through a Whatman No. 3 filter paper (Maidentown, UK) and reduced to dryness under reduced pressure in a rotary evaporator. The aqueous and organic extracts were stored at −20 °C. To reduce the chemical complexity of the samples in the bioactivity screening, the extracts were pre-fractionated using Flash chromatography. Approximately 1.5 g of extract was fractionated on a plastic column packed with 8.5 g Dianion HP-20SS resin using a gradient of water, methanol and acetonitrile. Eight fractions with compounds of decreasing polarity were collected from each extract. The fractions were reduced to dryness under reduced pressure and resuspended in dimethyl sulfoxide (DMSO) to give a concentration of 40 mg ml−1.

2.6.1. Cytotoxic Activity against Human Cell Lines

The pre-fractionated samples were tested for cytotoxic activity against A2058 human melanoma (ATCC CRL-11147), HT-29 colon carcinoma (ATCC HTB-38) cells as well as MRC5 normal lung fibroblasts (ATCC CCL-171). The cells were cultivated as described by Osvik et al. [104]. The assays were performed in 96-well plates, and the cells were exposed to the fractions for 72 h before their metabolic activity was assessed by adding CellTiter 96 AqueousOne solution (Promega, Madison, WI, USA) and reading the optical density at 485 nm after one hour of incubation. Culture medium and Triton X-100 were used as negative and positive controls, respectively.

2.6.2. Antibacterial Activity

Five bacterial strains were used to test the fractions for antibacterial activities: Staphylococcus aureus (ATCC 25923), Escherichia coli (ATCC 25922), Pseudomonas aeruginosa (ATCC 27853), Escherichia faecalis (ATCC 29212) and Streptococcus agalactiae (ATCC 12386). The bacteria were cultivated as described in Osvik et al. [104]. The growth of bacteria was monitored by measuring optical density at 600 nm after overnight exposure to the microalgal fractions.

2.6.3. Inhibition of Biofilm Formation

The ability of the fractions to inhibit biofilm formation was tested using the biofilm producing strain Staphylococcus epidermidis (ATCC—5984). The bacteria were grown to produce biofilm as described by Osvik et al. [104]. Briefly, bacteria and fractions were incubated overnight in 96-well plates before the cells were removed, and potential biofilms formed in the wells were stained by a solution of 0.1% crystal violet. The degree of biofilm formation was monitored by recording optical density at 600 nm.

2.6.4. Antioxidative Activity

The cellular antioxidant activity (CAA) assay was used to detect antioxidative properties of the fractions. HepG2 cells were seeded and grown as described by Olsen et al. [105]. Briefly, the cells were incubated with 25 μM DCFH-DA (2′,7′-dichlorofluorescin diacetate) and the microalgal fractions for 1 h. After incubation, 2,2′-azobis(2-methylpropionamidine)dihydrochloride (AAPH) was added and the antioxidative activities were recorded as fluorescence at excitation 485 nm and emission at 520 nm.

2.6.5. Anti-Inflammatory Activity

The anti-inflammatory assay was performed as described by Lauritano et al. [106]. Briefly, THP-1 cells (ATCC TIB-202) were incubated with algal extracts and 1 ng/mL lipo-polysaccharides (LPS), and the suppression of TNF-α secretion was measured by an enzyme-linked immunosorbent assay (ELISA).
Methods for MRSA (Methicillin-resistant S. aureus, ATCC-33591) antibacterial testing followed Ingebrigtsen et al. [107]. Regarding the diabetes assay (PTP1B), both assay method and procedures are described in Ingebrigtsen et al. [107], while immunomodulating assays were done as in Lind et al. [108].

3. Results

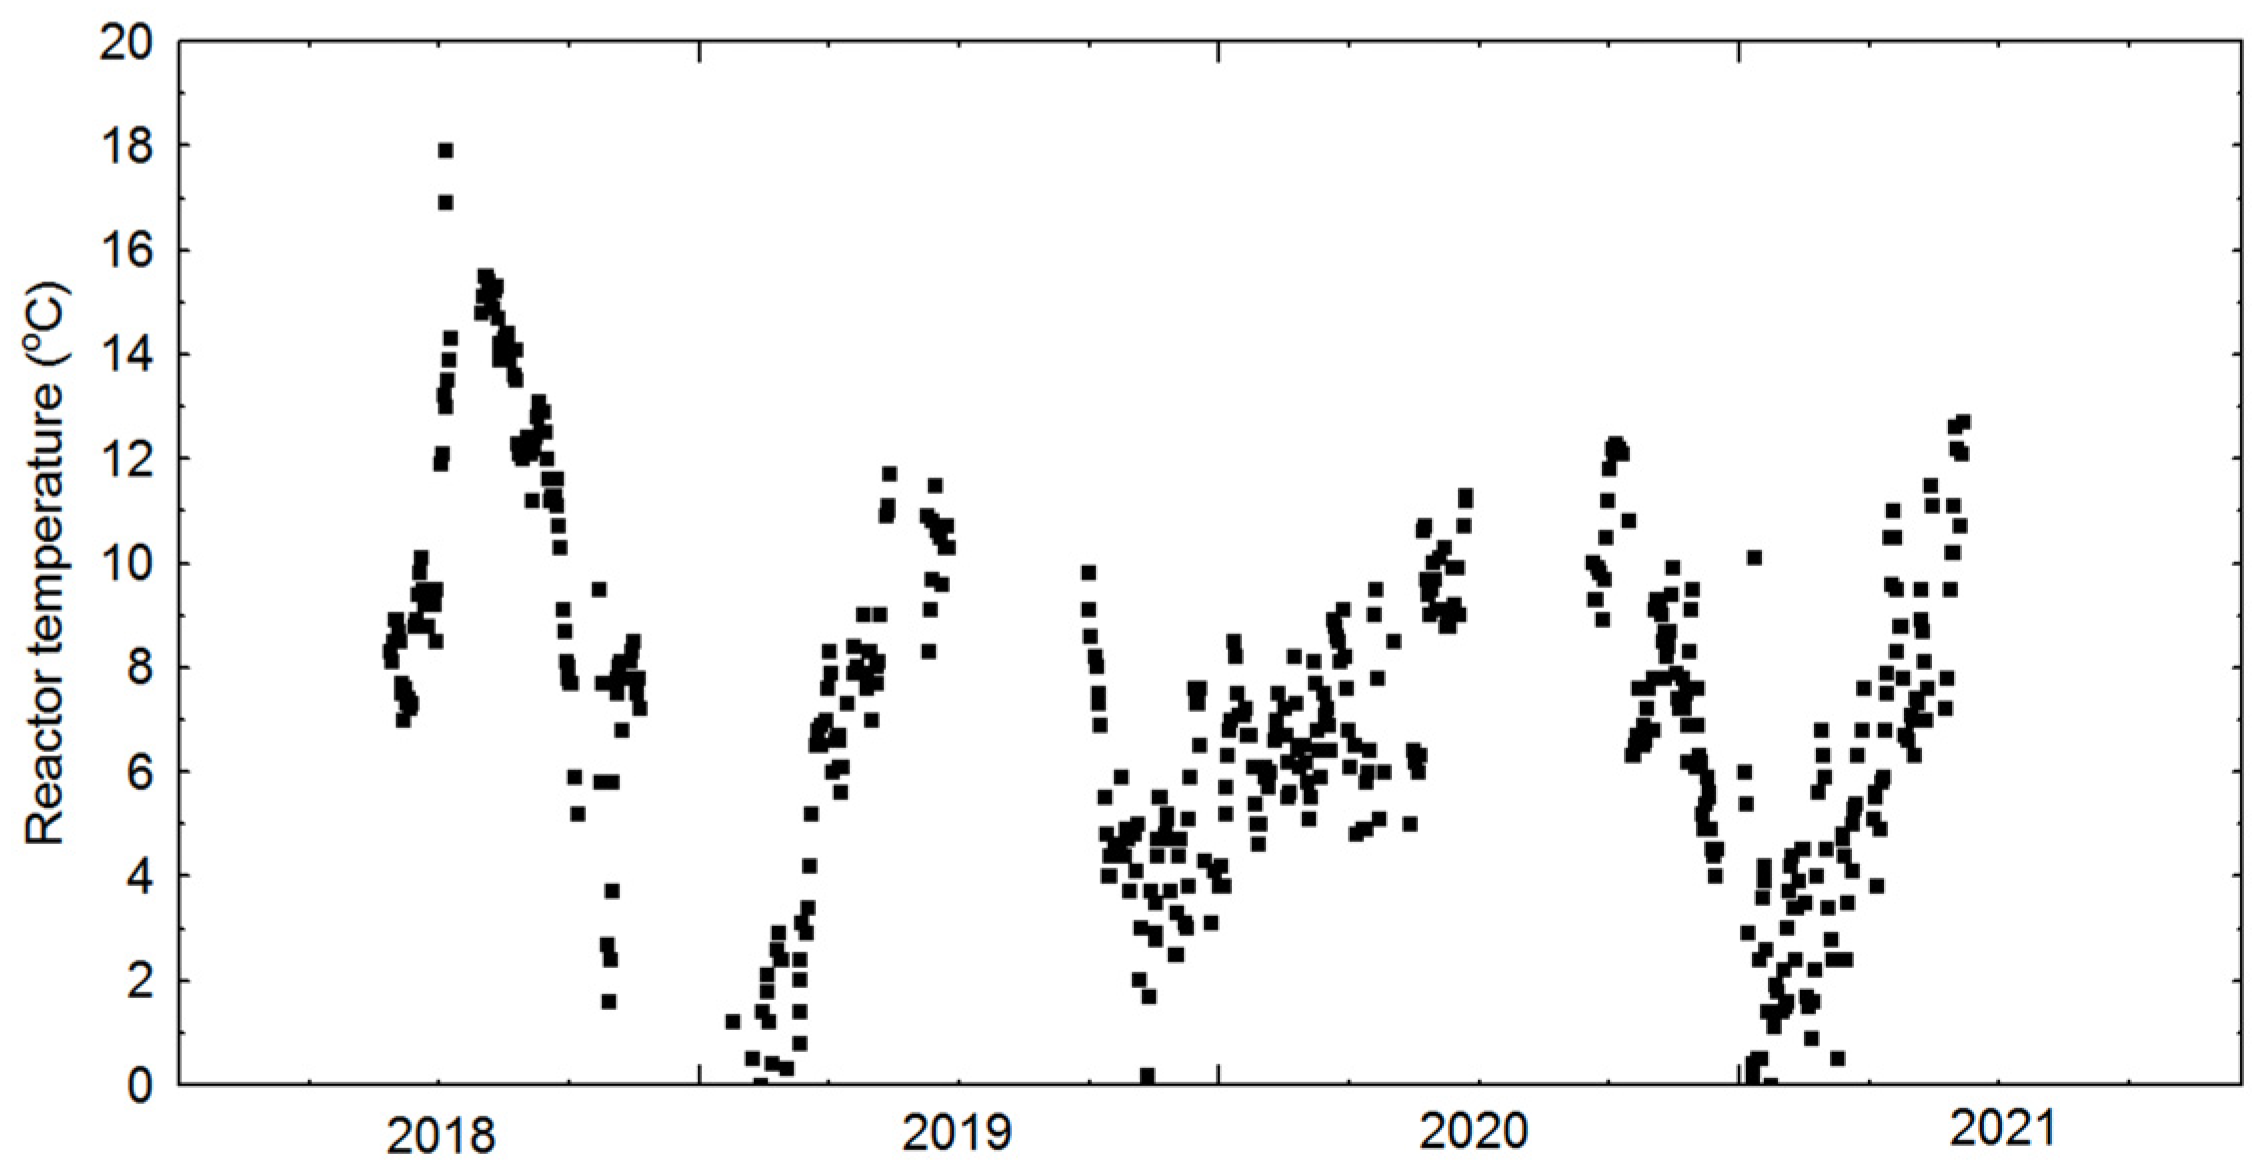
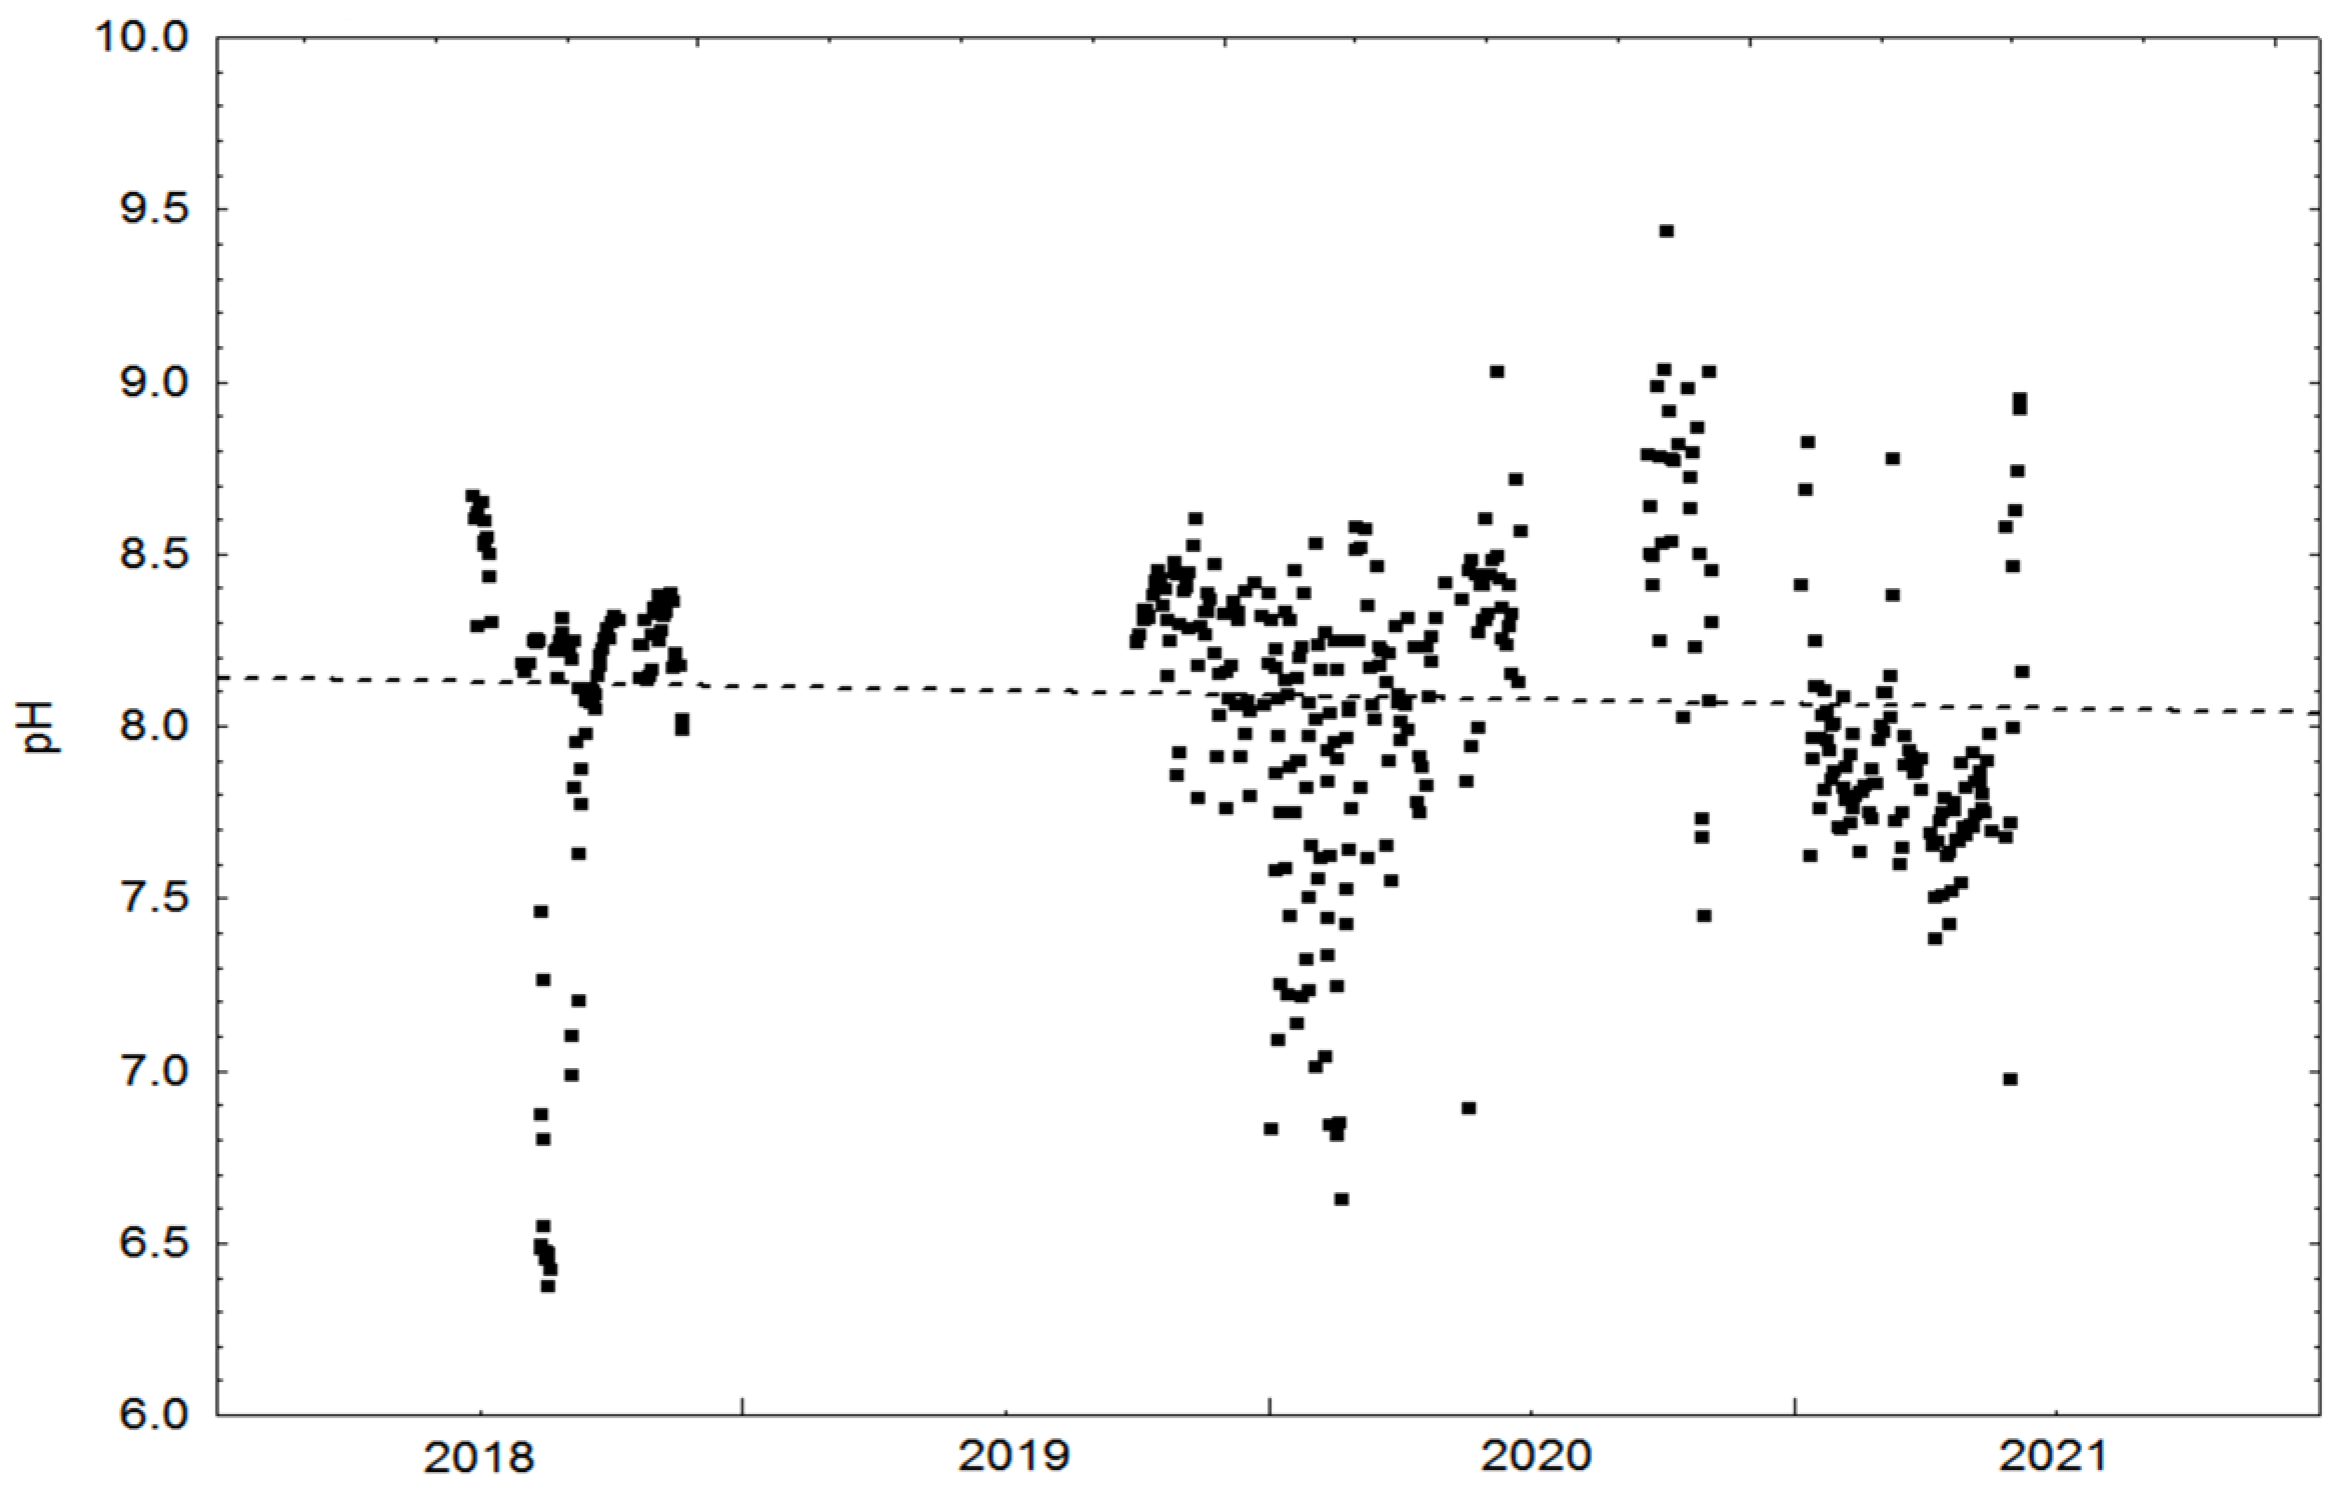
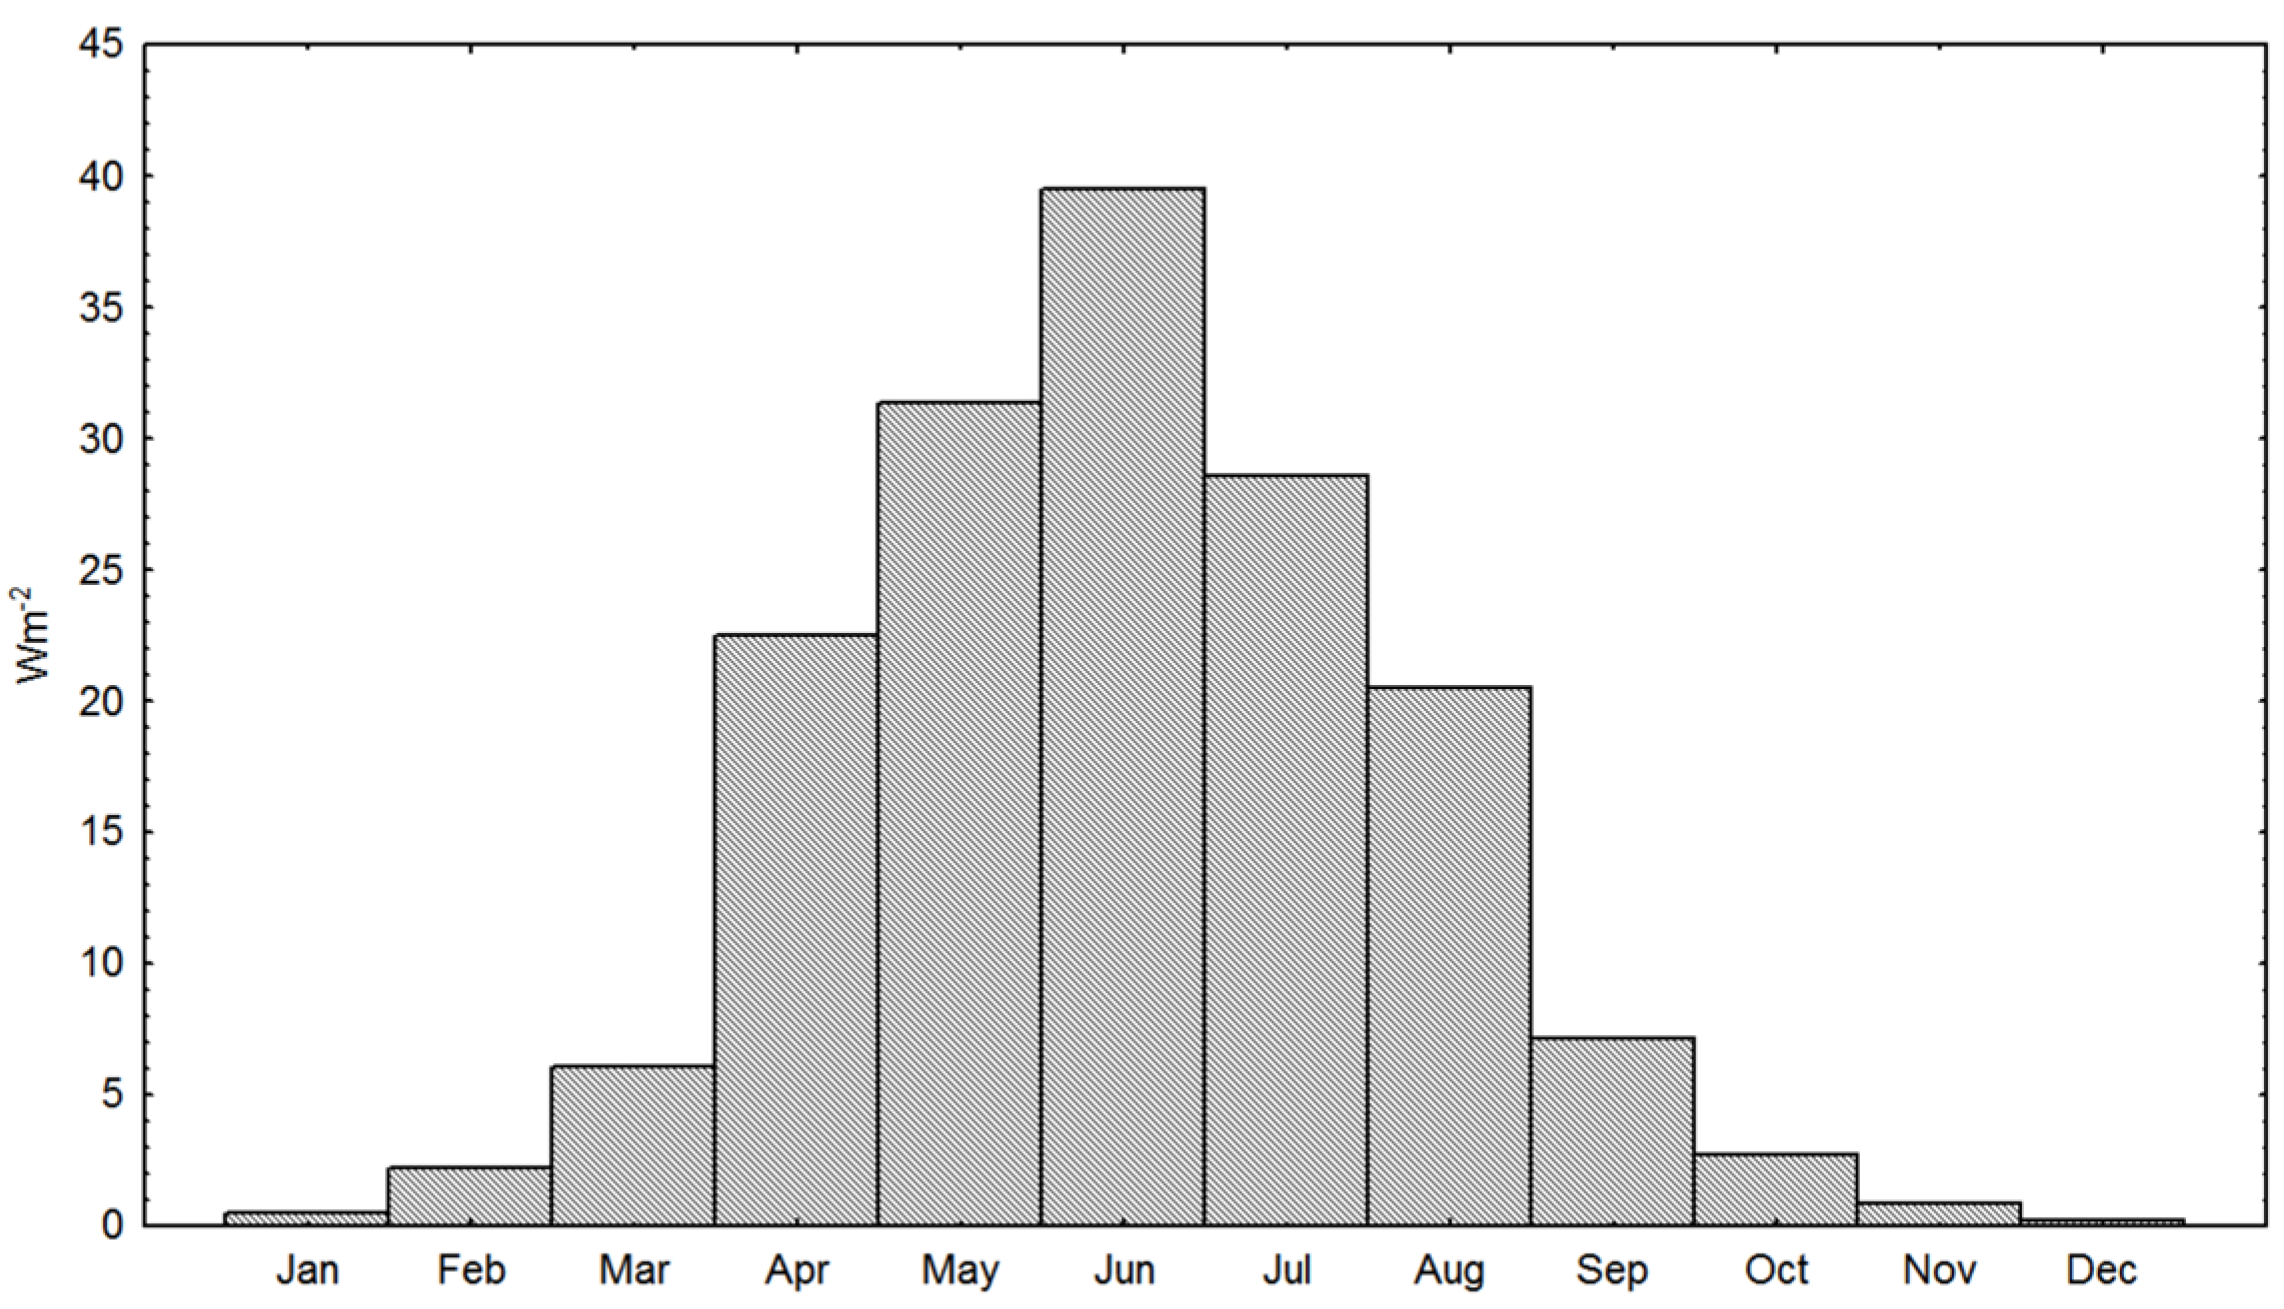
3.1. Physical Cultivation Environment

Minimum temperatures in the seawater intake (fed to the reactors) were 3.5–4 °C early in April while maximums (13.5–14 °C) were in September (Figure 3). Annual mean temperature was 7.97 °C, and the 75% percentile temperature was 9.66 °C. Data from the other years (2015–2018 and 2020–2021) are available but not shown here since temperature variations between years are negligible. The temperatures in the 300 m3 reactor also varied with surrounding air temperatures, i.e., down to and below zero during cold winter periods and with maximums occurring earlier than in the outside fjord, i.e., during mid-summer (Figure 4).
pH measurements during cultivation sessions in the 300,000 L reactor indicated a range of ca. 3.0 units, with minimum 6.37 and maximum 9.44. It also tended towards less low pH values in 2021 than during 2018–2020 (Figure 5). The dotted line in Figure 5 indicating pH in the cultivation medium (intake seawater and added inorganic nutrients) tilts weakly downwards with time. This is due to the fact that the cultivation sessions were not identical with respect to time and duration between years, combined with the fact that the CO2 content in surface layers will vary with season (e.g., due to varying amounts of microalgae and growth).
During representative cultivation sessions mean horizontal current was ca. 0.1 m s−1 while maximum was 1.280 m s−1 (Table 3). Vertical current mean values varied from 0.055 to 0.017 m s−1. Assuming this is representative of the whole water column in the reactor, average net mixing time from bottom to surface (6 m) or opposite was 7–9 min. The shortest mixing time was 25–50 s as measured when the rotating gas distributing device passes.
Natural irradiance reaching the surface of the 300 m3 reactor, through the transparent acrylic roof, varied from close to zero (January–December) to ca. 40 W m2 in June (Figure 6). The mean scalar irradiance in the culture water of the 300 m3 reactor varied from 3 to 100 μmol m−2 s−1 with occasional “spikes” well above this (Figure 7). Using a (own obtained) factor of 0.2614268 [93] to convert quanta to W yields 0.8–26 W m−2.
The total scalar light reaching the 300 m3 reactor, i.e., both natural light incident upon the water surface reaching the interior of the reactor and light from the submerged LED lamps, varied substantially with max. 30,000–50,000 μmol s−1, i.e., 7800–13,000 W (Figure 8).
Measurements of diffuse light extinction (k) coefficients at different depths and cell concentrations allow for diverse k computations in the 300 m3 reactor (Table 4). With a biomass (biovolume) concentration of ca. 1 cm3 L−1 and scalar irradiance of 100 μmol m−2 s−1 at the surface of the reactor, there will be 32 times more light at 0.6 m with 42 μm cells than if cells were small (24 μm). In a situation where biomass is lower, i.e., 0.5 cm3 L−1, there will be 4.5 times more light if large cells are cultivated.
Computations of biomass specific uptake of inorganic nutrients over 1–3 day periods with factory fume on and off (off when atmospheric air was added) showed that N consumption as nitrate and nitrite decreased ca. 35% when fume was added relative to consumption with air bubbling. This difference was statistically significant (Figure 9). The same tendency was observed for phosphate and silicate, but these differences were minor and not statistically significant. The overall average uptake of nutrients was 110.54 NO3 + NO2, 48.11 PO4 and 47.70 Si(OH)4/cm3 biovolume.

3.2. Cultivation: Growth Rates, Biomass Concentration and CO2 Sequestration

Growth rates as doublings day−1 are shown as pooled rates from all reactors (Figure 10), covering the period since we started with the small reactors (150–6000 L) in 2015–2016 until implementation of the larger reactors (14,000–300,000 L), optimizing results from the smallest ones in the larger reactors.
The growth of the cultures measured as pooled doubling rates from all reactors rates increased throughout the period, i.e., mean rates increased ca. 70% during the period 2015–2021 (Figure 10). Production measured as biovolume also increased steadily during the same period (Figure 11 and Figure 12), as did biomass in the reactors (Figure 13).
The production in the 300,000 L reactor exclusively revealed that the decline in production in 2021 was largely in this reactor.
The concentration of biomass reached at maximum ca. 1.28 cm3 biovolume L−1 during the spring of 2021. Peak, but conservative estimated (values above the 75 percentile were discarded) production volumes in the 300 m3 reactor as DWs hence were in the range 0.09–0.31 g day−1, and at the logged fume flow this resulted in a mean uptake of 34% of CO2 from the factory fume (Table 5).
In order to obtain an overview of stress factors vs. growth rate and biomass concentration we performed PCA ordination analysis using the statistical module in Statistica (Figure 14).
Correlation (linear) tests between calculated biovolume and weight (in grammes) of the harvested biomass from the 300 m3 reactor revealed that the biovolumes calculated from cell size measurements and enumerations always were higher that the weights (Figure 15). The mean difference for weights between 0.15 and 0.5 g L−1 was ca. 0.15 g (ca. 25%).
At the prevailing cultivation conditions in our 300 m3 reactor, large cells could, statistically significantly, sustain larger biovolumes at comparable illumination conditions (Table 6). Large cells also maintained higher production rates, though not statistically significantly.

3.3. Chemical Content in Diatoms with and without Fume

The lipid content of our diatoms cultivated with or without factory flue gas is shown in Table 7. The addition of flue gas to the cultivation did not affect the accumulation of lipids in this experiment, and both treatments contained approximately 10% lipids of freeze dried weight, corresponding to approximately 20% lipids of ash-free dry weight.
Some differences in the fatty acid composition with or without factory smoke were observed (Table 8). Notably, the total omega-3 content was slightly higher in the samples cultivated with factory flue gas; this difference was due to an elevated content of 18:4n-3. The eicosapentaenoic acid (EPA, 20:5n-3) was similar in both samples. Samples without factory fume appeared to upregulate the synthesis of 16:4n-1 compared to the other treatment, which resulted in a similar total amount of polyunsaturated fatty acids in both sample treatments.
All amino acids, except aspartic acid and arginine, presented higher values when cultivated with factory fume addition than with air (Table 9). The total DW specific amino acid content was therefore 34% vs. 30% weight based, with and without fume, respectively. The relative portion of EAA was though comparable, i.e., 36–37%.
The contents of some health security relevant heavy metals, dioxins and dioxin-like PCBs are in Table 10 and Table 11. The European Union limits for heavy metals are: Total As: <10 mg kg−1 in calcareous marine algae and <2 mg kg−1 in general, Pb: <15 mg kg−1 in calcareous marine algae and <10 mg kg−1 in general, Cd: <1 mg kg−1 and Hg: <0.1 mg kg−1.

3.4. Bioactivity in Diatom Biomass with and without Fume

Bioactivity results reported here represent two cultivation campaigns using two strains of the same species. The cultivations are also differing in the cultivation technique. The first campaign used 600 L PBR’s while the latter referred to as “G300” herein used a 300,000 L PBR (both PBR’s are vertical bubble column type PBR’s). These results are the summary and comparison of bioactivity efforts and results. Some results are previously presented, e.g., G300 in Osvik et al. [104] and on 600 L cultivations at different cultivation conditions in Ingebrigtsen et al. [107]. In addition, previously unpublished results are included to further elaborate the bioactivity profile.

3.4.1. Cytotoxic Activity against Human Cell Lines

There was activity against human melanoma A2058 cancer cells at all tested conditions, as previously reported in Osvik et al. [104] and Ingebrigtsen et al. [107]. In the assay against HT-29 colon carcinoma cells we found similar activity in both G300 cultivations, and previous unpublished data from three sets of 600 L cultivations across conditions 2–4 (see Figure 16). Furthermore, this activity was detected in both extracts fractioned using HPLC and FLASH (see Figure 17). Regarding activity against MRC5 normal lung fibroblasts, which was tested in both G300 and, we found such activity only in latter cultivations. We found activity in the MCF7 assay at low temperature and low light condition in a 600 L cultivation.

3.4.2. Antibacterial Activity

Extensive antibacterial testing has been done across a range of bacterial lines. We found few examples of inhibition except against Streptococcus type B, cultivated using strong UV illumination in a 600 L PBR (see Figure 16).

3.4.3. Inhibition of Biofilm Formation

As previously reported in Osvik et al. [104], there is activity against biofilm both with and without addition of smoke (see Figure 16 and Figure 17). Anti-biofilm activity was also found in 600 L cultivations at high light and UV light with high temperature. Both G300 and 600 L samples were FLASH fractioned.

3.4.4. Antioxidative Activity

FRAP and CAA have so far not been tested on the G300 biomass. However, previous results from Ingebrigtsen et al. [107] show that there is activity in the FRAP assay at all conditions (1–4) tested. In addition, previously unpublished CAA results show that there is also antioxidative activity at high temperature and light.

3.4.5. Anti-Inflammatory Activity

We found anti-inflammatory activity in most experiments. The anti-inflammatory activity previously reported in Ingebrigtsen et al. [107] was only found in cultivations subject to low temperatures, while cultivations at high temperatures yielded no anti-inflammatory activity. Nevertheless, later 600 L cultivation experiments where the biomass was FLASH fractionated had anti-inflammatory activity (see Figure 17).

3.4.6. Anti-Diabetes Activity

Anti-diabetes activity was ubiquitous across all cultivation experiments, regardless of fractionation method, temperature or light intensity.

4. Discussion

In many ways the present project was based on the conviction that a large part of the future’s fish feed, nutritious biomass and oil in general will and should be harvested or produced from the lowest trophic level in the marine food web, i.e., from fast growing photoautotrophic organisms. Based on the experience from numerous other microalgae projects, it was clear that this was indeed a high-risk journey to begin. The upside is that there is still room for optimization of methods to use and organisms to apply, similar to the optimization that the cultivation of terrestrial crops continuously experiences.
Both growth rates and biomass concentrations in our cultivation sessions increased steadily during the five-year period (2015–2021) (Figure 10 and Figure 11). The main, but not only mechanism behind these increases was the gradual implementation of an improved illumination concept. This was based on a combination of atmospheric radiation and artificial light on and below the surface of the bioreactor. We used daylight white LED lamps with variable intensity, and total illumination on/in the reactor was gradually increased with time. A maximum was reached early 2021 with ca. 50,000 umol quanta s−1. In our reactors we observed a mean conversion rate of light utilization efficiency of ca. 20% (Table 6). This number is not exact since the precise chemical composition of the diatoms are not accounted for in terms of energy. In our opinion, the applied computation method is acceptable, and our logged efficiencies must be considered high relative to comparable initiatives where maximum varied between 5% and 15% [110,111,112,113]. It must be mentioned though that we use the term “light utilization efficiency” since the way photon efficiency is measured influences the result. The way the reactor “captures” and “re-uses and keeps” the light will be important (all light one can “see” is wasted energy). It has also been shown in raceway reactors that cells can adapt to short (s−1) on–off light cycles [114]. In addition, our large cells concept with low self-shading, allowing for long light depths, also played a major role here (Table 4). The annual mean atmospheric irradiance incident upon the reactor was ca. 20 W m−2 (Figure 6). The approximate mean annual radiation in the Finnsnes area is much higher, i.e., 80 W m−2 [115]. This discrepancy was due to the fact that our reactors for practical reasons were situated in a shadow zone close to the factory’s energy retrieval system buildings. Further upscaling of reactor size and production is therefore bound to take place in open areas without shadowing from buildings and terrain.
Tight monitoring of inorganic nutrient content and addition was also important for the growth optimization. Sufficient levels and consumption of N, P and Si are mandatory if nutrient limited growth shall be avoided, and we tried as much as possible to keep concentrations > 2 × of the respective nutrient’s half saturation constants. At the beginning, nutrients were measured ca. weekly, and the results from the autoanalyzer were only available weeks after sampling. This is unsustainable if fast responses to unfavorable culture environments shall be implemented. From 2018, nutrients were therefore measured every second day and results were available the same day. This allowed for frequent adjustments to maintain appropriate nutrient levels in the cultures, as well as to obtain reproducible chemical content (fatty acids and amino acids) of the cells.
It can be observed that production decreased after early spring 2021 (Figure 12 and Figure 13). This was mainly due to application of fewer light units (Figure 7). Initial simple linear correlation analysis between cultivation parameters vs. biomass and production revealed few significant correlations between many (16) parameters. We therefore performed (data reduction) PCA analysis on the data sets (Table 5). Here Factor 1 and 2 explained ca. 35% of the data (Figure 14). It was mainly total light and nutrients (nitrate + nitrite, phosphate and silicate) that were correlated to the first axis (Table 5). The second axis correlated with actual measured light in the reactor (measured with spherical and cosine sensors), though weaker than total light and inorganic nutrients. Doubling rate and production surprisingly did not correlate with total light, here indicating that some other factor also contributed as regulator of growth, since the light intensities in the reactor were well below Pmax. Further temperature also seemed to have a minor impact on growth, while biomass concentration in the reactor was in fact more tightly correlated to total light than production. We interpret this as being because during large periods we cultivated without nutrient and/or temperature stress, i.e., with sufficient nutrients and total light. The fact that production related poorly to total light may also be partly due to the fact that large and small cells acted differently with respect to light utilization (Table 6). Another hypothesis that will be tested is if zinc or aluminum anode materials in the reactor may have had deleterious effects on the cultivated diatoms [116]. This is an important issue to consider if underwater lights shall be applied since (nearly) all materials submerged in seawater are prone to corrosion.
Biomass peaks in our 300 m3 reactor were around 1.28 cm3 L−1 biovolume, and production ones were ca. 1.5 cm3 L−1 Day−1. In terms of DW this translates into the production peaking at 0.18–0.42 g L−1 Day−1 with a mean of ca. 0.22 g L−1 Day−1 DW. Obtaining a reliable overview of “normal” microalgae mass production values from the literature is difficult, e.g., due to the variability of cultivation and de-watering/processing concepts. Issues related to intellectual property rights (IPR) can also hinder reporting of correct values. Our own attempt to obtain an overview of published production rates yielded values from 0.05 to 3.8 g L−1 Day−1 DW (Table 12).
The highest values were obtained with thin plate reactors, where associated doubling rates also were highest, i.e., 1.2 doublings day−1 (values from cited papers or recomputed from same).
Tubular reactors came in second, illustrating that reactor types with short light depths gave the highest production rates. The reported values are not necessarily peak ones though. It is also important to take note of the fact that the large part of the above cited values was obtained in small reactors (<10,000 L). Our Finnfjord initiative must be categorized as “large volume with medium productivity and high light utilization efficiency”. Large volume continuous culture types can of course cause stress on the water intake filtering system as well as the de-watering capacity. Our inlet seawater was attached to the cooling water stream at the factory, and the intake was at depths > 25 m in the outside fjord. During large parts of the year seawater in the area is devoid of microalgae and small zooplankters due to the winter darkness with no photoautotrophic activity. In addition, the intake is below the surface water spring/summer stratification depth. The main spring bloom takes place above the pycnocline [41,84]. We therefore have available “clean” seawater that for large parts of the year needs minor filter capacity. In addition, despite renewal of 20–50% (25,000–150,000 L) seawater Day−1, we were able to cultivate 4–6 months without contamination. The addition of factory fume lowered pH ca. 1.5 units below “neutral” values in intake water, and this could have contributed to a reduction of contamination of the culture.
The mixing rate in the reactor naturally has the potential to influence production rate, since turbulence/mixing moves the cells through gradients in growth factors. This secures homogeneity in the cultivation conditions which is beneficial, but too high turbulence creates currents shears that may be harmful to the cells. In a typical cultivation session, we measured vertical mixing rates of 0.01 to 0.05 m s−1 (Table 3). This is within the range of a normal well performing vertical airlift reactor [139]. The highest (mean) values were in the surface of the reactor (0.1 m depth). The horizontal values were high at 1.2 m depth, and this we believe was due to the rotating gas injection arm at the bottom. The overall CO2 transfer rate from injector to fluid and algae was measured/calculated to an approximate mean of ca. 26%. This is not considered to be a high transfer rate, and this is a well-known problem [76]. Substantial improvements must take place here in the development of larger reactors.
In our analysis of the data, we also observed that cell doubling rates did not decrease proportionally to culture volume when, e.g., the amount of water was doubled, and the same amount of total light was available to the cells. This points towards some energy utilization advantage by giving cells small pauses in the exposure to light. This is because illumination was above the reactor surface (LEDs and daylight) and submerged LEDs at one layer (0.7–1.4 m) below the surface. This may be connected to the fact that photosynthesis functions in pulses [140]. Furthermore, the efficiency may vary on longer timescales [141] and the explanation to this discrepancy may also be that cell specific utilization of the light is better at lower mean overall light intensities.
The large part of the cited cultivations in Table 12 took place at temperatures between 10 and 20 °C. The classic Eppley paper [142] predicts (maximum) doubling rates of 1.5 to 2.6 doublings day−1 at these temperatures, leading to the conclusion that growth in mass cultivation reactors is normally not temperature limited. The mean annual temperature in our 300 m3 reactor was 6.64 °C (Table 5) and the total range was from below zero (−2.0 °C) to 16 °C. Our species has a wide temperature range, with maximum growth at 12–14 °C and in fact positive growth even at sub-zero seawater temperatures [46,143]. However, growth was modified by stress imposed upon the cultures in various experiments (light limitation, e.g., decreased production early in 2021, see Figure 12).
The main factors that regulate microalgae growth are irradiance, temperature, pH, CO2, inorganic nutrients (N, P, Si compounds), and trace nutrients [142,144,145]. Other intrinsic or external compounds may also affect growth, e.g., phytohormones [146] and the combination of photoperiod and light intensity may have effects on growth and chemical composition [147,148]. If a surplus of the necessary resources is present, the growth rate will be constant. In nature all these factors can be limiting, depending on the physical state of the site. In situations with (species specific) non-limiting growth factors, temperature will usually set the upper limit of the growth rate. It must here be taken note of that at high biomass concentration, density dependent self-limitation may occur not only with respect to light. Translated to mass cultivation, in reactors where biomass concentrations are much higher than even peak spring bloom values, it means that it is seldom that temperature limits growth but rather irradiance and nutrients. Even if the large part of pond, tubular and plate reactors are “thin” constructions, at high, e.g., Chlorella sp. concentrations, production rates are often described as light limited [149,150,151].
Several of the cultivation sessions in the reactors lasted up to 5–6 months without fouling and microbial contamination (Figure 1). It is clear that open pond systems are prone to contamination and especially fouling, but also flat plate and tubular reactors need frequent maintenance and cleaning, often after cultivation periods only lasting a few weeks [111,118,152,153,154]. The lengths of our cultivation sessions were hence clearly at the higher end of the spectrum, and the main reason for this was possibly an anti-biofilm (anti-fouling) activity of some compound in our algae [104].
Our results showed that biomass (biovolume) specific nitrate and nitrite consumption was reduced with ca. 35% when factory fume was added (Figure 9), relative to cultivation with only atmospheric air bubbled into the system (comparable flows). This indicates indirectly that NOx fume is in fact utilized by the algae. This is strengthened by the fact that both protein and lipid amount and composition were highly comparable during cultivation with and without fume (Table 7 and Table 8). This represents a quite substantial reduction in the need for fertilizer. In large scale commercial situations this means reduced running costs. Microalgae contain 1–2% N. The annual emission of NOx from Finnfjord AS amounts to 700–1100 tons/year (measured as NO2), and this is equivalent to an N uptake to produce 16,500–47,000 tons of algae biomass. It is not unknown that nitrous oxides can be taken up by microalgae and utilized as an inorganic N source. Nagase et al. [155] cultivated Dunaliella tertiolecta > 14 days with continuous uptake of NO in the cells, and they concluded that NO first was absorbed in the culture water by diffusion and thereafter diffused into the algae. In addition, NO2 can be oxidized to nitrite and nitrate in seawater and thereafter taken up by microalgae [156]. When factory fume is added this represents a 125 x increase in the partial pressure of CO2 in the fume relative to atmosphere concentrations. Information on how diatoms react to high CO2 pressure is hard to come by. Instrumental in understanding this is the functioning of Rubisco, concerning biomass specific amount [157] and if specificity (ability to discriminate between CO2 and O2) increases at high CO2 pressures. Hypothetically, if specificity increases, this could in fact maintain photosynthetic efficiency with reduced need for N in biosynthesis since Rubisco is a N rich enzyme [83,158].
The lipids in the diatom biomass have earlier been found to make up approximately 8–10% of the dry weight (20% of ash free dry weight) when harvested in the exponential growth phase [159,160], which is similar to the lipid content found in the present experiment where fume and compressed air solely were injected into the culture. In their review of the literature of lipid content of diatoms, Fields and Kociolek [161] reported that species cultivated in nutrient poor media contained 6.6–39.8% lipids (DW); however, their experimental data showed an average of 5.3–21.5% lipids (DW) when cultivated in nutrient replete media. The addition of factory flue gas did not affect the lipid content of the applied diatom in the present study, but it has previously been found that the addition of CO2 can increase the lipid content [162]. The reason for these discrepancies between our results and, e.g., Fields and Kociolek [161], we believe is simply because different species with different physiological traits were applied. What concerns “internal” differences may result from the fact that in [45] pure CO2 was added while in the present study uncleaned factory fume with CO2 was added.
The fatty acid composition was highly comparable between the two treatments. The slightly higher omega-3 content, caused by the elevated 18:4n-3 content in samples with factory flue gas, was the main difference. The EPA content seems to be stable at approximately 30% no matter the cultivation conditions [46,159,160,163,164]. Other diatoms usually contain 5–20% EPA; however, species such as Skeletonema costatum and Phaeodactylum tricornutum have been reported to contain 30% of this fatty acid [165].
Proteins are important ingredients in all animal feeds as they are essential nutrients for growth. Both the amount of protein and the protein quality are important. Microalgae are generally rich in proteins, and the protein content of microalgae varies between 20 and 60% of dry matter [166]. The quality of protein resources is usually described by different metrics taking into account factors as digestion, absorption and assimilation capacity. Nagarajan et al. [167] describe such common metrics in detail including content and percentage of EAA, chemical score (CS) and assessment of limiting amino acids. Microalgal proteins are excellent sources of essential amino acids (EAA) and the content of EAA (tryptophan, methionine, phenylalanine, leucine, isoleucine, lysine, histidine, valine and threonine) are comparable to protein sources of aquaculture feed ingredients such as soybean and pelagic fishes. For many fish, arginine is also essential, owing to lack of a functional urea cycle. In general, in terms of protein quality, digestibility and absorption, the requirements for feed ingredients are met [168].
Amino acid analysis of our diatom revealed that the total amino acid content was higher (339 mg g−1 DW) when cultivated with fume compared to without (300 mg g−1 DW). Accordingly, protein content was also higher (29% vs. 25% with and without fume, respectively) (Table 8). The EAA contributed to about 36–37% of the total amino acids by both fermentation procedures. Similar protein contents and amino acid distribution patterns were also observed in samples collected throughout a cultivation season (2018–19) when random samples for quality controls were analyzed (protein content 28.7% ± 4.6%, n = 11) [169]. The ratio of each amino acid was stable throughout the year. The largest variation was observed in the total protein content (±). A stabile amino acid profile is necessary for a reliable feed ingredient.
The chemical score equals the ratio between each EAA in the food protein and the corresponding EAA in a reference protein proposed by FAO/WHO. Proteins of animal source normally have a chemical score of 1.0, while cereal proteins normally range from 0.4 to 0.6. Legumes, beans and nuts normally range in between these. Our diatom has a high protein quality with contents of all essential AA above the reference-scoring pattern (CS) for adults [170], which indicates that the protein quality is superior to most terrestrial plants. Tryptophan was denatured during the pre-treatment of the samples, acid hydrolysis, thus it was not possible to assess whether it is a limiting amino acid.
Nagarajan et al. [167] reviewed mechanisms and indicators for assessing microalgal suitability as a feed ingredient based on toxicological analysis. Microalgae are capable of sequestering potentially harmful heavy metals from the environment. Thus, the heavy metal content of the biomass is dependent on the growth environment. The use of flue gas or fume as a CO2 or a nutrient source may thus lead to contamination of the resulting biomass. Hence, careful consideration of production processes and analysis of the resulting biomass are necessary before it is used as a feed ingredient. In general, commercial laboratories analyze feed samples for four major heavy metals, namely lead (Pb), cadmium (Cd), arsenic (As) and mercury (Hg). Both inorganic and organic forms of As are present in foods, and the major source for dietary As exposure is marine food products. Luckily, in marine food products As is primarily present as organic compounds [171], which are less toxic than the inorganic toxic ones, such as arsenobetaine (AsB), arsenosugars and arsenolipids [172]. Further data on As content in marine species are warranted to improve dietary exposure and risk assessment. Selenium (Se) has been suggested to provide protective effects against Hg toxicity by decreasing the bioavailability of Hg /mercury. Studies have showed that the Se: Hg molar ratio ≥1 may offer protection against Hg toxicity [173].
The allowed content or levels, based on the European Union [174] food safety regulations on undesirable substances in products intended for animal feed, are as follows on a dry weight basis (relative to feed with a moisture content of 12%): Total As: <10 mg kg−1 in calcareous marine algae and <2 mg kg−1 in general, Pb: <15 mg kg−1 in calcareous marine algae and <10 mg kg−1 in general, Cd: <1 mg kg−1 and Hg: <0.1 mg kg−1. The analysis of our diatom fermented with and without fume demonstrated that the content of these heavy metals was within the safety limits and comparable within the natural variation of marine food products
Finally, persistent organic pollutants (POPs) such as dioxins and PCBs have high chemical stability and are known to accumulate in the environment, animals and food chains. As mentioned, microalgae may sequester certain POPs from their growth environment and even remove, break down or metabolize such pollutants. However, due to the non-polar hydrophobic nature of PCBs and non-dioxin-like PCBs, the concentrations of these POPs are extremely low in seawater without lipid-containing organic matter. Our results, although this is just a single screening, indicate that the levels of polychlorinated dibenzodioxins, dibenzofurans and biphenyls were below the limits required by the European Union food safety regulations on undesirable substances in products intended for animal feed. The allowed content of dioxins (sum of PCDDs and PCDFs) is 1.25 ng WHO-PCDD/F-TEQ kg−1 and the sum of dioxins and dioxin-like PCBs (sum of PCDDs, PCDFs and PCBs) is 4.5 ng WHO-PCDD/F-PCB-TEQ/kg, based on the previously referred to EFSA [174] directives for undesirable substances in animal feed.
It is well established that marine diatoms can produce a wide array of secondary metabolites and many of these compounds might have useful applications that can increase the value of the biomass produced in the large-scale bioreactors [33]. In our bioactivity screening of extracts of the biomass, we have focused on antibacterial, cytotoxic, anti-biofilm, anti-inflammatory and anti-oxidative activities. Some of the activities that we have characterized could be of value in certain applications of the diatom biomass itself: when using compressed algal cells for fish feed applications, the presence of anti-oxidative compounds will help preserve the quality of the feed during storage whereas the presence of antibacterial compounds will reduce the risk of microbial growth. Such aspect is also useful during the cultivation itself. The presence of compounds that inhibits not only bacterial growth but also biofilm formation and subsequently biofouling in the photobioreactors is contributing to keeping the mass cultures healthy and the photobioreactors clean over prolonged periods of time. This is essential for the success of continuous cultivation of diatoms to produce larger amounts of biomass.
Several attempts have been made to isolate specific bioactive secondary metabolites from diatom cultures, usually through a bioassay-guided fractionation scheme. Many of these investigations have used biomass from laboratory cultures, and the limited access to biomass and thus low abundance of target molecules in the extracts have unfortunately often led to failures in isolating specific compounds. However, when using biomass for large-scale cultivation, the increased amounts of metabolites present in the extracts make in more likely that the bioactive secondary metabolites can be successfully isolated and characterized. Many of the bioactivities that have been observed in extracts from diatoms so far have in many cases been ascribed to unspecific activities to either break-down products of different forms of chlorophyll (such as phaeophorbide) or membrane lipids such as phosphocholines [106,175].

5. Conclusions

The biotechnological concept behind the diatom mass cultivation at Finnfjord AS was to apply large diatom species. We did this since large cells have low surface to volume ratios relative to small species, and hence potentially have less biomass specific self-shadowing. This can allow for longer light depths and the use of large simple vertical column photobioreactors. Our results demonstrate clear advantages in terms of illumination of the reactor when large cells are applied. At a medium biomass concentration (0.5 cm3 L−1) in the reactor we logged 4.5 times more light at 0.6 m depth when 42 mm cells were used relative to 24 mm cells. At higher biomass concentrations this advantage was even larger. An obvious question is of course if large cells can utilize the light available. At the prevailing cultivation conditions in our 300 m3 reactor, large cells could, statistically significantly, sustain larger biovolumes at comparable illumination conditions than smaller cells. Large cells also maintained higher production rates, clearly demonstrating the advantages of using large cells. The large cells also contributed most to the obtained high light utilization efficiencies (ca. 19%). This, together with the fact that we were able to sequester factory fume CO2 and NOx while cultivating nutritious biomass for 4–6 months without contamination, makes our concept highly promising in terms of environmental and economic sustainability. It is clear that an economic and LCA (Life Cycle Assessment) evaluation is critical to ensure the success of a diatom-based industry. This is the focus of another ongoing project where the main application of the biomass is salmon feed. Preliminary results indicate the need for large (diatom) production volumes and possibly higher prices justified by environmentally sustainable production processes. The produced biomass has also been tested with success as an ingredient in lice deterring salmon feed [176].

Author Contributions

Conceptualization, methodology, investigation, writing—original draft preparation, writing—review and editing, H.C.E.; methodology, formal analysis, G.K.E.; methodology, J.-S.B.; methodology, project administration, J.S.; methodology, data curation, E.E.; data curation, formal analysis, K.-E.E.; methodology, data curation, E.S.H.; methodology, I.H.G.; methodology, L.I.; investigation, methodology, J.B.S.; investigation, methodology, L.D.; investigation, methodology, R.O.; writing—review and editing, E.H.; writing—review and editing, R.A.I.; funding acquisition, project administration, T.A.; funding acquisition, project administration, G.-H.W. All authors have read and agreed to the published version of the manuscript.

Funding

This research was funded by Norwegian Regional Funds RDA: 551.6; Norwegian Research Council: 321415; Innovation Norway; UiT The arctic university of Norway: UIT1; Finnfjord AS.

Conflicts of Interest

The authors declare no conflict of interest.

References

  1. Pulz, O.; Gross, W. Valuable products from biotechnology of microalgae. Appl. Microbiol. Biotechnol. 2004, 65, 635–648. [Google Scholar] [CrossRef] [PubMed]
  2. Beer, L.L.; Boyd, E.S.; Peters, J.W.; Posewitz, M.C. Engineering algae for biohydrogen and biofuel production. Curr. Opin. Biotechnol. 2009, 20, 264–271. [Google Scholar] [CrossRef] [PubMed]
  3. Yadugiri, V. Milking diatoms–A new route to sustainable energy. Curr. Sci. 2009, 97, 748–750. Available online: https://www.jstor.org/stable/24112109 (accessed on 1 June 2021).
  4. Varfolomeev, S.; Wasserman, L. Microalgae as source of biofuel, food, fodder, and medicines. Appl. Biochem. Microbiol. 2011, 47, 789–807. [Google Scholar] [CrossRef]
  5. Adarme-Vega, T.C.; Lim, D.K.; Timmins, M.; Vernen, F.; Li, Y.; Schenk, P.M. Microalgal biofactories: A promising approach towards sustainable omega-3 fatty acid production. Microb. Cell Factories 2012, 11, 96. [Google Scholar] [CrossRef] [PubMed] [Green Version]
  6. Rizwan, M.; Mujtaba, G.; Memon, S.A.; Lee, K.; Rashid, N. Exploring the potential of microalgae for new biotechnology applications and beyond: A review. Renew. Sustain. Energy Rev. 2018, 92, 394–404. [Google Scholar] [CrossRef]
  7. Bhattacharya, M.; Goswami, S. Microalgae–A green multi-product biorefinery for future industrial prospects. Biocatal. Agric. Biotechnol. 2020, 25, 101580. [Google Scholar] [CrossRef]
  8. Lim, S.-L.; Chu, W.-L.; Phang, S.-M. Use of Chlorella vulgaris for bioremediation of textile wastewater. Bioresour. Technol. 2010, 101, 7314–7322. [Google Scholar] [CrossRef]
  9. Ramachandra, T.; Mahapatra, D.M.; Gordon, R. Milking diatoms for sustainable energy: Biochemical engineering versus gasoline-secreting diatom solar panels. Ind. Eng. Chem. Res. 2009, 48, 8769–8788. [Google Scholar] [CrossRef]
  10. Beigbeder, J.-B.; Sanglier, M.; de Medeiros Dantas, J.M.; Lavoie, J.-M. CO2 capture and inorganic carbon assimilation of gaseous fermentation effluents using ParaChlorella kessleri microalgae. J. CO2 Util. 2021, 50, 101581. [Google Scholar] [CrossRef]
  11. Schiano di Visconte, G.; Spicer, A.; Chuck, C.J.; Allen, M.J. The microalgae biorefinery: A perspective on the current status and future opportunities using genetic modification. Appl. Sci. 2019, 9, 4793. [Google Scholar] [CrossRef] [Green Version]
  12. Bibi, F.; Jamal, A.; Huang, Z.; Urynowicz, M.; Ali, M.I. Advancement and role of abiotic stresses in microalgae biorefinery with a focus on lipid production. Fuel 2022, 316, 123192. [Google Scholar] [CrossRef]
  13. Mobin, S.M.; Chowdhury, H.; Alam, F. Commercially important bioproducts from microalgae and their current applications–A review. Energy Procedia 2019, 160, 752–760. [Google Scholar] [CrossRef]
  14. Pires, J.; Alvim-Ferraz, M.; Martins, F.; Simões, M. Carbon dioxide capture from flue gases using microalgae: Engineering aspects and biorefinery concept. Renew. Sustain. Energy Rev. 2012, 16, 3043–3053. [Google Scholar] [CrossRef]
  15. Seth, J.R.; Wangikar, P.P. Challenges and opportunities for microalgae-mediated CO2 capture and biorefinery. Biotechnol. Bioeng. 2015, 112, 1281–1296. [Google Scholar] [CrossRef] [PubMed]
  16. Daneshvar, E.; Wicker, R.J.; Show, P.-L.; Bhatnagar, A. Biologically-mediated carbon capture and utilization by microalgae towards sustainable CO2 biofixation and biomass valorization—A review. Chem. Eng. J. 2022, 427, 130884. [Google Scholar] [CrossRef]
  17. Shahid, A.; Malik, S.; Zhu, H.; Xu, J.; Nawaz, M.Z.; Nawaz, S.; Alam, M.A.; Mehmood, M.A. Cultivating microalgae in wastewater for biomass production, pollutant removal, and atmospheric carbon mitigation; a review. Sci. Total Environ. 2020, 704, 135303. [Google Scholar] [CrossRef]
  18. Dębowski, M.; Zieliński, M.; Kazimierowicz, J.; Kujawska, N.; Talbierz, S. Microalgae cultivation technologies as an opportunity for bioenergetic system development—advantages and limitations. Sustainability 2020, 12, 9980. [Google Scholar] [CrossRef]
  19. Dębowski, M.; Kisielewska, M.; Kazimierowicz, J.; Rudnicka, A.; Dudek, M.; Romanowska-Duda, Z.; Zieliński, M. The effects of microalgae biomass co-substrate on biogas production from the common agricultural biogas plants feedstock. Energies 2020, 13, 2186. [Google Scholar] [CrossRef]
  20. Beijierinck, M. Kulturversuche mit Zoochloren, Lichenenggonidien und anderen niederen Algen. Physis 1890, 48, 725–785. [Google Scholar]
  21. Warburg, O. Über die Geschwindigkeit der Kohlensäurezersetzung in lebenden Zellen. Biochem. Z. 1919, 100, 230–270. [Google Scholar] [CrossRef]
  22. Jorgensen, J.; Convit, J.; de Cabo Blanco, L.; Maiquetia, D. Cultivation of complexes of algae with other fresh-water microorganisms in the tropics. In Algal Culture—From Laboratory to Pilot Plant; Burlew, J.S., Ed.; Carnegie Institution of Washington Publication: Washington, DC, USA, 1953; p. 190. [Google Scholar]
  23. Borowitzka, M.A.; Vonshak, A. Scaling up microalgal cultures to commercial scale. Eur. J. Phycol. 2017, 52, 407–418. [Google Scholar] [CrossRef]
  24. Nethravathy, M.; Mehar, J.G.; Mudliar, S.N.; Shekh, A.Y. Recent advances in microalgal bioactives for food, feed, and healthcare products: Commercial potential, market space, and sustainability. Compr. Rev. Food Sci. Food Saf. 2019, 18, 1882–1897. [Google Scholar] [CrossRef] [Green Version]
  25. García, J.L.; De Vicente, M.; Galán, B. Microalgae, old sustainable food and fashion nutraceuticals. Microb. Biotechnol. 2017, 10, 1017–1024. [Google Scholar] [CrossRef] [PubMed] [Green Version]
  26. Matthews, J.; Heimdal, B. Pelagic productivity and food chains in fjord systems. In Fjord Oceanography; Springer: New York, NY, USA, 1980; pp. 377–398. [Google Scholar]
  27. Garrido-Cardenas, J.A.; Manzano-Agugliaro, F.; Acien-Fernandez, F.G.; Molina-Grima, E. Microalgae research worldwide. Algal Res. 2018, 35, 50–60. [Google Scholar] [CrossRef]
  28. Mohsenpour, S.F.; Hennige, S.; Willoughby, N.; Adeloye, A.; Gutierrez, T. Integrating micro-algae into wastewater treatment: A review. Sci. Total Environ. 2021, 752, 142168. [Google Scholar] [CrossRef] [PubMed]
  29. Lim, Y.A.; Chong, M.N.; Foo, S.C.; Ilankoon, I. Analysis of direct and indirect quantification methods of CO2 fixation via microalgae cultivation in photobioreactors: A critical review. Renew. Sustain. Energy Rev. 2021, 137, 110579. [Google Scholar] [CrossRef]
  30. Ugwu, C.; Aoyagi, H.; Uchiyama, H. Photobioreactors for mass cultivation of algae. Bioresour. Technol. 2008, 99, 4021–4028. [Google Scholar] [CrossRef]
  31. Blanken, W.; Cuaresma, M.; Wijffels, R.H.; Janssen, M. Cultivation of microalgae on artificial light comes at a cost. Algal Res. 2013, 2, 333–340. [Google Scholar] [CrossRef]
  32. Tamiya, H. Mass culture of algae. Annu. Rev. Plant Physiol. 1957, 8, 309–334. [Google Scholar] [CrossRef]
  33. Chew, K.W.; Yap, J.Y.; Show, P.L.; Suan, N.H.; Juan, J.C.; Ling, T.C.; Lee, D.-J.; Chang, J.-S. Microalgae biorefinery: High value products perspectives. Bioresour. Technol. 2017, 229, 53–62. [Google Scholar] [CrossRef] [PubMed]
  34. Lauritano, C.; Ferrante, M.I.; Rogato, A. Marine natural products from microalgae: An-omics overview. Mar. Drugs 2019, 17, 269. [Google Scholar] [CrossRef] [PubMed] [Green Version]
  35. Davis, D.; Morao, A.; Johnson, J.K.; Shen, L. Life cycle assessment of heterotrophic algae omega-3. Algal Res. 2021, 60, 102494. [Google Scholar] [CrossRef]
  36. Mann, D.G. The species concept in diatoms. Phycologia 1999, 38, 437–495. [Google Scholar] [CrossRef] [Green Version]
  37. Guiry, M.D. How many species of algae are there? J. Phycol. 2012, 48, 1057–1063. [Google Scholar] [CrossRef] [PubMed]
  38. Chepurnov, V.A.; Chaerle, P.; Roef, L.; Van Meirhaeghe, A.; Vanhoutte, K. Classical breeding in diatoms: Scientific background and practical perspectives. In The Diatom World; Springer: New York, NY, USA, 2011; pp. 167–194. [Google Scholar]
  39. Collins, L.; Alvarez, D.; Chauhan, A. Phycoremediation Coupled with Generation of Value-Added Products. In Microbial Biodegradation and Bioremediation; Elsevier: Amsterdam, The Netherlands, 2014; pp. 341–387. [Google Scholar]
  40. Cushing, D.H. Plankton production and year-class strength in fish populations: An update of the match/mismatch hypothesis. Adv. Mar. Biol. 1990, 26, 249–293. [Google Scholar] [CrossRef]
  41. Degerlund, M.; Eilertsen, H.C. Main species characteristics of phytoplankton spring blooms in NE Atlantic and Arctic waters (68–80° N). Estuar. Coasts 2010, 33, 242–269. [Google Scholar] [CrossRef]
  42. Shimizu, Y. Microalgal metabolites: A new perspective. Annu. Rev. Microbiol. 1996, 50, 431–465. [Google Scholar] [CrossRef]
  43. Faulkner, D.J. Marine natural products. Nat. Prod. Rep. 2001, 18, 1R–49R. [Google Scholar] [CrossRef] [PubMed]
  44. Mata, T.M.; Martins, A.A.; Caetano, N.S. Microalgae for biodiesel production and other applications: A review. Renew. Sustain. Energy Rev. 2010, 14, 217–232. [Google Scholar] [CrossRef] [Green Version]
  45. Artamonova, E.; Vasskog, T.; Eilertsen, H.C. Lipid content and fatty acid composition of Porosira glacialis and Attheya longicornis in response to carbon dioxide (CO2) aeration. PLoS ONE 2017, 12, e0177703. [Google Scholar] [CrossRef] [PubMed] [Green Version]
  46. Svenning, J.B.; Dalheim, L.; Eilertsen, H.C.; Vasskog, T. Temperature dependent growth rate, lipid content and fatty acid composition of the marine cold-water diatom Porosira glacialis. Algal Res. 2019, 37, 11–16. [Google Scholar] [CrossRef]
  47. Jónasdóttir, S.H. Fatty acid profiles and production in marine phytoplankton. Mar. Drugs 2019, 17, 151. [Google Scholar] [CrossRef] [PubMed] [Green Version]
  48. Goessling, J.W.; Su, Y.; Cartaxana, P.; Maibohm, C.; Rickelt, L.F.; Trampe, E.C.; Walby, S.L.; Wangpraseurt, D.; Wu, X.; Ellegaard, M. Structure-based optics of centric diatom frustules: Modulation of the in vivo light field for efficient diatom photosynthesis. New Phytol. 2018, 219, 122–134. [Google Scholar] [CrossRef] [PubMed] [Green Version]
  49. Zhuang, L.-L.; Yu, D.; Zhang, J.; Liu, F.-f.; Wu, Y.-H.; Zhang, T.-Y.; Dao, G.-H.; Hu, H.-Y. The characteristics and influencing factors of the attached microalgae cultivation: A review. Renew. Sustain. Energy Rev. 2018, 94, 1110–1119. [Google Scholar] [CrossRef]
  50. Norsker, N.-H.; Barbosa, M.J.; Vermuë, M.H.; Wijffels, R.H. Microalgal production—A close look at the economics. Biotechnol. Adv. 2011, 29, 24–27. [Google Scholar] [CrossRef] [PubMed]
  51. Kawaguchi, K. Microalgae Production Systems in Asia; Elsevier: Amsterdam, The Netherlands, 1980. [Google Scholar]
  52. Venkataraman, L. Blue-green algae as biofertilizer. In CRC Handbook of Microalgal Mass Culture; CRC Press: Boca Raton, FL, USA, 1986; pp. 455–472. [Google Scholar]
  53. Lee, Y.-K. Commercial production of microalgae in the Asia-Pacific rim. J. Appl. Phycol. 1997, 9, 403–411. [Google Scholar] [CrossRef]
  54. Brennan, L.; Owende, P. Biofuels from microalgae—A review of technologies for production, processing, and extractions of biofuels and co-products. Renew. Sustain. Energy Rev. 2010, 14, 557–577. [Google Scholar] [CrossRef]
  55. Suparmaniam, U.; Lam, M.K.; Uemura, Y.; Lim, J.W.; Lee, K.T.; Shuit, S.H. Insights into the microalgae cultivation technology and harvesting process for biofuel production: A review. Renew. Sustain. Energy Rev. 2019, 115, 109361. [Google Scholar] [CrossRef]
  56. Huang, J.; Hankamer, B.; Yarnold, J. Design scenarios of outdoor arrayed cylindrical photobioreactors for microalgae cultivation considering solar radiation and temperature. Algal Res. 2019, 41, 101515. [Google Scholar] [CrossRef] [Green Version]
  57. Shi, Q.; Chen, C.; Zhang, W.; Wu, P.; Sun, M.; Wu, H.; Wu, H.; Fu, P.; Fan, J. Transgenic eukaryotic microalgae as green factories: Providing new ideas for the production of biologically active substances. J. Appl. Phycol. 2021, 33, 705–728. [Google Scholar] [CrossRef]
  58. Geider, R.; Osborne, B. Light absorption by a marine diatom: Experimental observations and theoretical calculations of the package effect in a small Thalassiosira species. Mar. Biol. 1987, 96, 299–308. [Google Scholar] [CrossRef]
  59. Chisholm, S.W. Phytoplankton size. In Primary Productivity and Biogeochemical Cycles in the Sea; Springer: Cham, Switzerland, 1992; pp. 213–237. [Google Scholar]
  60. Agustí, S.; Enriquez, S.; Frost-Christensen, H.; Sand-Jensen, K.; Duarte, C. Light harvesting among photosynthetic organisms. Funct. Ecol. 1994, 8, 273–279. [Google Scholar] [CrossRef]
  61. Cermeno, P.; Estévez-Blanco, P.; Maranón, E.; Fernóndez, E. Maximum photosynthetic efficiency of size-fractionated phytoplankton assessed by 14C uptake and fast repetition rate fluorometry. Limnol. Oceanogr. 2005, 50, 1438–1446. [Google Scholar] [CrossRef] [Green Version]
  62. Maraóón, E.; Cermeóo, P.; Rodríguez, J.; Zubkov, M.V.; Harris, R.P. Scaling of phytoplankton photosynthesis and cell size in the ocean. Limnol. Oceanogr. 2007, 52, 2190–2198. [Google Scholar] [CrossRef]
  63. Martinez-Jeronimo, F.; Gutierrez-Valdivia, A. Fecundity, reproduction, and growth of Moina macrocopa fed different algae. Hydrobiologia 1991, 222, 49–55. [Google Scholar] [CrossRef]
  64. Menden-Deuer, S.; Lessard, E.J. Carbon to volume relationships for dinoflagellates, diatoms, and other protist plankton. Limnol. Oceanogr. 2000, 45, 569–579. [Google Scholar] [CrossRef] [Green Version]
  65. Sinclair, D. Light scattering by spherical particles. JOSA 1947, 37, 475–480. [Google Scholar] [CrossRef]
  66. Baker, E.T.; Lavelle, J.W. The effect of particle size on the light attenuation coefficient of natural suspensions. J. Geophys. Res. Ocean. 1984, 89, 8197–8203. [Google Scholar] [CrossRef]
  67. Agustí, S. Light environment within dense algal populations: Cell size influences on self-shading. J. Plankton Res. 1991, 13, 863–871. [Google Scholar] [CrossRef]
  68. Nelson, N.B.; Prézelin, B.B.; Bidigare, R.R. Phytoplankton light absorption and the package effect in California coastal waters. Mar. Ecol. Prog. Ser. 1993, 94, 217–227. Available online: https://www.jstor.org/stable/24832708 (accessed on 1 June 2021). [CrossRef]
  69. Harris, G.P. Photosynthesis, productivity and growth. Adv. Limnol. 1978, 4, 10. [Google Scholar]
  70. Kirk, J.T.O. Optical properties of picoplankton suspensions. In Photosynthetic Picoplankton; Platt, T., Li, W.K.W., Eds.; Canadian Bulletin of Fisheries and Aquatic Sciences: Ottawa, ON, Canada, 1986; Volume 214, pp. 501–520. [Google Scholar]
  71. Lee, C.-G. Calculation of light penetration depth in photobioreactors. Biotechnol. Bioprocess Eng. 1999, 4, 78–81. [Google Scholar] [CrossRef]
  72. Chen, C.-Y.; Yeh, K.-L.; Aisyah, R.; Lee, D.-J.; Chang, J.-S. Cultivation, photobioreactor design and harvesting of microalgae for biodiesel production: A critical review. Bioresour. Technol. 2011, 102, 71–81. [Google Scholar] [CrossRef] [PubMed]
  73. Khan, M.I.; Shin, J.H.; Kim, J.D. The promising future of microalgae: Current status, challenges, and optimization of a sustainable and renewable industry for biofuels, feed, and other products. Microb. Cell Factories 2018, 17, 36. [Google Scholar] [CrossRef] [PubMed]
  74. Pienkos, P.T.; Darzins, A. The promise and challenges of microalgal-derived biofuels. Biofuels Bioprod. Biorefin. Innov. Sustain. Econ. 2009, 3, 431–440. [Google Scholar] [CrossRef]
  75. Hannon, M.; Gimpel, J.; Tran, M.; Rasala, B.; Mayfield, S. Biofuels from algae: Challenges and potential. Biofuels 2010, 1, 763–784. [Google Scholar] [CrossRef]
  76. Putt, R.; Singh, M.; Chinnasamy, S.; Das, K. An efficient system for carbonation of high-rate algae pond water to enhance CO2 mass transfer. Bioresour. Technol. 2011, 102, 3240–3245. [Google Scholar] [CrossRef] [PubMed]
  77. De Roos, B.; Sneddon, A.A.; Sprague, M.; Horgan, G.W.; Brouwer, I.A. The potential impact of compositional changes in farmed fish on its health-giving properties: Is it time to reconsider current dietary recommendations? Public Health Nutr. 2017, 20, 2042–2049. [Google Scholar] [CrossRef] [Green Version]
  78. Hansen, L. The Weak Sustainability of the Salmon Feed Transition in Norway—A Bioeconomic Case Study. Front. Mar. Sci. 2019, 6, 764. [Google Scholar] [CrossRef] [Green Version]
  79. Hamre, K.; Yúfera, M.; Rønnestad, I.; Boglione, C.; Conceição, L.E.; Izquierdo, M. Fish larval nutrition and feed formulation: Knowledge gaps and bottlenecks for advances in larval rearing. Rev. Aquac. 2013, 5, S26–S58. [Google Scholar] [CrossRef] [Green Version]
  80. Midtbø, L.K.; Borkowska, A.G.; Bernhard, A.; Rønnevik, A.K.; Lock, E.-J.; Fitzgerald, M.L.; Torstensen, B.E.; Liaset, B.; Brattelid, T.; Pedersen, T.L. Intake of farmed Atlantic salmon fed soybean oil increases hepatic levels of arachidonic acid-derived oxylipins and ceramides in mice. J. Nutr. Biochem. 2015, 26, 585–595. [Google Scholar] [CrossRef] [PubMed] [Green Version]
  81. Sargent, J.; Eilertsen, H.; Falk-Petersen, S.; Taasen, J. Carbon assimilation and lipid production in phytoplankton in northern Norwegian fjords. Mar. Biol. 1985, 85, 109–116. [Google Scholar] [CrossRef]
  82. Eilertsen, H.; Wyatt, T. Phytoplankton models and life history strategies. S. Afr. J. Mar. Sci. 2000, 22, 323–338. [Google Scholar] [CrossRef] [Green Version]
  83. Haslam, R.P.; Keys, A.J.; Andralojc, P.J.; Madgwick, P.J.; Inger, A.; Grimsrud, A.; Eilertsen, H.C.; Parry, M.A. Specificity of diatom Rubisco. In Plant Responses to Air Pollution and Global Change; Springer: Cham, Switzerland, 2005; pp. 157–164. [Google Scholar]
  84. Eilertsen, H.C.; Degerlund, M. Phytoplankton and light during the northern high-latitude winter. J. Plankton Res. 2010, 32, 899–912. [Google Scholar] [CrossRef]
  85. Huseby, S.; Degerlund, M.; Eriksen, G.K.; Ingebrigtsen, R.A.; Eilertsen, H.C.; Hansen, E. Chemical diversity as a function of temperature in six northern diatom species. Mar. Drugs 2013, 11, 4232–4245. [Google Scholar] [CrossRef] [Green Version]
  86. Strickland, J.D.H.; Parsons, T.R. A Practical Handbook of Seawater Analysis, 2nd ed.; Stevenson, J.C., Ed.; Fisheries Research Board of Canada: Ottawa, ON, Canada, 1972. [Google Scholar]
  87. Guillard, R.R.L.; Ryther, J.H. Studies of marine plankton diatoms. I. Cyclotella nana Hustedt and Detonula confervacea (Cleve) Gran. Can. J. Microbiol. 1962, 8, 229–239. [Google Scholar] [CrossRef]
  88. Utermöhl, H. Zur Vervollkommnung der quantitativen Phytoplanktonmethodik. Mitt. Int. Ver. Theor. Angew. Limnol. 1958, 9, 1–38. [Google Scholar] [CrossRef]
  89. Tomas, C.R. Identifying Marine Phytoplankton; Elsevier: Amsterdam, The Netherlands, 1997. [Google Scholar] [CrossRef]
  90. Holm-Hansen, O.; Riemann, B. Chlorophyll a determination: Improvements in methodology. Oikos 1978, 30, 438–447. Available online: https://www.jstor.org/stable/3543338 (accessed on 1 June 2021). [CrossRef]
  91. Platt, T.; Irwin, B. Caloric content of phytoplankton. Limnol. Oceanogr. 1973, 18, 306–310. [Google Scholar] [CrossRef]
  92. Tibbetts, S.M.; Milley, J.E.; Lall, S.P. Chemical composition and nutritional properties of freshwater and marine microalgal biomass cultured in photobioreactors. J. Appl. Phycol. 2015, 27, 1109–1119. [Google Scholar] [CrossRef] [Green Version]
  93. Eilertsen, H.C.; Holm-Hansen, O. Effects of high latitude UV radiation on phytoplankton and nekton modelled from field measurements by simple algorithms. Polar Res. 2000, 19, 173–182. [Google Scholar] [CrossRef]
  94. Jensen, I.; Mæhre, H.; Tømmerås, S.; Eilertsen, K.; Olsen, R.; Elvevoll, E. Farmed Atlantic salmon (Salmo salar L.) is a good source of long chain omega-3 fatty acids. Nutr. Bull. 2012, 37, 25–29. [Google Scholar] [CrossRef]
  95. Folch, J.; Lees, M.; Stanley, G.S. A simple method for the isolation and purification of total lipides from animal tissues. J. Biol. Chem. 1957, 226, 497–509. [Google Scholar] [CrossRef]
  96. Cequier-Sánchez, E.; Rodriguez, C.; Ravelo, A.G.; Zarate, R. Dichloromethane as a solvent for lipid extraction and assessment of lipid classes and fatty acids from samples of different natures. J. Agric. Food Chem. 2008, 56, 4297–4303. [Google Scholar] [CrossRef] [PubMed]
  97. Christie, W.W. (Ed.) Preparation of ester derivatives of fatty acids for chromatographic analysis. In Advances in Lipid Methodology Two; Oily Press: Dundee, Scotland, 1993; pp. 69–111. [Google Scholar]
  98. Abreu, S.; Solgadi, A.; Chaminade, P. Optimization of normal phase chromatographic conditions for lipid analysis and comparison of associated detection techniques. J. Chromatogr. 2017, 1514, 54–71. [Google Scholar] [CrossRef]
  99. Moore, S.; Stein, W.H. Chromatographic determination of amino acids by the use of automatic recording equipment. Methods Enzymol. 1963, 6, 819–831. [Google Scholar] [CrossRef]
  100. Mæhre, H.K.; Dalheim, L.; Edvinsen, G.K.; Elvevoll, E.O.; Jensen, I.-J. Protein determination—Method matters. Foods 2018, 7, 5. [Google Scholar] [CrossRef] [Green Version]
  101. Mæhre, H.; Hamre, K.; Elvevoll, E. Nutrient evaluation of rotifers and zooplankton: Feed for marine fish larvae. Aquacult. Nutr. 2013, 19, 301–311. [Google Scholar] [CrossRef]
  102. WHO. Diet, Nutrition, and the Prevention of Chronic Diseases: Report of a Joint WHO/FAO Expert Consultation; World Health Organization: Rome, Italy, 2003; Volume 916. [Google Scholar]
  103. Nash, S.B.; Poulsen, A.; Kawaguchi, S.; Vetter, W.; Schlabach, M. Persistent organohalogen contaminant burdens in Antarctic krill (Euphausia superba) from the eastern Antarctic sector: A baseline study. Sci. Total Environ. 2008, 407, 304–314. [Google Scholar] [CrossRef]
  104. Osvik, R.D.; Andersen, J.H.; Eilertsen, H.C.; Geneviere, A.-M.; Hansen, E.H. Bioactivity of a Marine Diatom (Porosira glacialis [Grunow] Jörgensen 1905) Cultivated with and Without Factory Smoke CO2. Ind. Biotechnol. 2021, 17, 38–48. [Google Scholar] [CrossRef]
  105. Olsen, E.K.; Hansen, E.; Isaksson, J.; Andersen, J.H. Cellular antioxidant effect of four bromophenols from the red algae, Vertebrata lanosa. Mar. Drugs 2013, 11, 2769–2784. [Google Scholar] [CrossRef] [PubMed] [Green Version]
  106. Lauritano, C.; Andersen, J.H.; Hansen, E.; Albrigtsen, M.; Escalera, L.; Esposito, F.; Helland, K.; Hanssen, K.Ø.; Romano, G.; Ianora, A. Bioactivity screening of microalgae for antioxidant, anti-inflammatory, anticancer, anti-diabetes, and antibacterial activities. Front. Mar. Sci. 2016, 3, 68. [Google Scholar] [CrossRef] [Green Version]
  107. Ingebrigtsen, R.A.; Hansen, E.; Andersen, J.H.; Eilertsen, H.C. Light and temperature effects on bioactivity in diatoms. J. Appl. Phycol. 2016, 28, 939–950. [Google Scholar] [CrossRef] [PubMed] [Green Version]
  108. Lind, K.F.; Hansen, E.; Østerud, B.; Eilertsen, K.-E.; Bayer, A.; Engqvist, M.; Leszczak, K.; Jørgensen, T.Ø.; Andersen, J.H. Antioxidant and anti-inflammatory activities of Barettin. Mar. Drugs 2013, 11, 2655–2666. [Google Scholar] [CrossRef] [PubMed] [Green Version]
  109. Grimenes, A.; Thue-Hansen, V. The reduction of global radiation in south-eastern Norway during the last 50 years. Theor. Appl. Climatol. 2006, 85, 37–40. [Google Scholar] [CrossRef]
  110. Cornet, J.; Dussap, C.; Gros, J. Conversion of radiant light energy in photobioreactors. AIChE J. 1994, 40, 1055–1066. [Google Scholar] [CrossRef]
  111. Zhang, X. Microalgae Removal of CO2 from Flue Gas; IEA Clean Coal Centre: Paris, France, 2015. [Google Scholar]
  112. Nwoba, E.G.; Parlevliet, D.A.; Laird, D.W.; Alameh, K.; Moheimani, N.R. Light management technologies for increasing algal photobioreactor efficiency. Algal Res. 2019, 39, 101433. [Google Scholar] [CrossRef]
  113. Zurano, A.S.; Cárdenas, J.G.; Serrano, C.G.; Amaral, M.M.; Acién-Fernández, F.; Sevilla, J.F.; Grima, E.M. Year-long assessment of a pilot-scale thin-layer reactor for microalgae wastewater treatment. Variation in the microalgae-bacteria consortium and the impact of environmental conditions. Algal Res. 2020, 50, 101983. [Google Scholar] [CrossRef]
  114. Barceló-Villalobos, M.; Fernández-del Olmo, P.; Guzmán, J.; Fernández-Sevilla, J.; Fernández, F.A. Evaluation of photosynthetic light integration by microalgae in a pilot-scale raceway reactor. Bioresour. Technol. 2019, 280, 404–411. [Google Scholar] [CrossRef]
  115. Olseth, J.A.; Skartveit, A. Solar radiation climate of Norway. Solar Energy 1986, 37, 423–428. [Google Scholar] [CrossRef]
  116. Bell, A.M.; von der Au, M.; Regnery, J.; Schmid, M.; Meermann, B.; Reifferscheid, G.; Ternes, T.; Buchinger, S. Does galvanic cathodic protection by aluminum anodes impact marine organisms? Environ. Sci. Eur. 2020, 32, 157. [Google Scholar] [CrossRef]
  117. Šetlík, I.; Šust, V.; Málek, I. Dual purpose open circulation units for large scale culture of algae in temperate zones. I. Basic design considerations and scheme of a pilot plant. Algol. Stud./Archiv für Hydrobiol. 1970, 1, 111–164. [Google Scholar]
  118. Chisti, Y. Biodiesel from microalgae. Biotechnol. Adv. 2007, 25, 294–306. [Google Scholar] [CrossRef] [PubMed]
  119. Richmond, A.; Lichtenberg, E.; Stahl, B.; Vonshak, A. Quantitative assessment of the major limitations on productivity of Spirulina platensis in open raceways. J. Appl. Phycol. 1990, 2, 195–206. [Google Scholar] [CrossRef]
  120. Huntley, M.E.; Redalje, D.G. CO2 mitigation and renewable oil from photosynthetic microbes: A new appraisal. Mitig. Adapt. Strateg. Glob. Change 2007, 12, 573–608. [Google Scholar] [CrossRef]
  121. Pushparaj, B.; Pelosi, E.; Tredici, M.R.; Pinzani, E.; Materassi, R. As integrated culture system for outdoor production of microalgae and cyanobacteria. J. Appl. Phycol. 1997, 9, 113–119. [Google Scholar] [CrossRef]
  122. Moreno, J.; Vargas, M.Á.; Rodrıguez, H.; Rivas, J.; Guerrero, M.G. Outdoor cultivation of a nitrogen-fixing marine cyanobacterium, Anabaena sp. ATCC 33047. Biomol. Eng. 2003, 20, 191–197. [Google Scholar] [CrossRef]
  123. Doucha, J.; Lívanský, K. Productivity, CO2/O2 exchange and hydraulics in outdoor open high density microalgal (Chlorella sp.) photobioreactors operated in a Middle and Southern European climate. J. Appl. Phycol. 2006, 18, 811–826. [Google Scholar] [CrossRef]
  124. Rubio, F.C.; Fernández, F.A.; Pérez, J.S.; Camacho, F.G.; Grima, E.M. Prediction of dissolved oxygen and carbon dioxide concentration profiles in tubular photobioreactors for microalgal culture. Biotechnol. Bioeng. 1999, 62, 71–86. [Google Scholar] [CrossRef]
  125. Molina, E.; Fernández, J.; Acién, F.; Chisti, Y. Tubular photobioreactor design for algal cultures. J. Biotechnol. 2001, 92, 113–131. [Google Scholar] [CrossRef]
  126. Ugwu, C.; Ogbonna, J.; Tanaka, H. Improvement of mass transfer characteristics and productivities of inclined tubular photobioreactors by installation of internal static mixers. Appl. Microbiol. Biotechnol. 2002, 58, 600–607. [Google Scholar] [CrossRef] [PubMed]
  127. Carlozzi, P. Dilution of solar radiation through “culture” lamination in photobioreactor rows facing south–north: A way to improve the efficiency of light utilization by cyanobacteria (Arthrospira platensis). Biotechnol. Bioeng. 2003, 81, 305–315. [Google Scholar] [CrossRef] [PubMed]
  128. Olaizola, M. Commercial production of astaxanthin from Haematococcus pluvialis using 25,000-liter outdoor photobioreactors. J. Appl. Phycol. 2000, 12, 499–506. [Google Scholar] [CrossRef]
  129. García-Malea, M.; Acién, F.; Fernández, J.; Cerón, M.; Molina, E. Continuous production of green cells of Haematococcus pluvialis: Modeling of the irradiance effect. Enzym. Microb. Technol. 2006, 38, 981–989. [Google Scholar] [CrossRef]
  130. Cheng-Wu, Z.; Zmora, O.; Kopel, R.; Richmond, A. An industrial-size flat plate glass reactor for mass production of Nannochloropsis sp. (Eustigmatophyceae). Aquaculture 2001, 195, 35–49. [Google Scholar] [CrossRef]
  131. Converti, A.; Lodi, A.; Del Borghi, A.; Solisio, C. Cultivation of Spirulina platensis in a combined airlift-tubular reactor system. Biochem. Eng. J. 2006, 32, 13–18. [Google Scholar] [CrossRef]
  132. Carlozzi, P. Hydrodynamic aspects and Arthrospira growth in two outdoor tubular undulating row photobioreactors. Appl. Microbiol. Biotechnol. 2000, 54, 14–22. [Google Scholar] [CrossRef]
  133. Zittelli, G.C.; Rodolfi, L.; Biondi, N.; Tredici, M.R. Productivity and photosynthetic efficiency of outdoor cultures of Tetraselmis suecica in annular columns. Aquaculture 2006, 261, 932–943. [Google Scholar] [CrossRef]
  134. Sato, T.; Usui, S.; Tsuchiya, Y.; Kondo, Y. Invention of outdoor closed type photobioreactor for microalgae. Energy Convers. Manag. 2006, 47, 791–799. [Google Scholar] [CrossRef]
  135. Doucha, J.; Straka, F.; Lívanský, K. Utilization of flue gas for cultivation of microalgae (Chlorella sp.) in an outdoor open thin-layer photobioreactor. J. Appl. Phycol. 2005, 17, 403–412. [Google Scholar] [CrossRef]
  136. Bani, A.; Fernandez, F.G.A.; D’Imporzano, G.; Parati, K.; Adani, F. Influence of photobioreactor set-up on the survival of microalgae inoculum. Bioresour. Technol. 2021, 320, 124408. [Google Scholar] [CrossRef] [PubMed]
  137. Paladino, O.; Neviani, M. Scale-up of photo-bioreactors for microalgae cultivation by π-theorem. Biochem. Eng. J. 2020, 153, 107398. [Google Scholar] [CrossRef]
  138. Jung, S.-H.; McHardy, C.; Rauh, C.; Jahn, A.; Luzi, G.; Delgado, A.; Buchholz, R.; Lindenberger, C. A new approach for calculating microalgae culture growth based on an inhibitory effect of the surrounding biomass. Bioprocess Biosyst. Eng. 2021, 44, 1671–1684. [Google Scholar] [CrossRef] [PubMed]
  139. Sánchez Mirón, A.; García Camacho, F.; Contreras Gómez, A.; Grima, E.M.; Chisti, Y. Bubble-column and airlift photobioreactors for algal culture. AIChE J. 2000, 46, 1872–1887. [Google Scholar] [CrossRef]
  140. Tennessen, D.J.; Bula, R.J.; Sharkey, T.D. Efficiency of photosynthesis in continuous and pulsed light emitting diode irradiation. Photosynth. Res. 1995, 44, 261–269. [Google Scholar] [CrossRef]
  141. Eilertsen, H.C.; Taasen, J. Investigations on the plankton community of Balsfjorden, northern Norway. The phytoplankton 1976–1978. Environmental factors, dynamics of growth, and primary production. Sarsia 1984, 69, 1–15. [Google Scholar] [CrossRef]
  142. Eppley, R.W. Temperature and phytoplankton growth in the sea. Fish. Bull. 1972, 70, 1063–1085. [Google Scholar]
  143. Gilstad, M.; Sakshaug, E. Growth rates of ten diatom species from the Barents Sea at different irradiances and day lengths. Marine ecology progress series. Oldendorf 1990, 64, 169–173. Available online: https://www.jstor.org/stable/24844602 (accessed on 1 June 2021). [CrossRef]
  144. Rhee, G.-Y. Effects of environmental factors and their interactions on phytoplankton growth. Adv. Microb. Ecol. 1982, 6, 33–74. [Google Scholar] [CrossRef]
  145. Geider, R.; MacIntyre, H.; Kana, T. Dynamic model of phytoplankton growth and acclimation: Responses of the balanced growth rate and the chlorophyll a: Carbon ratio to light, nutrient-limitation and temperature. Mar. Ecol. Prog. Ser. 1997, 148, 187–200. [Google Scholar] [CrossRef] [Green Version]
  146. Madani, N.S.H.; Mehrgan, M.S.; Shekarabi, S.P.H.; Pourang, N. Regulatory effect of gibberellic acid (GA3) on the biomass productivity and some metabolites of a marine microalga, Isochrysis galbana. J. Appl. Phycol. 2021, 33, 255–262. [Google Scholar] [CrossRef]
  147. Eilertsen, H.C.; Sandberg, S.; Tøllefsen, H. Photoperiodic control of diatom spore growth: A theory to explain the onset of phytoplankton blooms. Marine ecology progress series. Oldendorf 1995, 116, 303–307. [Google Scholar] [CrossRef]
  148. Wahidin, S.; Idris, A.; Shaleh, S.R.M. The influence of light intensity and photoperiod on the growth and lipid content of microalgae Nannochloropsis sp. Bioresour. Technol. 2013, 129, 7–11. [Google Scholar] [CrossRef] [PubMed]
  149. Ogbonna, J.C.; Yada, H.; Tanaka, H. Light supply coefficient: A new engineering parameter for photobioreactor design. J. Ferment. Bioeng. 1995, 80, 369–376. [Google Scholar] [CrossRef]
  150. Carvalho, A.P.; Silva, S.O.; Baptista, J.M.; Malcata, F.X. Light requirements in microalgal photobioreactors: An overview of biophotonic aspects. Appl. Microbiol. Biotechnol. 2011, 89, 1275–1288. [Google Scholar] [CrossRef] [PubMed]
  151. Brzychczyk, B.; Hebda, T.; Fitas, J.; Giełżecki, J. The follow-up photobioreactor illumination system for the cultivation of photosynthetic microorganisms. Energies 2020, 13, 1143. [Google Scholar] [CrossRef] [Green Version]
  152. Costache, T.; Fernández, F.G.A.; Morales, M.; Fernández-Sevilla, J.; Stamatin, I.; Molina, E. Comprehensive model of microalgae photosynthesis rate as a function of culture conditions in photobioreactors. Appl. Microbiol. Biotechnol. 2013, 97, 7627–7637. [Google Scholar] [CrossRef]
  153. Endres, C.H.; Roth, A.; Brück, T.B. Modeling microalgae productivity in industrial-scale vertical flat panel photobioreactors. Environ. Sci. Technol. 2018, 52, 5490–5498. [Google Scholar] [CrossRef] [PubMed]
  154. Chanquia, S.N.; Vernet, G.; Kara, S. Photobioreactors for cultivation and synthesis: Specifications, challenges, and perspectives. Eng. Life Sci. 2021, 1–11. [Google Scholar] [CrossRef]
  155. Nagase, H.; Yoshihara, K.-i.; Eguchi, K.; Okamoto, Y.; Murasaki, S.; Yamashita, R.; Hirata, K.; Miyamoto, K. Uptake pathway and continuous removal of nitric oxide from flue gas using microalgae. Biochem. Eng. J. 2001, 7, 241–246. [Google Scholar] [CrossRef]
  156. Kethineni, C.; Choragudi, S.; Kokkiligadda, S.; Jaswanthi, N.; Ronda, S.R. Development of sequential processes for multiple product recovery from microalgae. Ind. Biotechnol. 2018, 14, 95–106. [Google Scholar] [CrossRef]
  157. Losh, J.L.; Young, J.N.; Morel, F.M. Rubisco is a small fraction of total protein in marine phytoplankton. New Phytol. 2013, 198, 52–58. [Google Scholar] [CrossRef]
  158. Valegård, K.; Andralojc, P.J.; Haslam, R.P.; Pearce, F.G.; Eriksen, G.K.; Madgwick, P.J.; Kristoffersen, A.K.; van Lun, M.; Klein, U.; Eilertsen, H.C. Structural and functional analyses of Rubisco from arctic diatom species reveal unusual posttranslational modifications. J. Biol. Chem. 2018, 293, 13033–13043. [Google Scholar] [CrossRef] [Green Version]
  159. Svenning, J.B.; Dalheim, L.; Vasskog, T.; Matricon, L.; Vang, B.; Olsen, R.L. Lipid yield from the diatom Porosira glacialis is determined by solvent choice and number of extractions, independent of cell disruption. Sci. Rep. 2020, 10, 22229. [Google Scholar] [CrossRef]
  160. Dalheim, L.; Svenning, J.B.; Eilertsen, H.C.; Vasskog, T.; Olsen, R.L. Stability of lipids during wet storage of the marine diatom Porosira glacialis under semi-preserved conditions at 4 and 20 degrees C. J. Appl. Phycol. 2020, 11, 385–395. [Google Scholar] [CrossRef]
  161. Fields, F.J.; Kociolek, J.P. An evolutionary perspective on selecting high-lipid-content diatoms (Bacillariophyta). J. Appl. Phycol. 2015, 27, 2209–2220. [Google Scholar] [CrossRef]
  162. Widjaja, A.; Chien, C.-C.; Ju, Y.-H. Study of increasing lipid production from fresh water microalgae Chlorella vulgaris. J. Taiwan Inst. Chem. Eng. 2009, 40, 13–20. [Google Scholar] [CrossRef]
  163. Artamonova, E.Y.; Svenning, J.B.; Vasskog, T.; Hansen, E.; Eilertsen, H.C. Analysis of phospholipids and neutral lipids in three common northern cold water diatoms: Coscinodiscus concinnus, Porosira glacialis, and Chaetoceros socialis, by ultra-high performance liquid chromatography-mass spectrometry. J. Appl. Phycol. 2017, 29, 1241–1249. [Google Scholar] [CrossRef]
  164. Dalheim, L.; Svenning, J.B.; Olsen, R.L. In vitro intestinal digestion of lipids from the marine diatom Porosira glacialis compared to commercial LC n-3 PUFA products. PLoS ONE 2021, 16, e0252125. [Google Scholar] [CrossRef]
  165. Sayanova, O.; Mimouni, V.; Ulmann, L.; Morant-Manceau, A.; Pasquet, V.; Schoefs, B.; Napier, J.A. Modulation of lipid biosynthesis by stress in diatoms. Philos. Trans. R. Soc. B-Biol. Sci. 2017, 372, 14. [Google Scholar] [CrossRef] [Green Version]
  166. Wang, Y.; Tibbetts, S.M.; McGinn, P.J. Microalgae as Sources of High-Quality Protein for Human Food and Protein Supplements. Foods 2021, 10, 3002. [Google Scholar] [CrossRef]
  167. Nagarajan, D.; Varjani, S.; Lee, D.-J.; Chang, J.-S. Sustainable aquaculture and animal feed from microalgae–Nutritive value and techno-functional components. Renew. Sustain. Energy Rev. 2021, 150, 111549. [Google Scholar] [CrossRef]
  168. Becker, W. 18 microalgae in human and animal nutrition. In Handbook of Microalgal Culture: Biotechnology and Applied Phycology; Richmond, A., Ed.; Blackwell Publishing: Hoboken, NJ, USA, 2004; Volume 312. [Google Scholar]
  169. Giæver, I.H. Diatom Protein and Amino Acids—A Mass Cultivated Northern Diatom and Its Potential for Utilization as Protein Source in Fish Feed; UiT—The Arctic University of Norway: Tromsø, Norway, 2020. [Google Scholar]
  170. FAO. Protein and Amino Acid Requirements in Human Nutrition: Report of a Joint FAO/WHO/UNU Expert Consultation; World Health Organization, FAO: Geneva, Switzerland, 2007; Volume 935. [Google Scholar]
  171. Hackethal, C.; Kopp, J.F.; Sarvan, I.; Schwerdtle, T.; Lindtner, O. Total arsenic and water-soluble arsenic species in foods of the first German total diet study (BfR MEAL Study). Food Chem. 2021, 346, 128913. [Google Scholar] [CrossRef]
  172. Taylor, V.; Goodale, B.; Raab, A.; Schwerdtle, T.; Reimer, K.; Conklin, S.; Karagas, M.R.; Francesconi, K.A. Human exposure to organic arsenic species from seafood. Sci. Total Environ. 2017, 580, 266–282. [Google Scholar] [CrossRef]
  173. Jinadasa, B.; Jayasinghe, G.; Pohl, P.; Fowler, S.W. Mitigating the impact of mercury contaminants in fish and other seafood—A review. Mar. Pollut. Bull. 2021, 171, 112710. [Google Scholar] [CrossRef]
  174. EC. Directive 2002/32/EC of the European Parliament and of the Council of 7 May 2002 on Undesirable Substances in Animal Feed; European Comission: Brussels, Belgium, 2002; OJ L 140. [Google Scholar]
  175. Lauritano, C.; Helland, K.; Riccio, G.; Andersen, J.H.; Ianora, A.; Hansen, E.H. Lysophosphatidylcholines and chlorophyll-derived molecules from the diatom Cylindrotheca closterium with anti-inflammatory activity. Mar. Drugs 2020, 18, 166. [Google Scholar] [CrossRef] [Green Version]
  176. Eilertsen, H.C.; Elvevoll, E.; Giæver, I.H.; Svenning, J.B.; Dalheim, L.; Svalheim, R.A.; Vang, B.; Siikavuopio, S.; Dragøy, R.; Ingebrigtsen, R.A. Inclusion of photoautotrophic cultivated diatom biomass in salmon feed can deter lice. PLoS ONE 2021, 16, e0255370. [Google Scholar] [CrossRef]
Figure 1. Photobioreactor cultivation periods from May 2015 until July 2021 at Finnfjord AS. Letters in parentheses refer to type of reactor 150 (P) = 150 L Plexi, 250 (P) = 250 L Plexi, 6 (S) = 6000 L Steel, 6 (G) = 6000 L Glass fiber, 14 (S) = 14,000 L Steel, 300 (G) = 300,000 L glass fiber.
Applsci 12 03082 g001
Figure 2. The main components of the microalgae cultivation system integrated in the production line at the ferrosilicon producer Finnfjord AS.
Applsci 12 03082 g002
Figure 3. Temperatures in the seawater intake at Finnfjord AS in 2019.
Applsci 12 03082 g003
Figure 4. Temperatures measured in the 300,000 L reactor during the cultivation sessions.
Applsci 12 03082 g004
Figure 5. pH registrations in the 300,000 L reactor during the cultivation sessions. The dotted line indicates ca. pH in the cultivation medium (seawater and added inorganic nutrients without algae, i.e., reactor intake water).
Applsci 12 03082 g005
Figure 6. Monthly means of PAR (300–700 nm) cosine atmospheric irradiance incident upon the 300 m−3 photobioreactor at Finnfjord AS. Data represents means of logged data from October 2018, March–June 2019, and all of 2020 until August 2021. Detailed data on interannual variation of visible radiation in the area are not available, but further south along the coast radiation between years can vary 2.5–3.1% [109].
Applsci 12 03082 g006
Figure 7. Mean scalar irradiance history in the 300,000 L photobioreactor.
Applsci 12 03082 g007
Figure 8. Total scalar light on–in the 300,000 L photobioreactor.
Applsci 12 03082 g008
Figure 9. Biomass specific uptake of inorganic nutrients in the 300 m3 reactor 2018–2021. Inner boxes = Mean +/− S.E. and outer whiskers = Mean +/− 0.95 confidence intervals. Left nitrate and nitrite, n = 117 and students t-test p = 0.041. Middle Orthophosphate, n = 127 and students t-test p = 0.66. Right Metasilicate, n = 95 and students t-test p = 0.86.
Applsci 12 03082 g009
Figure 10. Cell doubling rates from all reactors for the years 2015–2021.
Applsci 12 03082 g010
Figure 11. Production measured as biovolume pooled from all reactors.
Applsci 12 03082 g011
Figure 12. Production measured as biovolume in the 300,000 L reactor.
Applsci 12 03082 g012
Figure 13. Biovolume from all reactors 2015–2021.
Applsci 12 03082 g013
Figure 14. Orientation of data from the 300,000 L reactor at Finnfjord AS by axes formed by the two first factors in a PCA ordination analysis (n = 91).
Applsci 12 03082 g014
Figure 15. Harvested biovolume from the 300,000 L reactor vs. wet weight of the same harvested biomass, r = 0.61 at p < 0.05 and n = 60.
Applsci 12 03082 g015
Figure 16. Overview of positive results (hits) from bioactivity testing of diatom extracts. Testing was performed in two rounds using two different strains of the diatom species, as reported in Osvik et al. [104] and Ingebrigtsen et al. [107]. Each dot in the facets represents a positive hit in the respective assay. The color coding and x and y-axes are cultivation conditions; please note that “smoke or no-smoke” condition is only tested in the G300 photobioreactor. Results from assays G300–A2058, G300-Biofilm and G300–HT29 were reported in Osvik et al. [104], and HPLC fractioned extracts tested in A2058, FRAP, PTP1B and TNF_THPAIF/IM were reported in Ingebrigtsen et al. [107], see Figure 17. Color coding for conditions 1–4 was added for readability. The figure was made using RStudio Version 1.4.1106.
Applsci 12 03082 g016
Figure 17. Overview of positive results (hits) from testing diatom biomass in bioactivity assays. Highlighted here is the fractionation method (FLASH vs. HPLC). Results from assays G300–A2058, G300-Biofilm and G300–HT29 were reported in Osvik et al. [104], and HPLC fractioned extracts tested in A2058, FRAP, PTP1B and TNF THPAIF/IM assays were reported in Ingebrigtsen et al. [107]. The figure was made using RStudio Version 1.4.1106.
Applsci 12 03082 g017
Table 1. Diameter, surface area and biovolume of the green microalgae Chlorella sp. and diatoms of different sizes (Attheya longicornis and strains of Porosira glacialis and Coscinodicus radiatus). Diatom sizes are from the authors’ own culture collections while the Chlorella sp. size and volume are from Martinez-Jeronimo and Gutierrez-Valdivia [63]. Other volumes are calculated from Menden-Deuer and Lessard [64].
SpeciesDiameter (μm)Area
(μm2)
Volume
(μm3)
Area: Volume Species: Chlorella Volume
Chlorella sp.579651.221
Attheya longicornis61881980.953
Porosira glacialis 140628043,9600.14676
Porosira glacialis 245953871,5050.131100
Coscinodiscus radiatus 1180152,6042,289,0600.0735,216
Coscinodiscus radiatus 2220227,9648,366,6660.03128,718
Table 2. Inventory of main functions in the microalgae (diatom) mass cultivation project.
FunctionTypeUnit
CO2 logging, underwater and atmospheric temperatures CO2-infared (NIDR) detector (Franatech HR, Lüneburg, Germany), coupled to temperature sensor (4-wire platinum temperature 1000)mg L−1 and % saturation
°C
CO2, NO2, SO2 in factory fumeKane Quintox 9206 flue gas analysers, Hertfordshire, UKmg L−1 and % saturation, ppm
pH loggingEndress-Hauser sensor Orbsint CPS11D and 4-channel transmitter Liquiline CM444
Turbidity loggingEndress-Hauser sensors Turbimax CUS51D-HCC1A4 and 4-channel transmitter LiquilineNTU
Conductivity, salinity loggingEndress-Hauser digital sensor Indumax CLS50D w. 4-channel transmitter Liquiline CM444μs cm−1
%o
TemperatureEndress-Hauser sensor iTHERM ModuLine TM131 w. 4-channel transmitter Liquiline CM444°C
pH manual measurement WTWMulti 360 m withWTWSenTix 940 IDS probe (Xylem Analytics, Weilheim, Germany)pH
Inorganic plant nutrient measurements (NO3, NO2, PO4, Si(OH)4)Auto analyser (Seal Analytical, Wisconsin, USA). Also every second day in lab at Finnfjord AS from June 2018 with Merck kits: 1.09713.0002; 1.14408.001; 1.14848.0001; 1.01813.0001, adapted to be quantified in plate reader (Molecular devices Filter Max F5)μmol L−1
TurbulenceNORTEK (Norway) Vectrino velocimeter x/y/zcm s−1
O2WTWMulti 360 w. CellOx 325 sensor (Xylem Analytics, Germany)Mg L−1
Irradiance loggingLI-COR LI-193 (UK) Spherical quantum, LI-192 (cosine) underwater and LI-200/R Pyranometer sensors with LI-1500 Light sensor loggerμmol quanta m−2 s−1
W m−2
Irradiance and light scans manually atmosphere and sub-surfaceBiospherical (USA) QSL-100 instrument, Trios, Rases-Acc-UV Hyperspectral; Irradiance sensor (280–570 nm)
LI-COR (UK) LI-180 Spectrometer
μmol quanta m−2 s−1
mW cm−2 nm−1
Chla fluorescence manually in vivo/in vitroTurner Designs TD-700 (Turner Designs, San Jose, UK) FL
mg Chla L−1
Compressing and move factory fume2015- March 2018: Biltema (Norway) OL 20-24; 2018: Nash Vectra XL-80 and XL-35 liquid ring vacuum pumps (Gardner Denver Nash, Quincy, IL, USA)bar
L min−1
Illumination2015–2018: sub-surface white LEDs made by authors; 2016: White sub-surface 500W lens cluster LEDs; 2018–2019: 1000W blue and white units from Wuhan ZJKC Technology Co., Ltd., Wuhan, China; 2018–present: Aquagroup 400 W blue, 100 W Aurora white/green; Biomarine 2.5 kW blue (all Norway); Signify 680 W, 440 W (Netherlands); Biltema 46-3174 50W (Norway)μmol quanta m−2 s−1
mW cm−2 nm−1
% efficiency
Water filtration2015–2018: Eaton filter cartridges; 2018–2021: AZUD type 203/4VX, self cleaning system, 2 Eaton 5 cyl. Filter cartidges and Ultra aqua UV sterilization unit (Spain)L
De-wateringWRW 5 × 200 mL table centrifuge (UK), plankton nets, Veolia drum filter (Norway), Algae Centrifuge—Solid Bowl (USA), Manual Purge 25 kg–ATD-25Kg h−1
Reactors2015–2020: 150, 250 L Plexi columns; 2015–2021: 6 m−3 stainless steel (DxH = 1.9 × 2.5 m); 2016–2021: 6 m−3 glass fiber reactor (2 × 2.4 m), 14 m−3 (2 × 3 m) stainless steel; 2018: 300 m−3 glass fiber (Figure 1)m−3
Table 3. Measured current (mixing rates m s−1) in the 300,000 L reactor. * Negative values indicate upward vertical currents while positive values indicate downward currents.
0.1 m Depth1.2 m Depth
Horizontally VerticallyVertically * HorizontallyVerticallyVertically *
Absolute Value−/+ Up/DownAbsolute Value−/+ Up/Down
Mean0.099050.055289−0.0330.95630.01714−0.00651
Min00−0.308100−0.2079
Max1.28020.31230.31231.0690.22720.2272
Table 4. Scalar irradiance in the 300 m3 reactor at different biomass concentrations and cell size, k calculated from n = 62.
Biomass
Specific k
Cell Size
(μm Diameter)
Biovolume
(cm3 L−1)
Cell Concentration
(No. L−1)
Scalar Irradiance μmol m−2 s−1
0 m0.6 m
6.542118,000,0001002.024
12.3241 90,000,0001000.062
3.1420.511,000,00010015.56
5.6240.540,000,0001003.47
Table 5. PCA factor loadings from variable correlation matrix for four first factors in analysis of data (matrix since 16 cases × 206 active cases). Bold shows significant (5 %) loadings.
VariableFactor 1Factor 2Factor 3Factor 4
Temperature−0.350603−0.065362−0.305317−0.702564
pH−0.191139−0.095166−0.421719−0.390890
CO20.2469880.0511890.019916−0.231155
Fl0.709964−0.308751−0.1422310.108382
Doubl./Day−0.055976−0.8809490.077926−0.222984
Oxygen0.4448220.257117−0.137969−0.131388
NO30.7409520.1247190.058572−0.321568
NO2−0.0174470.004179−0.0625300.330749
PO40.5027140.1150310.507148−0.279079
SiOH0.8080840.1035530.048914−0.161543
Cosine−0.1842880.0275980.711832−0.237633
Pyranometer−0.1321230.148798−0.348898−0.186659
Spherical−0.507825−0.0841300.481529−0.076914
Biovolume0.681223−0.197680−0.0734980.335251
Production0.207280−0.9241520.017919−0.017458
Total light0.4949590.1538900.022518−0.226947
Table 6. Operating results from cultivation in the 300,000 L reactor 2018–2021.
Mean+/−S.D.nUnit
CO2 uptake26.458.85-%
Uptake NO3 + NO2 in diatoms *110.54146.9117μmol cm3
Uptake PO4 in diatoms *20.1519.37127μmol cm3
Uptake SiO2 in diatoms *47.7067.4696μmol cm3
Light utilization efficiency21.6622.7184% (W vs. W)
Temperature in reactor6.645.07852°C
pH8.0890.41679
Biovolume with cells < 30 μm **0.1890.151152cm3
Biovolume with cells > 30 μm **0.6220.205102cm3
Production with cells < 30 μm **0.2190.327102cm3 L−1 Day−1
Production with cells > 30 μm **0.2600.139102cm3 L−1 Day−1
* Biomass (cm3 biovolume) specific uptake; ** Cultivations performed with approximately same reactor illuminations.
Table 7. Lipid content (%, average ± SD, n = 5) of the diatom cultivated with and without factory flue gas.
With flue gas9.9 ± 0.11
Without flue gas10.3 ± 0.73
Table 8. Fatty acid composition (%, average ± SD, n = 5) of the diatom cultivated with and without factory flue gas.
With Flue GasWithout Flue Gas
C14:09.6 ± 0.166.8 ± 0.29
C16:05.7 ± 0.016.4 ± 0.05
C16:1 n-78.4 ± 0.049.9 ± 0.06
C16:3n-413.9 ± 0.0612.7 ± 0.03
C18:00.3 ± 0.020.1 ± 0.13
C16:4n-115.6 ± 0.0621.6 ± 0.04
C18:2 n-60.3 ± 0.000.0 ± 0.00
C20:00.1 ± 0.130.3 ± 0.01
C18:4 n-39.4 ± 0.054.5 ± 0.01
C22:1 n-110.3 ± 0.010.0 ± 0.00
C20:5 n-332.6 ± 0.1932.8 ± 0.27
C22:6 n-33.7 ± 0.044.7 ± 0.06
∑SFA15.7 ± 0.1713.7 ± 0.33
∑MUFA8.6 ± 0.059.9 ± 0.06
∑PUFA75.7 ± 0.1776.4 ± 0.36
∑Omega-345.8 ± 0.2642.1 ± 0.33
Table 9. Amino acids, essential Amino acids (EAA), nonessential Amino Acids (NEAA), total amino acids (TAA) and total protein (mg g−1 DW, n = 2) of biomass cultivated with and without fume. %EAA = essential amino acids as % of total and CS = chemical score.
With FumeWithout Fume
EEA122.4110.4
Threonine15.2 ± 0.313.5 ± 0.0
Valine16.6 ± 0.214.5 ± 0.3
Methionine8.4 ± 0.37.4 ± 0.5
Isoleucine14.5 ± 0.312.8 ± 0.2
Leucine25.6 ± 0.723.7 ± 0.2
Phenylalanine16.8 ± 0.116.0 ± 0.4
Lysine19.1 ± 0.416.8 ± 0.5
Histidine 6.2 ± 0.55.7 ± 0.1
NEAA
* Aspartic acid32.3± 0.533.9 ± 0.2
Serine15.5 ± 0.013.9 ± 0.1
* Glutamic acid46.9 ± 0.544.1 ± 0.8
Proline 24.0 ± 0.619.7 ± 0.4
Glycine 18.7 ± 0.717.7 ± 1.3
Alanine38.8 ± 0.526.1 ± 0.4
Cysteine2.4 ± 0.22.3 ± 0.1
Tyrosine 12.4 ± 0.49.9 ± 0.1
Arginine21.8 ± 0.419.9 ± 1.5
P-Serine4.0 ± 0.02.4 ± 0.0
TAA339.2300.3
%EAA3637
Tot protein286.3 ± 4.6254.7 ± 4.5
CS>1.0>1.0
* Tryptophan is denatured during acid hydrolysis while glutamine and asparagine deaminate during acid hydrolysis and are therefore included in glutamate and aspartic acid.
Table 10. Concentrations (pg TE/g ww) for dioxins and furans (PCDD/PCDF), non-ortho PCBs (no-PCBs) and mono-ortho PCBs (mo-PCBs) and sum of all three groups (Total sum TE), fermented with and without fume (n = 2). For upper bound (UB), <LOD concentrations are included; and <LOD concentrations are set to zero in lower bound (LB).
pg TE/g wwWith Fume
UB Incl LOD
With Fume
LB Excl LOD
Without Fume
UB Incl LOD
Without Fume
LB Excl LOD
Sum PCDD/PCDF *0.0490.0250.0360.013
Sum no-PCB **0.0070.0070.0030.003
Sum mo-PCB ***0.00020.00018.9 × 10−55.3 × 10⁻⁵
Total sum TE0.0570.0330.0400.016
* Sum of PCDD/PCDF includes 2378-TCDD, 12378-PeCDD, 123478-HxCDD, 123678-HxCDD, 123789-HxCDD, 1234678-HpCDD and OCDD; 2378-TCDF, 12378-PeCDF, 23478-PeCDF, 123478-HxCDF, 123678-HxCDF, 123789-HxCDF, 234678-HxCDF, 1234678-HpCDF, 1234789-HpCD, OCDF. **/*** Sum DL-PCB includes PCB-77, -81, -126, -169, -105, -114, -118, -123, -156, -157, -167 and -189.
Table 11. Concentrations (ng g−1 ww) of ICES-6 PCBs, various pesticides and metals (ng g−1 dw) in the diatom fermented with and without fume (n = 2). Data for compounds with no detection in any samples are omitted from the table.
ng/g wwWith FumeWithout Fume
Sum ICES-6 PCB * 0.070.02
PeCB0.0120.047
HCB0.0260.041
α-HCH 0.0050.006
β-HCH 0.0030.002
γ-HCH 0.0100.007
op′-DDD0.001<0.001
pp-DDD0.003<0.001
PFUnDA 0.0080.016
mg/kg dwWith FumeWithout Fume
Mercury (Hg)0.0050.002
Lead (Pb) 1.320.16
Cadmium (Cd)0.020.01
Arsenic (As) 2.581.72
Selenium (Se)0.670.27
* Sum ICES—PCB6 includes PCB-28, -52, -101, -138, -153 and -180.
Table 12. Production, growth rates and volumes of selected photobioreactor types. Numbers in table are rounded and growth rates are in most of the instances computed from reported increases in biomass in these publications [117,118,119,120,121,122,123,124,125,126,127,128,129,130,131,132,133,134,135,136,137,138]. Values are (assumed) DW ones.
Reactor TypeProduction RangeMean
Production
Mean
Growth Rate
Mean Volume
Reactor
g L−1 day−1Doublings day−1L
Plate0.2–3.82.41.26500
Tubular0.05–2.7 1.20.62800
Column0.06–0.40.20.2550
Pond0.1–0.350.60.650,000
Other0.05–0.50.080.08100
Finnfjord *0.18–0.420.220.47300,000
* Values from 300 m3 reactor during selected cultivation periods in 2019–2021.
Publisher’s Note: MDPI stays neutral with regard to jurisdictional claims in published maps and institutional affiliations.

