Article

Modelling Nannochloropsis gaditana Growth in Reactors with Different Geometries, Determination of Kinetic Parameters and Biochemical Analysis in Response to Light Intensity

Dipartimento di Ingegneria, Università degli Studi di Palermo, Viale delle Scienze—Ed. 6, 90128 Palermo, Italy
*
Author to whom correspondence should be addressed.
Appl. Sci. 2022, 12(12), 5776; https://doi.org/10.3390/app12125776
Submission received: 16 May 2022 / Revised: 1 June 2022 / Accepted: 4 June 2022 / Published: 7 June 2022

Abstract

:
Microalgae are unicellular and photosynthetic microorganisms which grow thanks to inorganic salts, CO2 and light, and find applications in several fields thanks to their variety. The industrial application of microalgae has not often been fully exploited because of a lack of information about how microalgae respond to inputs and to different growth environments. In the present work a model able to predict the microalgae growth in reactors with different geometries was developed. We combined a Monod-like model for the specific growth rate with the Lambert-Beer law of homogeneous light distribution in thick photobioreactors. Kinetic parameters related to the cultivation of the microalga Nannochloropsis gaditana were obtained, for the first time through batch cultivation under different photon flux densities inside a quasi-isoactinic photobioreactor, in order to obtain a practically homogeneous light distribution. The maximum specific growth rate and saturation constant resulted, respectively as µmax = 0.0256 h−1 and Ik = 15.28 µE s−1m−2. These parameters were applied to the model to obtain data on microalgae growth in different geometries. Model simulation results are presented and discussed. Furthermore, biochemical analysis was performed on the biomass obtained at the end of each batch cultivation, grown both under different light intensities and in reactors with different configurations. Results indicated that lipid content increases with increasing average photon flux density. The fatty acid and carotenoids profiles markedly shift when the average light intensity varies: the PUFA content decreases and the SFA content increases when the average light intensity rises, and an accumulation of carotenoids at lower photon flux densities is observed. In conclusion, the model resulted in a useful tool, able to predict the growth of the microalga Nannochloropsis gaditana in reactors with different configurations.

1. Introduction

Microalgae are unicellular or pluricellular microscopic and photosynthetic microorganisms that may grow by employing solar energy in a more efficient way compared to land plants. They can be employed as a source of food, [1], in pharmaceuticals and cosmetics [2], in the bioremediation of wastewaters [3] and in general as a source of biomass.
Microalgae cultivation may occur outdoors in open ponds. Among these, raceway ponds are the most commonly employed for mass cultivation [4], as they are generally cheap (production costs for microalgal biomass in a raceway can be estimated at around 1.6–1.8 € kg−1 [5]), but have several disadvantages. In fact, in an outdoor cultivation facility, there is weak control of the operating parameters and risk of contamination, leading to poor mass production. Alternatively, microalgae can be grown indoors inside photobioreactors. Indoor photobioreactors are generally more expensive but ensure better control of growing conditions and, consequently, better productivity.
Several studies of the design and optimization of photobioreactors to maximize biomass productivity are available [6,7]. However, there are still several doubts about technical issues of concern and the economics of large scale microalgal cultivation. Most of the criticisms depend on the lack of reliable and reproducible parameters that strongly affect growth, productivity and, consequently, the industrial scale-up of the systems. Therefore, microalgae are usually not cultivated in their optimal conditions and this results in a gap between process operation and responses to the culture inputs, especially in an industrial environment in which productivity is largely lower than that which might be expected from lab experiments.
The light available to the cells is the main parameter in optimizing microalgal cultivation [8].
Several models describing microalgae response to light have been proposed in the literature, in some cases including investigation of mass transfer [9,10]. Béchet et al. [11] suggested classification into three categories according to how the photosynthetic productivity is computed. One of the problems is that, in order to have strict control of the kinetic parameters, one should avoid self-shading effects that cause a non-homogeneous light distribution inside the reactor.
To avoid this problem, a specific kind of reactor that allows a homogeneous light distribution inside should be employed to obtain the kinetic parameters. We refer to these kinds of reactors as quasi-isoactinic, meaning that the light distribution inside them is almost homogeneous [12]. When employing these reactors, it is fully possible to analyze the effect of a specific kind of illumination on a culture. This work proposes a Bechet type II photosynthetic model, able to predict the biomass productivity in reactors with different depths and geometries. In particular, a strain of Nannochloropsis gaditana, known for its lipid content, was employed for the experimental validation of the model. The kinetic parameters were obtained, for the first time, inside a “quasi-isoactinic” photobioreactor, in order to ensure an almost homogeneous light distribution. Then microalgae Nannochloropsis gaditana were grown in photobioreactors with three different geometries to obtain experimental data to be compared with the model prediction.
Model simulations in batch reactors are presented and discussed. Furthermore, biochemical analysis of proteins, carbohydrates, lipids, fatty acid characterization and carotenoids was performed on the biomass obtained through all the batch cultivations realized, and the results represent a complete characterization of Nannochloropsis gaditana grown under different average light intensities.

2. Mathematical Modelling

In microalgal research, several light models have been proposed that are able to describe the photosynthetic behavior of microalgae growing under different conditions. Béchet et al. [11] proposed classification into three types. Type I models are able to predict the rate of photosynthesis as a function of the incident or average light intensity, while type II models compute productivity as the sum of local productivities. Type III models consider, instead, the impacts of light gradients and of short light cycles. Furthermore, the distribution of light may be described in different ways, for example, through the employment of the Lambert Beer model, the two flux model or Hyperbolic Beer–Lambert law [13].
In this work a Bechet’s type II light model was used to describe microalgal growth in photobioreactors with different geometries enlightened from one-side and predict the growth in reactors with variable depths. The growth is related to the light distribution inside the reactor, which takes into account the light attenuation according to the Lambert-Beer model, widely used to describe the light attenuation pattern in algal culture broth, especially in the presence of low-cell densities [13]. When using this equation, the hypothesis is that the medium inside the reactor is isotropic and that there are no scattering phenomena, which is a good approximation of reality. Furthermore, if scattering is taken into account, even smaller deviations from uniformity are predicted, with respect to the limiting “zero reflectance” case we propose [12]. Considering that the cell concentrations experimentally obtained are below 2 g L−1, the use of the Lambert-Beer model was considered to be acceptable [13].
The Lambert-Beer law describes an exponential decay of light intensity from the external surface of the cultivation system, as described in the following equation [11]:
I = I 0   e k a X z
where I is the local light intensity of light, z is the distance of the external surface to the considered position in a flat geometry, I 0 is the intensity of the incident light, k a is the attenuation constant and X the cellular concentration.
The attenuation constant k a can be estimated as the ratio between the area of the cell capturing light (Acapt) and the mass of the cell (mcell) and can be simply estimated as:
k a = 3 2 d c a p t 2 ρ c e l l d c e l l 3
where ρ c e l l and d c e l l are respectively the density and the diameter of a microalgal cell and d c a p t is the diameter of the transversal section of light capture. According to the proposed model, the medium is ideally mixed, the biomass concentration is uniform inside the reactor and all the nutrients are in excess.
The growth rate µ is then expressed according to a Monod-like model [11] considering light as a substrate for algal photosynthesis, as expressed by the following expression:
μ = μ m a x   I I K + I
where μ is the specific growth rate, μ m a x is the maximum specific growth rate and I K   is the light saturation constant. It is worth noting that the range of light intensities used in this work is far away from photo-inhibition phenomena [14], so that Monod’s law can be applied without any limitation.

2.1. Flat-Plate Geometry

The model was first developed to describe photobioreactors with flat-plate geometry and different reactor depths, enlightened from one side only and covered with a black panel on the opposite side, as depicted in Figure 1.
The experiments were conducted in batch mode. This means that illumination inside the PBR decreased over time as biomass concentration increased. The mass balance on the microalgal biomass inside the flat-plate reactor with volume V , concentration X ( t ) , enlightened surface A and depth L , in the transitory period can be expressed as:
V d X d t = 0 L r X A d z
where r X is the net biomass generation rate on volume unit. By expressing the growth rate µ by means of a Monod-like equation (Equation (3)), r X   may be given by the following expression:
r X = ( μ m a x I I + I K k d ) X
where kd is the constant of cellular death. By substituting for I the Lambert-Beer law (Equation (1)) and by combining the Equation (4) with Equation (5) one obtains:
V d X d t = 0 L ( μ m a x I 0 e k a X z I 0 e k a X z + I K k d ) X A d z
And by integrating and dividing by V , one obtains:
d X d t = μ m a x X μ m a x k a L ln ( I K I 0 e k a X L + 1 ) + μ m a x k a L ln ( I K I 0 + 1 ) k d X
The obtained differential equation can be numerically integrated to return the variation of X in time.

2.2. Annular Geometry

The model was then modified to model an annular column photobioreactor [15,16] enlightened by a central illumination lamp and placed in a chamber closed with a black cloth as depicted in Figure 2.
In this case, the mass balance during the transitory written for this geometry is more complex than that described in the previous paragraph, since it considers two contributions to light intensity attenuation:
(1) the fact that the cell concentration increases with time, with consequent mutual shading effects;
(2) the fact that, in the annular geometry, even in the absence of self-shading effects (X = 0), the light intensity is inversely proportional to the radius, as the transversal incident surface increases when radius increases. In this case the expression for the Lambert-Beer law can be written as:
I ( r ) = I 0 R 0 r e k a X ( r R 0 )
where R0 is the internal radius of the annular section and r is the generic radius in the annular section. Based on these considerations, by substituting Equation (8) in Equation (5), and carrying out the mass balance on the microalgal biomass within an annular section with internal radius R0 and external radius R1, the result is:
d X d t = 1 V R 0 R 1 ( μ m a x I 0 R 0 r e k a X ( r R 0 ) I 0 R 0 r e k a X ( r R 0 ) + I k k d ) X 2 π h r d r
where h is the height of the reactor.
The resolution of this integral is neither immediate nor traceable to a remarkable integral. Therefore, a numerical method of solving it was used, i.e., the application of Composite Simpson’s 1/3 rule.

3. Materials and Methods

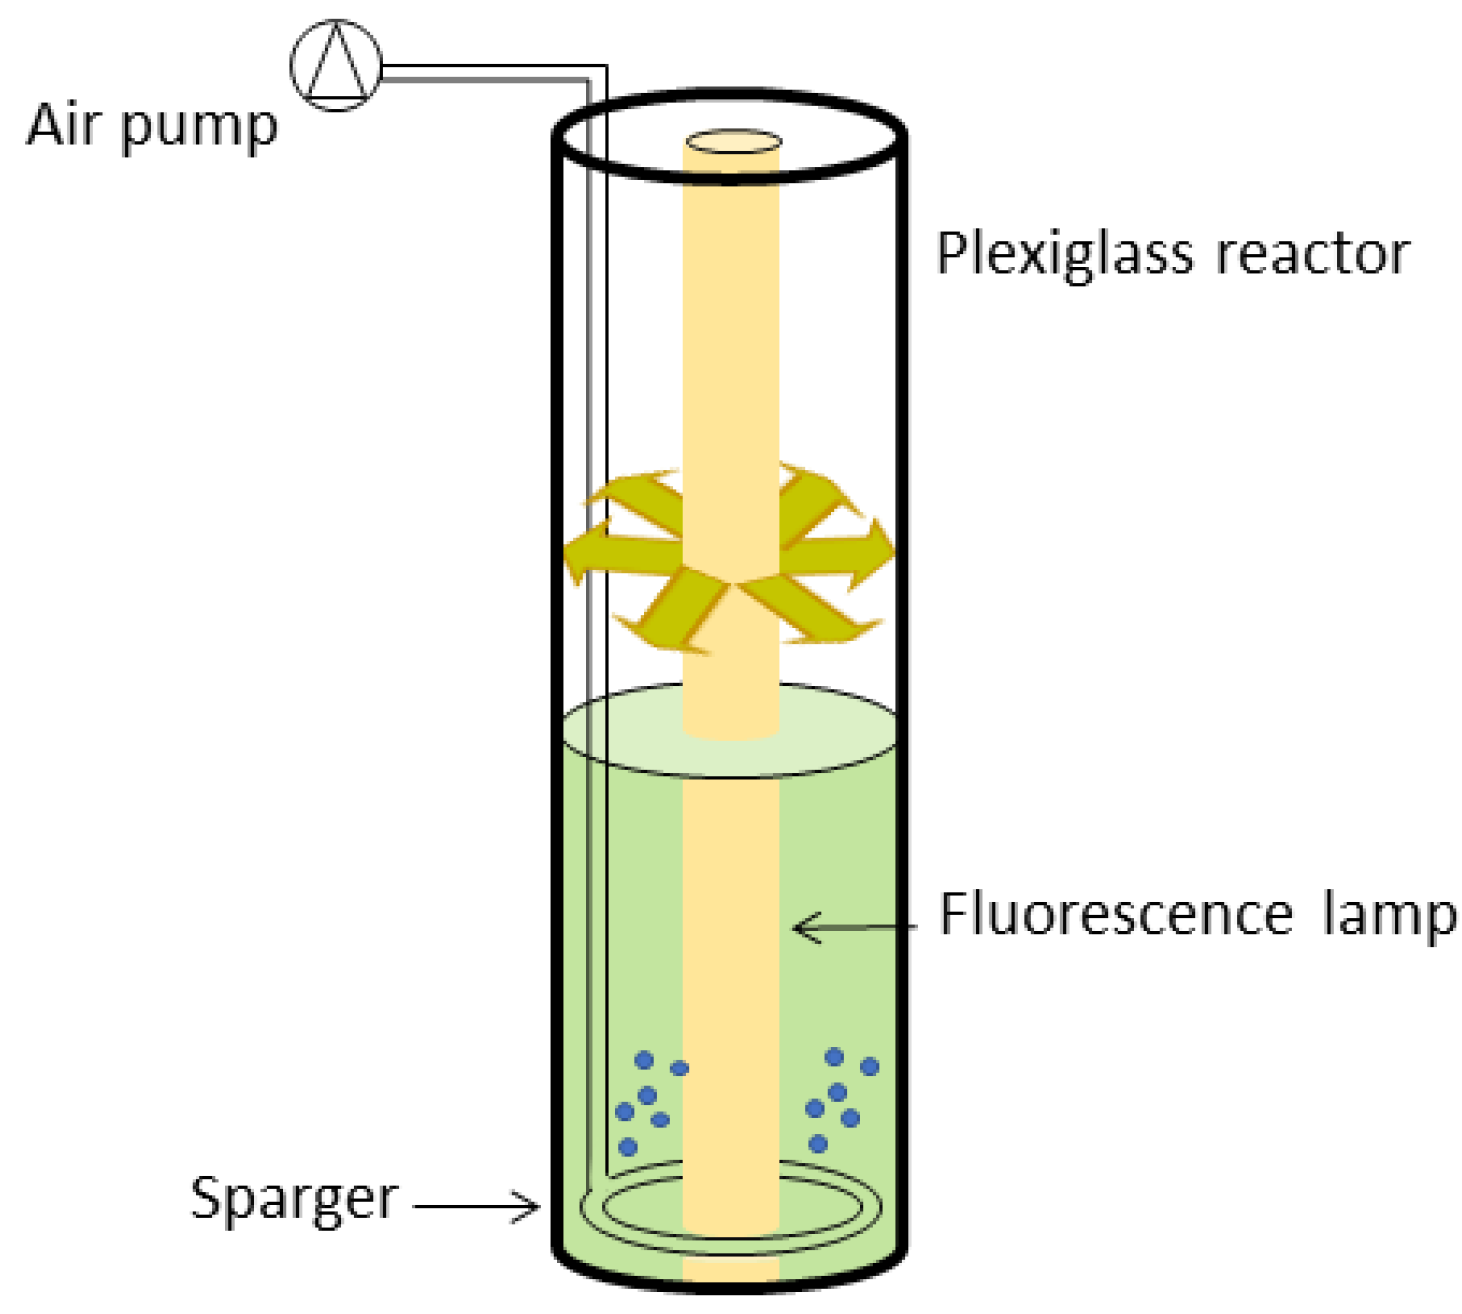
3.1. Quasi-Isoactinic Photobioreactor

To obtain the kinetic parameters, μ m a x and Ik, of the species Nannochloropsis gaditana a quasi-isoactinic flat-plate photobioreactor, i.e., a reactor in which the local volumetric rate of photon absorption (LVRPA) can be considered uniform to a satisfactory extent, was employed [12]. This can be obtained thanks to a light superposition effect and to the very small thickness of the reactor. In this way, the specific growth rate µ will be almost constant in each part of the photobioreactor and may be expressed by the simple equation:
μ = μ m a x   I 0 I K + I 0
where I0 is the incident light intensity, almost constant inside the quasi-isoactinic photobioreactor, and μ m a x and Ik are the kinetic parameters.
The quasi-isoactinic photobioreactor has a height of 200 mm, a length of 160 mm, a depth of 4 mm and a volume of 130 mL. The reactor is enlightened from two sides by two identical home-made LED panels with adjustable light intensity. Each panel is realized with LED strips (20 W/m, 24 V, IP20, Elcart), regulated through an Arduino controller. The reactor is insufflated through a micro-pored sparger by an air pump (AP 98-02, Jeneca, Huanggang, China) with a microfiltered (0.2 µm) air flow of 0.7 L min−1. The system is placed inside an incubator (FTD 100, ISCO, Milan, Italy) to regulate the temperature at 25 °C.
In this way, an almost perfect light distribution is obtained, thanks to a superposition effect and to the very small thickness of the reactor. This is the most suitable way to assess the effects of a light feature to microalgal cultures. To the best of the authors’ knowledge, this is the first time that the kinetic parameters (μmax and Ik) of Nannochloropsis gaditana are obtained in a quasi-isoactinic reactor.

3.2. Flat-Plate Photobioreactors

In order to verify the goodness of the model in response to different reactor depths, another two glass flat-plate photobioreactors were employed, with a height of 105 mm, a length of 190 mm and two different depths: 15 mm with a volume of 300 mL, and 30 mm with a volume of 600 mL. The reactors are enlightened from one side only, by a single LED panel with adjustable light intensity. A black panel was put on the other side to avoid light reflection phenomena. In this case, the reactor is also insufflated through a micro-pored sparger, placed along the reactor bottom, by an air pump (AP 98-02, Jeneca, Huanggang, China) with a microfiltered (0.2 µm) air flow of 0.7 L min−1 and is placed inside an incubator (FTD 100, ISCO, Milan, Italy) to maintain a fixed temperature of 25 °C. A scheme of the system is shown in Figure 1. During the cultivation inside flat photobioreactors, the cultures were periodically mixed in order to further optimize the gas-liquid mass transfer.

3.3. Annular Column Photobioreactor

Annular column photobioreactors (AC-PBR) are widely used for microalgae growth in aquacultures thanks to their high light use efficiency [15,16]. The annular photobioreactor employed for the cultivation of Nannochloropsis gaditana consisted of two cylinders arranged annularly made of transparent plexiglass, with a height of 425 mm, external diameter of 125 mm, internal diameter of 54 mm and an employed volume of about 4 L. The annular interspace (photo-stage) for microalgae culturing was 35.5 mm. The central illumination ‘finger’ was placed in the center, inside the inner cylinder. This was made of a fluorescence lamp (Neon Tube T8 G13 15 W 6500 K, Duralamp 1586T) powered by an electronic ballast (Tronic). The light intensity supplied by the lamp is fixed at 210 µE s−1m−2. The annular interspace was insufflated through a micro-pored sparger by an air pump (AP 98-02, Jeneca, Huanggang, China) with a microfiltered (0.2 µm) air flow of 0.7 L min−1. The reactor was placed on a lab bench, with controlled ambient temperature (25 °C) and covered externally by a black cloth to be sure that the only light source was the internal led lamp. The entire system is represented in Figure 2.

3.4. Algal Growth

Microalga Nannochloropsis gaditana (CCAP 849/5) was obtained from the Scottish Association for Marine Science. Its cultivation occurred via a modified F/2 [17] made in artificial seawater (6.3 mM KCl, 2.0 mM NaHCO3, 7.1 mM KBr, 0.36 mM H3BO3, 0.024 M Na2SO4, 9 mM CaCl2·2H2O, 0.046 M MgCl2·6H2O, 0.35 M NaCl) with the following composition: 3.5 mM NaNO3, 0.036 mM NaH2PO4·H2O, 0.12 μM FeCl3·6H2O, 0.12 μM Na2EDTA, 0.04 μM CuSO4·5H2O, 0.076 μM ZnSO4·7H2O, 0.042 μM CoCl2·6H2O, 0.91 μM MnCl2·4H2O, 0.025 μM Na2MoO4·2H2O. Before each cultivation, the culture medium, all the tubes and the filters were autoclave sterilized while the reactors were sterilized in an oven (TIPE) at 170 °C for 1 h. Cellular concentration was monitored daily by reading the absorbance at 750 nm (Agilent Cary 60 UV-Vis) inside 1.5 mL cuvettes and the following calibration curve was experimentally obtained from 16 data points with concentrations between 0.05 g L−1 and 1 g L−1:
X [ g   L 1 ] = 0.2198 × a b s 750  
Light intensity was measured by a photometer (HD 9021, Delta OHM, Padua, Italy) with a photosynthetic active radiation (PAR) probe (LP 9021 PAR, Delta OHM, Padua, Italy).
In order to obtain the kinetic parameters of the Monod equation, μmax and IK, batch cultivations were made inside the quasi-isoactinic flat photobioreactor for 10 days at a fixed temperature (25 °C) and incident light intensities I0 of 20, 50, 100, 140, 210, 300 and 450 µE s−1m−2.
Model results were then compared with experimental growth curves obtained for 13 days in the annular column PBR and in the two flat-plate PBRs, at an incident light intensity I0 = 210 µE s−1m−2. The other culture conditions (temperature and air flow) were the same as those in the cultivation for the kinetic parameters.

3.5. Harvesting of Microalgal Biomass

After growth, the cell suspension was centrifuged (3600 rpm, 10 min, NEYA 10R) and the biomass frozen in liquid nitrogen and freeze-dried for 48 h in a bench lyophilizator (FreeZone 2.5 L, LABCONCO, Kansas City, MO, USA). The biomass was then stored at −20 °C for further analysis.

3.6. Extraction and Analysis of Fatty Acids

About 20 mg of lyophilized microalgae biomass was weighed in a glass tube and about 7 mg of glass beads were added. Then 5 mL of chloroform/methanol (2:1, v/v) and 1 mL of NaCl 1% were added and the mixture was vigorously mixed with a laboratory vortex and subsequently centrifuged until the formation of two phases. The lower phase (chloroform phase) was transferred in a pre-weighted tube and the solvent was evaporated under nitrogen stream. After complete solvent evaporation, total lipids were determined gravimetrically and subsequently trans-esterified by adding 1 mL of sodium methoxide (1 g NaOH in 100 mL MeOH) and 1 mL of hexane, and kept at 50 °C for one hour. Then 1 µL of the upper phase was analyzed by gas-chromatography using a GC 7890B System (Sigma-Aldrich, St. Louis, MO, USA) equipped with a FID detector and a capillary column Omegawax 250 (Sigma-Aldrich, St. Louis, MO, USA). Initial temperature was 50 °C, increasing to 220 °C as working temperature. Total analytic time was 79.5 min and argon was used as carrier. The quantification of lipids was performed by comparing sample chromatograms with the standard. Supelco 37-Component FAME Mix (Sigma-Aldrich, St. Louis, MO, USA) was used as standard. Measurements were carried out in duplicate and the average value was retained.

3.7. Total Carbohydrates

Total carbohydrate content was determined according to Trevelyan et al. [18]. Briefly, 10 mg of freeze-dried biomass were suspended in 6 mL HCl 2 mol L−1 and hydrolyzed in a water bath for 1 h at 100 °C. Subsequently, 4 mL of a fresh anthrone solution (Sigma-Aldrich, 2 mg mL−1 in 95–97% H2SO4) were added to 1 mL of sample extract. The absorbance of each sample was read at 620 nm (Cary 60 Uv-vis, Agilent technologies, Santa Clara, CA, USA). Aliquots of different glucose concentrations (0.02–0.1 mg L−1) were prepared and processed in the same way as the microalgal extracts, to obtain a calibration curve. Measurements were carried out in triplicate and the average value was retained.

3.8. Total Proteins

About 50 mg of the sample was subjected to an elemental analysis of the biomass for carbon (C), hydrogen (H) and nitrogen (N), conducted (TruSpec, LECO) to assess the protein contents by multiplying the nitrogen content in the biomass (%N) by 4.78. Measurements were carried out in triplicate and the average value was retained.

3.9. Carotenoids

About 7 mg of biomass were weighed together with 0.7 g of mixed sized glass. Two drops of water were added to make the biomass wet, together with 3 mL of methanol. The contents of the tubes were mixed using a benchtop vortex and centrifuged for 10 min. Once the separation was completed, the upper phase was transferred to an aluminum wrapped tube. The extraction was repeated by adding another 2 mL to the biomass. The solutions were filtered, diluted with methanol when necessary and analysed via HPLC and spectrophotometer. All analyses were carried out under dimmed light.
The content of total carotenoids was assessed by recording a spectrum from 400 to 700 nm by means of a Cary 60 UV-Vis spectrophotometer (Cary 60 Uv-vis, Agilent technologies, Santa Clara, CA, USA). Total carotenoids were determined according to the method described by Lichtenthaler and Wellburn [19] by applying the OD measurements at 666 and 470 nm (A666, A470) from the methanol extracts to Equation (12):
Total   carotenoids   = ( 1000 × abs 470 44.76 × abs 666 ) /   221  
The content of chlorophyll a, lutein and beta-carotene was assessed through HPLC Agilent 1220 Infinity LC, equipped with a Diode Array Detector (DAD) and column temperature set at 20 °C. The separation of the compounds was carried out using a Synergi HYDRO-RP C18 column (4 μm, 250 × 4.6 mm) and a mobile phase consisting of acetonitrile:water solution (9:1; v/v) as solvent A and ethyl acetate as solvent B. A constant flow rate of 1 mL/min was used. The analysis time was set at 35 min and the following program was used: (i) 0–16 min, 0–60% B; (ii) 16–30 min, 60% B; (iii) 30–32 min 100% B and (iv) 32–35 min 100%. The sample injection volume was 100 μL. The chromatograms were recorded at 450 nm. Quantifications of chlorophyll a, lutein and β-carotene were performed through calibration curves of pigment standards (Sigma-Aldrich).

4. Results and Discussion

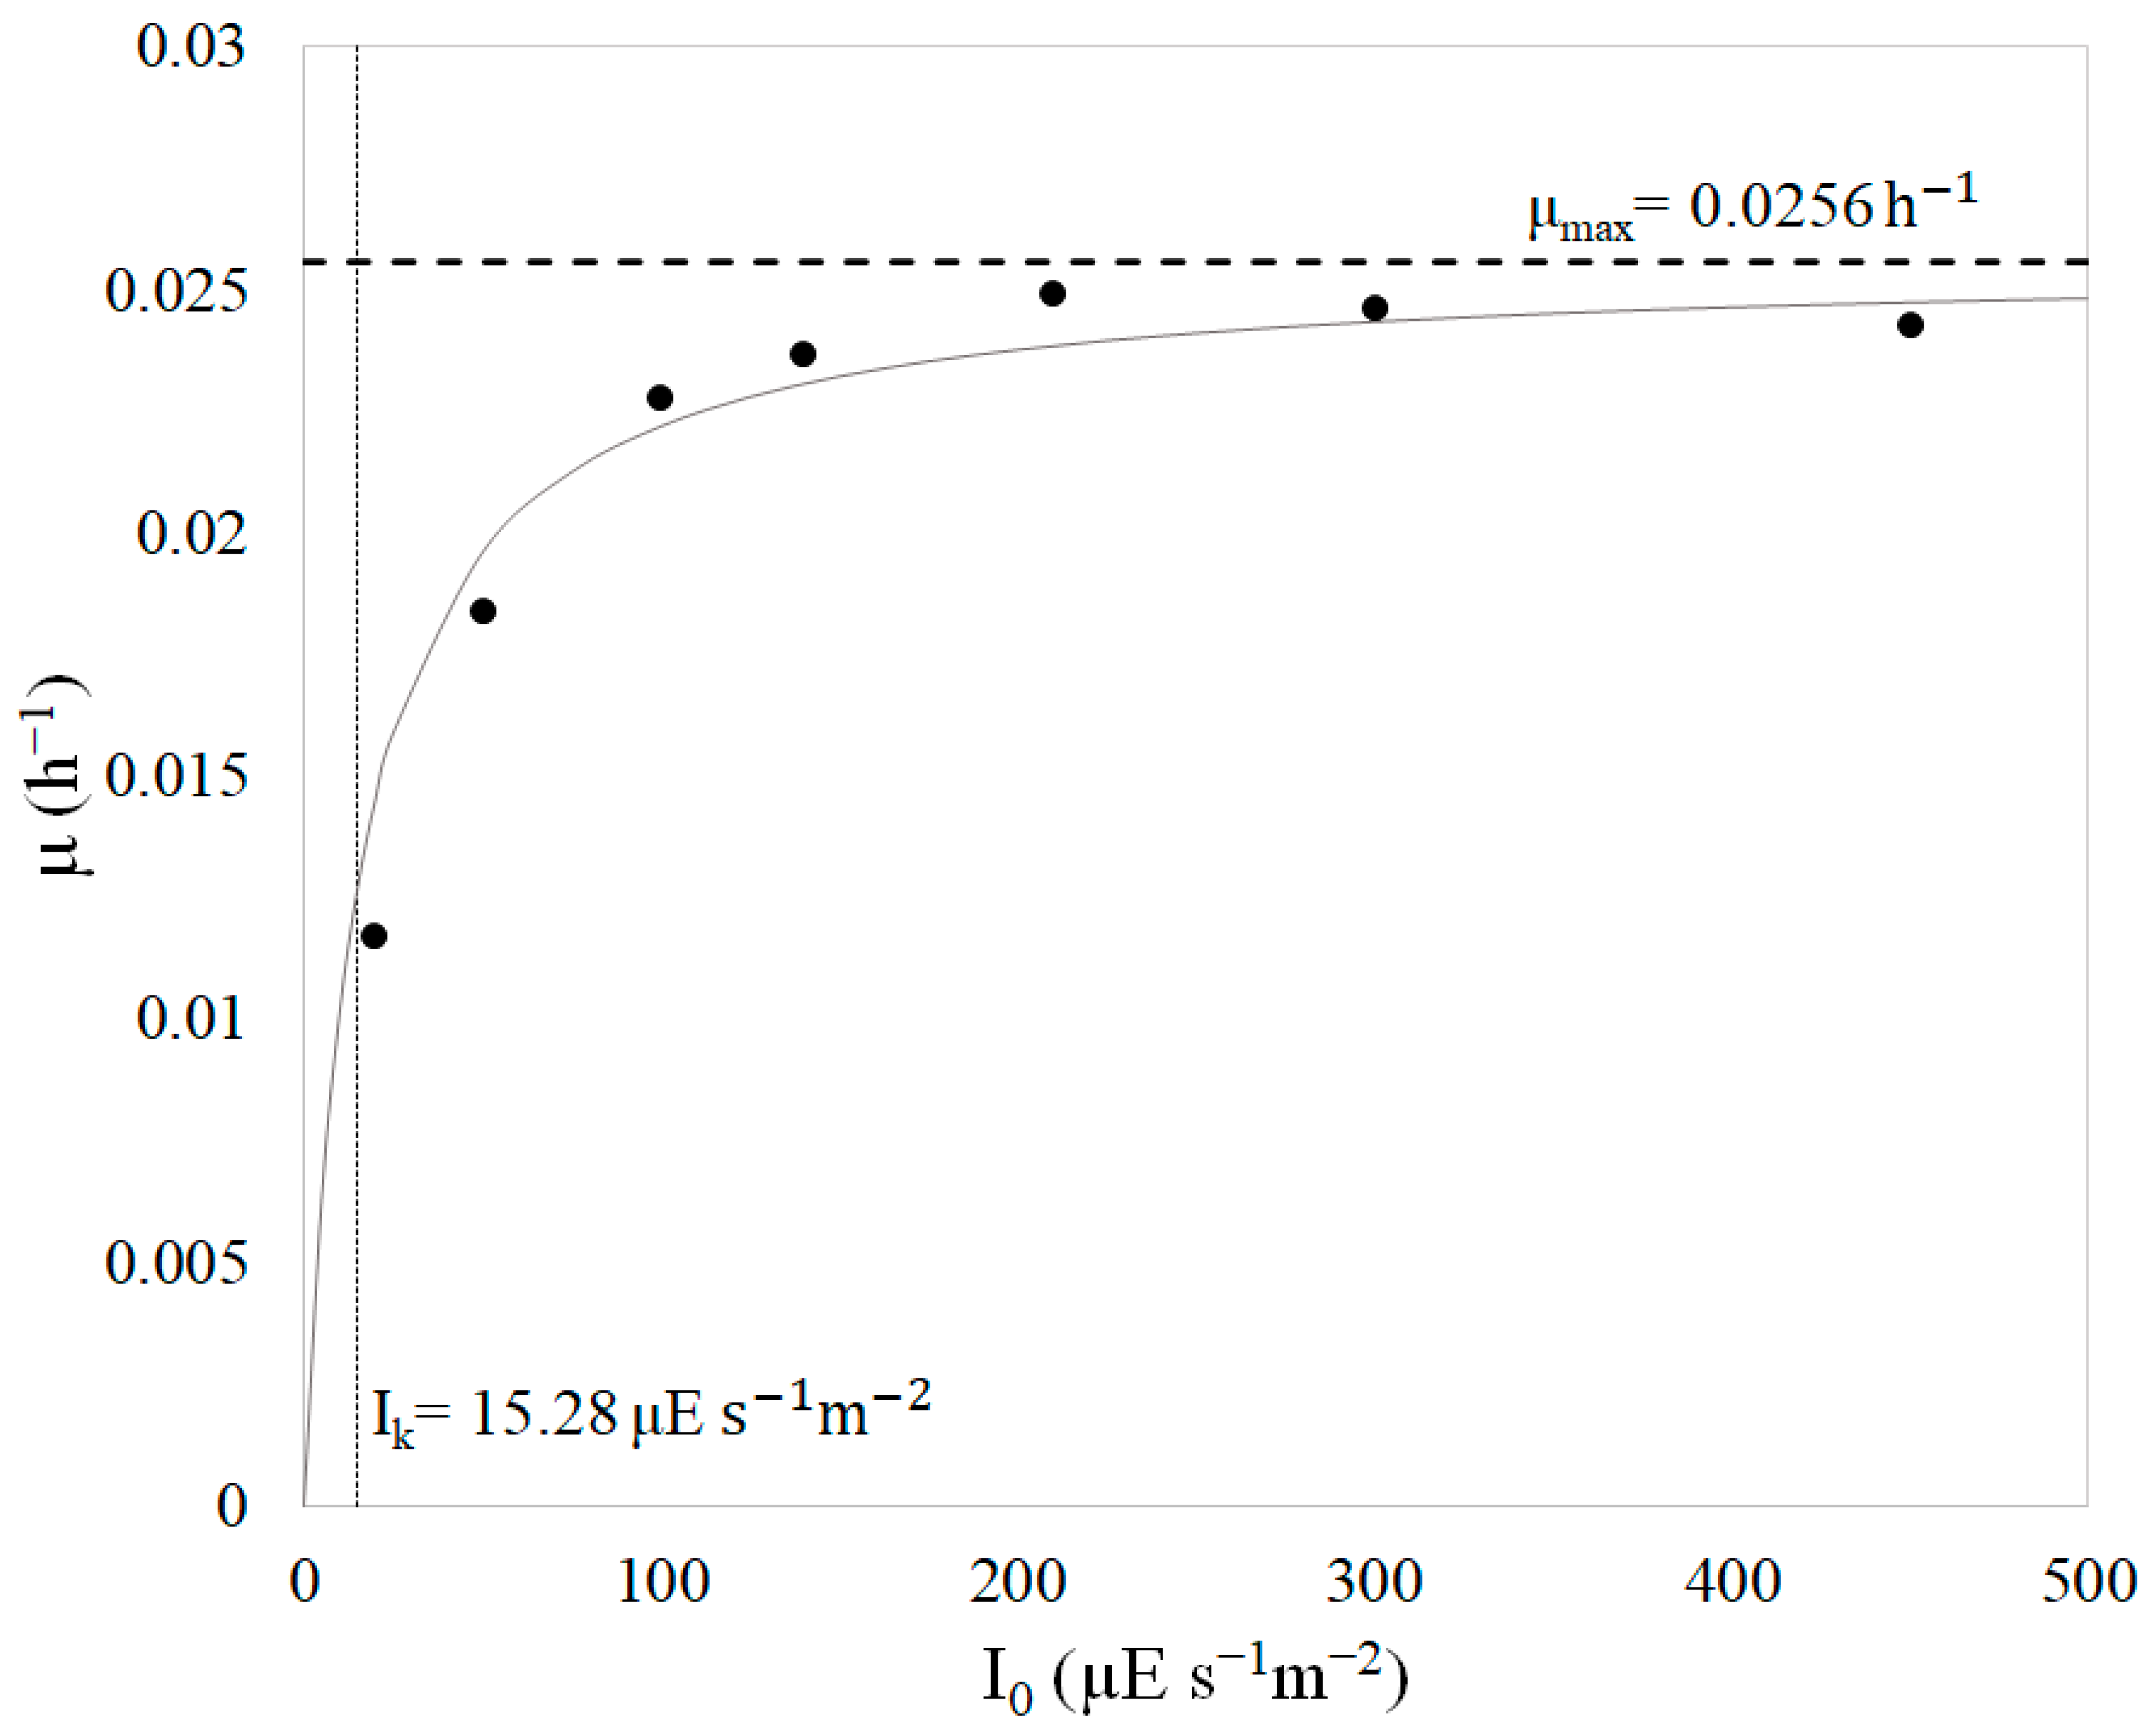
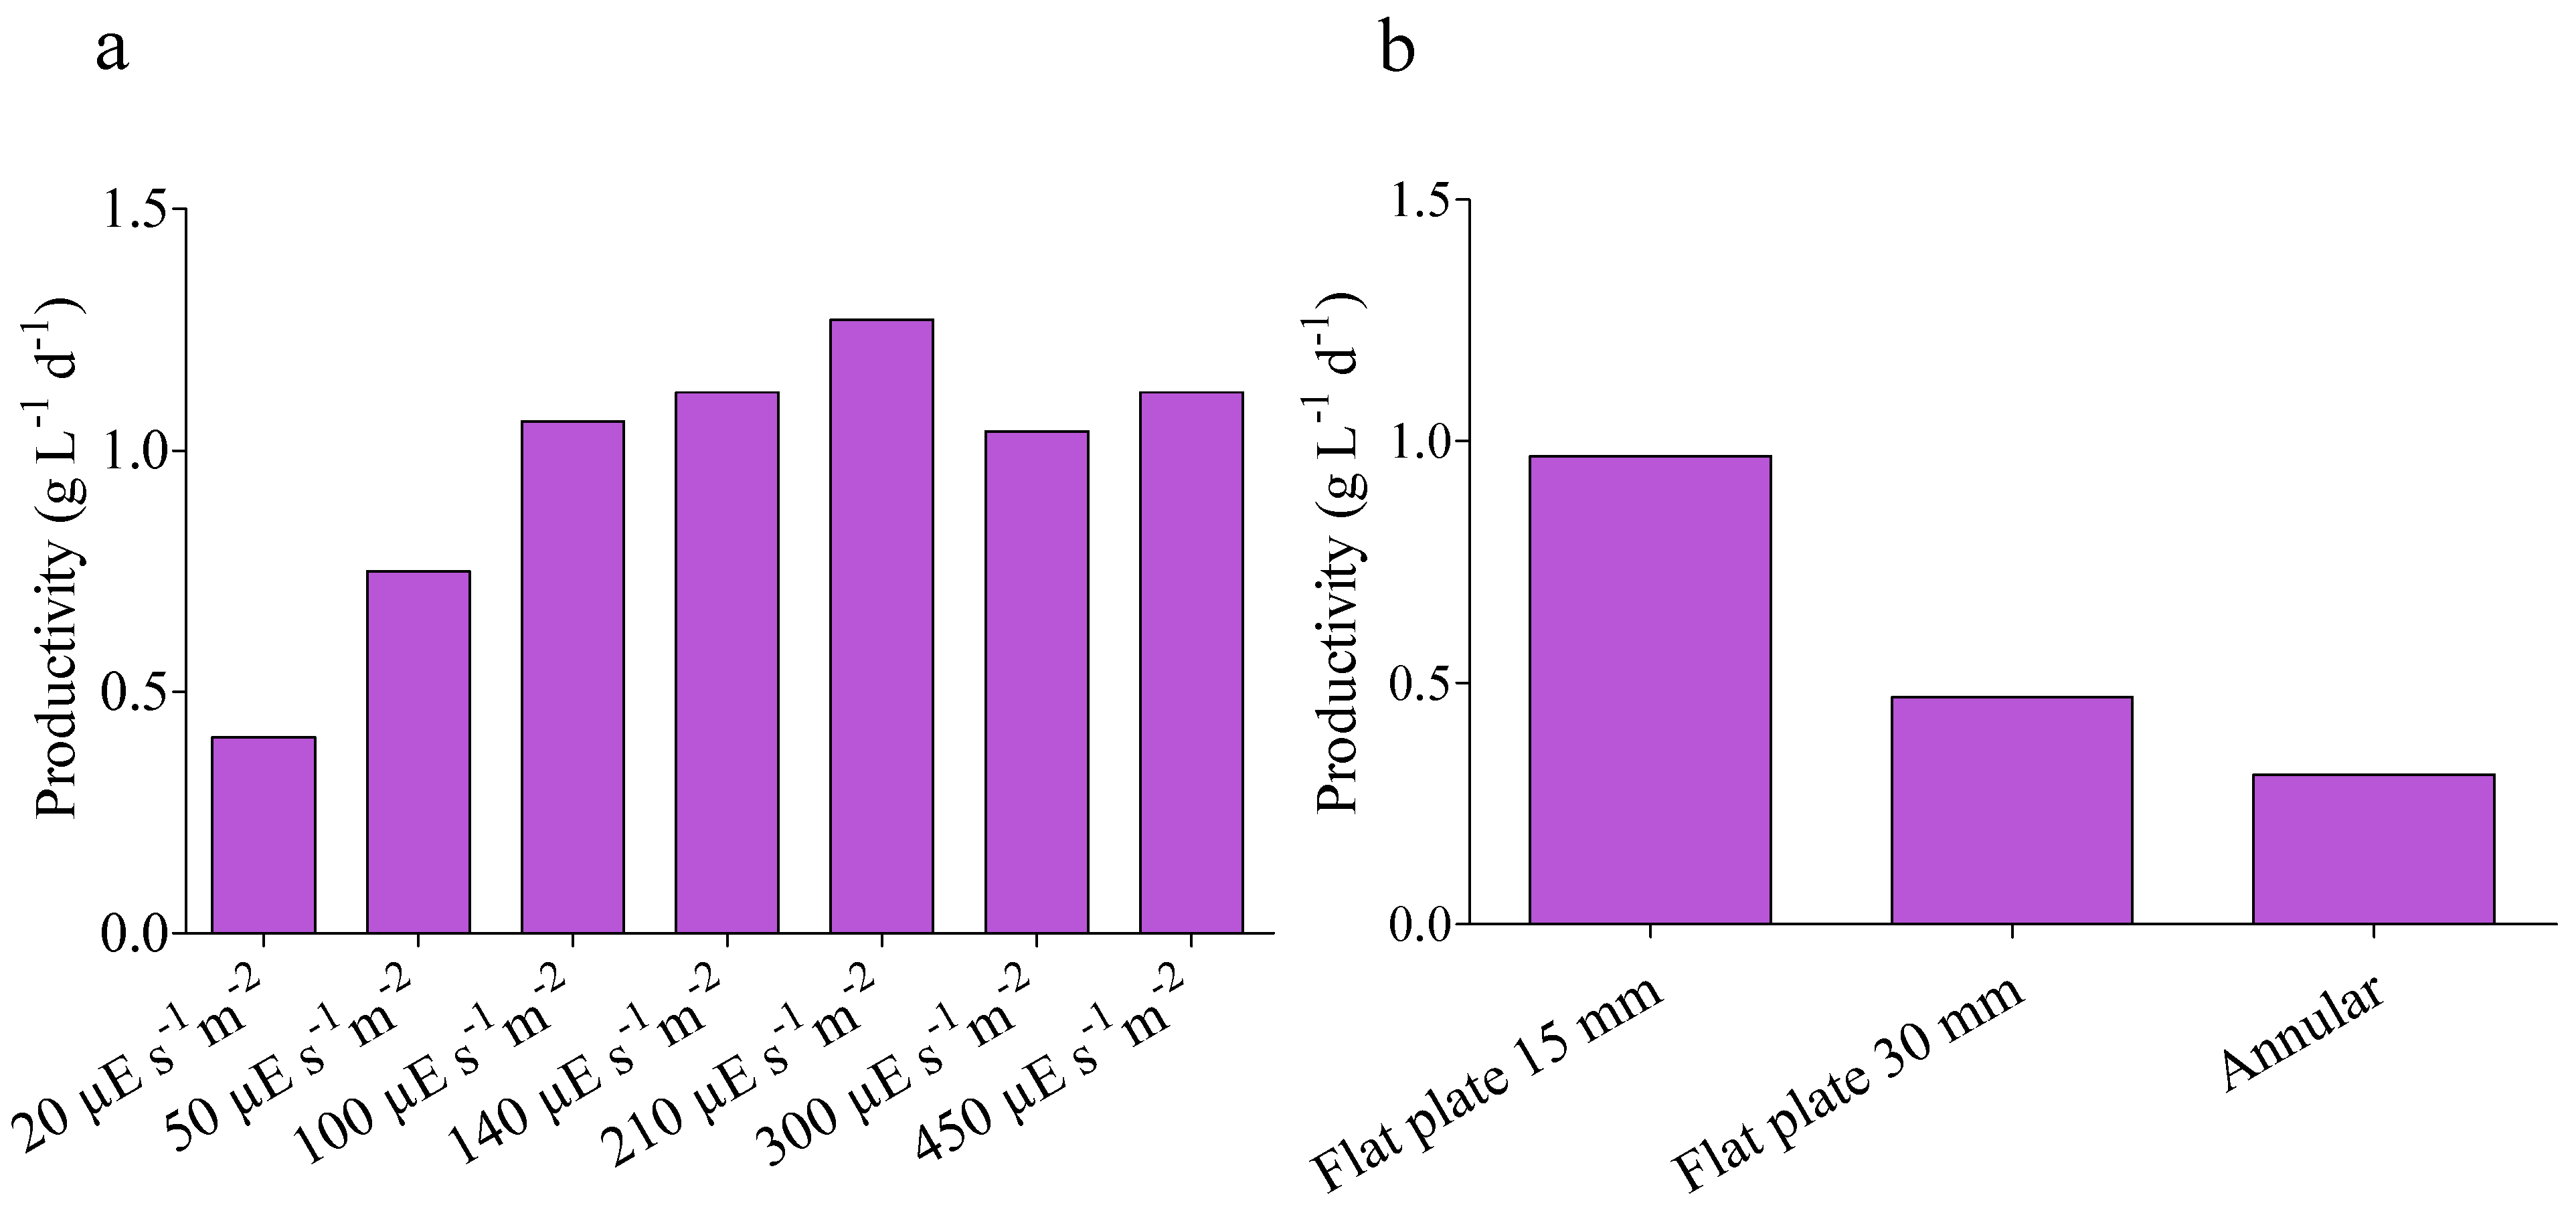
4.1. Kinetic Parameters

In order to obtain the kinetic parameters of the Monod equation, batch cultivations were carried out inside the quasi-isoactinic photobioreactor for 10 days at a fixed temperature (25 °C) and incident light intensities of 20, 50, 100, 140, 210, 300 and 450 µE s−1m−2. The growth of microalga Nannochloropsis gaditana at 25 °C and at different light intensities is shown in Figure 3.
As can be seen, the growth is well related to the light intensity: the slowest growth is observed under I = 20 µE s−1m−2 and it gradually increases with increasing light intensity. The best growth performance is shown by cultures grown between I = 300 µE s−1m−2 and I = 450 µE s−1m−2. There is no, in any case, very high difference relatively to growth performance from I = 100 µE s−1m−2 to I = 450 µE s−1m−2, while between I = 50 µE s−1m−2 and I = 100 µE s−1m−2 there is a distinct difference in accordance to that predicted by the Monod equation [20,21].
In a batch photobioreactor, during the exponential growth phase, the specific growth rate μ can be expressed as:
μ = ln X ln X 0 t t 0
where X 0 is the biomass concentration at time t 0   and X is the biomass concentration at time t . By employing a linear regression from the data in the exponential phases of Figure 3, the specific growth rates under each light intensity were obtained and reported in Table 1, together with the values of R2 and of the relevant I0/µ.
The observed growth rates are in the same range as that previously found for the same strain by other authors [22].
To obtain the kinetic parameters, μ m a x and Ik, Equation (10) can be rewritten according to Langmuir [20] as:
I 0 μ = 1 μ m a x I 0 + I K μ m a x
Therefore, a Langmuir plot of I 0 / μ versus   I 0 should give a straight line with slope 1 / μ m a x and intercept I K / μ m a x as reported in Figure 4. From the intercept and the slope of the linear regression of Figure 4, the kinetic parameters μ m a x = 0.0256   h 1 ( 0.61   day 1 ) and I K = 15.28   μ E   s 1 m 2 were obtained.
By using these kinetic parameters, the specific growth rate μ as a function of incident light I0 can be plotted, as reported in Figure 5, for the quasi-isoactinic photobioreactor. As can be seen, the typical Monod curve trend may be easily observed, and the saturation constant (Ik) corresponds to the value of I at which the growth rate is half of the maximal (μ = 0.5·μmax).
It is worth noting that the calculated maximum growth rate μ m a x (0.61 day−1) is comparable to typical Nannochloropsis growth rates found by other researchers [23,24]. Polishchuk et al. found that Nannochloropsis oculata grown in a saline medium has a maximum growth rate of 0.365 day−1 [23], while Huesemann et al. found that Nannochloropsis salina has a maximum specific growth rate of about 1.0 day−1 when cultivated at 26 °C under a photon flux density of 250 μ E   s 1 m 2 [24]. In the literature, the only work showing the specific growth rate (μ) in the exponential phase as a function of the mean integral photon flux density in cultures of Nannochloropsis gaditana reports a maximum growth rate μ m a x of about 0.0370 h−1 (about 0.89 day−1) and a saturation constant Ik of 43 ± 6 µE s−1m−2 [14]. The small differences in the values found by these authors may be due to different growth conditions, experimental set-up and light distribution inside the reactor.

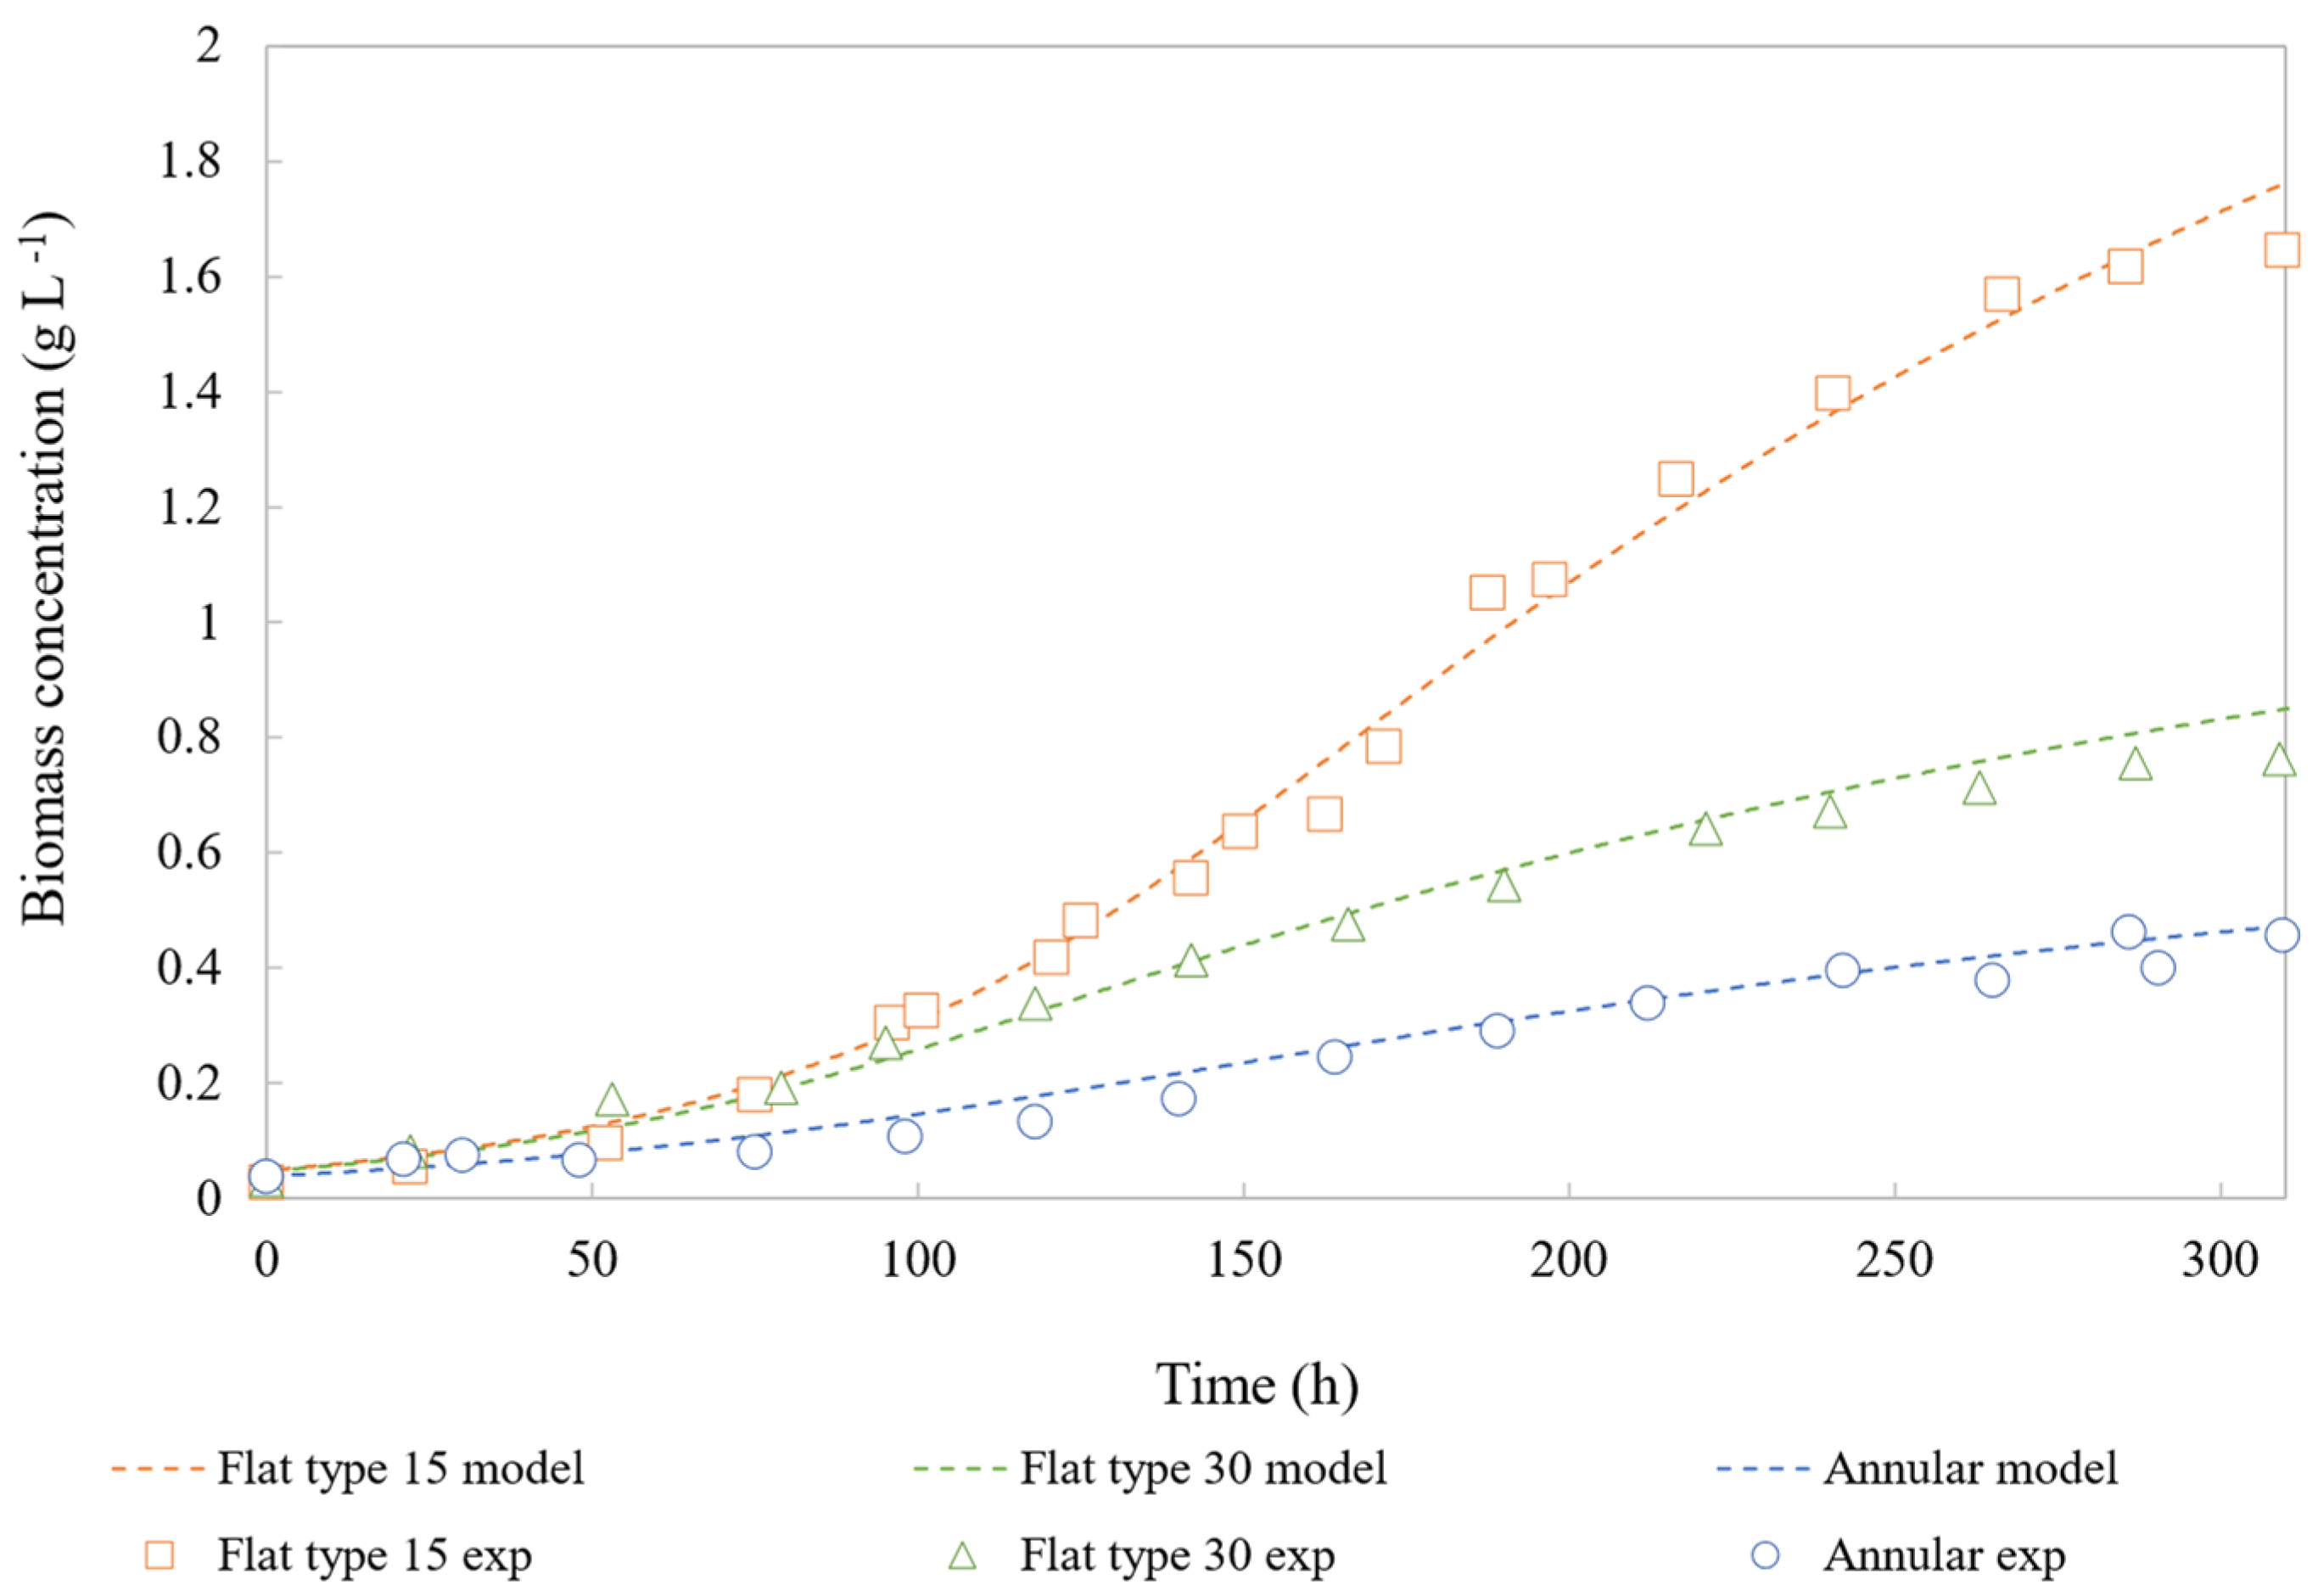
4.2. Model Validation

The equations shown in the “Mathematical modelling” section were implemented in MatLab® for the “Flat-plate geometry model” and the “Annular section geometry model”. The kinetic parameters μmax and Ik were integrated in both “Flat-plate geometry model” and the “Annular section geometry model”, while the adjustable parameters k d and k a were instead obtained by fitting model results with experimental concentration data. These cultures were conducted under a photon flux density of 210 µE s−1m−2 at 25 °C. The data and parameters employed and obtained from the modelling are shown in Table 2.
The two adjustable parameters were first changed in the flat geometry model, obtaining the best fit for both reactors’ thickness with kd = 0.0046 h−1 and ka = 0.38 m2 g−1. When using these two parameters in the annular geometry model, the best fit is obtained with the same value of kd = 0.0046 h−1, and this is sound as the microalgae strain did not change, while the value of ka had to be set at 0.20 m2 g−1, meaning that, in the case of the annular reactor, the light attenuation factor is a little smaller than in the flat geometry. Considering that the cellular size (cellular diameter) does not significantly vary in the three different cultivations (data not shown), this variation may be due to the cells creating agglomerates differently in the three cultivations. In fact, we observed that the cells in the annular reactor showed bigger agglomerates than in the other two cultivations. A bigger agglomerate reduces the transversal section of light capture (because some cells are not exposed to the light) and therefore reduces the attenuation constant ka. In Figure 6 the growth curves obtained from the model are compared with the relevant experimental data.
As can be seen, the modelled growth curves show a good fit with the experimental data, meaning that the model can predict the growth in flat-plate reactors of different depths and in an annular geometry, once the attenuation constant parameter ka has been adjusted.
The data obtained through this model may be of interest in order to create a link between the metabolic response of Nannochloropsis gaditana and the action of inputs such as the incident light intensity, the reactor thickness and the geometry. Furthermore, this model may be easily implemented on other microalgae, after experimentally measuring the kinetic parameters.

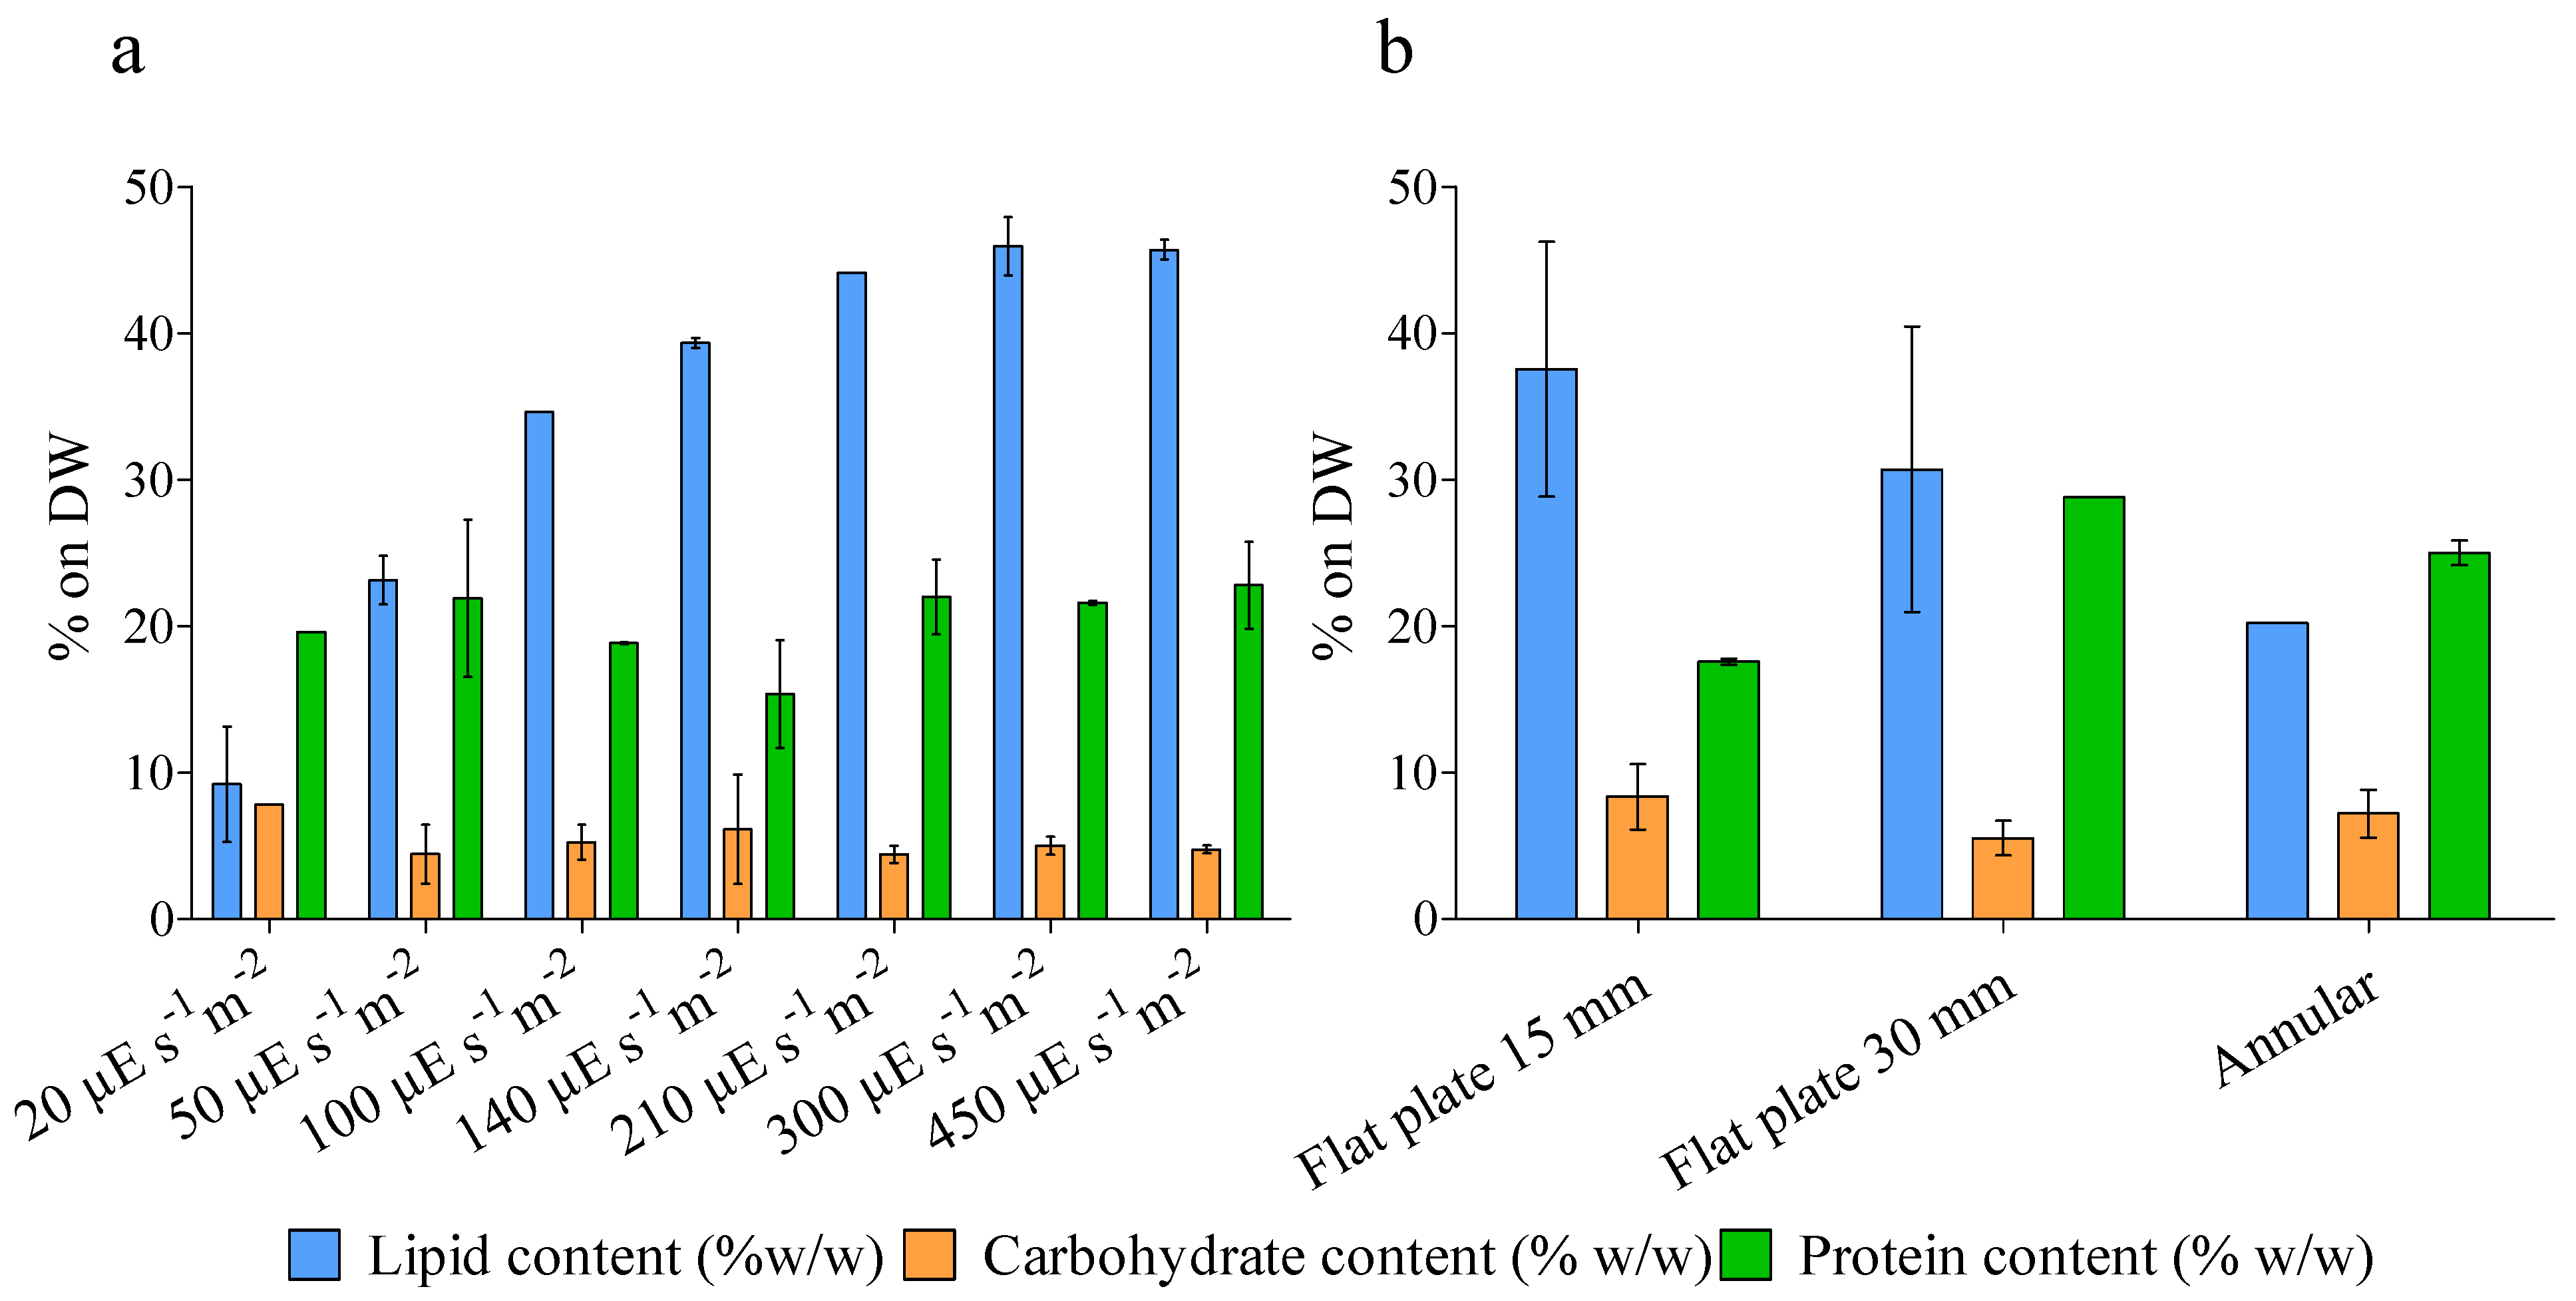
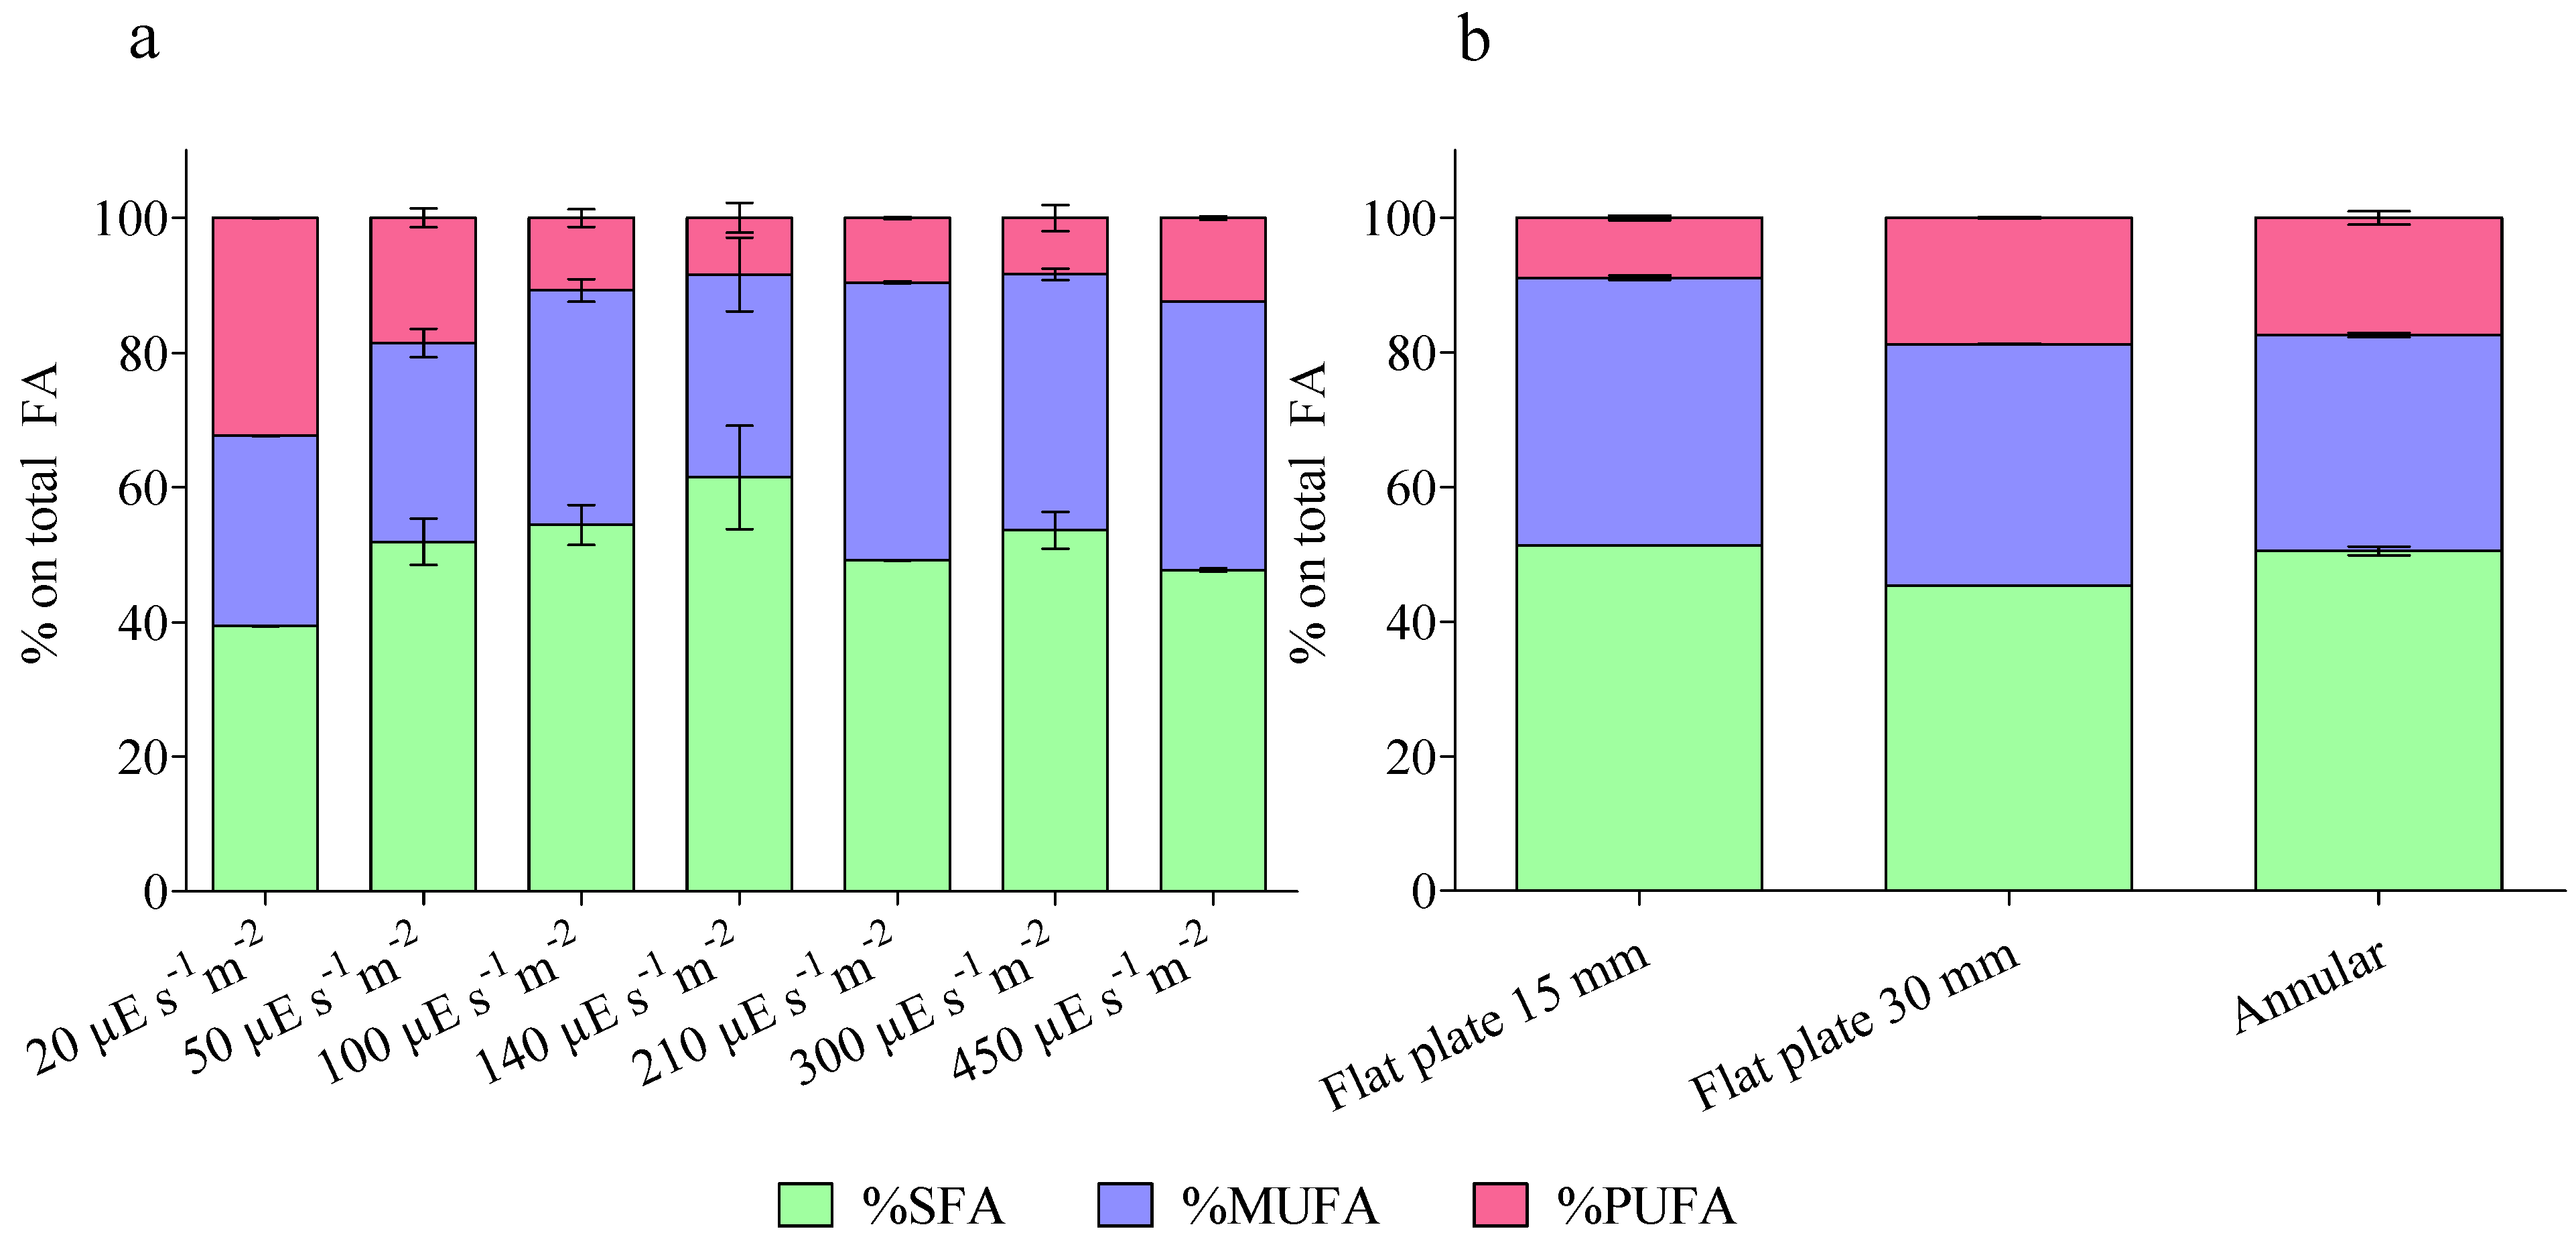
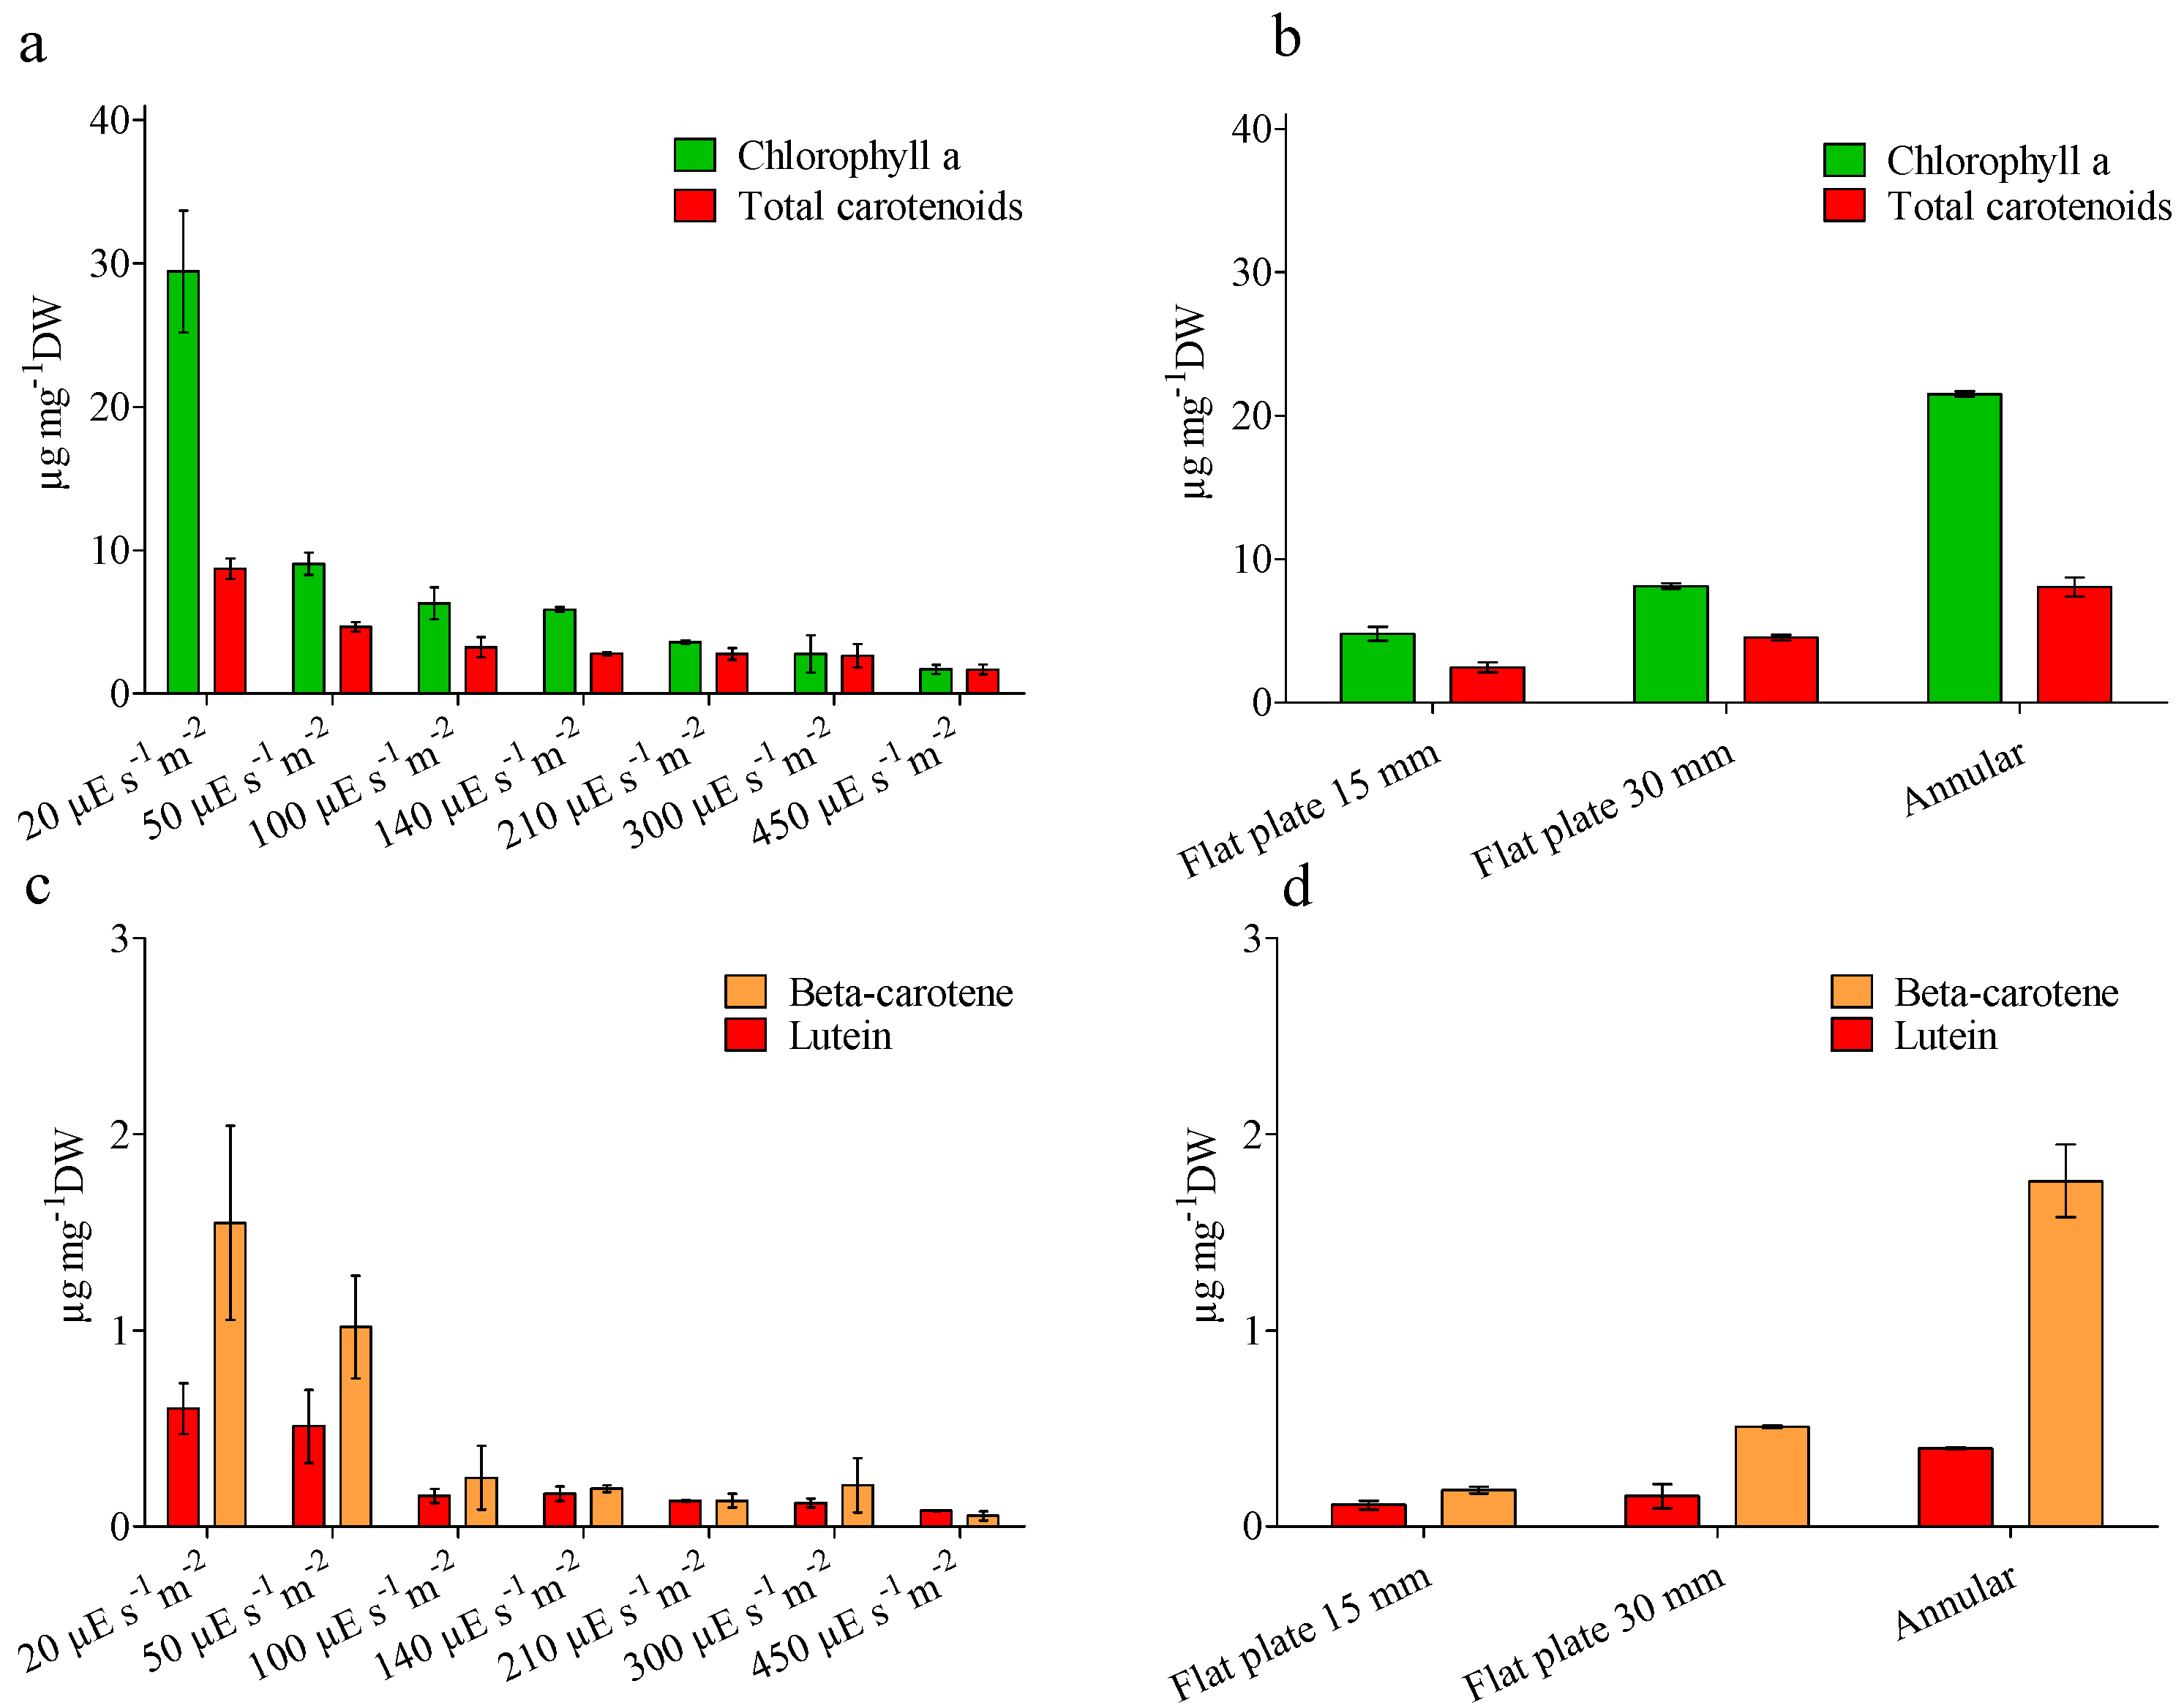
4.3. Biochemical Analysis

After growth, all the batch cultures were harvested, lyophilized and the biomass was employed to perform biochemical analysis. Results are shown in Figure 7, Figure 8 and Figure 9.
Figure 7 reports the batch productivity in terms of grams of dry weight per liter per day of cultivation. The biomass productivity ranges from 0.3 g L−1 d−1 to 1.2 g L−1 d−1 of the culture grown under 210 µE s−1m−2. As expected, the productivity increases with the incident photon flux density, as shown in Figure 7a. At the same time, the productivity decreases with the reactor thickness, as shown in Figure 7b. This is a consequence of the fact that the average light intensity is lower when the reactor thickness increases, and therefore the volumetric productivity diminishes because of the lack of light as substrate.
Other studies in the literature report batch productivity of Nannochloropsis in different cultivation conditions [25,26]. The productivities reported in the present study are in general significantly higher and this is due to the high average light intensity distributed inside the flat and the annular reactors employed in the present work.
Figure 8 shows the biochemical composition of the biomass obtained at the end of the batch cultivations and grown under different photon flux densities (Figure 8a) and in reactors with different configurations (Figure 8b). Lipid content shows a defined trend between the analysed conditions, while carbohydrate and protein content do not. Carbohydrate content is on average around 8% of the dry weight, while protein content is on average around 20% of the dry weight, as previously determined in the same strain [27]. Nannochloropsis is considered to be one of the most promising genera of microalgae in the production of lipids because of the possibility of accumulating high contents of up to 60% [28]. In this work, Nannochloropsis gaditana accumulated lipids from 9% of dry weight of the biomass grown under 20 µE s−1m−2 up to 45% of the dry weight of the biomass grown under 450 µE s−1m−2, similarly to that previously reported for the same strain [22,27]. The content of lipids increases with the average light intensity inside the reactor, both when cells were cultivated in the quasi-isoactinic reactor with increasing light intensity (Figure 8a) and when cells were cultivated in reactors with different geometries (Figure 8b). This trend was already observed before but, in this case, we report an accurate analysis with several different changing inputs in the cultivation [26,29]. This is the first time that a complete biochemical analysis was performed on biomass cultivated in quasi-isoactinic conditions. Analysis of the fatty acids content was performed in the same way and results are shown in Figure 9 and in Table 3.
The fatty acid class composition varies when growing microalgae under different photon flux densities and in different geometries. Saturated fatty acids (SFAs) vary from 39% of algae grown under 20 µE s−1m−2 to 50% of those grown inside the annular reactor; Monounsaturated fatty acids (MUFAs) vary between 28% to 41% of algae grown under 20 and 210 µE s−1m−2, respectively: Polyunsaturated fatty acids (PUFAs) vary from 8–9% in algae grown under 140, 210, 300 µE s−1m−2 and in a 150 mm reactor to 32% of algae grown under 20 µE s−1m−2. Looking at Figure 9, the most interesting aspect is that the PUFA content is highest when the cells were cultivated under low photon flux densities (20 µE s−1m−2), then gradually decreases until 140 µE s−1m−2 and is stable under the highest tested photon flux densities. The same trend is shown when the thickness of the reactor decreases, meaning that the PUFA content is inversely related to the average photon density. An opposite trend may be observed for the SFA, while the MUFAs do not vary significantly. Table 3 reports in detail the composition in n-3 and in n-6 fatty acids, the ratio between n-3 and n-6 and the percentage composition of the eicosapentaenoic acid (EPA), a fatty acid of interest from an industrial point of view. The fatty acids of the n-3 series decrease with an increase in the average photon flux density, in an opposite way to those of the n-6 series. The content of EPA is again highest under the lowest average light intensities employed. In general, the fatty acid profile is coherent with that found by other authors [27], as well as the change in composition with light intensity [30]. The increase in PUFA and in n-3 fatty acids in cultures exposed to low-light conditions is related to a low-light adaption, because cells increase their photosynthetic active membranes quantities [31,32]. It is worth highlighting, in any case, that the total lipid content is lower in cultures grown under low photon flux densities. It may be possible that the increase of lipids in algae grown under higher photon flux densities is due to an accumulation of storage lipids as SFAs and MUFAs, and that actually the PUFAs concentration is stable. Figure 10 reports an analysis of the carotenoids content of the biomass obtained at the end of the batch cultivations grown under different photon flux densities and in reactors with different configurations.
The content of chlorophyll a (Figure 10a), total carotenoids (Figure 10b), beta-carotene (Figure 10c) and lutein (Figure 10d) varies from a minimum of 1.7, 1.7, 0.05 and 0.08 µg mg−1 of dry weight, respectively, of the biomass grown under 450 µE s−1m−2 to a maximum of 29.4, 8.71, 1.55, and 0.60 µg mg−1 of dry weight, respectively, of the biomass grown under 20 µE s−1m−2. The contents are in the same range observed earlier [27]. The content of all the analysed compounds shows the same trend: it is higher in conditions where the average light intensity is lower (20 µE s−1m−2 and annular reactor) and coherently decreases along with increases in average light intensity. This response is caused by a photo-acclimatization mechanism, already known, through which the cells grown under low photon flux densities increase the number of photoactive systems, and consequently need higher quantities of carotenoids and chlorophyll [33,34].

5. Conclusions

In the present work a model able to predict the microalgae growth in reactors with different geometries was developed. We combined a Monod-like model for the specific growth rate with the Lambert-Beer law for non-homogeneous light distribution in thick photobioreactors. Kinetic parameters relating to the cultivation of the microalga Nannochloropsis gaditana were obtained, for the first time, through batch cultivation under different photon flux densities inside a quasi-isoactinic photobioreactor in order to obtain a practically homogeneous light distribution. The maximum specific growth rate and saturation constant resulted, respectively, as µmax = 0.0256 h−1 and I k = 15.28   µ E   s 1 m 2 .
These parameters were applied to the model to obtain microalgae growth curves in reactors with three different geometries: two flat-plate photobioreactors (FP-PBR) with different thicknesses (15 mm and 30 mm), and one annular column photobioreactor (AC-PBR). Simulation results showed good agreement with experimental growth curves of Nannochloropsis gaditana obtained in the three photobioreactors.
All the cultures cultivated in this work were also employed to perform biochemical analysis of the content of proteins, carbohydrates and lipids, and for the characterization of the fatty acid profile and the carotenoids content. The results show that the carbohydrate and protein content do not vary significantly with changing average light intensity, while the lipid content does. In particular, lipid content increases with increasing average photon flux density. The fatty acid profile also shows a marked shift when the average light intensity varies: the PUFA content decreases and the SFA content increases when the average light intensity increases. The carotenoids content is markedly shifted towards an accumulation at lower photon flux densities. These last responses indicate a strong low-light adaption of Nannochloropsis gaditana grown under low average light intensities.

Author Contributions

Conceptualization: F.S. and S.L.; methodology: S.L., F.S. and A.B., software: F.S., S.L. and L.S.; validation, S.L. and L.S.; formal analysis, S.L. and L.S.; investigation, S.L.; resources, S.L. and G.C.; data curation, F.S. and S.L.; writing—original draft preparation, S.L.; writing—review and editing, S.L., F.S., G.C. and L.S.; visualization, S.L. and F.S.; supervision, F.S. All authors have read and agreed to the published version of the manuscript.

Funding

This research received no external funding.

Institutional Review Board Statement

Not applicable.

Informed Con sent Statement

Not applicable.

Conflicts of Interest

The authors declare no conflict of interest.

Nomenclature

I = local light intensity, µE s−1m−2µ = growth rate, h−1
I0 = incident light intensity, µE s−1m−2µmax = maximum growth rate, h−1
ka = attenuation constant, m2 g−1Ik = light saturation constant, µE s−1m−2
X = biomass concentration, g L−1V = volume of the reactor, m3
z = distance from the surface to the considered position, mA = enlightened surface of the reactor, m2
Acapt = area of the cell capturing light, m2L = depth of the reactor, m
dcapt = diameter of the transversal section of light capture, mkd = constant of cellular death, h−1
dcell = cell diameter, mrx = rate of biomass production, g m−3 h−1
ρcell = cell density, g m−3r = radius of the annular section, m
h = height of the reactor, m

References

  1. Richmond, A.; Hu, Q. (Eds.) Handbook of Microalgal Culture; John Wiley & Sons, Ltd.: Oxford, UK, 2013; ISBN 9781118567166. [Google Scholar]
  2. Kitada, K.; Machmudah, S.; Sasaki, M.; Goto, M.; Nakashima, Y.; Kumamoto, S.; Hasegawa, T. Supercritical CO2 Extraction of Pigment Components with Pharmaceutical Importance from Chlorella Vulgaris. J. Chem. Technol. Biotechnol. 2009, 84, 657–661. [Google Scholar] [CrossRef]
  3. Lima, S.; Villanova, V.; Grisafi, F.; Caputo, G.; Brucato, A.; Scargiali, F. Autochthonous Microalgae Grown in Municipal Wastewaters as a Tool for Effectively Removing Nitrogen and Phosphorous. J. Water Process Eng. 2020, 38, 101647. [Google Scholar] [CrossRef]
  4. Sanchez, A.; Gonzalez, A.; Maceiras, R.; Cancela, A.; Urrejola, S. Raceway Pond Design for Micoalgae Culture for Biodiesel. Chem. Eng. Trans. 2011, 25, 845–850. [Google Scholar] [CrossRef]
  5. Slade, R.; Bauen, A. Micro-Algae Cultivation for Biofuels: Cost, Energy Balance, Environmental Impacts and Future Prospects. Biomass Bioenergy 2013, 53, 29–38. [Google Scholar] [CrossRef] [Green Version]
  6. Molina, E.; Fernández, J.; Acién, F.G.; Chisti, Y. Tubular Photobioreactor Design for Algal Cultures. J. Biotechnol. 2001, 92, 113–131. [Google Scholar] [CrossRef]
  7. Fernandes, B.D.; Mota, A.; Ferreira, A.; Dragone, G.; Teixeira, J.A.; Vicente, A.A. Characterization of Split Cylinder Airlift Photobioreactors for Efficient Microalgae Cultivation. Chem. Eng. Sci. 2014, 117, 445–454. [Google Scholar] [CrossRef] [Green Version]
  8. Simionato, D.; Basso, S.; Giacometti, G.M.; Morosinotto, T. Optimization of Light Use Efficiency for Biofuel Production in Algae. Biophys. Chem. 2013, 182, 71–78. [Google Scholar] [CrossRef]
  9. Sabri, L.S.; Ojha, A.; Sultan, A.J.; Aldahhan, M.H. Integration of Dynamic Growth Modeling and Hydrodynamics in an Internal-loop Split Photobioreactor. J. Chem. Technol. Biotechnol. 2022, 97, 1112–1127. [Google Scholar] [CrossRef]
  10. Ojah, A.; Sabri, L.S.; Aldahhan, M.H. Local Volumetric Mass Transfer Coefficient Estimation for Scenedesmus Microalgae Culture in a Cylindrical Airlift Photobioreactor. J. Chem. Technol. Biotechnol. 2021, 96, 764–774. [Google Scholar] [CrossRef]
  11. Béchet, Q.; Shilton, A.; Guieysse, B. Modeling the Effects of Light and Temperature on Algae Growth: State of the Art and Critical Assessment for Productivity Prediction during Outdoor Cultivation. Biotechnol. Adv. 2013, 31, 1648–1663. [Google Scholar] [CrossRef] [PubMed]
  12. Lima, S.; Grisafi, F.; Scargiali, F.; Caputo, G.; Brucato, A. Growing Microalgae in a “Quasi-Isoactinic” Photobioreactor. Chem. Eng. Trans. 2018, 64, 673–678. [Google Scholar] [CrossRef]
  13. Li, S.; Huang, J.; Ji, L.; Chen, C.; Wu, P.; Zhang, W.; Tan, G.; Wu, H.; Fan, J. Assessment of Light Distribution Model for Marine Red Microalga Porphyridium Purpureum for Sustainable Production in Photobioreactor. Algal Res. 2021, 58, 102390. [Google Scholar] [CrossRef]
  14. Pfaffinger, C.E.; Schöne, D.; Trunz, S.; Löwe, H.; Weuster-Botz, D. Model-Based Optimization of Microalgae Areal Productivity in Flat-Plate Gas-Lift Photobioreactors. Algal Res. 2016, 20, 153–163. [Google Scholar] [CrossRef]
  15. Zittelli, G.C.; Rodolfi, L.; Tredici, M.R. Mass cultivation of Nannochloropsis sp. in annular reactors. J. Appl. Phycol. 2003, 15, 107–114. [Google Scholar] [CrossRef]
  16. Ranglová, K.; Bureš, M.; Manoel, J.C. Efficient microalgae feed production for fish hatcheries using an annular column photobioreactor characterized by a short light path and central LED illumination. J. Appl. Phycol. 2022, 34, 31–41. [Google Scholar] [CrossRef]
  17. Guillard, R.R.L. Culture of Phytoplankton for Feeding Marine Invertebrates. In Culture of Marine Invertebrate Animals; Smith, W.L., Chanley, M.H., Eds.; Springer: Boston, MA, USA, 1975; pp. 29–60. ISBN 978-1-4615-8714-9. [Google Scholar]
  18. Trevelyan, W.E.; Forrest, R.S.; Harrison, J.S. Determination of Yeast Carbohydrates with the Anthrone Reagent. Nature 1952, 170, 626–627. [Google Scholar] [CrossRef] [PubMed]
  19. Lichtenthaler, H.K.; Wellburn, A.R. Determinations of Total Carotenoids and Chlorophylls a and b of Leaf Extracts in Different Solvents. Biochem. Soc. Trans. 1983, 11, 591–592. [Google Scholar] [CrossRef] [Green Version]
  20. Doran, P.M. Bioprocess Engineering Principles, 2nd ed.; Academic Press: London, UK, 2013; ISBN 978-0-12-220851-5. [Google Scholar]
  21. Simionato, D.; Sforza, E.; Corteggiani Carpinelli, E.; Bertucco, A.; Giacometti, G.M.; Morosinotto, T. Acclimation of Nannochloropsis gaditana to Different Illumination Regimes: Effects on Lipids Accumulation. Bioresour. Technol. 2011, 102, 6026–6032. [Google Scholar] [CrossRef]
  22. Lima, S.; Villanova, V.; Grisafi, F.; Brucato, A.; Scargiali, F. Combined Effect of Nutrient and Flashing Light Frequency for a Biochemical Composition Shift in Nannochloropsis gaditana Grown in a Quasi-isoactinic Reactor. Can. J. Chem. Eng. 2020, 98, 1944–1954. [Google Scholar] [CrossRef]
  23. Polishchuk, A.; Valev, D.; Tarvainen, M.; Mishra, S.; Kinnunen, V.; Antal, T.; Yang, B.; Rintala, J.; Tyystjärvi, E. Cultivation of Nannochloropsis for Eicosapentaenoic Acid Production in Wastewaters of Pulp and Paper Industry. Bioresour. Technol. 2015, 193, 469–476. [Google Scholar] [CrossRef]
  24. Huesemann, M.; Crowe, B.; Waller, P.; Chavis, A.; Hobbs, S.; Edmundson, S.; Wigmosta, M. A Validated Model to Predict Microalgae Growth in Outdoor Pond Cultures Subjected to Fluctuating Light Intensities and Water Temperatures. Algal Res. 2016, 13, 195–206. [Google Scholar] [CrossRef] [Green Version]
  25. Gharat, K.; Agarwal, A.; Pandit, R.A.; Lali, A.M. Development of Fed Batch Strategies to Improve the Production of Eicosapentaenoic Acid from a Marine Microalga Nannochloropsis oculata. Bioresour. Technol. Rep. 2018, 4, 193–201. [Google Scholar] [CrossRef]
  26. Devasya, R.R.P.; Bassi, A.S. Effect of Nitrate Feeding Strategies on Lipid and Biomass Productivities in Fed-Batch Cultures of Nannochloropsis gaditana. Biotechnol. Prog. 2021, 37, e3120. [Google Scholar] [CrossRef] [PubMed]
  27. Lima, S.; Schulze, P.S.C.; Schüler, L.M.; Rautenberger, R.; Morales-Sánchez, D.; Santos, T.F.; Pereira, H.; Varela, J.C.S.; Scargiali, F.; Wijffels, R.H.; et al. Flashing Light Emitting Diodes (LEDs) Induce Proteins, Polyunsaturated Fatty Acids and Pigments in Three Microalgae. J. Biotechnol. 2021, 325, 15–24. [Google Scholar] [CrossRef] [PubMed]
  28. Rodolfi, L.; Chini Zittelli, G.; Bassi, N.; Padovani, G.; Biondi, N.; Bonini, G.; Tredici, M.R. Microalgae for Oil: Strain Selection, Induction of Lipid Synthesis and Outdoor Mass Cultivation in a Low-Cost Photobioreactor. Biotechnol. Bioeng. 2009, 102, 100–112. [Google Scholar] [CrossRef]
  29. Pal, D.; Khozin-Goldberg, I.; Cohen, Z.; Boussiba, S. The Effect of Light, Salinity, and Nitrogen Availability on Lipid Production by Nannochloropsis sp. Appl. Microbiol. Biotechnol. 2011, 90, 1429–1441. [Google Scholar] [CrossRef] [PubMed]
  30. Ma, X.-N.; Chen, T.-P.; Yang, B.; Liu, J.; Chen, F. Lipid Production from Nannochloropsis. Mar. Drugs 2016, 14, 61. [Google Scholar] [CrossRef] [Green Version]
  31. Renaud, S.M.; Parry, D.L.; Thinh, L.-V.; Kuo, C.; Padovan, A.; Sammy, N. Effect of Light Intensity on the Proximate Biochemical and Fatty Acid Composition of Isochrysis Sp. and Nannochloropsis oculata for Use in Tropical Aquaculture. J. Appl. Phycol. 1991, 3, 43–53. [Google Scholar] [CrossRef]
  32. He, Q.; Yang, H.; Wu, L.; Hu, C. Effect of Light Intensity on Physiological Changes, Carbon Allocation and Neutral Lipid Accumulation in Oleaginous Microalgae. Bioresour. Technol. 2015, 191, 219–228. [Google Scholar] [CrossRef]
  33. Wang, B.; Jia, J. Photoprotection Mechanisms of Nannochloropsis oceanica in Response to Light Stress. Algal Res. 2020, 46, 101784. [Google Scholar] [CrossRef]
  34. Arena, R.; Lima, S.; Villanova, V.; Moukri, N.; Curcuraci, F.; Messina, C.; Santulli, A.; Scargiali, F. Cultivation and biochemical characterization of isolated Sicilian microalgal species in salt and temperature stress conditions. Algal Res. 2021, 59, 102430. [Google Scholar] [CrossRef]
Figure 1. General scheme of the flat reactors employed in this work.
Applsci 12 05776 g001
Figure 2. Schematic sketch of the annular photobioreactor employed in this work.
Applsci 12 05776 g002
Figure 3. Growth of microalga Nannochloropsis gaditana at 25 °C in the quasi-isoactinic photobioreactor under different light intensities.
Applsci 12 05776 g003
Figure 4. “Langmuir plot” of experimental values obtained at different light intensities.
Applsci 12 05776 g004
Figure 5. Specific growth rate versus different irradiation intensities of the microalga Nannochloropsis gaditana in the quasi-isoactinic photobioreactor: black circles, experimental data; line, Equation (10).
Applsci 12 05776 g005
Figure 6. Comparison between model prediction and experimental data of Nannochloropsis gaditana growth curves in batch photobioreactors: “orange” Flat-plate 15 mm, “green” Flat-plate 30 mm, “blue” Annular photobioreactor. Dotted lines, model predictions; symbols, experimental data.
Applsci 12 05776 g006
Figure 7. Batch productivity of the cultures grown in different conditions: (a) quasi-isoactinic reactor with different photon flux densities; (b) reactors with different configurations at incident light intensity I0 = 210 μE s−1m−2.
Applsci 12 05776 g007
Figure 8. Biochemical composition of the biomass obtained at the end of the batch cultivations grown under different conditions: (a) quasi-isoactinic reactor with different photon flux densities; (b) reactors with different configurations at incident light intensity I0 = 210 μE s−1m−2.
Applsci 12 05776 g008
Figure 9. Fatty acid analysis as percentage of total fatty acid content in the biomass obtained at the end of the batch cultivations grown under different conditions: (a) quasi-isoactinic reactor with different photon flux densities; (b) reactors with different configurations at incident light intensity I0 = 210 μE s−1m−2. SFA, saturated fatty acid; MUFA, monounsaturated fatty acids; PUFA: polyunsaturated fatty acid.
Applsci 12 05776 g009
Figure 10. Carotenoid analysis of the biomass obtained at the end of the batch cultivations grown under different conditions: (a,c), quasi-isoactinic reactor with different photon flux densities; (b,d), reactors with different configurations at incident light intensity I0 = 210 μE s−1m−2. DW: dry weight.
Applsci 12 05776 g010
Table 1. Values of specific growth rates and R2 calculated at different light intensities at T = 25 °C in Nannochloropsis gaditana.
I0 (µE s1m−2)µ (h−1)I0/µ (µE h s1m−2)R2
200.011717090.9956
500.018427170.9912
1000.022843860.9817
1400.023759070.9976
2100.024984340.9891
3000.0246121950.9859
4500.0243185190.9988
Table 2. Data and parameters employed for the model.
ParameterValueUnit
Flat type 15 Flat type 30 Annular
L153035.5mm
µmax0.02560.02560.0256h−1
IK15.2815.2815.28µE s−1m−2
kd0.00460.00460.0046h−1
ka0.380.380.20m2 g−1
Table 3. Specific fatty acid classes in total fatty acids (TFAs) of the biomass obtained at the end of the batch cultivations grown under different photon flux densities and in reactors with different configurations with I0 = 210 μE s−1m−2. n-3 and n-6 represent classes of fatty acids with the first unsaturation at the carbon 3 or 6. EPA: eicosapentaenoic acid.
20 µE s−1m−250 µE s−1m−2100 µE s−1m−2140 µE s−1m−2 210 µE s−1m−2 300 µE s−1m−2 450 µE s−1m−2 15 mm30 mmAnnular
% of n-3 on TFAs29 ± 0.115.9 ± 0.97 ± 0.36 ± 1.66.1 ± 1.68.3 ± 0.35.9 ± 0.36.4 ± 0.115.6 ± 0.912.7 ± 0
% of n-6 on TFAs3.4 ± 0.12.7 ± 0.53.2 ± 0.82.4 ± 0.62.3 ± 0.34.1 ± 03.6 ± 0.12.5 ± 03.1 ± 04.6 ± 0
n3/n6 ratio8.5 ± 0.26 ± 0.82.3 ± 0.62.4 ± 0.12.6 ± 0.42 ± 0.11.6 ± 02.5 ± 05 ± 0.22.7 ± 0
% of C20:5 n-3 (EPA) on TFAs26 ± 0.113.3 ± 0.54.9 ± 0.34 ± 1.14.2 ± 15.6 ± 0.20 ± 04.4 ± 010.4 ± 0.69 ± 0
Publisher’s Note: MDPI stays neutral with regard to jurisdictional claims in published maps and institutional affiliations.

