
Assessing Flood Indirect Impacts on Road Transport Networks Applying Mesoscopic Traffic Modelling: The Case Study of Santarém, Portugal

 ,
,  , and
, and 
Abstract
:1. Introduction
2. Literature Review
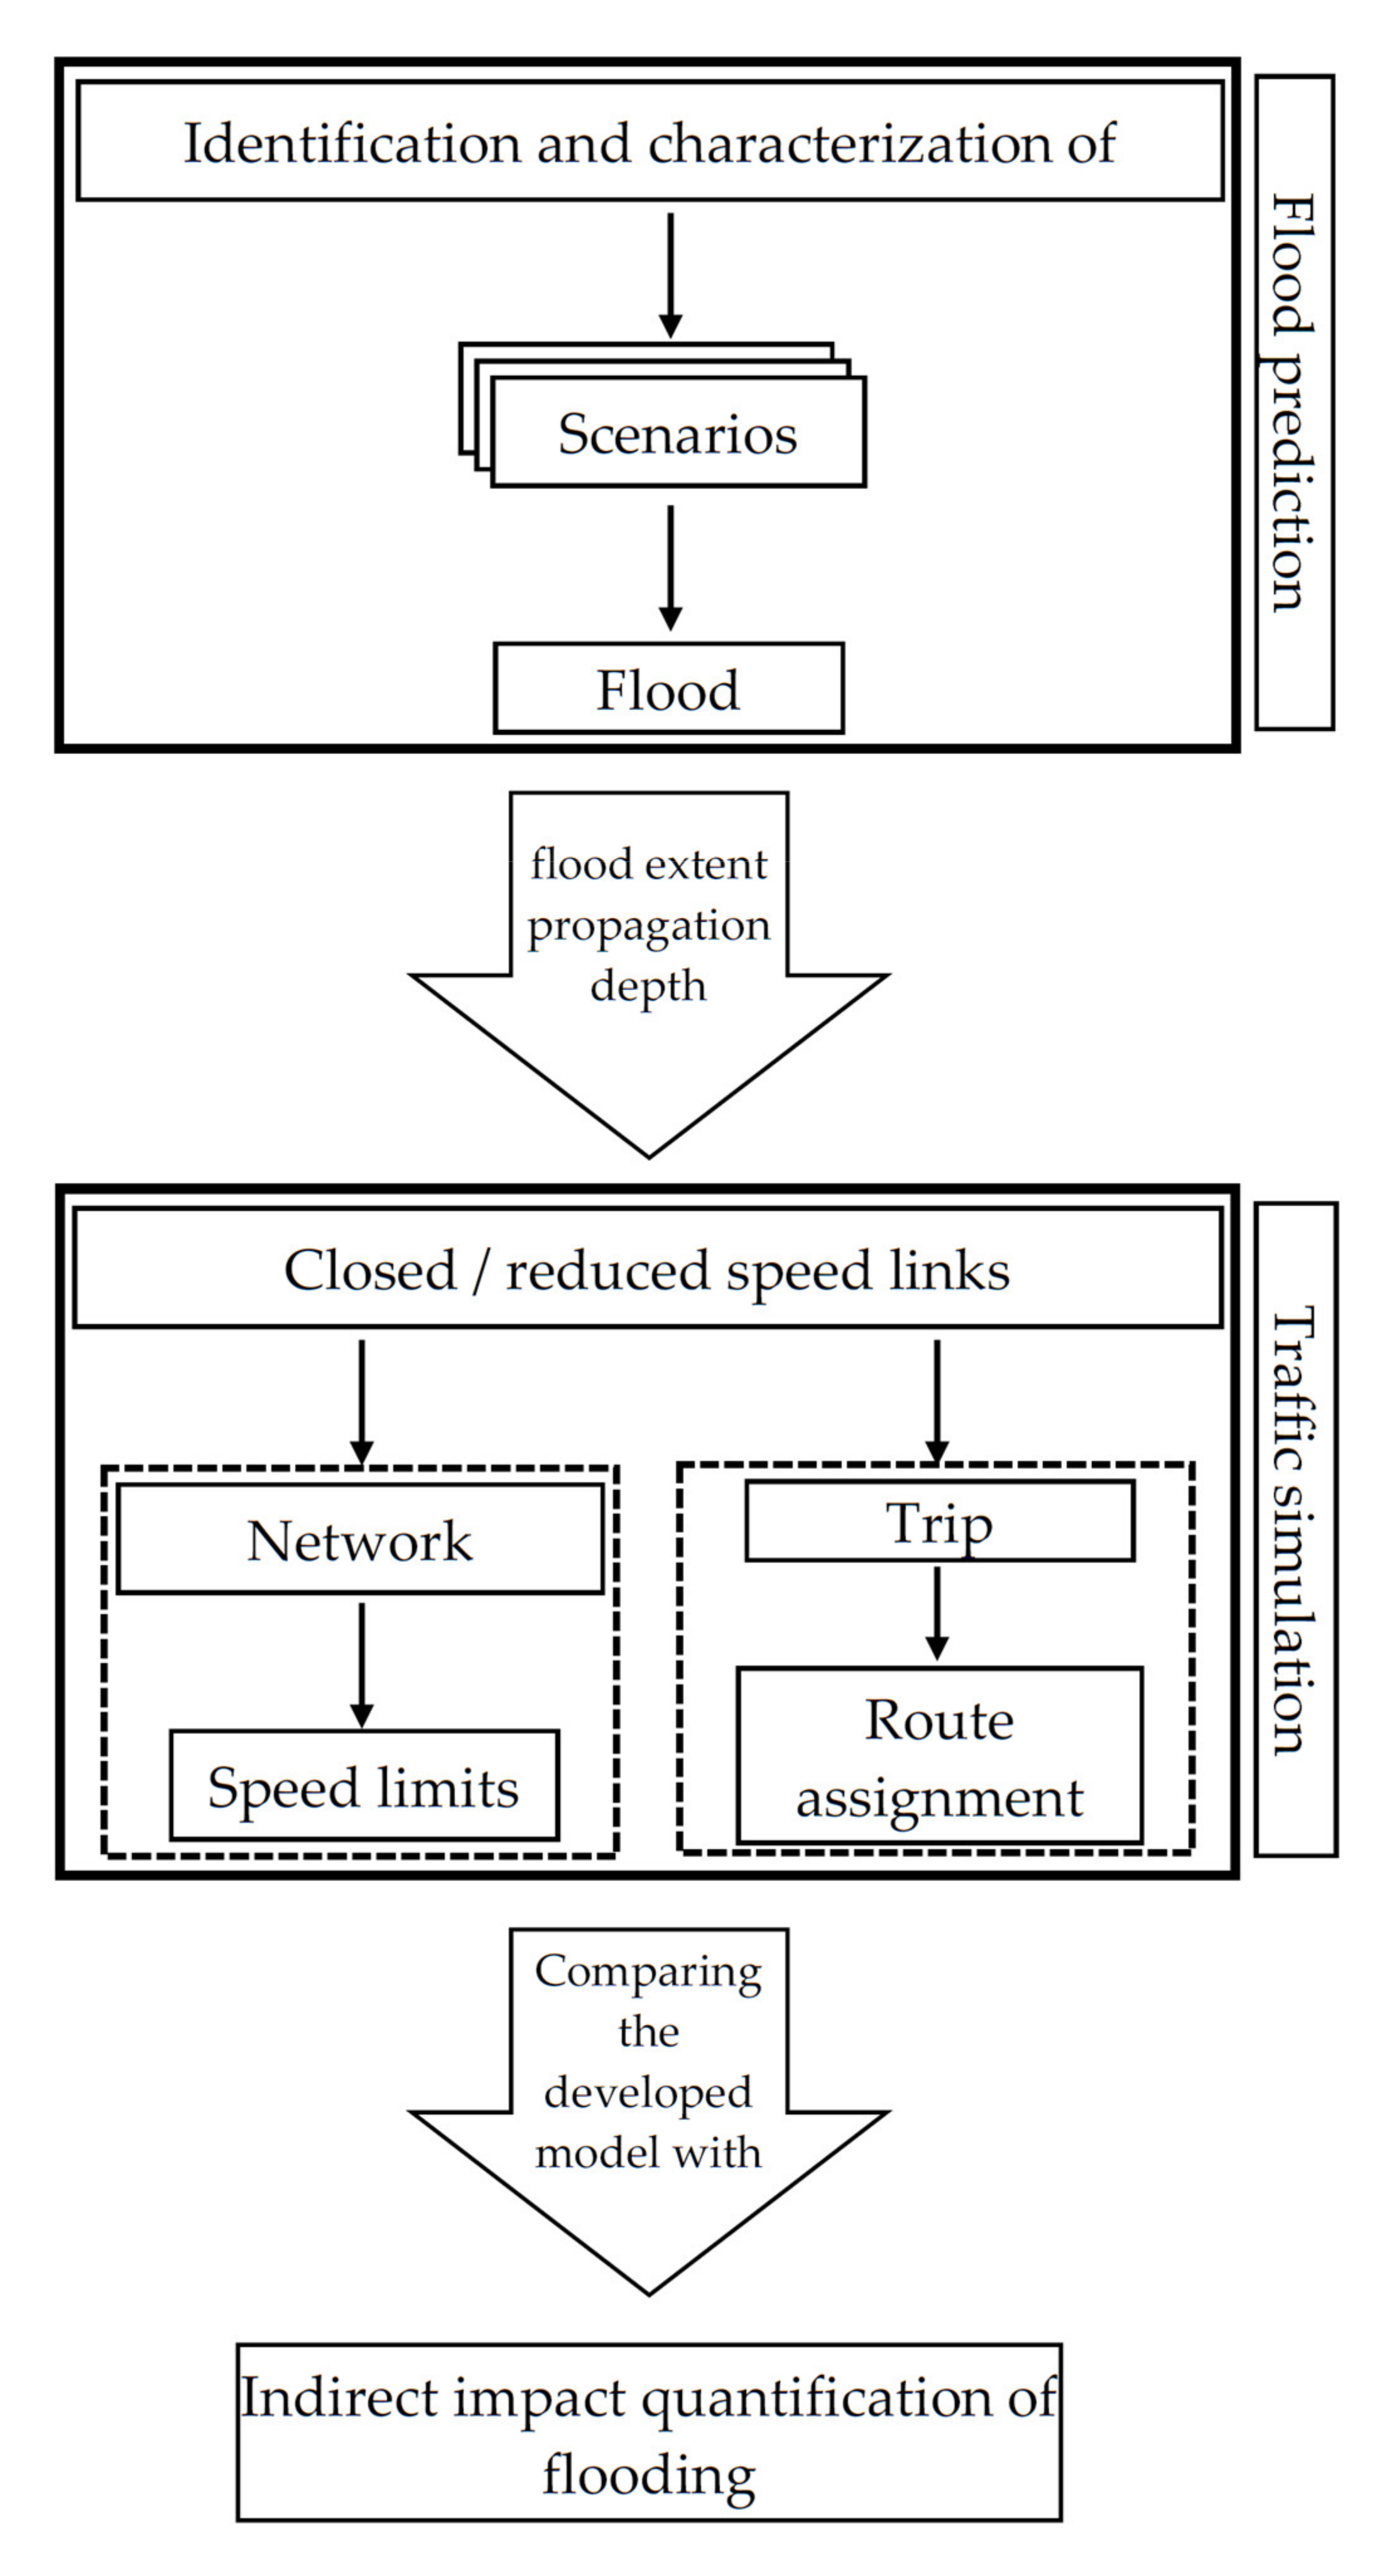
3. Framework
4. Materials and Method
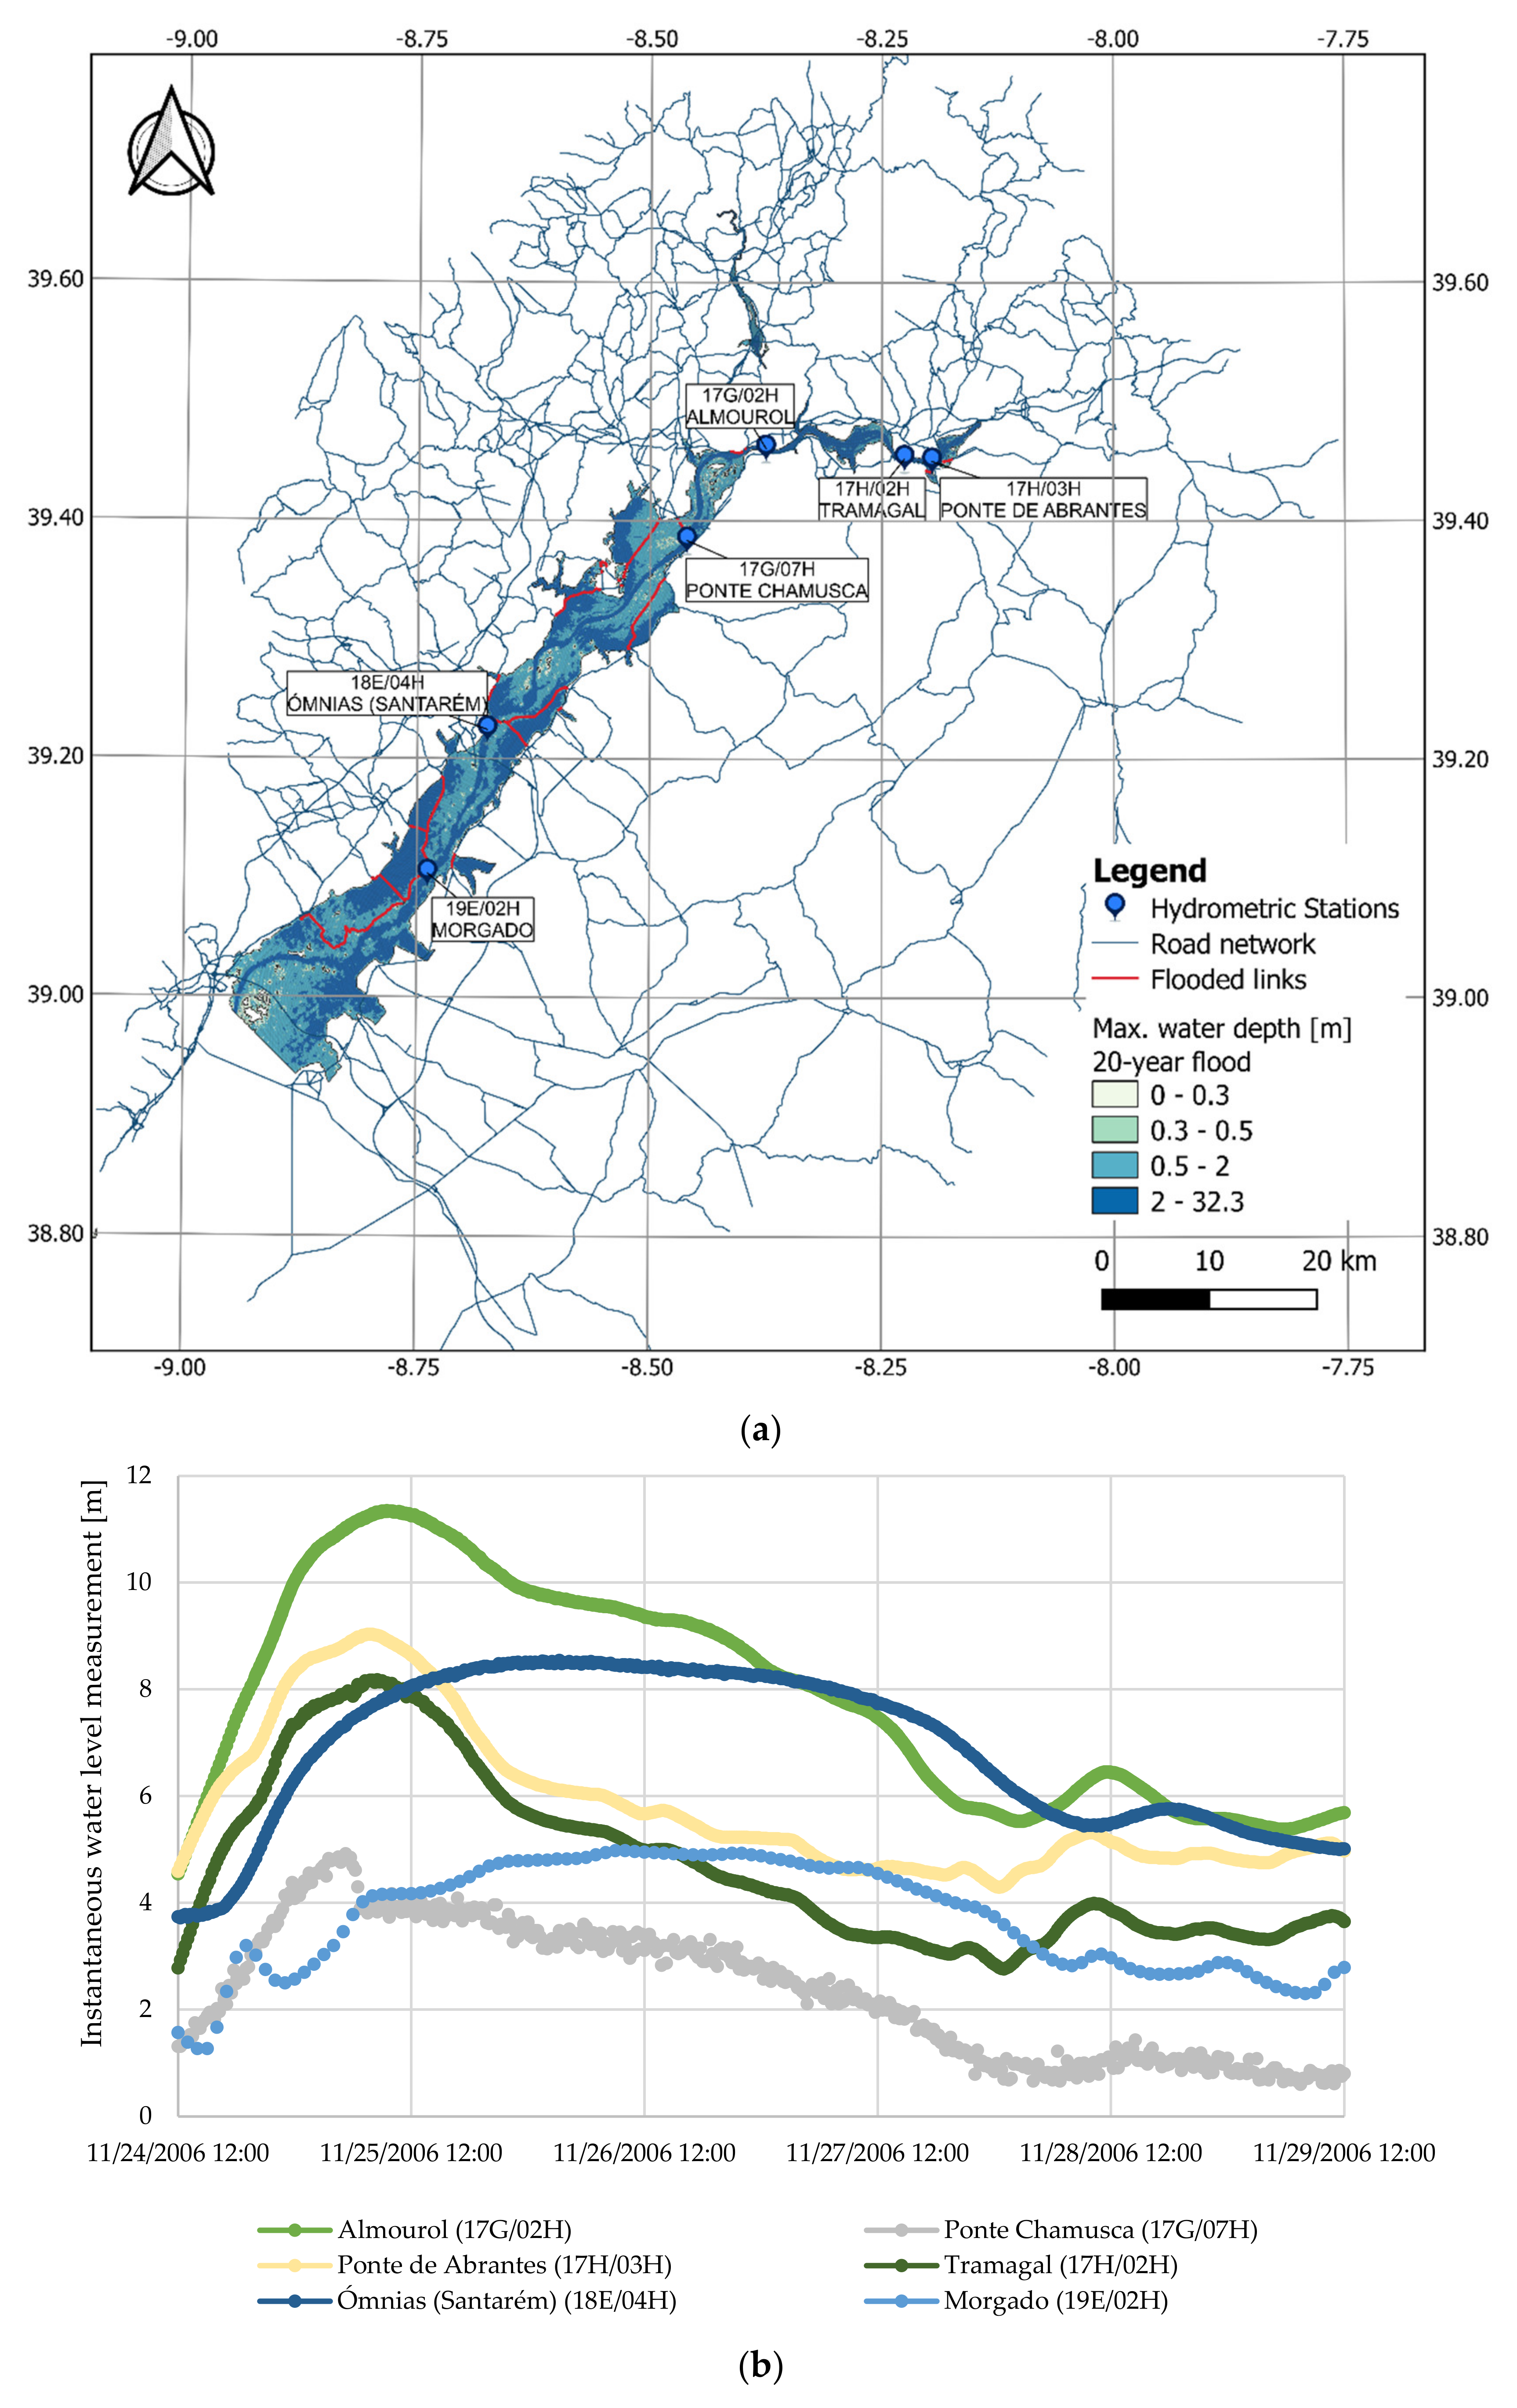
4.1. Flood Model
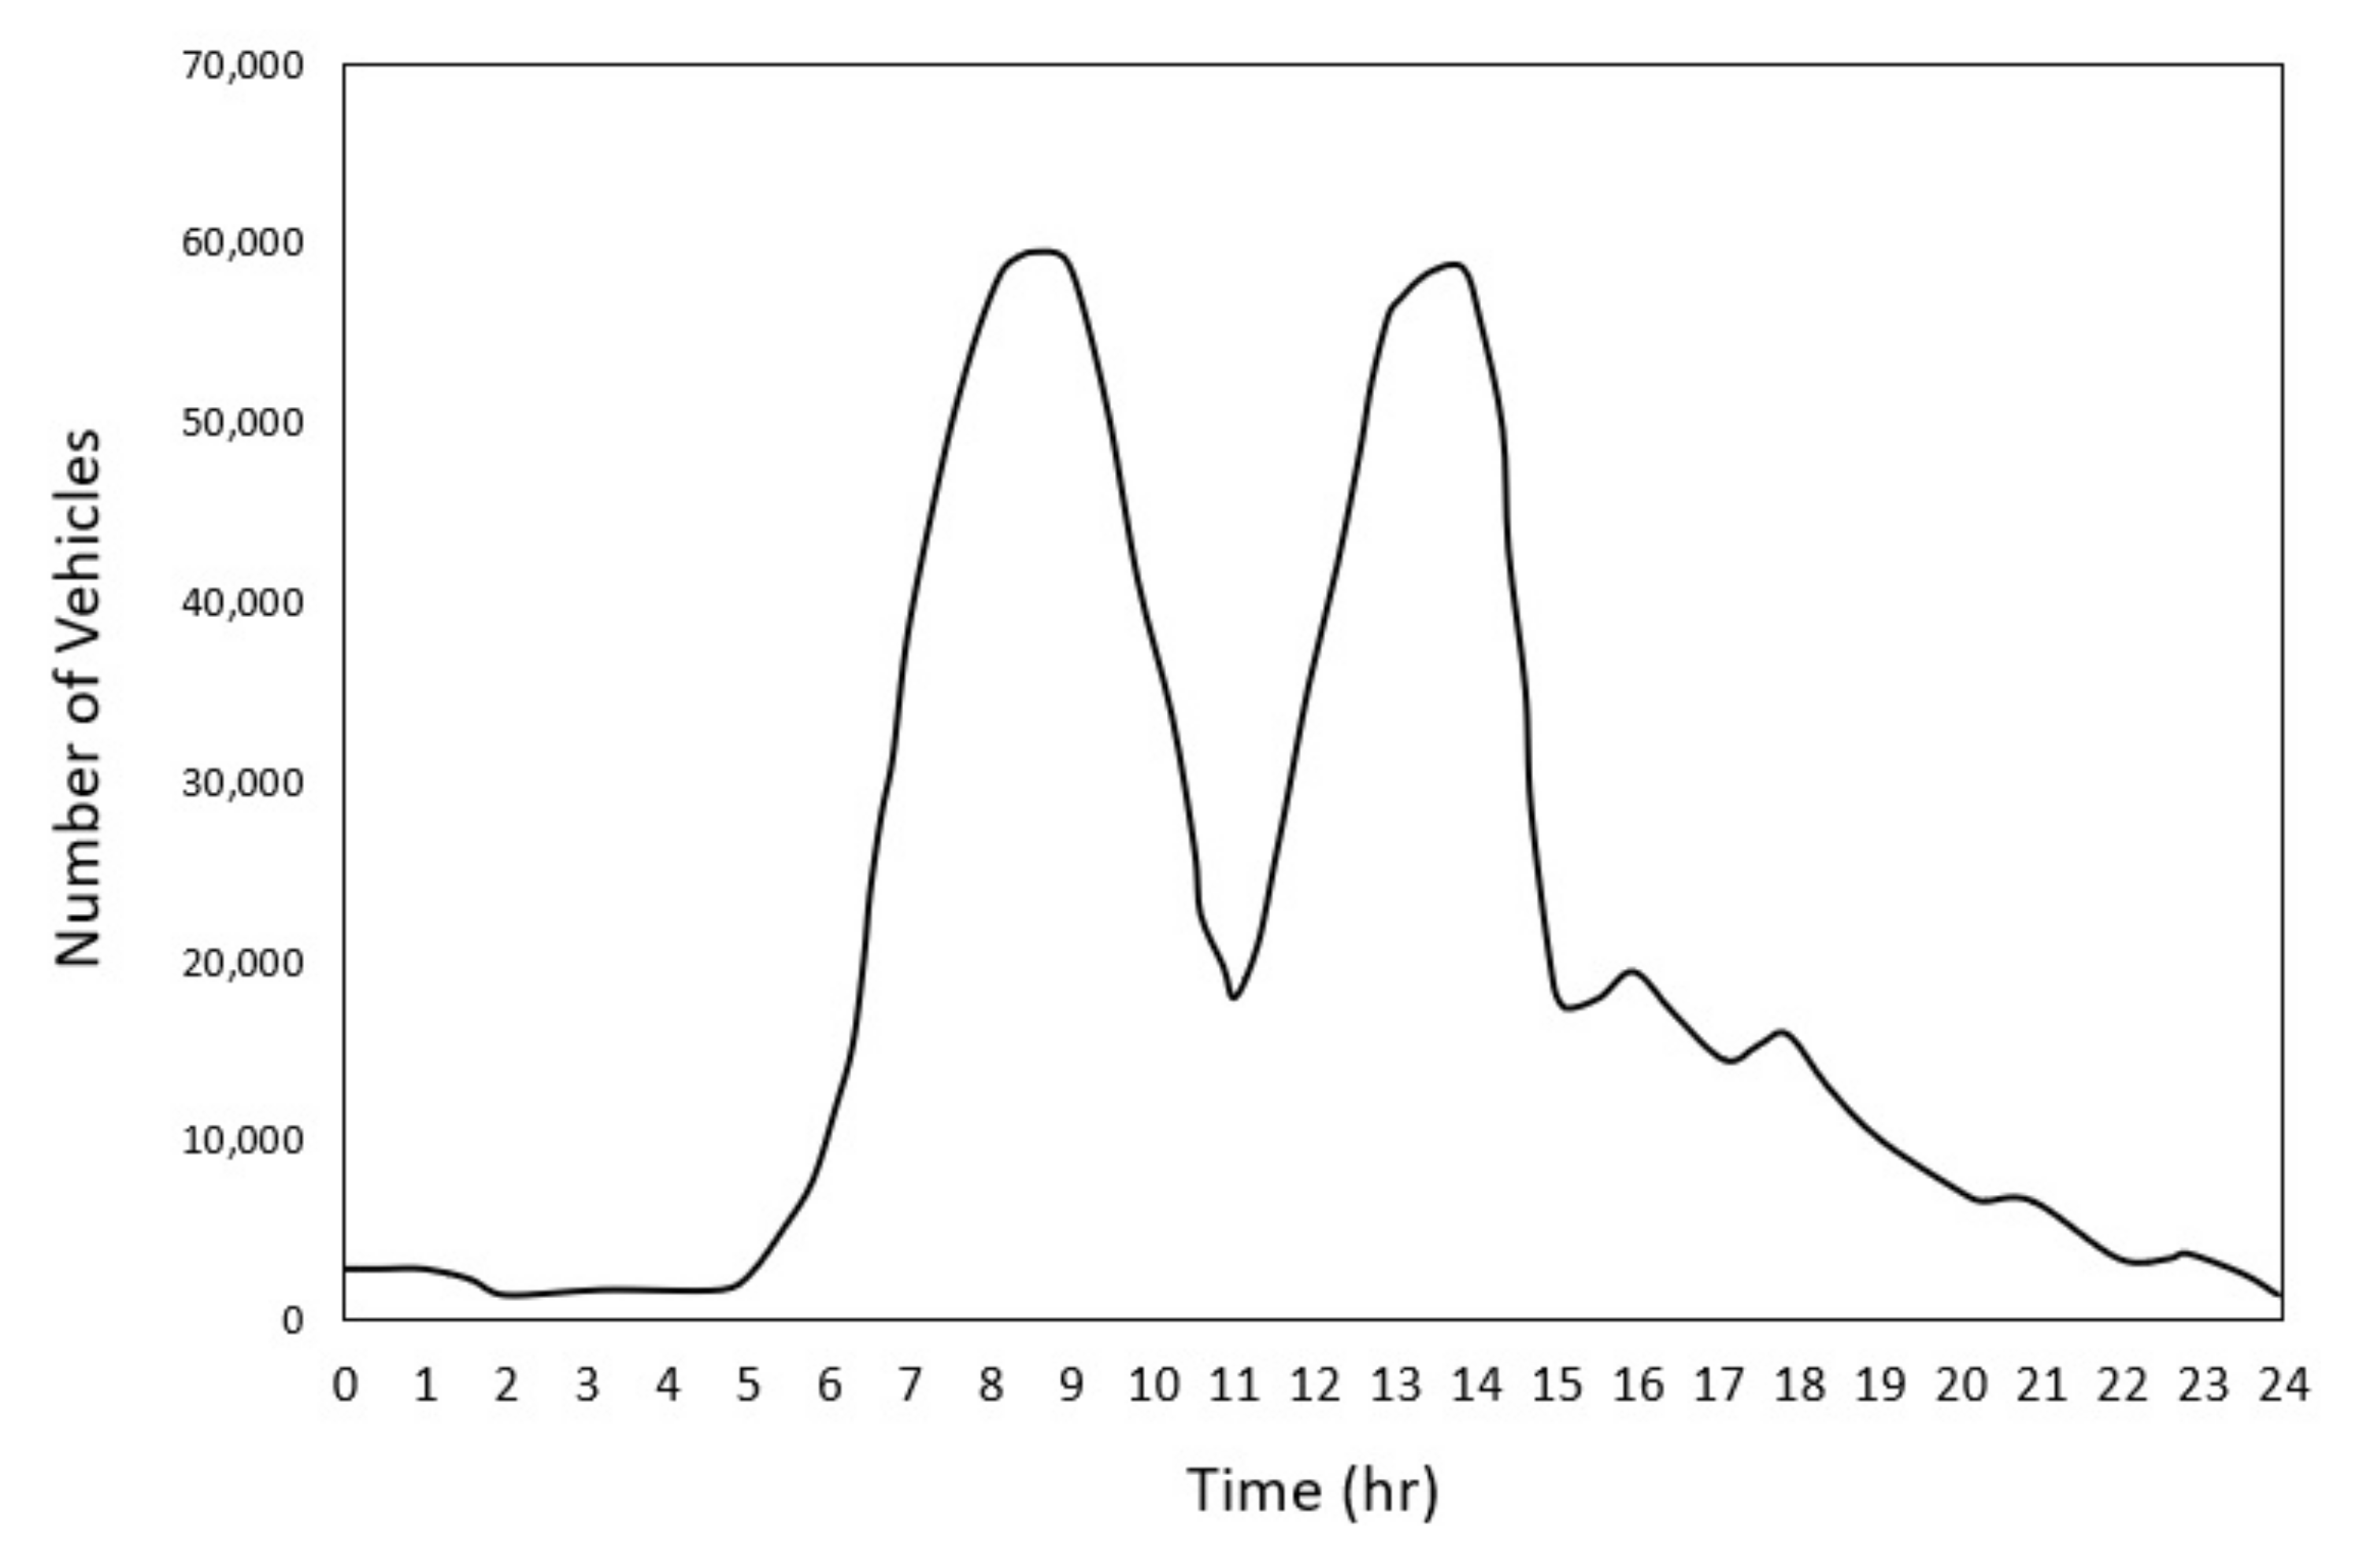
4.2. Traffic Model
4.3. Validation and Verification of Results
5. Results and Discussion
5.1. Flooding Day
5.1.1. Travel Time
5.1.2. Travel Distance
5.2. Day after Flooding
5.3. Streets Speed Changes
6. Conclusions
- Because traffic jams sometimes accumulate far from flooded areas, the locations of closed streets cannot be easily equated with areas of traffic interruption.
- In a disruption situation, some roads receive more traffic and some others that are located right after closure will receive fewer traffic volumes. If there is one-way traffic on certain roads, the situation will become even worse.
- Although predicting the exact roads where the system will struggle the most is very difficult, the results make it possible to identify the vulnerable locations that have experienced more speed reduction during the flood situation.
Author Contributions
Funding
Data Availability Statement
Conflicts of Interest
References
- He, Y.; Stephan, T.; Paolo, A.; Jun, R. Flood impacts on urban transit and accessibility—A case study of Kinshasa. Transp. Res. Part D Transp. Environ. 2021, 96, 102889. [Google Scholar] [CrossRef]
- Agência, L.; Médio, T. Municípios Reivindicam Apoios Do Governo Para Prejuízos Da Tempestade ‘Elsa’. 2020. Available online: https://www.mediotejo.net/medio-tejo-municipios-reivindicam-apoios-do-governo-para-prejuizos-da-tempestade-elsa-c-audio/ (accessed on 5 August 2021).
- Apa, I.P.; Modulers, A. Elaboração de cartografia específica sobre o risco de inundação para Portugal continental. Relat. Final 2014, 1, 260. [Google Scholar]
- Erath, A.L. Vulnaribility Assessment of Road Transport Infrastructure. Ph.D. Thesis, ETH Zurich, Zurich, Switzerland, 2011. [Google Scholar] [CrossRef]
- Pregnolato, M.; Winter, A.O.; Mascarenas, D.; Sen, A.D.; Bates, P.; Motley, M.R. Assessing flooding impact to riverine bridges: An integrated analysis. Nat. Hazards Earth Syst. Sci. Discuss. 2020, 1–18. [Google Scholar] [CrossRef]
- Pyatkova, K.; Chen, A.; Djordjevic, S.; Butler, D.; Vojinovic, Z.; Abebe, Y.; Hammond, M. Flood Impacts on Road Transportation Using Microscopic Traffic Modelling Techniques. In Simulating Urban Traffic Scenarios; Springer: Berlin/Heidelberg, Germany, 2019; pp. 115–126. [Google Scholar] [CrossRef] [Green Version]
- Pregnolato, M.; Alistair, F.; Sean, M.W.; Richard, J.D. The impact of flooding on road transport: A depth-disruption function. Transp. Res. Part D Transp. Environ. 2017, 55, 67–81. [Google Scholar] [CrossRef]
- Krajzewicz, D.; Erdmann, J.; Behrisch, M.; Bieker, L. Recent development and Applications of SUMO—Simulation of urban MObility. Int. J. Adv. Syst. Meas. 2012, 5, 128–138. [Google Scholar]
- Brown, R.; Curley, J.; Smith, B. Transport Resilience Review: A Review of the Resilience of the Transport Network to Extreme Weather Events; Department for Transport: London, UK, 2014. [Google Scholar]
- Affleck, A.; Gibbon, J. Workington: A case study in coordination and communication. Proc. Inst. Civ. Eng.-Munic. Eng. 2016, 169, 109–117. [Google Scholar] [CrossRef] [Green Version]
- McDermott, T.; Kilgarriff, P.; Vega, A.; O’donoghue, C.; Morrissey, K. The Indirect Economic Costs of Flooding: Evidence from Transport Disruptions during Storm Desmond [WWW Document]. 2017. Available online: http://programme.exordo.com/iea2017/delegates/presentation/94/ (accessed on 8 November 2018).
- Liu, L.; Frangopol, D.M.; Mondoro, A.; Yang, D.Y. Sustainability-informed bridge ranking under scour based on transportation network performance and multiattribute utility. J. Bridge Eng. 2018, 23, 04018082. [Google Scholar] [CrossRef]
- Martínez-Gomariz, E.; Gómez, M.; Russo, B.; Djordjević, S. Stability criteria for flooded vehicles: A state-of-the-art review. J. Flood Risk Manag. 2018, 11, S817–S826. [Google Scholar] [CrossRef]
- Martínez-Gomariz, E.; Gómez, M.; Russo, B.; Djordjević, S. A new experiments-based methodology to define the stability threshold for any vehicle exposed to flooding. Urban Water J. 2017, 14, 930–939. [Google Scholar] [CrossRef]
- Arrighi, C.; Pregnolato, M.; Dawson, R.J.; Castelli, F. Preparedness against mobility disruption by floods. Sci. Total Environ. 2019, 654, 1010–1022. [Google Scholar] [CrossRef]
- Sohn, J. Evaluating the significance of highway network links under the flood damage: An accessibility approach. Transp. Res. Part A Policy Pract. 2006, 40, 491–506. [Google Scholar] [CrossRef]
- Suarez, P.; Anderson, W.; Mahal, V.; Lakshmanan, T.R. Impacts of flooding and climate change on urban transportation: A systemwide performance assessment of the Boston Metro Area. Transp. Res. Part D Transp. Environ. 2005, 10, 231–244. [Google Scholar] [CrossRef]
- Chang, H.; Lafrenz, M.; Jung, I.; Figliozzi, M.; Platman, D.; Pederson, C. Potential impacts of climate change on flood-induced travel disruptions: A case study of Portland, Oregon, USA. Ann. Assoc. Am. Geogr. 2010, 100, 938–952. [Google Scholar] [CrossRef]
- Balijepalli, C.; Oppong, O. Measuring vulnerability of road network considering the extent of serviceability of critical road links in urban areas. J. Transp. Geogr. 2014, 39, 145–155. [Google Scholar] [CrossRef]
- Lopez, P.A.; Michael, B.; Laura, B.; Jakob, E.; Yun-Pang, F.; Robert, H.; Leonhard, L.; Johannes, R.; Peter, W.; Evamarie, W. Microscopic Traffic Simulation Using Sumo. In Proceedings of the 2018 21st International Conference on Intelligent Transportation Systems (ITSC), IEEE, Maui, HI, USA, 4–7 November 2018; pp. 2575–2582. [Google Scholar]
- Costa, C.; Figueiredo, R.; Silva, V.; Bazzurro, P. Application of open tools and datasets to probabilistic modeling of road traffic disruptions due to earthquake damage. Earthq. Eng. Struct. Dyn. 2020, 49, 1236–1255. [Google Scholar] [CrossRef]
- Evans, B.; Albert, S.C.; Slobodan, D.; James, W.; Andoni, G.; John, S. Investigating the Effects of Pluvial Flooding and Climate Change on Traffic Flows in Barcelona and Bristol. Sustainability 2020, 12, 2330. [Google Scholar] [CrossRef] [Green Version]
- Hardy, M.; Wunderlich, K. Evacuation Management Operations (EMO) Modeling Assessment: Transportation Modeling Inventory, 2007. 2009. Available online: http://www.its.dot.gov/itspublicsafety/emo/index.htm (accessed on 12 January 2012).
- Zhou, X.; Taylor, J. DTALite: A queue-based mesoscopic traffic simulator for fast model evaluation and calibration. Cogent Eng. 2014, 1, 961345. [Google Scholar] [CrossRef]
- Adebisi, A. A Review of the Difference among Macroscopic, Microscopic and Mesoscopic Traffic Models; Florida A&M University: Tallahassee, FL, USA, 2017. [Google Scholar] [CrossRef]
- Kumar, P.; Merzouki, R.; Conrard, B.; Coelen, V.; Ould Bouamama, B. Multilevel Modeling of the Traffic Dynamic. IEEE Trans. Intell. Transp. Syst. 2014, 15, 1066–1082. [Google Scholar] [CrossRef]
- Smith, G.P.; Modra, B.D.; Tucker, T.A.; Cox, R.J. Vehicle Stability Testing for Floodflows [WWW Document]. 2017. Available online: http://www.wrl.unsw.edu.au/sites/wrl/files/uploads/PDF/WRL-TR2017-07-Vehicle-Stability-Testing-for-Flood-Flows.pdf (accessed on 24 January 2018).
- Haynes, K.; Coates, L.; van den Honert, R.; Gissing, A.; Bird, D.; Oliveira, F.; D’Arcy, R.; Smith, C.; Radford, D. Exploring the circumstances surrounding flood fatalities in Australia—1900–2015 and the implications for policy and practice. Environ. Sci. Policy 2017, 76, 165–176. [Google Scholar] [CrossRef]
- Shand, T.D.; Smith, G.P.; Cox, R.J.; Blacka, M. Development of Appropriate Criteria for the Safety and Stability of Persons and Vehicles in Floods. In Proceedings of the 34th World Congress of the International Association for Hydro-Environment Research and Engineering: 33rd Hydrology and Water Resources Symposium and 10th Conference on Hydraulics in Water Engineering, Brisbane, Australia, 26 June–1 July 2011; p. 404. [Google Scholar]
- Shahdani, F.; Santamaria-Ariza, M.; Coelho, M.; Sousa, H.; Matos, J. The Indirect Impact of Flooding on the Road Transport Network: A Case Study of Santarém Region in Portugal. In Proceedings of the 30th European Safety and Reliability Conference and the 15th Probabilistic Safety Assessment and Management Conference (ESREL2021), Angers, France, 19–23 September 2021. [Google Scholar]
- Ramos, C.; Reis, E. Floods in southern Portugal: Their physical and human causes, impacts and human response. Mitig. Adap. Strateg. Glob. Chang. 2002, 7, 267–284. [Google Scholar] [CrossRef] [Green Version]
- Santos, P.; Pereira, S.; Zezere, J.; Tavares, A.; Reis, E.; Garcia, R.; Oliveira, S. A comprehensive approach to understanding flood risk drivers at the municipal level. J. Environ. Manag. 2020, 260, 110127. [Google Scholar] [CrossRef] [PubMed]
- SNIRH. Sistema Nacional de Informação de Recursos Hídricos, Departamento de Monitorização de Recursos Hídricos da Agência Portuguesa do Ambiente (APA), I.P. Available online: https://snirh.apambiente.pt/ (accessed on 5 August 2021).
- Pregnolato, M.; Ford, A.; Robson, C.; Glenis, V.; Barr, S.; Dawson, R. Assessing urban strategies for reducing the impacts of Extreme weather on infrastructure networks. R. Soc. Open Sci. 2016, 3, 160023. [Google Scholar] [CrossRef] [PubMed] [Green Version]
- FEDRO. Natural Hazards on National Roads: Risk Concept. Methodology for Risk-Based Assessment, Prevention and Response to Gravitative Natural Hazards on National Roads. In Proceedings of the 12th Congress INTERPRAEVENT, Grenoble, France, 23–26 April 2012. [Google Scholar]
- Chiu, Y.; Bottom, J.; Mahut, M.; Paz, A.; Balakrishna, R.; Waller, S.; Hicks, J. Dynamic traffic assignment: A primer. Transp. Res. Circ. E-C153 2011. [Google Scholar]
- Daganzo, C.F.; Sheffi, Y. On stochastic models of traffic assignment. Transp. Sci. 1977, 11, 253–274. [Google Scholar] [CrossRef] [Green Version]
- Wardrop, J.G. Road Paper. Some Theoretical Aspects of Road Traffic Research. Proc. Inst. Civ. Eng. 1952, 1, 325–362. [Google Scholar] [CrossRef]
- Bhat, C.R. A multiple discrete-continuous extreme value model: Formulation and application to discretionary time-use decisions. Transp. Res. Part B Methodol. 2005, 39, 679–707. [Google Scholar] [CrossRef] [Green Version]
- Bickel, P.; Friedrich, R.; Burgess, A.; Fagiani, P.; Hunt, A.; Jong, G.; Laird, J.; Lieb, C.; Lindberg, G.; Mackie, P. HEATCO. Developing Harmonised European Approaches for Transport Costing and Project Assessment, Deliverable 5, Proposal for Harmonised Guidelines; IER: Stuttgart, Germany, 2006. [Google Scholar]


| O/D | 1 | 2 | 3 | 4 | 5 | 6 | 7 | 8 | 9 | 10 |
|---|---|---|---|---|---|---|---|---|---|---|
| 1 | 0 (0) | 0 (0) | 0 (0) | 0 (5) | 49 (52) | 60 (51) | 0 (0) | 24 (27) | 0 (0) | 0 (0) |
| 2 | 0 (0) | 0 (12) | 0 (0) | 0 (0) | 0 (0) | 0 (0) | 0 (0) | 0 (0) | 0 (0) | 0 (0) |
| 3 | 0 (0) | 0 (0) | 0 (0) | 0 (0) | 0 (0) | 0 (0) | 0 (0) | 0 (0) | 0 (0) | 0 (0) |
| 4 | 0 (0) | 0 (0) | 0 (0) | 0 (0) | 0 (0) | 0 (0) | 0 (0) | 0 (0) | 0 (0) | 0 (0) |
| 5 | 49 (67) | 0 (0) | 0 (0) | 0 (0) | 0 (0) | 0 (0) | 0 (0) | 0 (0) | 0 (0) | 0 (0) |
| 6 | 60 (69) | 0 (0) | 0 (0) | 0 (0) | 0 (0) | 0 (0) | 0 (0) | 0 (0) | 0 (0) | 0 (0) |
| 7 | 0 (0) | 0 (0) | 0 (0) | 0 (0) | 0 (0) | 0 (0) | 0 (0) | 0 (0) | 0 (0) | 0 (0) |
| 8 | 24 (20) | 0 (0) | 0 (0) | 0 (0) | 0 (0) | 0 (0) | 0 (0) | 0 (0) | 0 (0) | 0 (0) |
| 9 | 0 (0) | 0 (0) | 0 (0) | 0 (0) | 0 (0) | 0 (0) | 0 (0) | 0 (0) | 0 (0) | 0 (0) |
| 10 | 0 (0) | 0 (0) | 0 (0) | 0 (0) | 0 (0) | 0 (0) | 0 (0) | 0 (0) | 0 (0) | 0 (0) |
| Flood Depth (m) | Maximum Vehicle Speed (km/h) |
|---|---|
| Depth < 0.1 | Road Speed Limit |
| 0.1 ≤ Depth < 0.3 | 20 |
| 0.3 ≤ Depth | 0 (Road Closed) |
| Number of Streets | Proportion to the Whole Network | Length of Streets (m) | Proportion to the Overall Length of the Network | |
|---|---|---|---|---|
| Closed streets | 38 | 0.6% | 231,798.4 | 2.8% |
| Reduced speed streets | 6 | 0.1% | 2330.7 | 0.02% |
| Travel Time | 8–9 h | 12–13 h | Overall (0–24 h) | |
|---|---|---|---|---|
| Dry condition (h) | 23,572.9 | 23,957.6 | 109,200.7 | |
| Flooded condition (h) | 26,431.7 | 31,539.3 | 130,854.4 | |
| Difference (h) | 2858.8 | 7581.7 | 21653.7 | |
| variation (%) | 12.1 | 32.1 | 20.0 | |
| With 10% delay | Vehicles percentage | 23.8 | 37.6 | 28.1 |
| Average delay/journey time (%) | 43.2 | 59.2 | 42.3 | |
| No variation vehicles (%) | 45.7 | 38.3 | 27.2 | |
| With 20% delay | Vehicles percentage | 21.6 | 23.7 | 10.3 |
| Average delay/journey time (%) | 43.6 | 47.9 | 56.8 | |
| No variation vehicles (%) | 43.2 | 37.8 | 33.4 | |
| With 50% delay | Vehicles percentage | 11.8 | 12.6 | 2.7 |
| Average delay/Journey time (%) | 61.5 | 67.9 | 127.9 | |
| Travel Distance | 8–9 h | 12–13 h | Overall (0–24 h) |
|---|---|---|---|
| Dry condition (km) | 1,639,482 | 1,729,737 | 21,384,880 |
| Flooded condition (km) | 2,038,912 | 2,829,310 | 23,492,319 |
| Difference (km) | 399,430 | 1,099,573 | 2,107,439 |
| Variation (%) | 24 | 64 | 10 |
| Vehicles with longer routes (%) | 11.7 | 18.3 | 16.2 |
| Rerouted vehicles (%) | 19.3 | 25.8 | 26.9 |
| Effect on Travel Time | Effect on Travel Distance | ||||
|---|---|---|---|---|---|
| Trip Duration | Dry Conditions | Flooded Conditions | Travelled Distance | Dry Conditions | Flooded Conditions |
| Sum (hours) | 109,201 | 137,883 | Sum (km) | 21,383,980 | 23,514,722 |
| Absolute difference (hours) | - | 28,682 | Absolute difference (km) | - | 2,130,742 |
| Relative increase (%) | - | 26 | Relative increase (%) | - | 10 |
Publisher’s Note: MDPI stays neutral with regard to jurisdictional claims in published maps and institutional affiliations. |
© 2022 by the authors. Licensee MDPI, Basel, Switzerland. This article is an open access article distributed under the terms and conditions of the Creative Commons Attribution (CC BY) license (https://creativecommons.org/licenses/by/4.0/).
Share and Cite
Shahdani, F.J.; Santamaria-Ariza, M.; Sousa, H.S.; Coelho, M.; Matos, J.C. Assessing Flood Indirect Impacts on Road Transport Networks Applying Mesoscopic Traffic Modelling: The Case Study of Santarém, Portugal. Appl. Sci. 2022, 12, 3076. https://doi.org/10.3390/app12063076
Shahdani FJ, Santamaria-Ariza M, Sousa HS, Coelho M, Matos JC. Assessing Flood Indirect Impacts on Road Transport Networks Applying Mesoscopic Traffic Modelling: The Case Study of Santarém, Portugal. Applied Sciences. 2022; 12(6):3076. https://doi.org/10.3390/app12063076
Chicago/Turabian StyleShahdani, Fereshteh Jafari, Mónica Santamaria-Ariza, Hélder S. Sousa, Mário Coelho, and José C. Matos. 2022. "Assessing Flood Indirect Impacts on Road Transport Networks Applying Mesoscopic Traffic Modelling: The Case Study of Santarém, Portugal" Applied Sciences 12, no. 6: 3076. https://doi.org/10.3390/app12063076
APA StyleShahdani, F. J., Santamaria-Ariza, M., Sousa, H. S., Coelho, M., & Matos, J. C. (2022). Assessing Flood Indirect Impacts on Road Transport Networks Applying Mesoscopic Traffic Modelling: The Case Study of Santarém, Portugal. Applied Sciences, 12(6), 3076. https://doi.org/10.3390/app12063076