
Machine Learning Approach for Personality Recognition in Spanish Texts


Abstract
:
1. Introduction
1.1. Related Work
1.2. The DISC Model of Personality
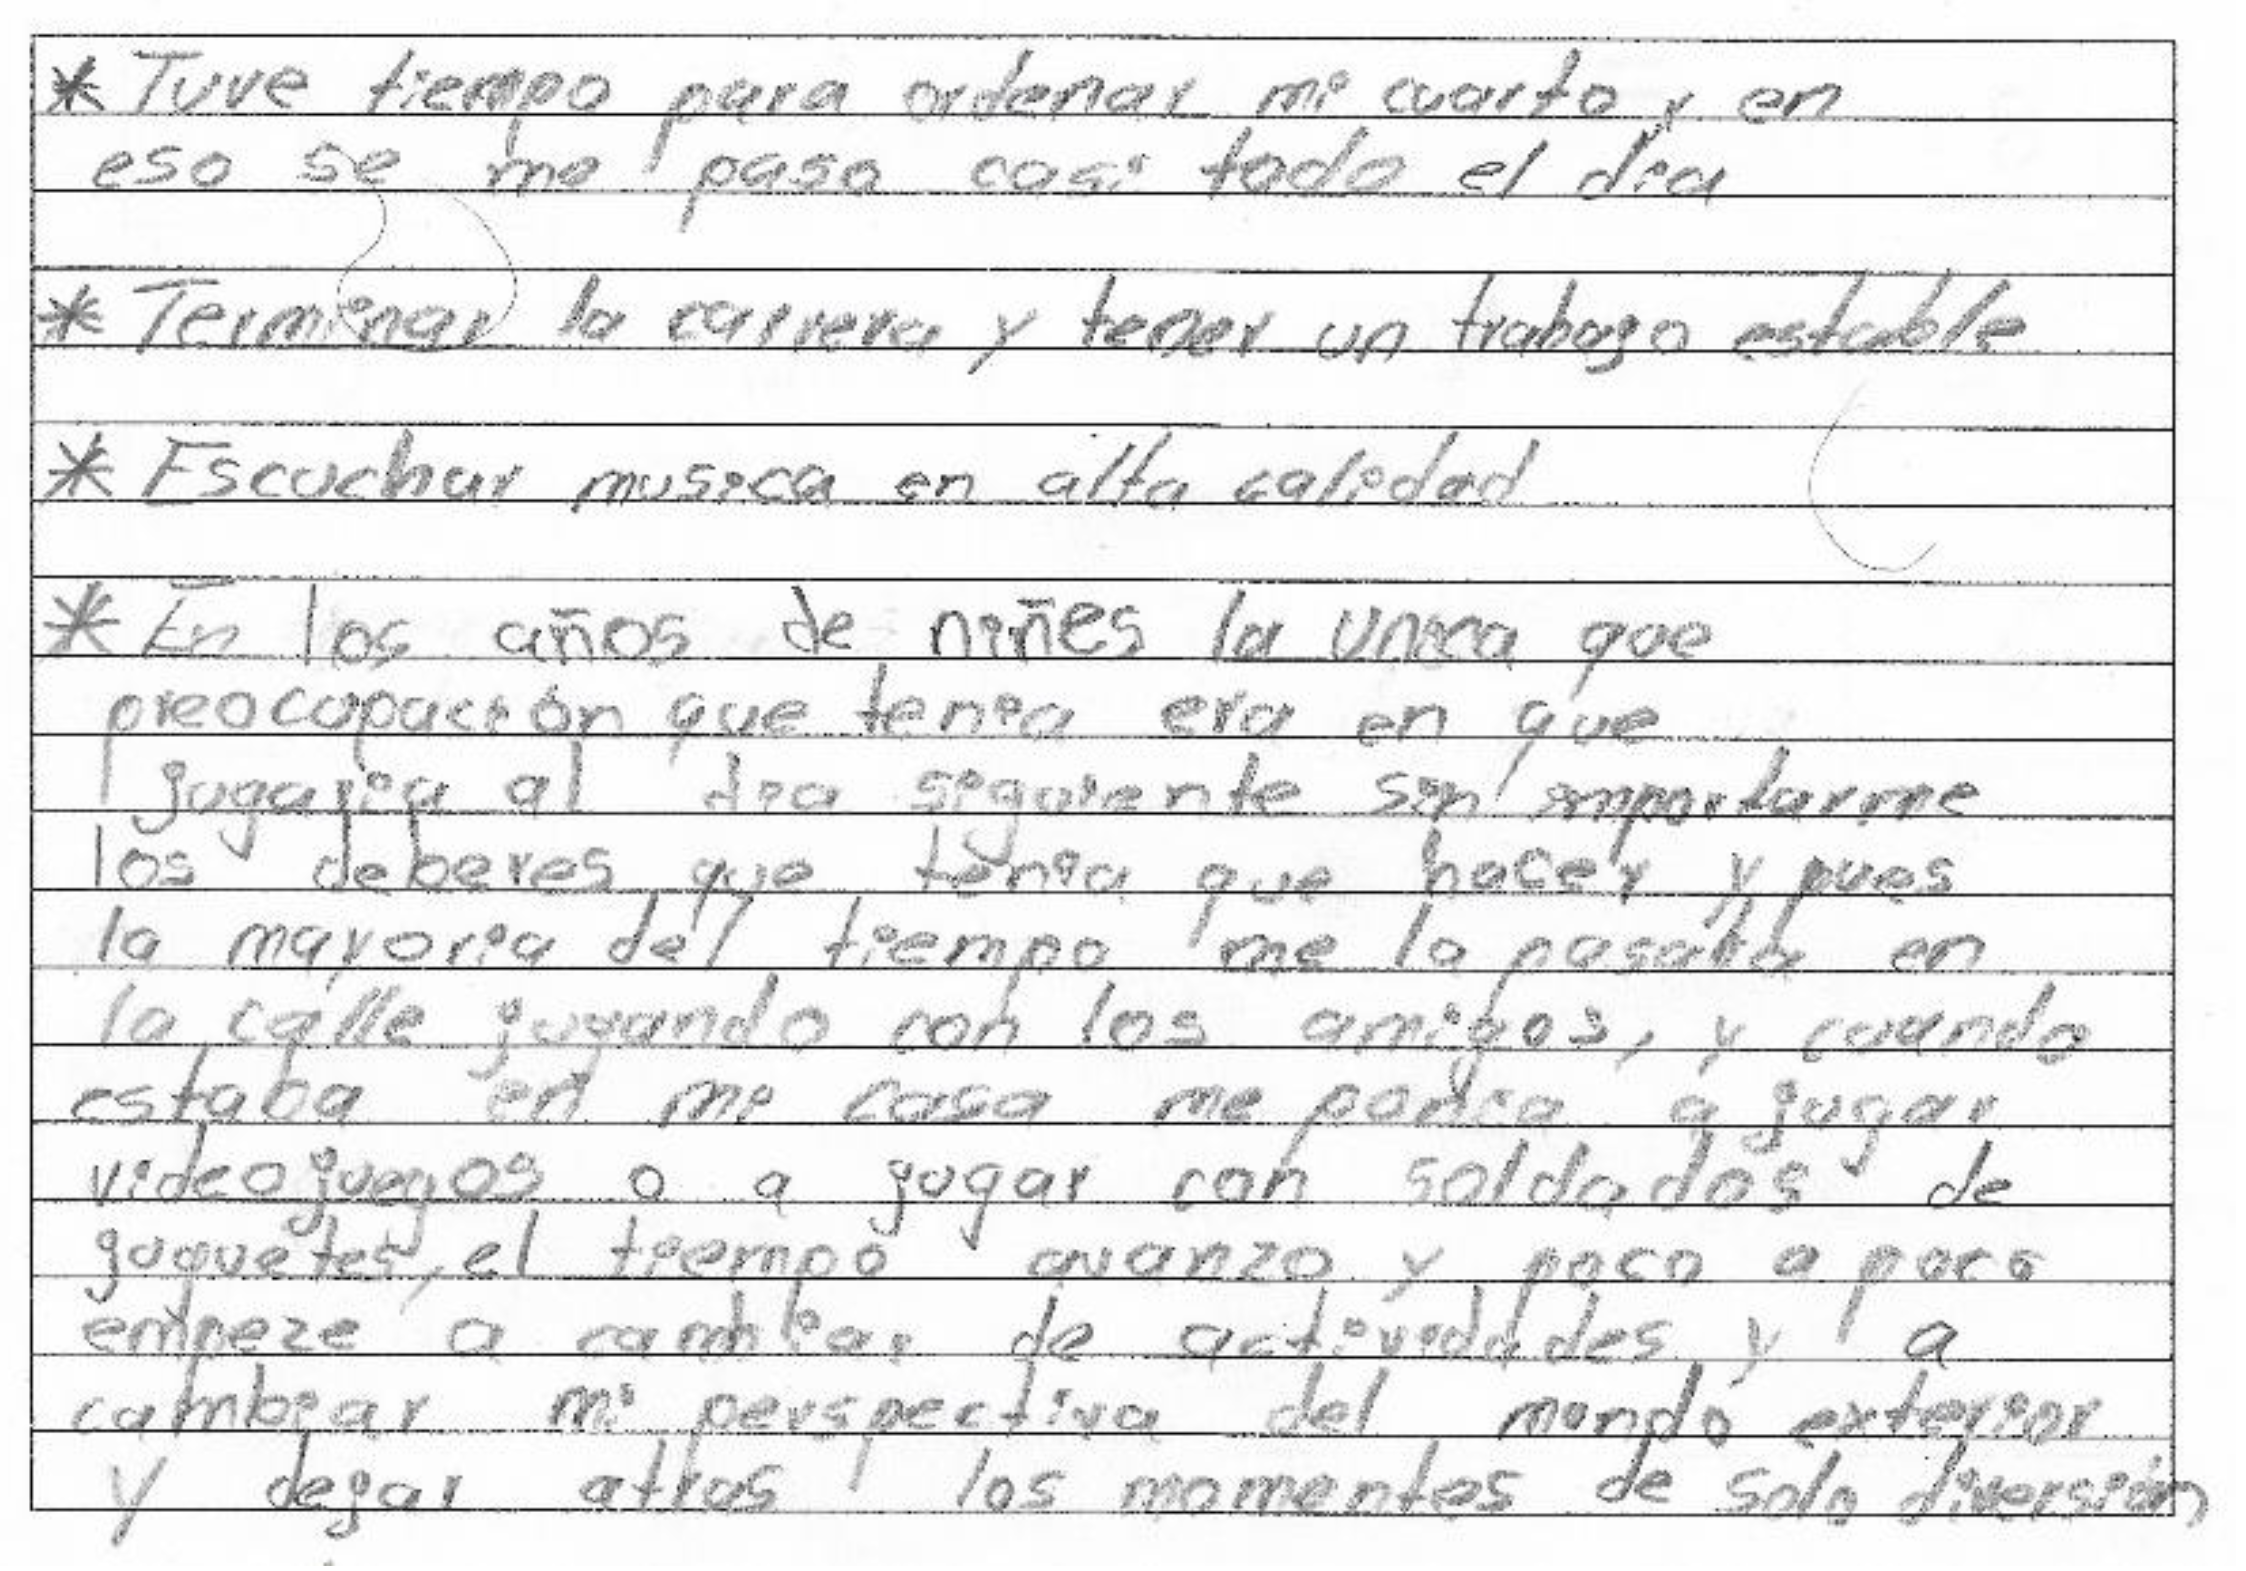
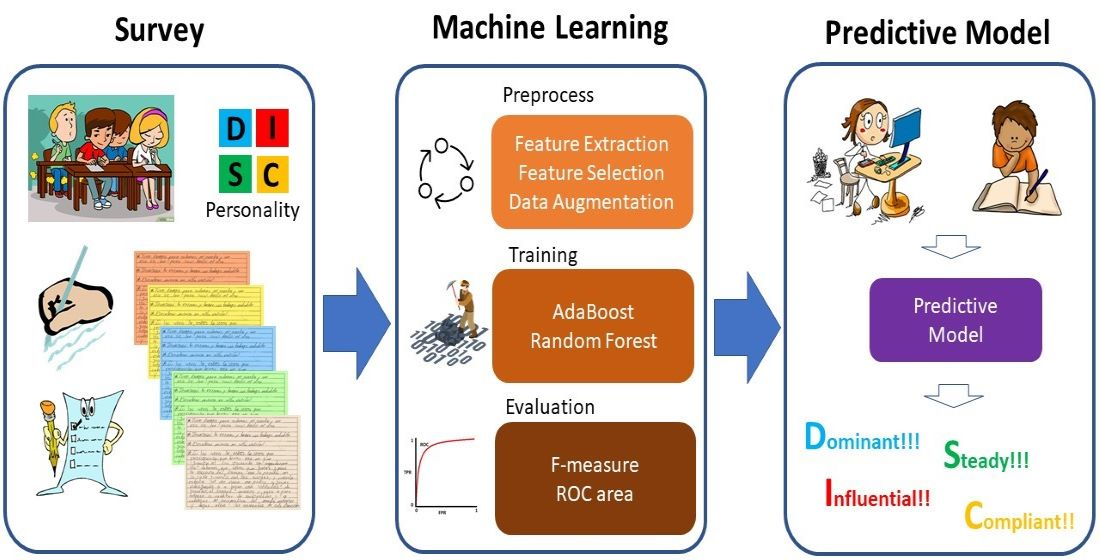
2. Personality Survey to Gather Data
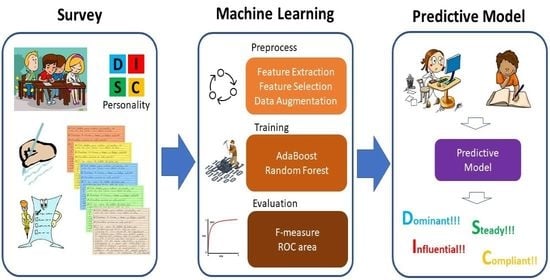
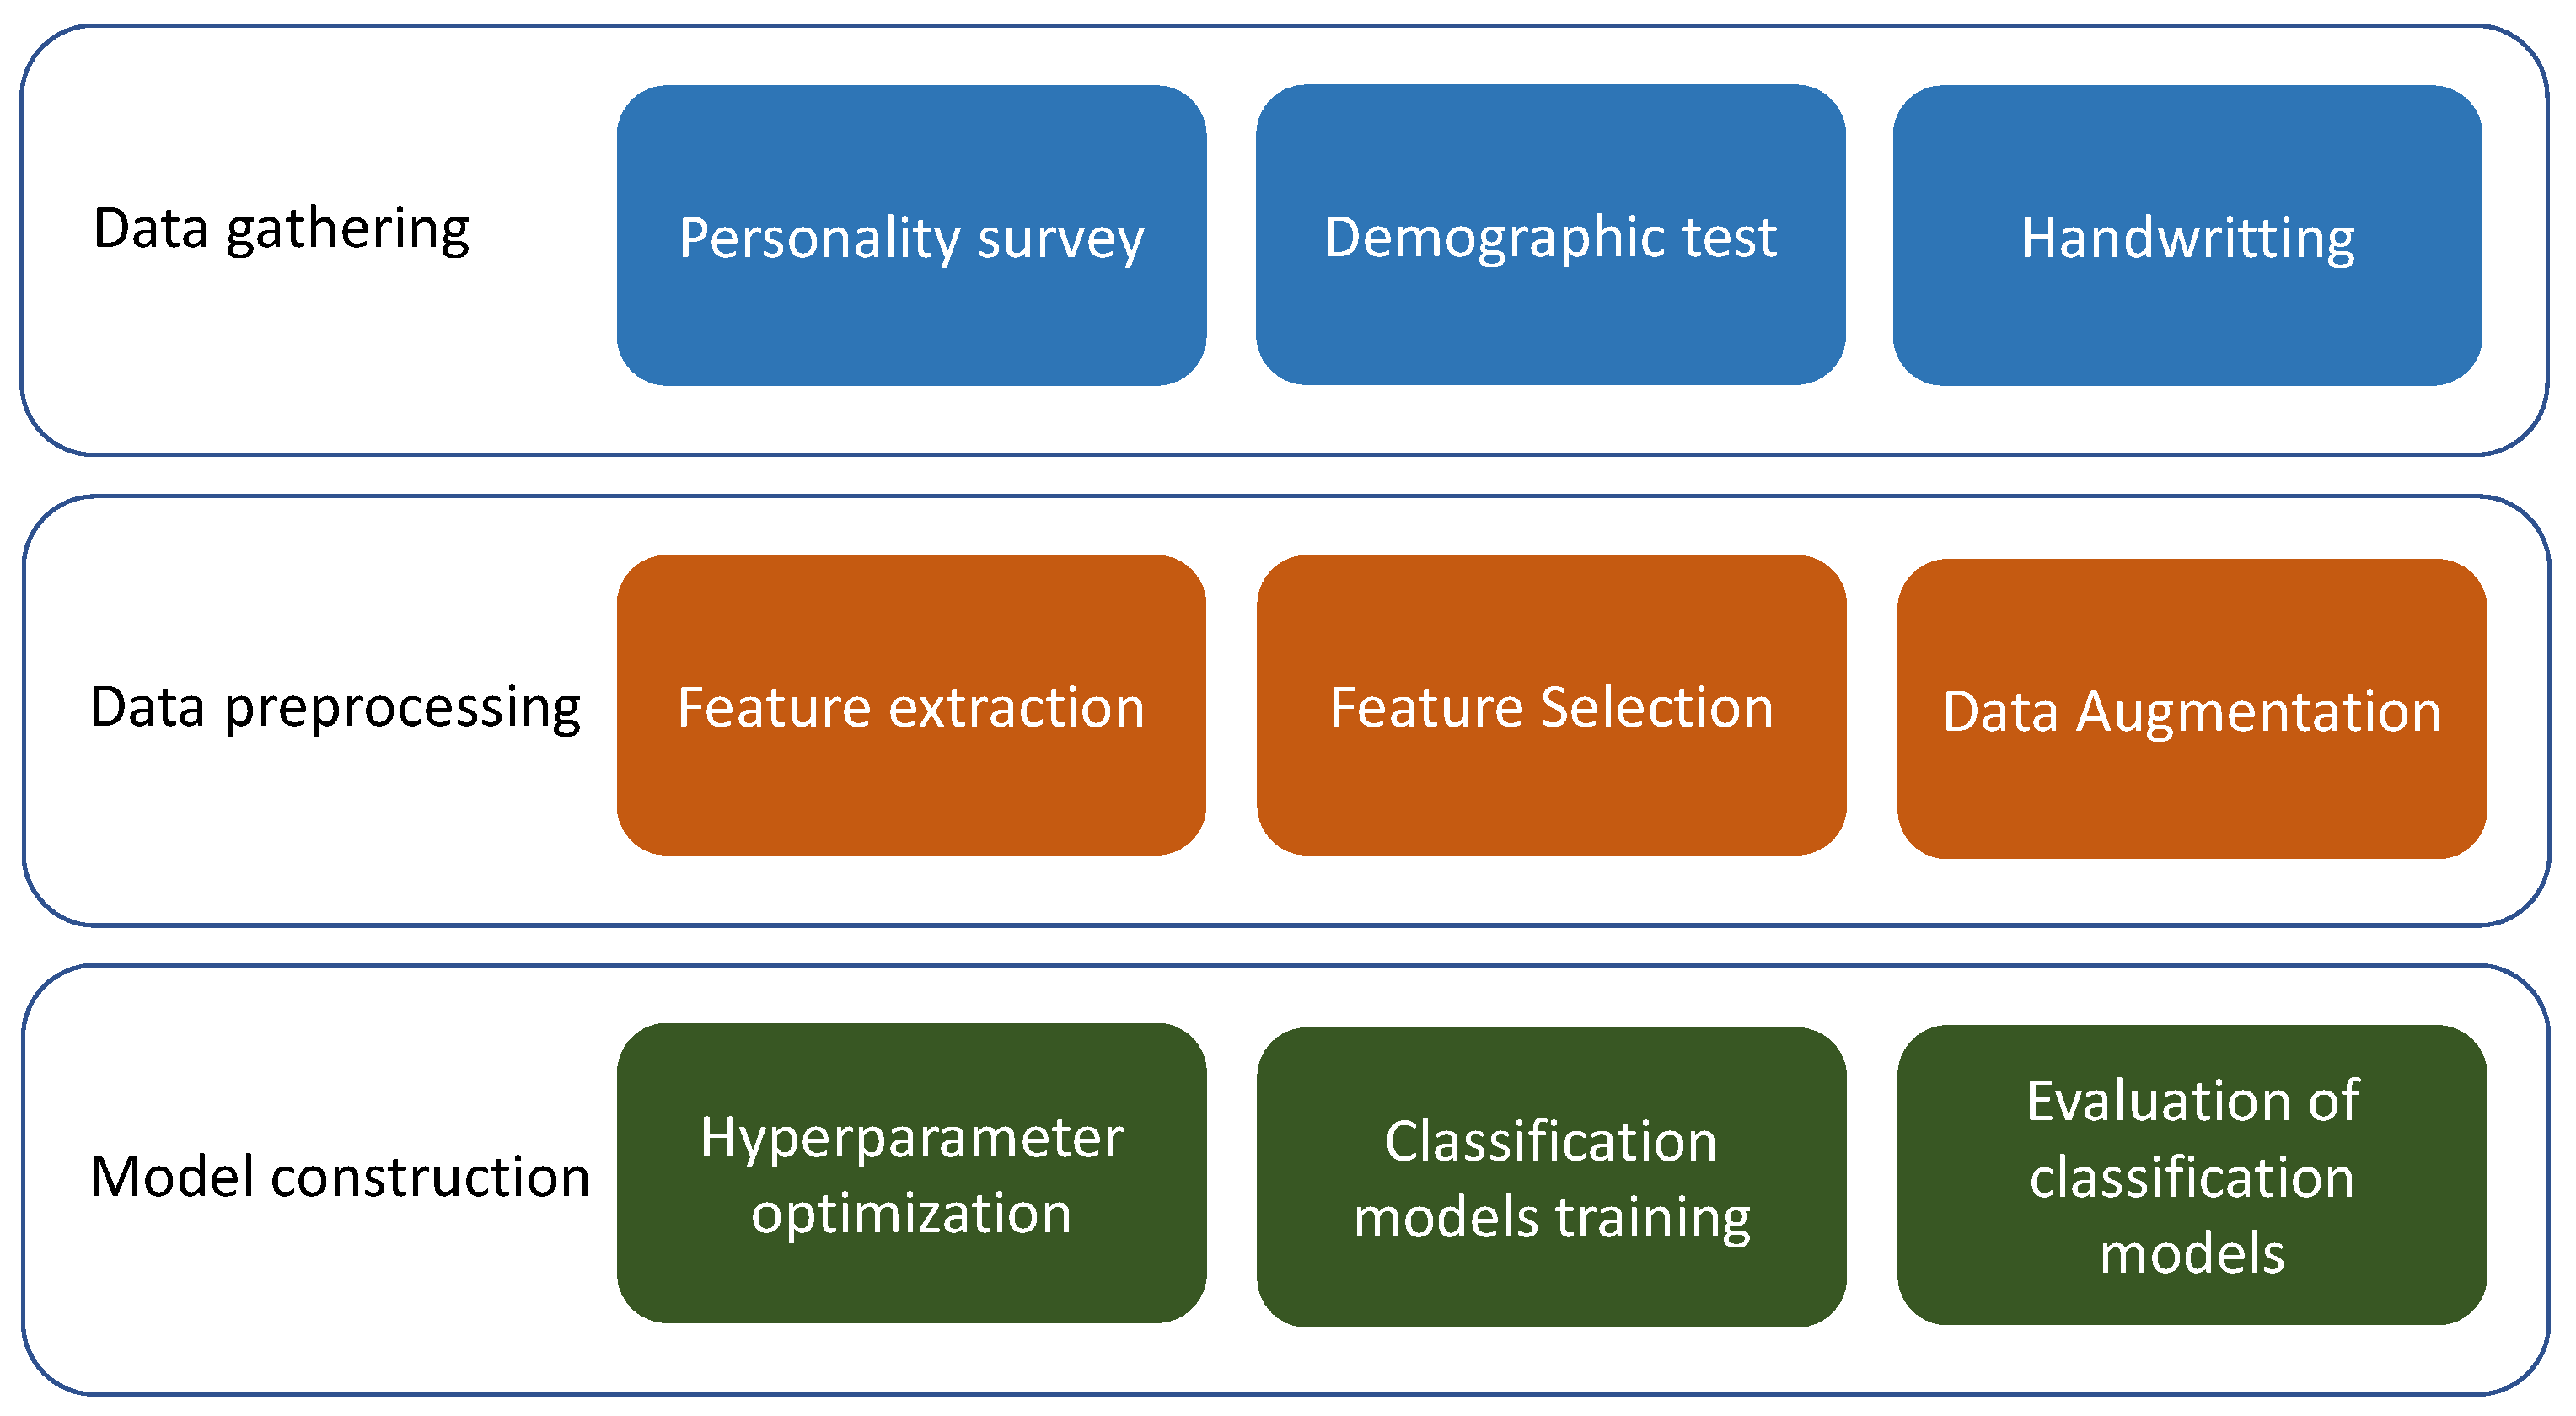
3. Supervised Learning Model to Classify Texts
3.1. Feature Extraction
3.2. Feature Selection
3.3. Data Augmentation
3.4. Datasets
3.5. Hyperparameter Optimization
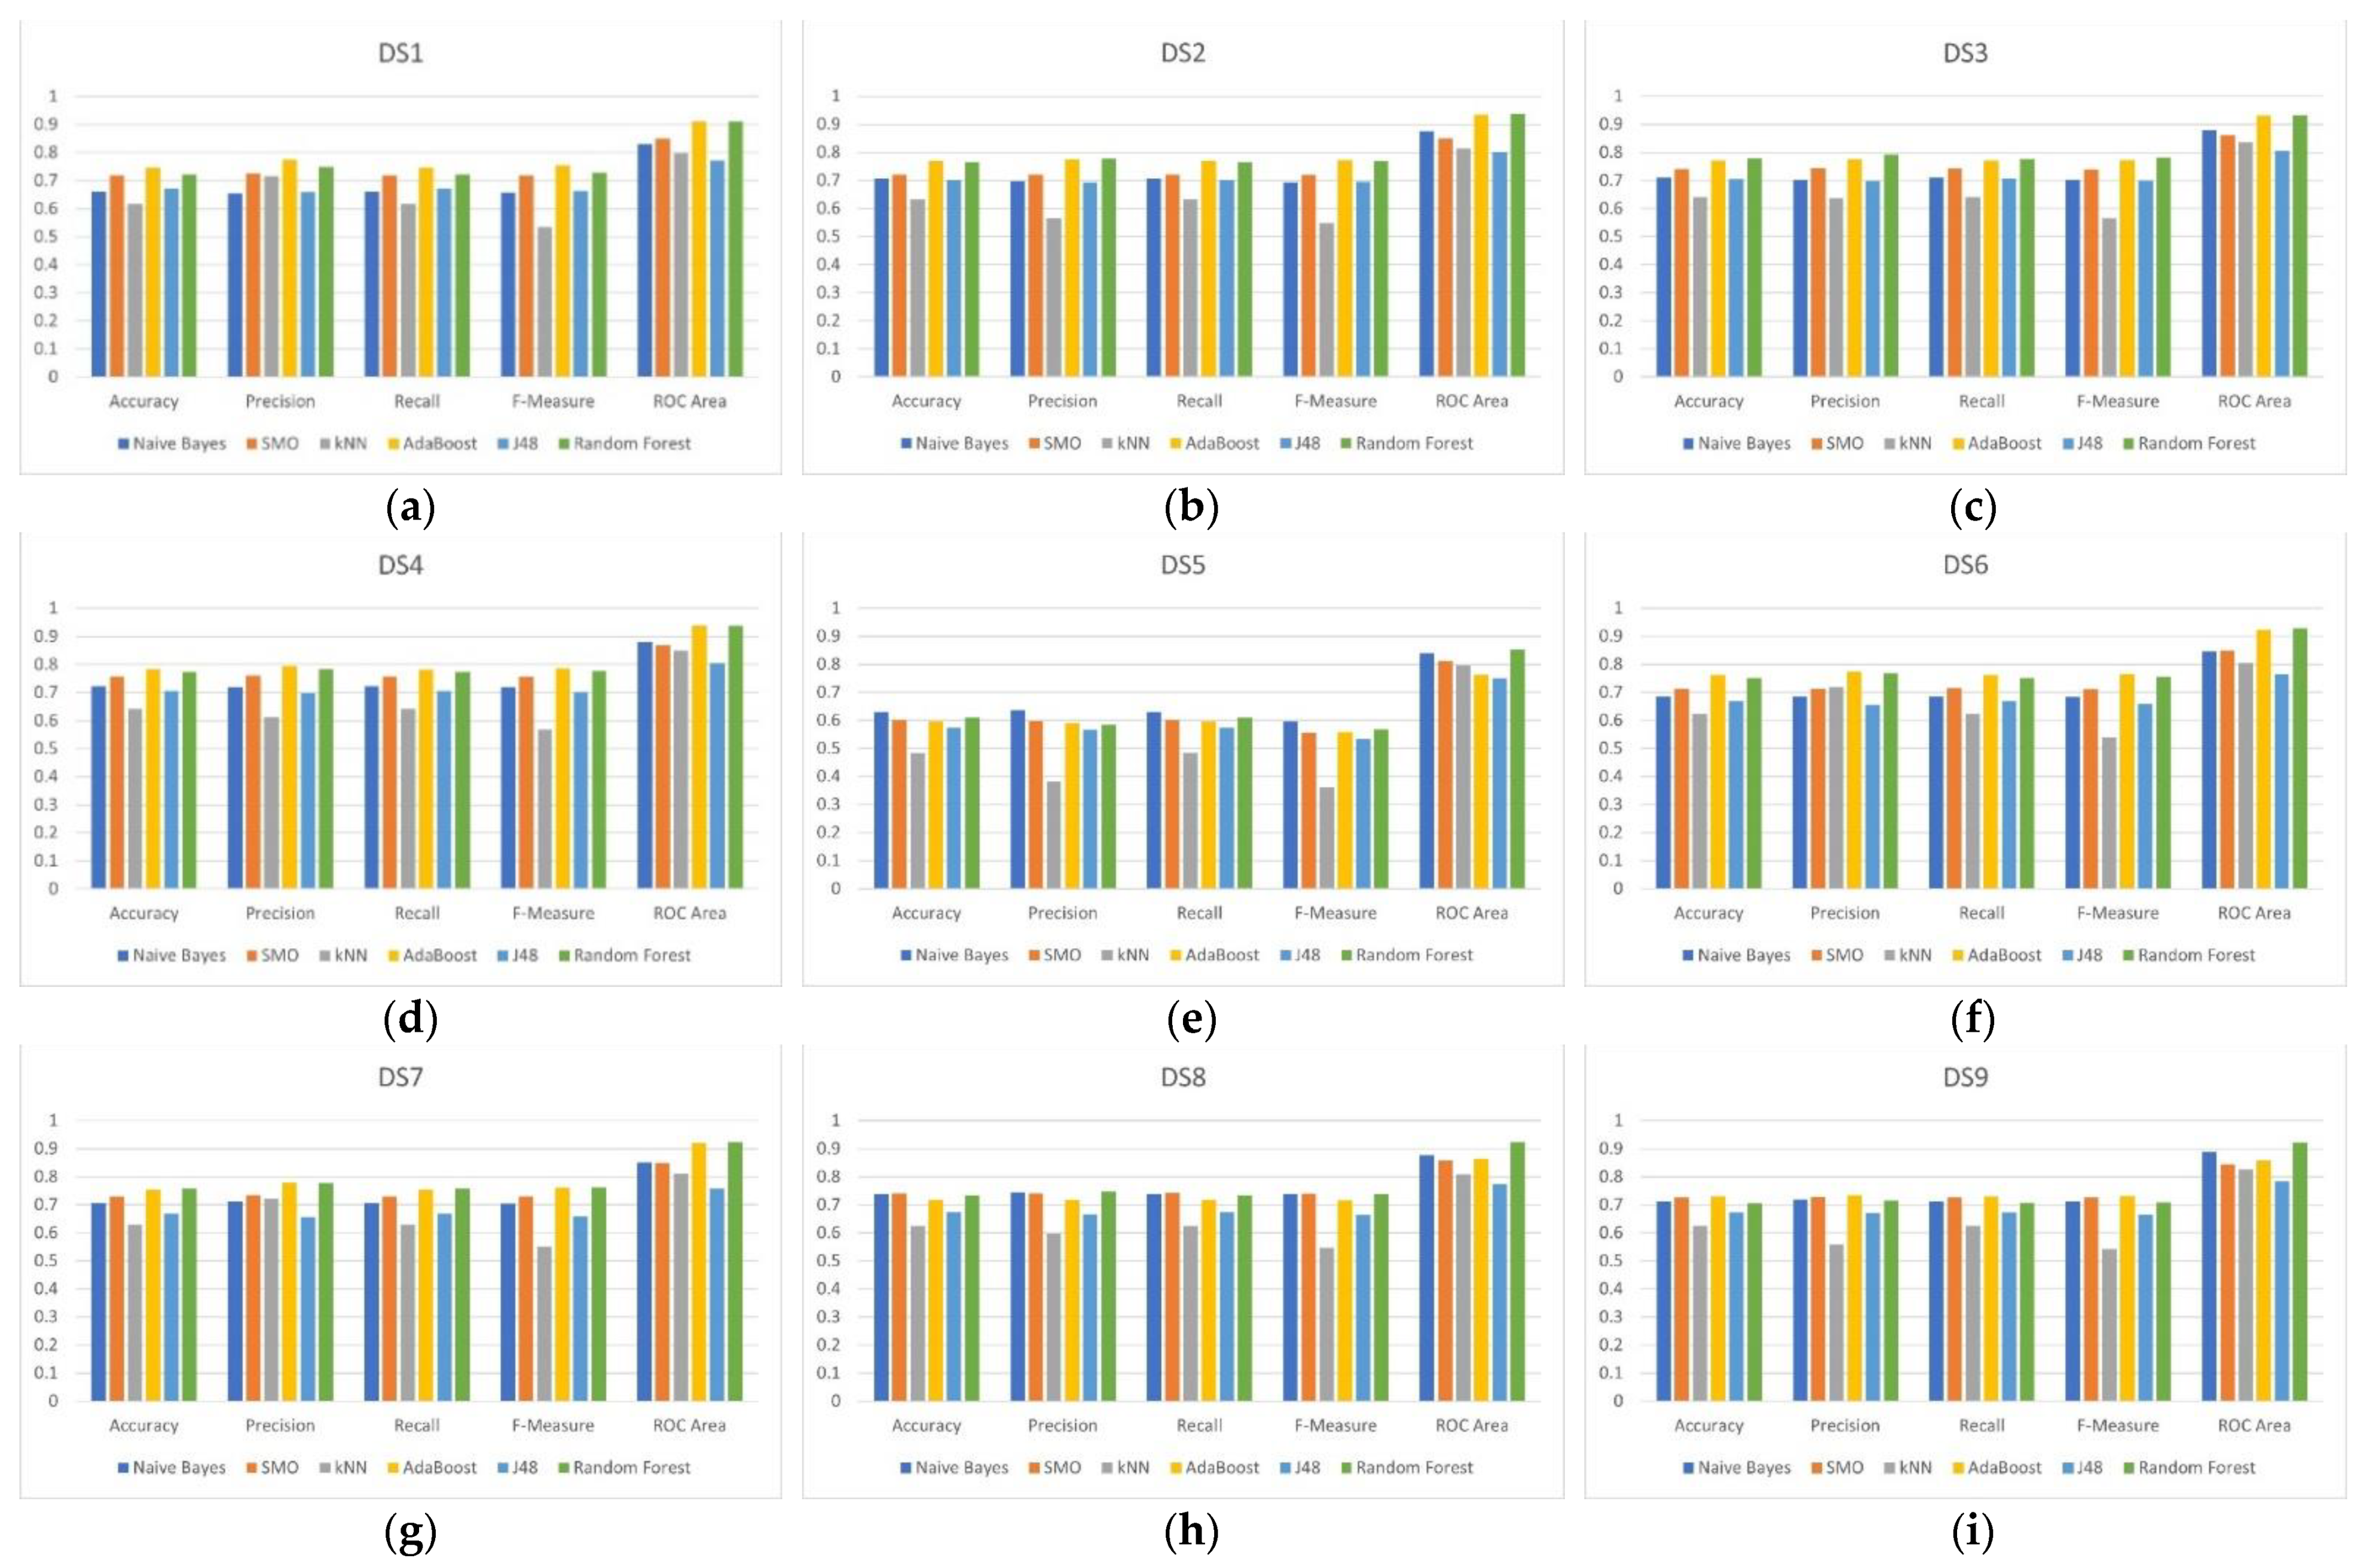
4. Results
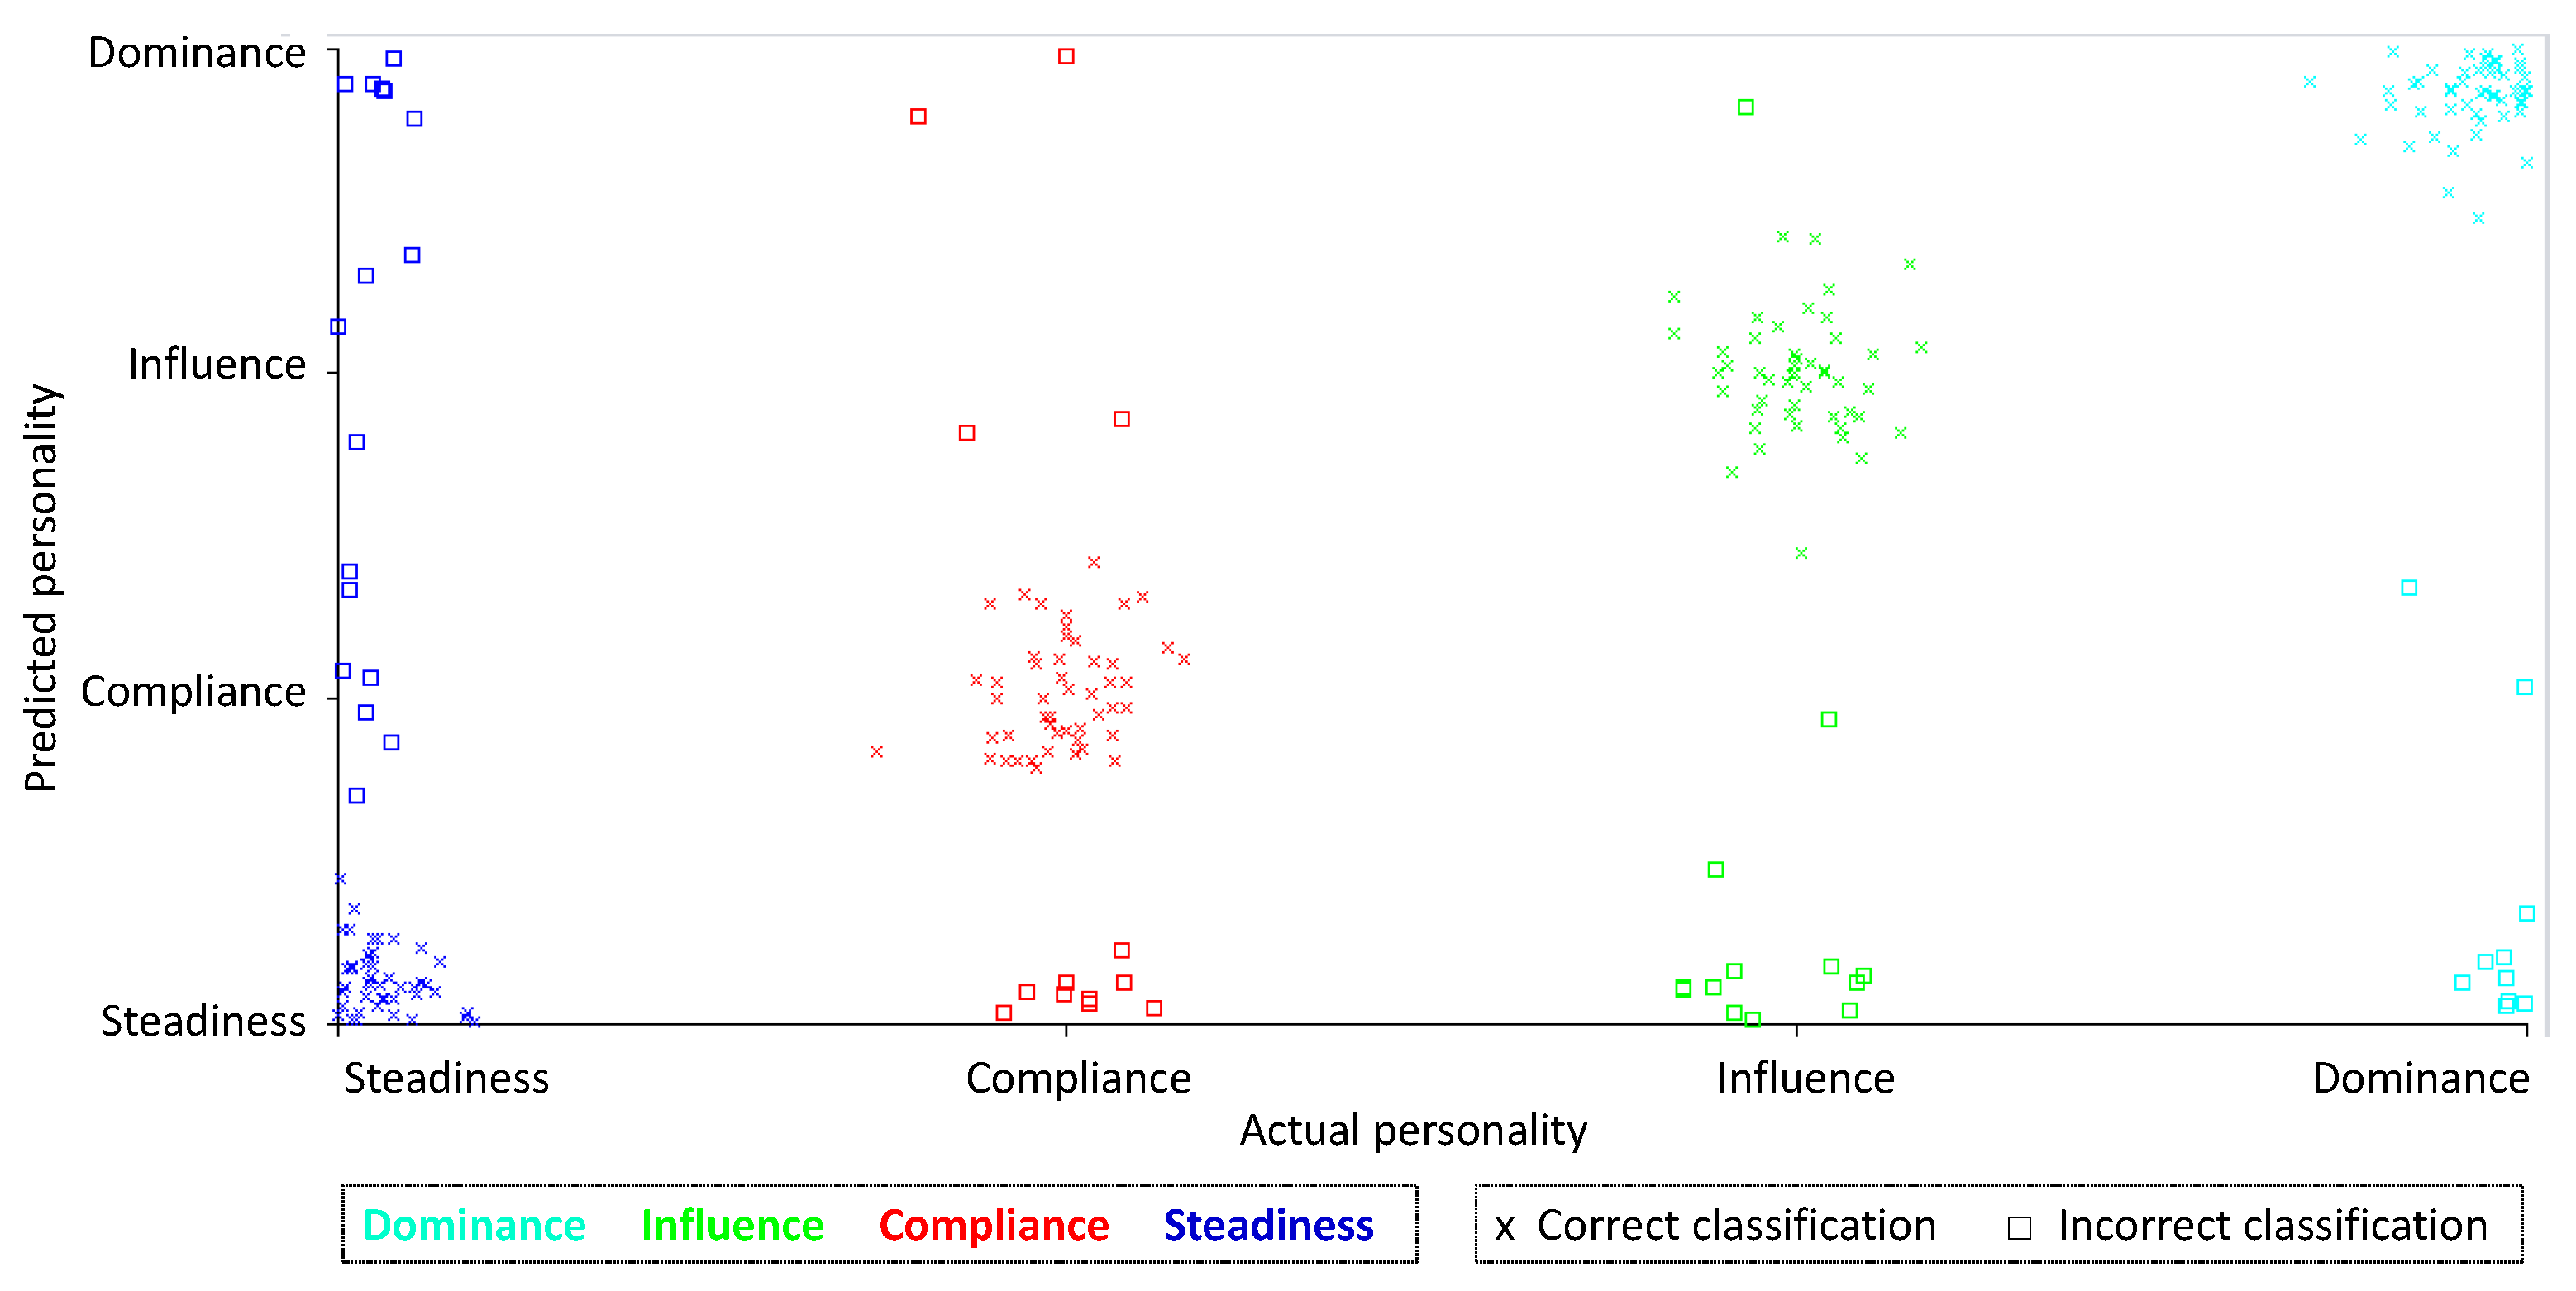
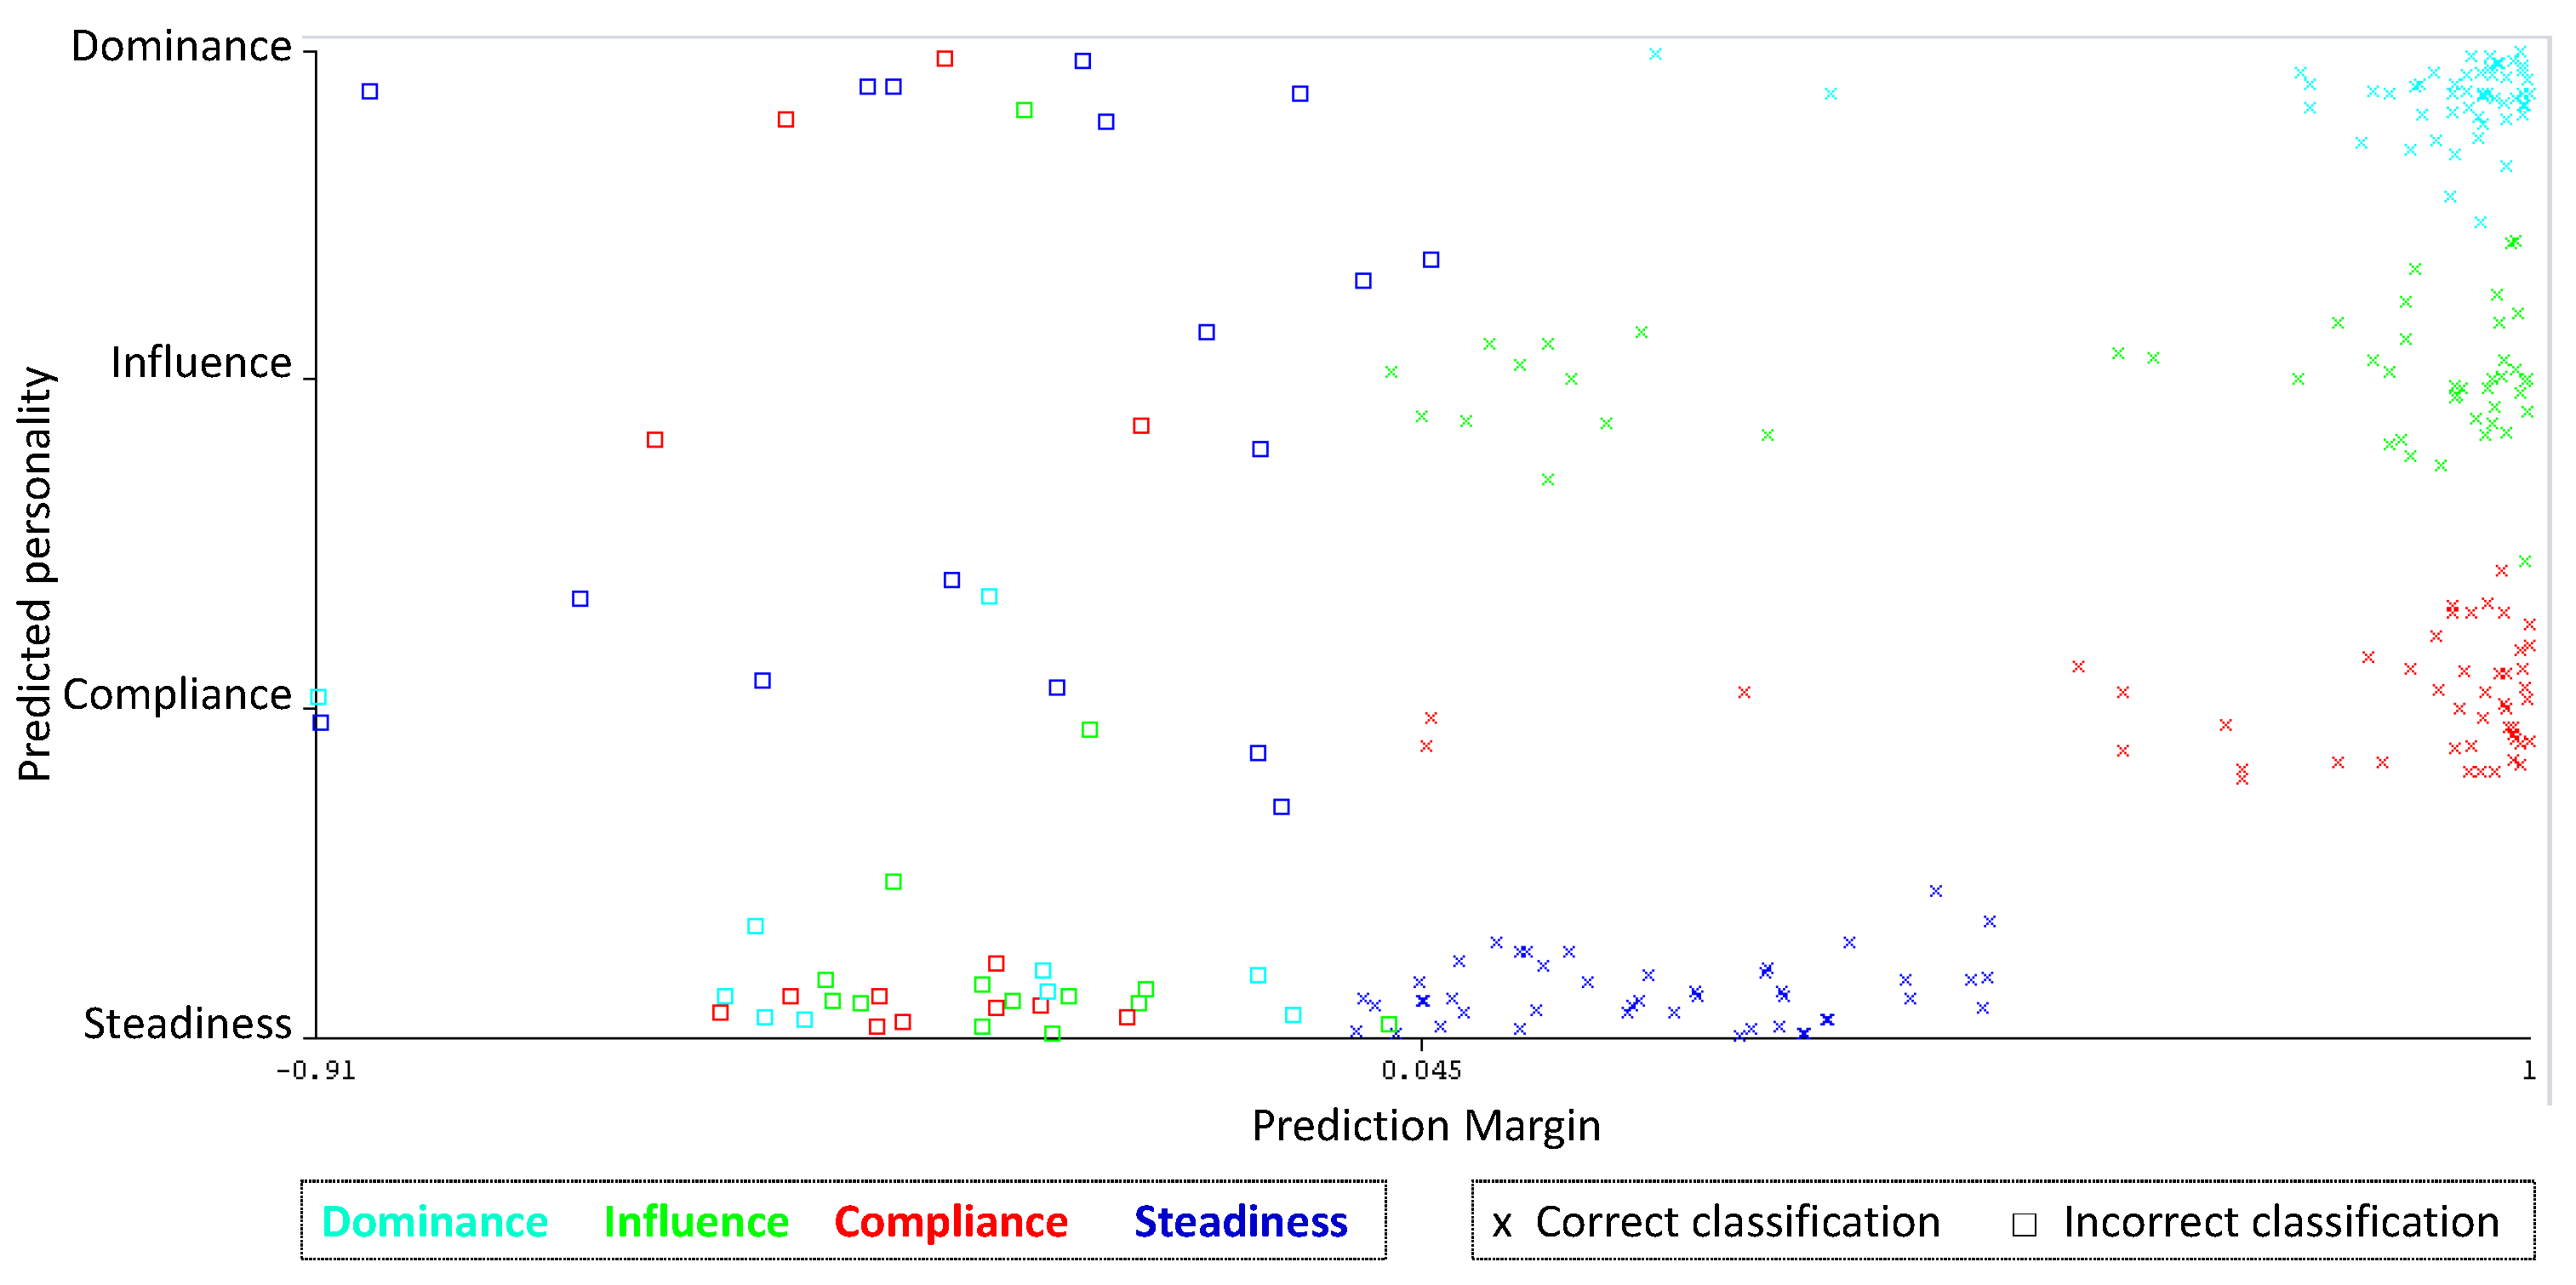
Error Analysis
5. Discussion
Author Contributions
Funding
Institutional Review Board Statement
Informed Consent Statement
Data Availability Statement
Conflicts of Interest
References
- Bromme, L.; Rothmund, T.; Azevedo, F. Mapping political trust and involvement in the personality space—A meta-analysis and new evidence. J. Pers. 2022, 1–27. [Google Scholar] [CrossRef] [PubMed]
- Stachl, C.; Au, Q.; Schoedel, R.; Gosling, S.D.; Harari, G.M.; Buschek, D.; Völkel, S.T.; Schuwerk, T.; Oldemeier, M.; Ullmann, T.; et al. Predicting personality from patterns of behavior collected with smartphones. Proc. Natl. Acad. Sci. USA 2020, 117, 17680–17687. [Google Scholar] [CrossRef] [PubMed]
- Christian, H.; Suhartono, D.; Chowanda, A.; Zamli, K.Z. Text based personality prediction from multiple social media data sources using pre-trained language model and model averaging. J. Big Data 2021, 8, 68. [Google Scholar] [CrossRef]
- Costa, P.T.; McCrae, R.R. Four ways five factors are basic. Pers. Individ. Dif. 1992, 13, 653–665. [Google Scholar] [CrossRef]
- Eysenck, H.J. Dimensions of Personality, 1st ed.; Routledge: New Brunswick, NJ, USA; London, UK, 1997. [Google Scholar]
- Marston, W.M. Emotions of Normal People; Harcourt Brace & Company: New York, NY, USA, 1928. [Google Scholar] [CrossRef]
- Moreno, J.D.; Martínez-Huertas, J.; Olmos, R.; Jorge-Botana, G.; Botella, J. Can personality traits be measured analyzing written language? A meta-analytic study on computational methods. Pers. Individ. Dif. 2021, 177, 110818. [Google Scholar] [CrossRef]
- Amirhosseini, M.H.; Kazemian, H. Machine learning approach to personality type prediction based on the Myers–Briggs type indicator®. Multimodal Technol. Interact. 2020, 4, 9. [Google Scholar] [CrossRef] [Green Version]
- Fu, J.; Zhang, H. Personality trait detection based on ASM localization and deep learning. Sci. Program. 2021, 2021, 5675917. [Google Scholar] [CrossRef]
- Witten, I.H.; Frank, E.; Hall, M.A.; Pal, C.J. Data Mining: Practical Machine Learning Tools and Techniques, 4th ed.; Morgan Kaufmann: Cambridge, UK, 2017. [Google Scholar]
- John, G.H.; Langley, P. Estimating Continuous Distributions in Bayesian Classifiers. In Eleventh conference on Uncertainty in Artificial Intelligence, UAI’95; ACM: New York, NY, USA, 1995; pp. 338–445. [Google Scholar] [CrossRef]
- Platt, J.C. Sequential Minimal Optimization: A Fast Algorithm for Training Support Vector Machines. MSRTR Microsoft Res. 1998, 3, 88–95. [Google Scholar]
- Aha, D.W.; Kibler, D.; Albert, M.K. Instance-based learning algorithms. Mach. Learn. 1991, 6, 37–66. [Google Scholar] [CrossRef] [Green Version]
- Freund, Y.; Schapire, R.E. Experiments with a New Boosting Algorithm. In Proceedings of the 13th International Conference on Machine Learning, Bari, Italy, 3–6 July 1996; pp. 148–156. [Google Scholar]
- Quinlan, J.R. C4.5: Programs for Machine Learning, 1st ed.; Morgan Kaufmann: San Mateo, CA, USA, 1993. [Google Scholar]
- Breiman, L. Random Forests. Mach. Learn. 2001, 45, 5–32. [Google Scholar] [CrossRef] [Green Version]
- Srinarong, N.; Mongkolnavin, J. A Development of Personality Recognition Model from Conversation Voice in Call Center Context. In ACM International Conference Proceeding Series; Association for Computing Machinery: Bangkok, Thailand, 2021; pp. 1–5. [Google Scholar] [CrossRef]
- Adi, G.Y.N.N.; Tandio, M.H.; Ong, V.; Suhartono, D. Optimization for Automatic Personality Recognition on Twitter in Bahasa Indonesia. Procedia Comput. Sci. 2018, 135, 473–480. [Google Scholar] [CrossRef]
- Ren, Z.; Shen, Q.; Diao, X.; Xu, H. A sentiment-aware deep learning approach for personality detection from text. Inf. Process. Manag. 2021, 58, 102532. [Google Scholar] [CrossRef]
- Xue, D.; Wu, L.; Hong, Z.; Guo, S.; Gao, L.; Wu, Z.; Zhong, X.; Sun, J. Deep learning-based personality recognition from text posts of online social networks. Appl. Intell. 2018, 48, 4232–4246. [Google Scholar] [CrossRef]
- Sher Khan, A.; Ahmad, H.; Zubair Asghar, M.; Khan Saddozai, F.; Arif, A.; Ali Khalid, H. Personality Classification from Online Text using Machine Learning Approach. Int. J. Adv. Comput. Sci. Appl. 2020, 11, 460–476. [Google Scholar]
- Agung, A.A.G.; Yuniar, I. Personality assessment website using DISC: A case study in information technology school. In Proceedings of the 2016 International Conference on Information Management and Technology (ICIMTech), Bandung, Indonesia, 16–18 November 2016; pp. 72–77. [Google Scholar] [CrossRef]
- Milne, N.; Louwen, C.; Reidlinger, D.; Bishop, J.; Dalton, M.; Crane, L. Physiotherapy students’ DiSC behaviour styles can be used to predict the likelihood of success in clinical placements. BMC Med. Educ. 2019, 19, 1–15. [Google Scholar] [CrossRef]
- Chigova, E.A.; Plyushch, I.V.; Leskova, I.V. Organization of structured interaction on the base of psychographic characteristics within the model of personality traits DISC. IOP Conf. Ser. Mater. Sci. Eng. 2019, 483, 012097. [Google Scholar] [CrossRef]
- Jarvis, S. Grounding lexical diversity in human judgments. Lang. Test. 2017, 34, 537–553. [Google Scholar] [CrossRef]
- Bougé, K. Download Stop Words. Available online: https://sites.google.com/site/kevinbouge/stopwords-lists (accessed on 28 January 2022).
- Anthony, L. Programming for Corpus Linguistics. In A Practical Handbook of Corpus Linguistics; Paquot, M., Gries, S.T., Eds.; Springer: Cham, Switzerland, 2020; pp. 181–207. [Google Scholar] [CrossRef]
- Padró, L.; Stanilovsky, E. FreeLing 3.0: Towards Wider Multilinguality. In Proceedings of the Eighth International Conference on Language Resources and Evaluation (LREC’12), Istanbul, Turkey, 21–27 May 2012; European Language Resources Association: Paris, France, 2012; pp. 2473–2479. [Google Scholar]
- Goldberg, Y. Neural Network Methods for Natural Language Processing; Morgan & Claypool: Williston, VT, USA, 2017. [Google Scholar] [CrossRef]
- Hall, M.A. Correlation-based Feature Selection for Machine Learning. Ph.D. Thesis, University of Waikato, Hamilton, New Zealand, 1999. [Google Scholar]
- Sharma, A.; Dey, S. Performance Investigation of Feature Selection Methods and Sentiment Lexicons for Sentiment Analysis. IJCA Spec. Issue Adv. Comput. Commun. Technol. HPC Appl. 2012, 3, 15–20. [Google Scholar]
- Kohavi, R.; John, G.H. Wrappers for feature subset selection. Artif. Intell. 1997, 97, 273–324. [Google Scholar] [CrossRef] [Green Version]
- Chawla, N.V.; Bowyer, K.W.; Hall, L.O.; Kegelmeyer, W.P. SMOTE: Synthetic Minority Over-sampling Technique. J. Artif. Intell. Res. 2002, 16, 321–357. [Google Scholar] [CrossRef]
- Schratz, P.; Muenchow, J.; Iturritxa, E.; Richter, J.; Brenning, A. Hyperparameter tuning and performance assessment of statistical and machine-learning algorithms using spatial data. Ecol. Modell. 2019, 406, 109–120. [Google Scholar] [CrossRef] [Green Version]
- Sarker, I.H. Machine Learning: Algorithms, Real-World Applications and Research Directions. SN Comput. Sci. 2021, 2, 160. [Google Scholar] [CrossRef] [PubMed]
- Powers, D.M.W. Evaluation: From Precision, Recall And F-Measure to Roc, Informedness, Markedness & Correlation. J. Mach. Learn. Technol. 2011, 2, 37–63. [Google Scholar]
- Hernández, Y.; Arroyo-Figueroa, G.; Sucar, L.E. A model of affect and learning for intelligent tutors. J. Univers. Comput. Sci. 2015, 21, 912–934. [Google Scholar] [CrossRef]
- Bestgen, Y.; Granger, S. Quantifying the development of phraseological competence in L2 English writing: An automated approach. J. Second Lang. Writ. 2014, 26, 28–41. [Google Scholar] [CrossRef]
- Wołk, A.; Chlasta, K.; Holas, P. Hybrid approach to detecting symptoms of depression in social media entries. arXiv 2021, arXiv:2106.10485. [Google Scholar]

| Group 1 | Group 2 | Group 3 | Group 4 |
|---|---|---|---|
| Extroverted | Sociable | Analytical | Daring |
| Cautious | Impulsive | Bold | Conscientious |
| Persistent | Determined | Loyal | Talkative |
| Impatient | Calm | Helpful | Moderate |
| Gender | Schooling | Civil Status | Occupation | Preferred SN | Friends in Preferred SN 1 | Personality | |
|---|---|---|---|---|---|---|---|
| 1 | Male | College | College | Student | 120 | Dominance | |
| 2 | Female | College | College | Student | 1150 | Influence | |
| 3 | Male | High School | College | Student | 100 | Steadiness | |
| 4 | Female | College | Married | Student | 80 | Compliance |
| Personality | Women | Men | Total |
|---|---|---|---|
| Dominance | 8 | 6 | 14 |
| Influence | 10 | 16 | 26 |
| Steadiness | 24 | 38 | 62 |
| Compliance | 7 | 11 | 18 |
| 49 | 71 | 120 |
| Original | Translated |
|---|---|
| El día de ayer domingo me desperté muy tarde, como a las 10, desperté muy contenta porque como soy foránea únicamente convivo con mis familiares los fines de semana, desperté y encendí la televisión e hice uno de mis pasatiempos favoritos: ver televisión en un canal de animales, me gustan mucho, después llego mi hermana con mi sobrina y junto con ellas seguimos aprendiendo sobre animales, después nos fuimos a almorzar con mi familia completa, después nos pusimos a jugar con mis sobrinos y hermana lotería, después comimos todos juntos y nos pasamos al patio de la casa a ayudar a pintar la casa de una tía, después recordé que hay tarea, encendí la computadora para hacerla, comencé con lo que más me gusta: programación, redes, etc.. Suspendí la computadora para bañarme y después intenté terminar la tarea finalmente se terminó el domingo y mi hermana se fue. | On Sunday, I woke up very late, about 10 o’clock. I woke up very happy because I am from another town, I only live with my family on weekends. I woke up and turned on the television and did one of my favorite hobbies: watch an animal channel. I like it very much. Then my sister arrived with my niece, and I continued learning about animals with them. Then we went to have lunch with my whole family. Then we started playing lotería, a table game, with my nieces and nephews, and my sister. Then we all had lunch together and we went to the patio of my aunt to help paint the house. Later, I remembered I had homework. I turned on the computer to do it. I started with what I like the most: programming, networks, etc. I put the computer in energy saving mode to take a bath, and later I tried to finish my homework. Finally, Sunday ended, and my sister left. |
| Personality | Original Dataset | After SMOTE Dataset |
|---|---|---|
| Dominance | 14 | 62 |
| Influence | 26 | 62 |
| Steadiness | 62 | 62 |
| Compliance | 18 | 62 |
| 120 | 248 |
| DS | Description | Features | Demographics Features |
|---|---|---|---|
| DS1 | Original dataset | 546 | Gender, Schooling, Civil status, Occupation, Preferred Social Network Friends in Social Network |
| DS2 | The 100 least correlated features with the class were removed, according to the Correlation method | 446 | Occupation, Preferred Social Network, Friends in Social Network |
| DS3 | The 150 least correlated features with the class were removed, according to the Correlation method | 396 | Occupation, Friends in Social Network |
| DS4 | The 200 least correlated features with the class were removed, according to Correlation method | 346 | Occupation, Friends in Social Network |
| DS5 | The 271 least correlated features (about half) with the class were removed, according to Correlation method | 275 | Occupation, Friends in Social Network |
| DS6 | The 100 least informative features were removed, according to the Info Gain feature selection method | 446 | Gender, Schooling, Civil status, Occupation, Preferred Social Network, Friends in Social Network |
| DS7 | The 150 least informative features were removed, according to the Info Gain feature selection method | 396 | Gender, Schooling, Civil status, Occupation, Preferred Social Network, Friends in Social Network |
| DS8 | The 200 least informative features were removed, according to the Info Gain feature selection method | 346 | Schooling, Civil status, Occupation, Preferred Social Network, Friends in Social Network |
| DS9 | The 265 least informative features (about half) were removed, according to the Info Gain feature selection method | 371 | Schooling, Civil status, Occupation, Friends in Social Network |
| Classifier | Hyperparameters |
|---|---|
| Naïve Bayes | Use a kernel estimator for numeric attributes = false (use a normal distribution) Number of instances to process with batch prediction = 100 |
| SMO | Kernel = polykernel |
| kNN | k = 5 Distance function = euclidean distance |
| AdaBoost | Classifier = random Forest Number of models to create = 10 |
| J48 | Pruning = true Minimum number of instances per leaf = 2 |
| Random Forest | Number of features to consider in each split = int (log_2 (#predictors) + 1) Percentage of the raw training dataset = 100 Number of bags = 100 |
| Dataset | Classifier | Accuracy | Precision | Recall | F-Measure | ROC Area |
|---|---|---|---|---|---|---|
| DS1 | AdaBoost | 0.745968 | 0.774 | 0.746 | 0.754 | 0.911 |
| DS2 | AdaBoost | 0.770161 | 0.775 | 0.77 | 0.772 | 0.935 |
| DS3 | Random Forest | 0.778226 | 0.792 | 0.778 | 0.782 | 0.933 |
| DS4 | AdaBoost | 0.782258 | 0.795 | 0.782 | 0.786 | 0.939 |
| DS5 | Naïve Bayes | 0.629032 | 0.635 | 0.629 | 0.597 | 0.84 |
| DS6 | AdaBoost | 0.762097 | 0.774 | 0.762 | 0.766 | 0.924 |
| DS7 | Random Forest | 0.758065 | 0.777 | 0.758 | 0.763 | 0.923 |
| DS8 | SMO | 0.741935 | 0.741 | 0.742 | 0.74 | 0.858 |
| DS9 | AdaBoost | 0.729839 | 0.734 | 0.73 | 0.731 | 0.858 |
| Dataset | Classifier | Accuracy | Precision | Recall | F-Measure | ROC Area |
|---|---|---|---|---|---|---|
| DS1 | AdaBoost | 0.745968 | 0.774 | 0.746 | 0.754 | 0.911 |
| DS2 | Random Forest | 0.766129 | 0.777 | 0.766 | 0.769 | 0.938 |
| DS3 | Random Forest | 0.778226 | 0.792 | 0.778 | 0.782 | 0.933 |
| DS4 | AdaBoost | 0.782258 | 0.795 | 0.782 | 0.786 | 0.939 |
| DS5 | Random Forest | 0.608871 | 0.585 | 0.609 | 0.568 | 0.852 |
| DS6 | Random Forest | 0.75 | 0.767 | 0.75 | 0.755 | 0.929 |
| DS7 | Random Forest | 0.758065 | 0.777 | 0.758 | 0.763 | 0.923 |
| DS8 | Random Forest | 0.733871 | 0.747 | 0.734 | 0.738 | 0.923 |
| DS9 | Random Forest | 0.705645 | 0.715 | 0.706 | 0.709 | 0.921 |
| Dataset | Classifier | Accuracy | Precision | Recall | F-Measure | ROC Area |
|---|---|---|---|---|---|---|
| DS4 | AdaBoost | 0.782258 | 0.795 | 0.782 | 0.786 | 0.939 |
| DS3 | Random Forest | 0.778226 | 0.792 | 0.778 | 0.782 | 0.933 |
| DS4 | Random Forest | 0.774194 | 0.783 | 0.774 | 0.777 | 0.937 |
| DS2 | AdaBoost | 0.770161 | 0.775 | 0.77 | 0.772 | 0.935 |
| DS3 | AdaBoost | 0.770161 | 0.776 | 0.77 | 0.772 | 0.932 |
| DS2 | Random Forest | 0.766129 | 0.777 | 0.766 | 0.769 | 0.938 |
| DS6 | AdaBoost | 0.762097 | 0.774 | 0.762 | 0.766 | 0.924 |
| DS7 | Random Forest | 0.758065 | 0.777 | 0.758 | 0.763 | 0.923 |
| DS7 | AdaBoost | 0.754032 | 0.779 | 0.754 | 0.76 | 0.92 |
| Dataset | Classifier | Accuracy | Precision | Recall | F-Measure | ROC Area |
|---|---|---|---|---|---|---|
| DS4 | AdaBoost | 0.782258 | 0.795 | 0.782 | 0.786 | 0.939 |
| DS2 | Random Forest | 0.766129 | 0.777 | 0.766 | 0.769 | 0.938 |
| DS4 | Random Forest | 0.774194 | 0.783 | 0.774 | 0.777 | 0.937 |
| DS2 | AdaBoost | 0.770161 | 0.775 | 0.77 | 0.772 | 0.935 |
| DS3 | Random Forest | 0.778226 | 0.792 | 0.778 | 0.782 | 0.933 |
| DS3 | AdaBoost | 0.770161 | 0.776 | 0.77 | 0.772 | 0.932 |
| DS6 | Random Forest | 0.75 | 0.767 | 0.75 | 0.755 | 0.929 |
| DS6 | AdaBoost | 0.762097 | 0.774 | 0.762 | 0.766 | 0.924 |
| DS7 | Random Forest | 0.758065 | 0.777 | 0.758 | 0.763 | 0.923 |
| DS | Classifier | Class | Accuracy | Precision | Recall | F-Measure | ROC Area |
|---|---|---|---|---|---|---|---|
| DS4 | AdaBoost | Steadiness | 0.608 | 0.726 | 0.662 | 0.885 | |
| Compliance | 0.831 | 0.790 | 0.810 | 0.955 | |||
| Influence | 0.889 | 0.774 | 0.828 | 0.962 | |||
| Dominance | 0.852 | 0.839 | 0.846 | 0.954 | |||
| Avg | 0.782258 | 0.795 | 0.782 | 0.786 | 0.939 |
| Actual | Predicted | ||||
|---|---|---|---|---|---|
| Steadiness | Compliance | Influence | Dominance | ||
| Steadiness | 45 | 7 | 4 | 6 | 62 |
| Compliance | 9 | 49 | 2 | 2 | 62 |
| Influence | 12 | 1 | 48 | 1 | 62 |
| Dominance | 8 | 2 | 0 | 52 | 62 |
| 74 | 59 | 54 | 61 | ||
| Actual | Predicted | ||||
|---|---|---|---|---|---|
| Steadiness | Compliance | Influence | Dominance | ||
| Steadiness | - | 7 | 4 | 6 | 17 |
| Compliance | 9 | - | 2 | 2 | 13 |
| Influence | 12 | 1 | - | 1 | 14 |
| Dominance | 8 | 2 | 0 | - | 10 |
| 29 | 10 | 6 | 9 | 54 | |
| Predicted Personality | Actual Personality | Words | |
|---|---|---|---|
| 1 | Steadiness | Dominance | To decide, favorite, to do, to play, to be, to smile, to overcome |
| 2 | Steadiness | Influence | To have fun, favorite, to play, personal, to prefer, to be, to have |
| 3 | Steadiness | Compliance | To create, to write, to listen, to be, to inspire, to get free, older, to publish, to be, to see |
| 4 | Dominance | Steadiness | To do, to know, to be |
| 5 | Influence | Steadiness | To support, to help, short, to develop, to find, long, medium, personal, main, next, satisfactory, to be, to sustain, to have, to graduate |
| 6 | Compliance | Steadiness | To give, to go, to be, to have |
Publisher’s Note: MDPI stays neutral with regard to jurisdictional claims in published maps and institutional affiliations. |
© 2022 by the authors. Licensee MDPI, Basel, Switzerland. This article is an open access article distributed under the terms and conditions of the Creative Commons Attribution (CC BY) license (https://creativecommons.org/licenses/by/4.0/).
Share and Cite
Hernández, Y.; Martínez, A.; Estrada, H.; Ortiz, J.; Acevedo, C. Machine Learning Approach for Personality Recognition in Spanish Texts. Appl. Sci. 2022, 12, 2985. https://doi.org/10.3390/app12062985
Hernández Y, Martínez A, Estrada H, Ortiz J, Acevedo C. Machine Learning Approach for Personality Recognition in Spanish Texts. Applied Sciences. 2022; 12(6):2985. https://doi.org/10.3390/app12062985
Chicago/Turabian StyleHernández, Yasmín, Alicia Martínez, Hugo Estrada, Javier Ortiz, and Carlos Acevedo. 2022. "Machine Learning Approach for Personality Recognition in Spanish Texts" Applied Sciences 12, no. 6: 2985. https://doi.org/10.3390/app12062985
APA StyleHernández, Y., Martínez, A., Estrada, H., Ortiz, J., & Acevedo, C. (2022). Machine Learning Approach for Personality Recognition in Spanish Texts. Applied Sciences, 12(6), 2985. https://doi.org/10.3390/app12062985