Article

Automated Graffiti Detection: A Novel Approach to Maintaining Historical Architecture in Communities

1
Department of Mechanical Engineering, SUNY Korea, State University of New York, Incheon 21985, Korea
2
Department of Mechanical Engineering, Stony Brook University, State University of New York, Stony Brook, NY 11794, USA
3
Department of Electrical and Electronics Engineering, University of West Attica, 12241 Egaleo, Greece
4
Department of Civil and Environmental Engineering, University of Waterloo, Waterloo, ON N2L 2G1, Canada
5
School of Medicine, Stanford University, Stanford, CA 94305, USA
6
School of Mechanical Engineering, Purdue University, West Lafayette, IN 47906, USA
7
Institute of Geotechnical Engineering, Southeast University, Nanjing 211189, China
8
Lyles School of Civil Engineering, Purdue University, West Lafayette, IN 47906, USA
*
Author to whom correspondence should be addressed.
Appl. Sci. 2022, 12(6), 2983; https://doi.org/10.3390/app12062983
Submission received: 30 January 2022 / Revised: 2 March 2022 / Accepted: 10 March 2022 / Published: 15 March 2022

Abstract

:
Graffiti is common in many communities and even affects our historical and heritage structures. This leads to a decrease in the revenue associated with commercial activities or services (e.g., shops, restaurants, residences), and potentially reduces tourism in a region. Visual data, in the form of photographs, is becoming an efficient mechanism to record information. Photographs can be quickly captured, and are already frequently posted online by ordinary citizens (e.g., tourists, residents, visitors). Exploiting image data through automation and computer vision provides a new opportunity to simplify the current manual graffiti-monitoring processes, enabling automated detection, localization, and quantification of such markings. In this study, we developed a vision-based graffiti-detection technique using a convolutional neural network. Images collected from historical structures of interest within a community can be utilized to automatically inspect for graffiti markings. In the case in which citizens collect and contribute data, there is a high degree of duplication and repetition, and potentially a lack of GPS information. These hinder the direct use of the images for automating the process. To address these challenges, we built high-resolution, single-view façade images (orthophotos) before applying our robust graffiti detector. The robust graffiti detector was built using a database with 1022 images of damaged or contaminated structures gathered during a recent European Union project, entitled “Safeguarding Cultural Heritage through Technical and Organisational Resources Management” (STORM). A total of 818 images were used for training (10% of the training set was randomly chosen for the validation set), achieving 88% accuracy among the remaining 204 samples for testing. Using the trained detector, the technique developed was demonstrated using data collected from the Church of Agios Nikolaos (Leontariou), Kantza, Greece.

1. Introduction

The term graffiti is defined as “writing or drawings scribbled, scratched, or sprayed illicitly on a wall or other surface in a public place” [1]. Such markings are quite often understood as a manifestation of antisocial behavior performed to gain attention or as a form of thrill-seeking. In many cases, such markings are linked to vandalism, or even criminal behavior. A more devious form of graffiti, known as tagging, which refers to “the repeated use of a single symbol or series of symbols to mark territory”, has become common in many places in the world. Numerous cases of graffiti-tinged vandalism have been documented on historical structures such as monuments, statues, churches, or temples. Figure 1 provides a sample of such vandalism. A Holocaust monument in central Athens was vandalized with tagging in December 2017, and in response, city officials stated that, “The attack on the monument, which will remain open and accessible to citizens, is an act of intolerance and historical ignorance” [2].
Graffiti causes various problems in a community [3,4,5]. First, there is the obvious cost to a community related to cleaning and maintenance, which can be significant, especially when graffiti has been applied to materials that require special treatment. Next, the presence of graffiti on walls and structures creates an impression of uncleanness and being unattended, and is thus often perceived as being linked to lack of surveillance or policing of the area in which the graffiti appears. This creates a sense of insecurity, and potentially lowers the value of land and property, and can lead to an overall decline in commercial activity and services (e.g., shops, restaurants, apartments). Furthermore, especially in the case of monuments and archaeological sites, graffiti can prove to be destructive. When the graffiti is sprayed or painted on older, delicate materials, cleaning requires special treatment, and the use of chemicals for the removal of graffiti may cause even more damage.
Current practice to locate and inspect graffiti takes the form of visual surveillance and evaluation by cleanup crews. This task is very time-consuming and requires significant resources [6,7,8,9,10]. The occurrence of such damage is quite unpredictable, so frequent visits may be needed. There is a compelling need to streamline this process by exploiting technologies and automation. In recent years, computer-vision technologies have begun to transform how structures are being inspected [11,12,13,14,15,16,17,18,19]. Deep-learning algorithms have drawn the most attention in both academia and industry because they have proven their ability to identify and localize visual features in images [20,21,22,23,24,25]. Image sensors are becoming smaller and cheaper, and nearly every ordinary citizen carries a cell phone on a daily basis. Thus, a large volume of high-quality visual data can be collected quite easily. By harnessing these capabilities, graffiti markings may be detected and monitored automatically, greatly reducing the costs associated with manual inspections.
However, there are several technical and social challenges that must be overcome to enable this sort of implementation. First, estimates of the locations and sizes of graffiti markings should be outcomes of the technique. Some images often capture a limited area without having sufficient spatial context. Thus, the markings detected are not correctly localized. Second, for the monitoring perspective, a sufficient quantity of data must be provided to gather up-to-date visual information of the community being assessed. Public crowdsourcing databases collected by many people (not only by certain engineers) might be utilized to gather the necessary data. Third, a robust graffiti detector should be built to accurately detect and localize graffiti markings in general situations from images. To ensure the robustness of the detector, a large database of ground-truth images is required.
The major innovation of this work is the preprocessing of orthophoto generation, merging individual citizen’s image data in its workflow as a preprocessing. Graffiti markings are generally on long or large-size walls that cannot be captured in a single image; the orthophoto will improve the detection performance and enable quantification on large-scale structures. The capability of the system to estimate the sizes and locations of graffiti autonomously could help in remotely determining how much time and money should be invested in cleaning a specific section. On the other hand, the system allows the incorporation of images taken from ordinary citizens (people without the intention of doing visual inspection), which helps update the system without the requirement of scheduling visits to the site by experts or community staffs.
In this study, we developed a vision-based method to detect and quantify graffiti damage using images. We leveraged a ground-truth graffiti database generated by a recent European Union H2020 project, entitled “Safeguarding Cultural Heritage through Technical and Organisational Resources Management” (STORM). STORM has gathered a large volume of images of damaged or contaminated structures to be used for studying the community’s long-term preservation strategies. Labeled graffiti images were utilized to build a robust graffiti detector. A key idea in the proposed technique was to generate a high-resolution orthophoto before the graffiti detector. To collect images periodically, various crowdsourcing strategies were used, such as a game applications on smartphones, harvesting from social media, promotions, advertisements to engage tourists, commuters, residents, and any other type of citizen. Once images over target structures in a community (TOCs) were collected, each façade was automatically estimated from the full set of images, yielding the appropriate locations and number façades within the TOC. An orthophoto for each façade of the structure was then generated by geometrically stitching multiple images collected from the TOC using a structure-from-motion (SfM) algorithm [26,27,28,29,30]. Then, the graffiti detector was applied to each orthophoto, which provided the relative size and location of each graffiti marking on the corresponding façade, thus localizing and quantifying the damage. All of these processes, including orthophoto generation and graffiti detection, were automated once we built the detector in advance. The capability of the technique was demonstrated using a cultural heritage site, the Church of Agios Nikolaos (Leontariou), Kantza, Greece [31].

2. Materials and Methods

The objective was to develop a technique that could detect graffiti using images gathered by citizens. To enable automation, an orthophoto was generated at various intervals to aid in decision making and planning regarding community maintenance needs. By allowing the citizens to collect the data, key structures in the community could be readily and frequently monitored against graffiti markings. A step-by-step procedure is depicted in Figure 2. As a preliminary step, a robust graffiti detector was trained. In this study, we used a robust convolutional neural network (CNN)-based object detector, called Faster R-CNN, to train the graffiti detector [32]. A real-world database with various graffiti scenes was used to train the robust detector [33]. Actual steps of the proposed technique were as follows. In Step 1, visual data were collected periodically from key structures that needed to be monitored. Ordinary citizens (e.g., residents, tourists, and visitors) were engaged to collect photographs to document relevant visual scenes in the community. The recommended guidelines for data collection are outlined in Section 2.2. In Step 2, orthophotos were generated that contained full views of façades in a target structure. An orthophoto is a high-resolution image, that is generated using the data collected in Step 1. The subject of this orthophoto, denoted here as the target object in a community (TOC), was represented by several orthophotos that each maintained their original image quality, sufficient for observing graffiti markings. Such orthophoto generation was a key step to enable image-based graffiti monitoring by removing any repetition or overlap that may have existed in the individual images, and then the TOC was represented by a single view per its façade. In Step 3, graffiti detection was performed by applying the trained graffiti detector to the reconstructed orthophotos. Since this process was repeated on the orthophotos reconstructed on a regular basis, such digital documentation was useful for instantly assessing the overall presence of graffiti on the TOC over time.

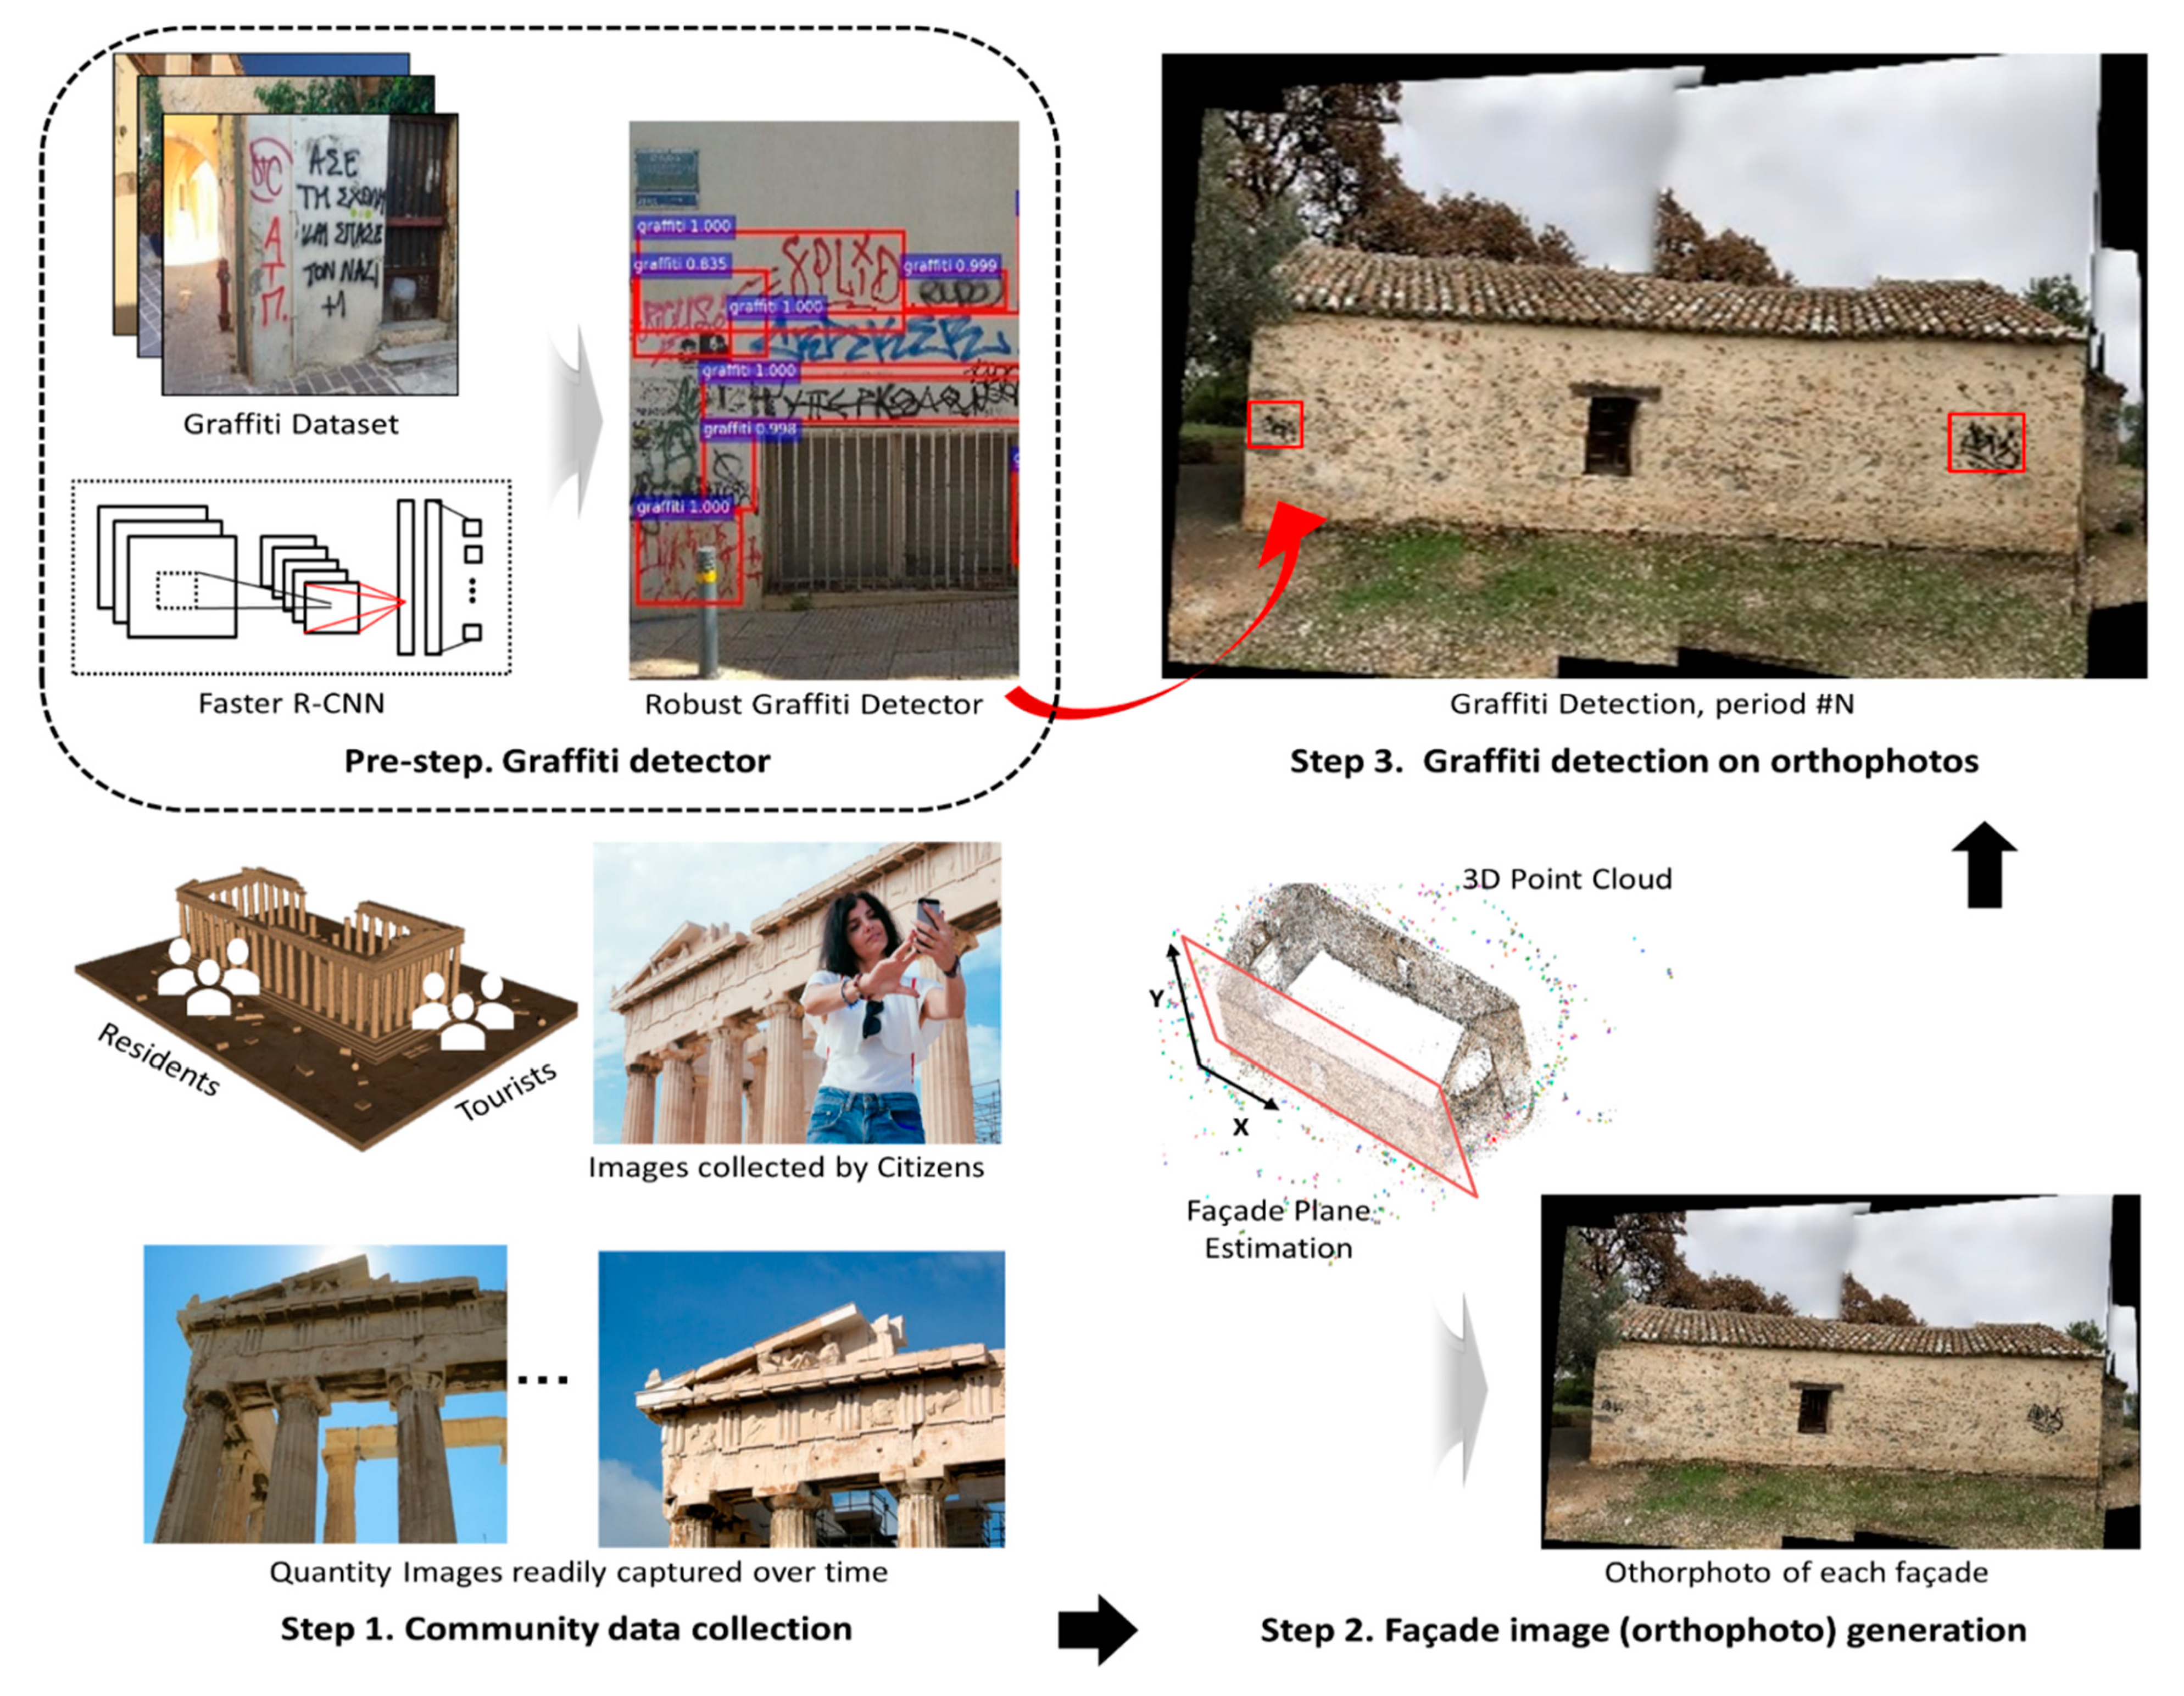
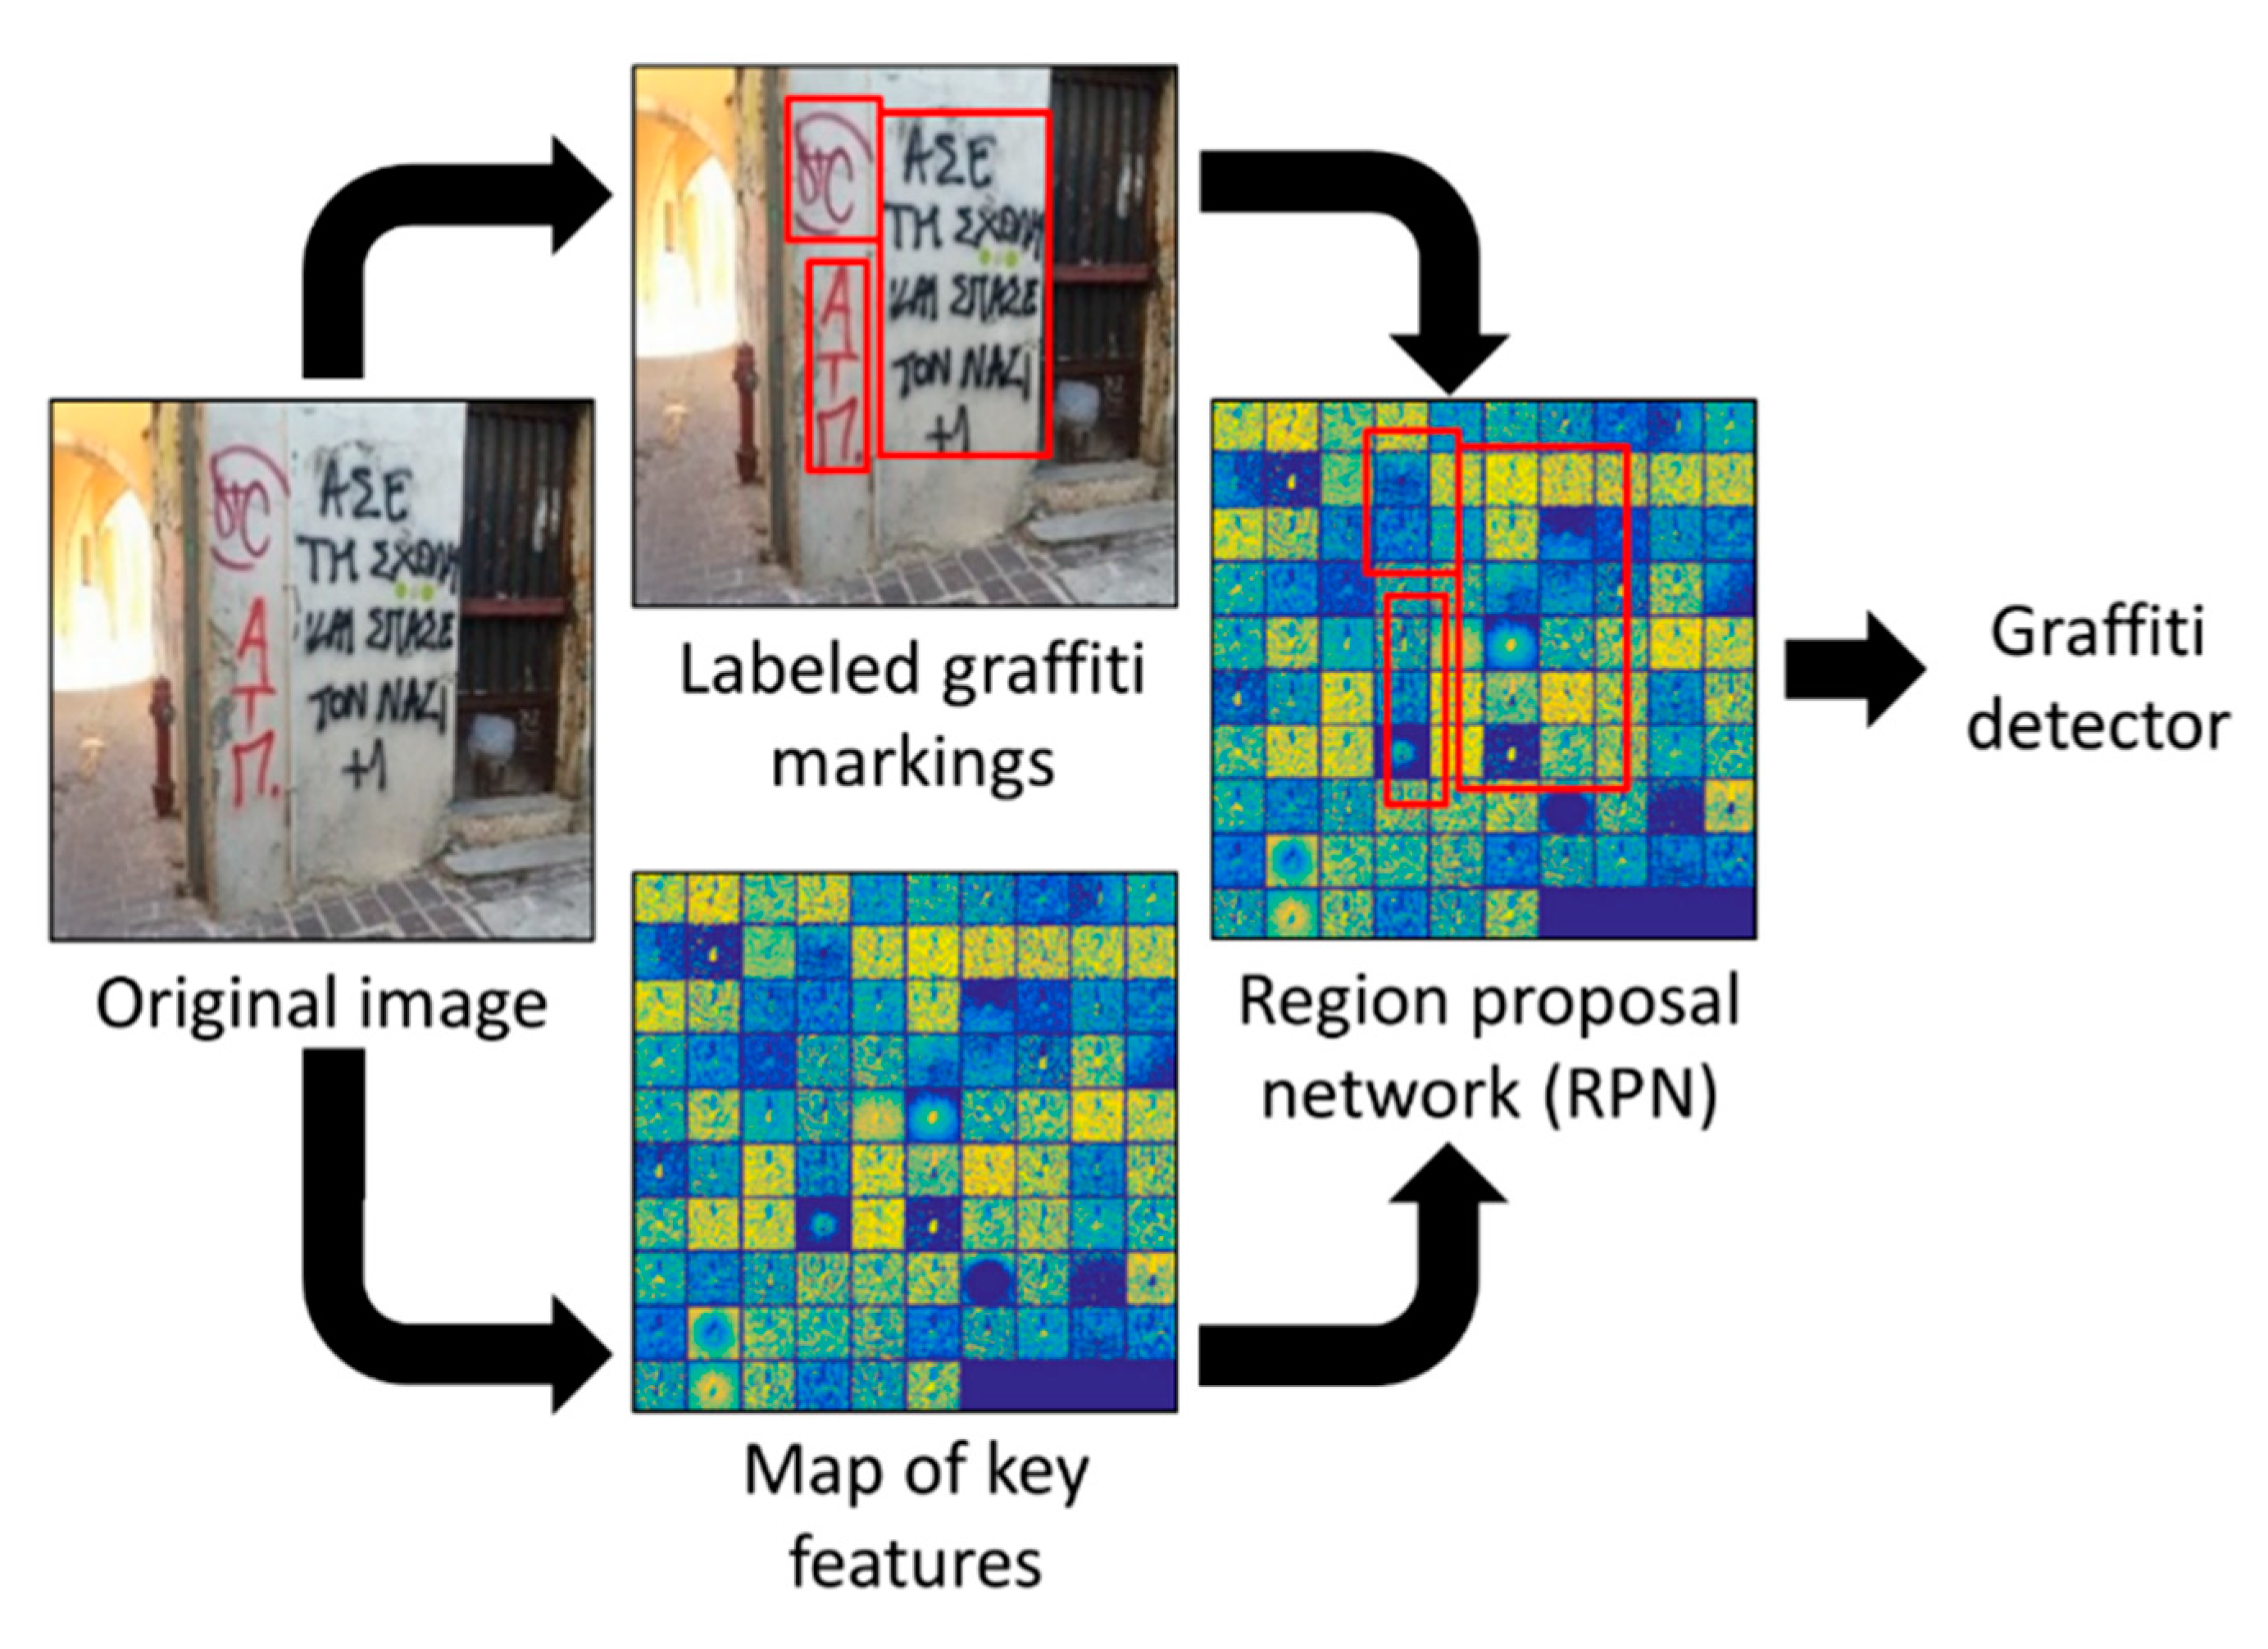
2.1. Preliminary Step: Graffiti Detector

Graffiti is certainly not standardized in shape, color, or size, and thus must be distinguished from intentional signage that may exist in the background scene of an image. Region-based convolution neural network (R-CNN) provides an appropriate solution to this problem. Recent advances in vision-based object detection are driven by the successful implementation of R-CNN (for example, see [34,35,36]). For building a graffiti detector, the basic requirement to use R-CNN, like all supervised learning procedures, is to retain a suitable training data set with a rich and diverse set of images captured from actual graffiti. The STORM project funded by the European Union (EU) provided a suitable data set, and we used it here for building a robust graffiti detector.
During the training phase of R-CNN, a step is required to extract candidate object areas, called a region proposal. CNNs operate by representing various types of graffiti scenes present in the set of region proposals with a unique feature vector. These region proposals may vary in size and scale, and therefore need to be reshaped to match the CNN input size. After reshaping, the region proposals pass through the CNN in order to generate the associated feature vectors. Then, these feature vectors are fed into the support vector machine (SVM) classifier. Lastly, the location and shape of each bounding box are refined by using a linear regressor to reduce the localization error [34]. R-CNN has evolved into a much faster algorithm called Fast R-CNN, which achieves greater efficiency by sharing expensive computations through a region-of-interest (ROI) pooling technique [35]. R-CNN has two major drawbacks that increase its computational cost. First, it requires a separate forward pass through the CNN to check if each region proposal includes an object class of interest. Then, it trains three different internal models in order: feature extraction, object classification, and bounding box regression.
To address these issues, Fast R-CNN generates a general feature map (for an entire region of each image) by passing each image (not its subregion) through the CNN and shares it with the ROI pooling layer to reduce the computational time. To find the max-pooled ROI proposals, the corresponding region of object proposals (likely positions of objects on the image) on the feature map should be extracted through max-pooling. Then, the extracted regions warp into a fixed-size feature vector and are passed to the fully connected layers. In the last layer of Fast R-CNN, the SVM classifier in R-CNN is replaced with a softmax layer for object classification [37]. A linear regression layer parallel to the softmax layer is also added to localize the object by outputting the coordinates of the bounding box. In this way, Fast R-CNN can integrate all necessary stages for training CNN (CNN feature extraction, object classifier, and bounding box coordinate regressor).
To develop a robust graffiti detector, we incorporated a state-of-art object detection method called a faster region-based convolutional neural network (Faster-RCNN), which is an enhanced version of Fast R-CNN in terms of computational expense. Figure 3 briefly portrays this process. In Faster R-CNN, the selective search algorithm was modeled with a fully convolutional network, called a region proposal network (RPN) [31]. RPN in Faster R-CNN made the generation of region proposals costless. RPN allowed features generated in the forward pass of CNN to be reused to produce the region proposals as well. Instead of implementing a separate proposal generator, RPN used an original image as the input, predicted region proposals, and fed those region proposals into the region-of-interest (ROI) layer for prediction of bounding boxes. RPN, which is a fully convolutional network, used the existing R-CNN to extract a feature map (the last output layer of R-CNN) for generating object proposals. After generating the feature map, RPN slid another convolutional layer on the feature map to produce the object proposals. The size of the sliding window that was spatially running on the feature map was defined based on the image size and aspect ratio of associated anchors. The anchors were fixed-size bounding boxes constructed with a combination of their predefined size and aspect ratios. RPN used anchors to produce a set of proposals by computing the probability that an anchor included an object (called the “objectness score”) and adjusted the corresponding bounding box coordinates. Finally, the region proposals (outputs of the RPN) and feature maps (outputs of the shared CNNs) were used to train the Faster R-CNN to detect graffiti markings in each region proposal. Many other types of architecture were introduced to reduce the training and testing speed, as well as the accuracy, but there is always a trade-off between the accuracy and computational efficiency [38,39]. In this work, we implemented the original Faster R-CNN to detect graffiti markings on the images.

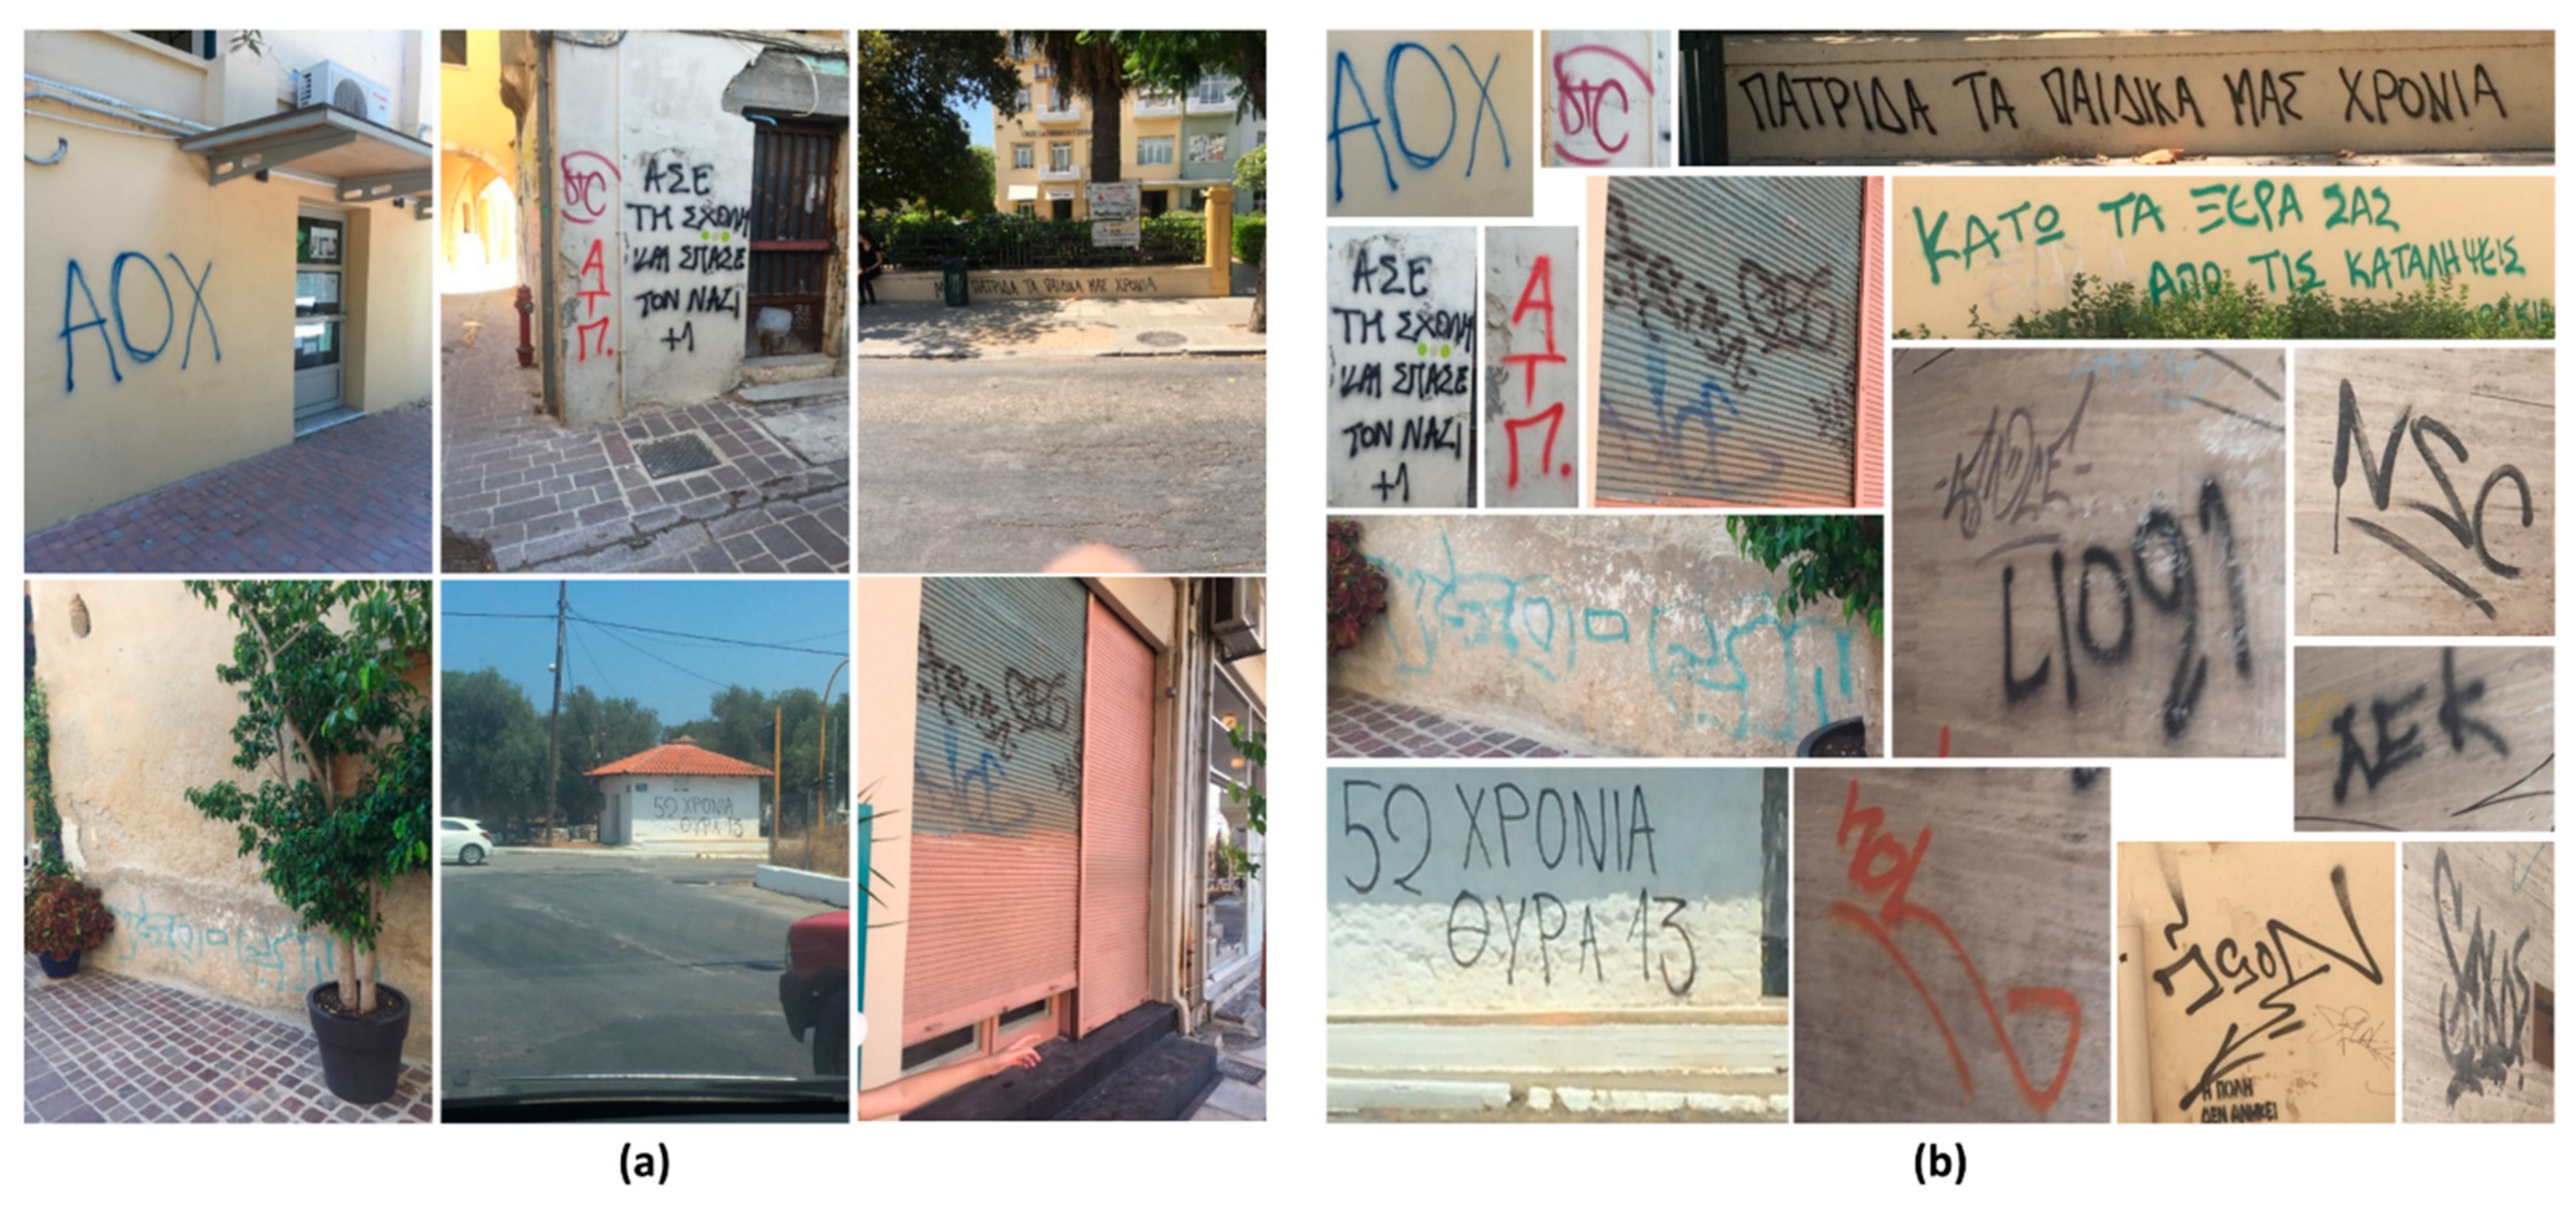
2.2. Step 1: Community Data Collection

Collecting and gathering suitable visual data was the first step in a successful implementation of the technique. Similar to many innovative structural assessment methods based on computer-vision-based technology, images provided useful information containing many viewpoints, at frequent time intervals, and for many locations. However, this application was different compared with typical damage-detection algorithms, as graffiti is an obvious and visible object in an image. Hence, while individual images and their qualities are considered to be more critical in damage-detection algorithms, overall image dataset variety and volume were more important for this application, including collection frequency and inclusiveness of the key structures.
Once the data were collected, our approach was to use the structure-from-motion (SfM) technique to establish a geometric relationship between images through orthophotos of façades of the TOC. The technical details of SfM are provided in the next subsection. In SfM, sufficient image overlap between images from various distances and orientations was required, although the specific amount of overlap needed varied depending on the image quality (e.g., resolution, noise, occlusions). Consequently, the collection of a large number of images was essential to this technique. Of course, such a large number of images having high temporal and spatial resolutions were necessary for monitoring the TOC.
Involving citizens can provide a major breakthrough in this type of data requirement. Crowdsourcing to obtain a sufficient quantity of visual data would satisfy this condition. A variety of ordinary individuals such as residents, workers, tourists, and visitors present in a community were encouraged to capture the necessary images. Smartphones are broadly used around the world for capturing such data, and the data can be uploaded to any readily available cloud service (e.g., Google Drive, Dropbox, Box). Social-media technologies (e.g., Instagram, Facebook, and YouTube) further accelerated this mechanism for broad data capture by making many resources of visual data available online [40]. Specific crowdsourcing strategies for visual assessment were discussed in our previous work, and are not repeated here [41,42]. For best results, the requirement in this step was the collection of a large number of images to cover the relevant surfaces of the TOC that may have been exposed to graffiti. A set of images was required to be collected within each assessment period to update the most recent scene of the TOC for detecting graffiti markings.

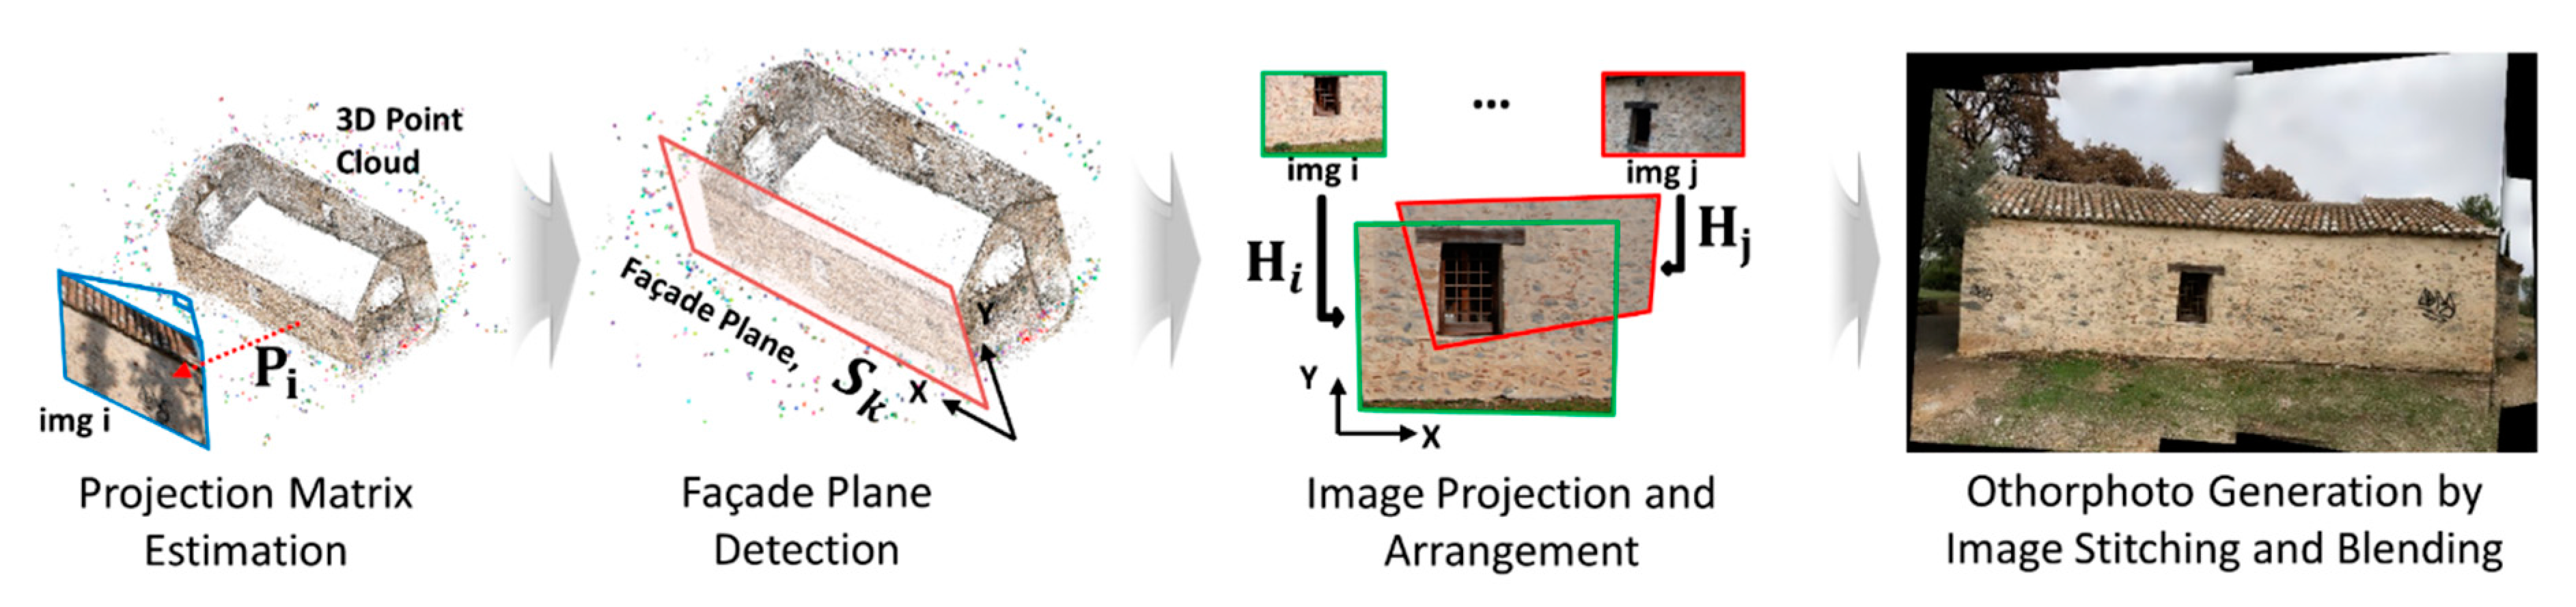
2.3. Step 2: Façade Image (Orthophoto) Generation

In this step, instead of searching for graffiti markings on individual images, generating a high-resolution façade image (orthophoto) of the TOC enabled the detection and localization of up-to-date graffiti presence. The full process would include estimating their sizes and locations or potentially implementing a remote monitoring system. The orthophoto was generated by projecting multiple images on a façade plane, while also removing perspective distortion [43,44,45]. It had a uniform scale in each direction defining its plane, so it truly represented an accurate view of the façades of the TOC. The wall planes of the TOC were automatically estimated by fitting a plane after a point cloud of the TOC was first constructed. Then, each image was projected onto that plane, followed by typical stitching and blending procedures. The number of orthophotos here depended on the number of façades in the TOC to be assessed. In Figure 4, we describe the step-by-step process needed to generate the necessary orthophotos from collected visual data that satisfied the data quantity and overlap requirements.
First, a projection matrix for each image was estimated. It was expressed in homogeneous coordinates, which was a 3 × 4 matrix for an ideal pinhole camera. The projection matrix was derived while considering both intrinsic parameters (focal length, principal points, and camera center) and extrinsic parameters (a relative camera location in 3D and rotation angle) of the image [25,26,27]. This process, which included large, iterative computations, could be greatly accelerated by SfM by computing shared keypoints between images [28]. The two important outputs generated from this step were: (i) a projection matrix of each image; and (ii) a point cloud describing the 3D scene of the TOC. By satisfying the data requirements outlined in Step 1, SfM yielded those two outputs without prior knowledge of either the geolocation or camera parameters. Considering each (i-th) image, the following relation held:
P i = K i [ R i T i ]
where P is the projection matrix (3 × 4 matrix), and the rotation matrix R (3 × 3 matrix) and translation matrix T (3 × 1 vector) represent the camera orientation and translation, respectively. K represents an upper triangular camera calibration matrix of the form:
K = [ α u s u 0 0 α v v 0 0 0 1 ]
where α u and α v are scale factors, s is skew, and u 0 = [ u 0 v 0 ] T is the principal point of the image. The relative locations and orientation of each image could be simply expressed with the projection matrix, P , as expressed in Equation (1) [27].
Second, the façade planes on the TOC were estimated. The goal in this step was to automatically search for the major planes in the point cloud onto which the collected images were to be projected. The feature matches, in most cases, were the ones on the surface of the TOC. Thus, this can be allowed as a simple plane-fitting problem on a set of points in space. Here, we integrated the Maximum Likelihood Estimation Sample and Consensus (MLESAC) algorithm, which is widely used in estimating either a complex surface or a more general manifold from point data [46]. MLESAC follows the same sampling strategy as the Random Sample Consensus (RANSAC) algorithm, but more weight is placed on inlier samples by maximizing the likelihood for a better fitting. The façade plane estimated with the MLESAC was denoted as S (a 1 × 4 vector). Considering the estimated S , the keypoint match lying on the plane S was denoted as X . In this way, numerous orthophotos could be generated for every plane that existed in the TOC. Users could set the number of planes to be estimated; thus, orthophotos were generated only for a true façade in the TOC. Here, the number of façades to be estimated, j , could either be assigned or was set through an appropriate threshold in the process. Considering such factors, the equation of the plane in vector form is:
S j X j = 0
where the façade is expressed as S = [ a b c 1 ] , which is the model for MLESAC. A major plane was estimated based on counting the number of X j satisfying Equation (2). Here, the j number of major planes were finally chosen from the point cloud.
Third, to project each image on the major planes detected, a homography matrix, H , was computed from the projection matrix, P , and the estimated plane, S . The homography matrix was a 3 × 3 matrix providing a planar projection transformation between two 2D images. This matrix thus provided a one-to-one mapping between the images and the estimated plane [27]. To do this, the homography relationship needed to transform between a pixel coordinate (frame) and ortho coordinate ( S ) system (expressed in the x–y coordinate system). Computing a rotation coefficient, r , enabled homography from the projection matrix. This derivation was described in detail in [45]. Considering each image, i , and each estimated plane, j , this relationship can be represented as:
H i j = [ p i 1 p i 2 r j p i 3 + p i 4 ]
where p i k is the k th column of p i .
Finally, the set of images was projected onto the estimated planes using the homography matrices, which formed the orthophoto. In Equation (3), each image has j homography matrices, as we have j estimated planes. Thus, we needed to determine the proper façade plane (or, the homography matrix) onto which each image had to be projected. This process may result in regions, especially in oblique images, that extend beyond a given façade (which are not in the plane) and would give the appearance of having large distortions when the perspective distortion is removed with respect to the façade plane. To avoid such cases, we used only a subset of the images that included those that were captured relatively parallel and close to the façade plane. We denoted this subset of images used as the orthoSet. A threshold value was set to automatically identify these images. The images in the orthoSet were chosen based on the angle, defined here as Θ , as well as a distance, defined as δ , between each image plane and the estimated plane. Based on the experimental verification we performed in Section 3, we suggested that these thresholds be set such that that Θ be smaller than 15° and δ be less than 5 m. From this point on, we followed the procedure used by Allène et al. to blend the images and generate an orthophoto using gain compensation and multiband blending [29].

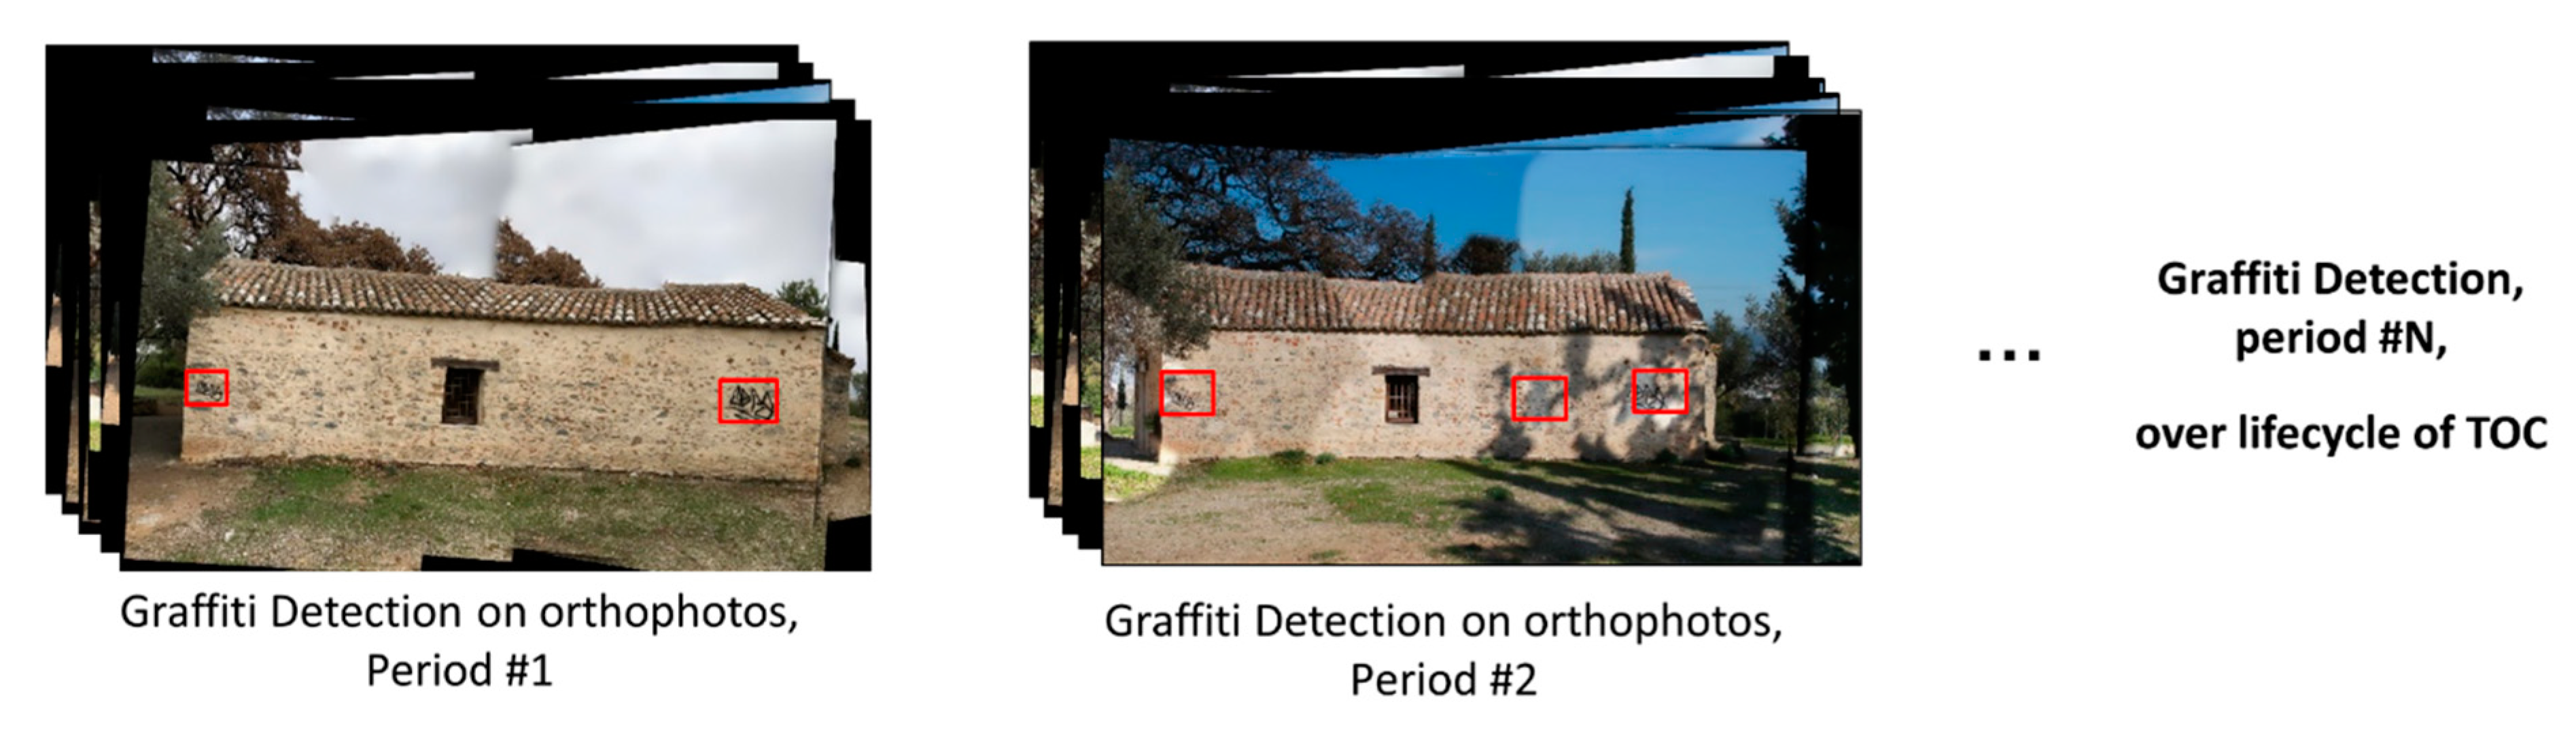
2.4. Step 3: Graffiti Detection on Orthophotos

As a final step, graffiti detection took place on each orthophoto generated in Step 2. The use of an orthophoto in detecting graffiti had several advantages. The TOC could be completely captured with several orthophotos, thus encapsulating any overall graffiti presence including their locations and sizes. This would not have been possible only using individual crowd-sourced images due to their disconnection or repetition of a particular scene, especially for large TOCs. The efficacy of this approach increased when considering long-term maintenance from a lifecycle assessment perspective, as depicted in Figure 5. With public online data resources providing abundant and up-to-date visual data, we could easily track graffiti presence by simply comparing a few orthophotos over time. Visual data may be the simplest and most cost-efficient means to document visual information related to the condition of properties in the community, especially historical structures that are popular attractions.

3. Experimental Verification

We demonstrated the graffiti detection technique by applying it to a real-world structure exhibiting various types of graffiti. A target structure, the Church of Agios Nikolaos, Kantza, Greece, is a cultural heritage building. Since we noticed that its exterior condition is one of the major interests for maintenance, we regarded the Church of Agios Nikolaos as the TOC for verification of the proposed method through this case study. As a preprocessing step, a graffiti detector was trained using a graffiti data set established within the STORM project. Then, the technique was demonstrated on our TOC, where several graffiti markings had already been placed. For this implementation, visual data were collected twice within an eight-month interval to highlight the capability of structure monitoring.

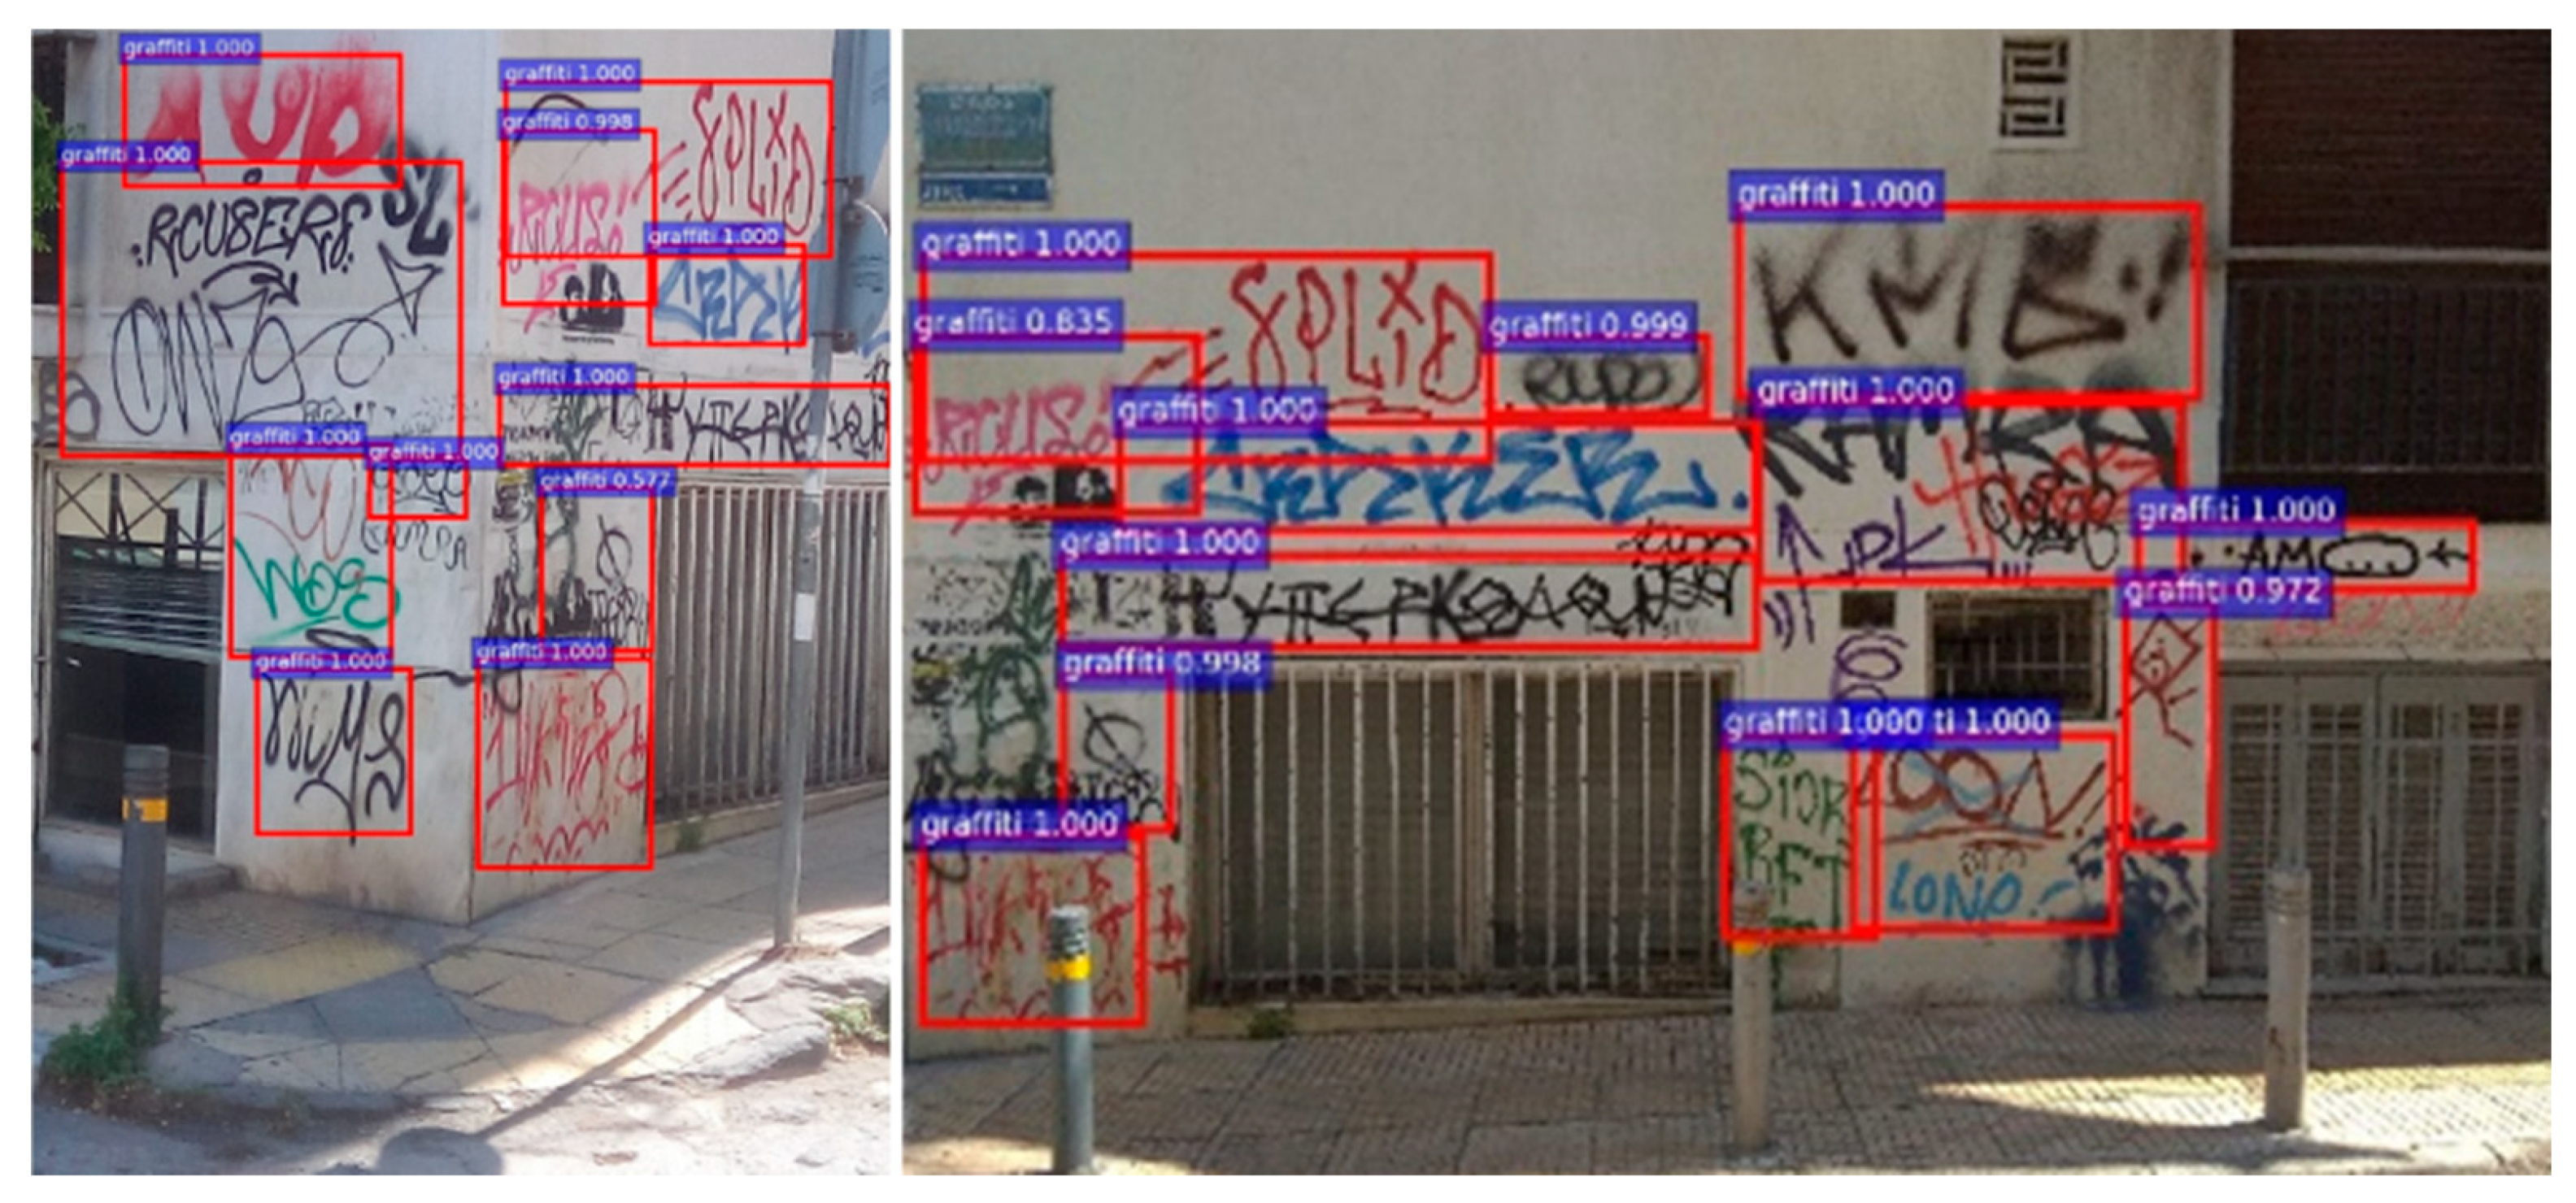
3.1. Graffiti Detector

The STORM project developed a graffiti database for various purposes, including the monitoring of cultural heritage sites in European countries [32]. The database includes a wide variety of scenes containing graffiti, such as markings drawn on walls, benches, and statues from Athens, Greece, and its suburbs. A total of 1022 images that were collected from various locations and viewpoints were used. Multiple graffiti markings were labeled from each image for augmenting the ground-truth dataset for the graffiti detector in this case study.
Our approach to training the graffiti detector was to implement Faster R-CNNs [31]. Graffiti markings can overlap, and their boundaries may be visually ambiguous. Thus, having an accurate and uniform labeling criteria played a crucial role. We provided guidelines to obtain consistency in creating the ground-truth dataset. First, graffiti markings should be completely surrounded by a rectangular bounding box. Second, the bounding box should be drawn for each graffiti (within recognizable range), and there can be more than one graffiti marking captured on an image. Multiple graffiti markings were separated within recognizable range considering shape, color, and drawing style, along with allowing overlap between the bounding boxes. By following these two guidelines, a total of 1682 graffiti markings from the 1022 images were labeled by three different individuals to build a ground-truth dataset for the graffiti detector. Cross-validation was conducted to generate this training data set to input into the Faster R-CNN algorithm. Sample images from the database are shown in Figure 6.
In training the graffiti detector, we used a residual network model, called ResNet-101, implemented in the Faster R-CNN library [31]. The Faster R-CNN and its region proposal network (RPN) significantly reduced runtime by implementing object feature map computation on a GPU, providing an effective engineering solution. We deployed and exploited the Tensorflow library and implemented the Faster R-CNN algorithm in Python script [47]. ConvNets and fully connected layers were initialized by zero-mean Gaussian with a standard deviation of 0.01 and 0.001, respectively. The hyperparameters were the same used in [48]. Momentum and weight decay for training the R-CNN and RPN networks were set to 0.9 and 0.0005, respectively. The learning rate, defined as the amount the weights were adjusted with respect to the loss gradient, was set to 0.001. To achieve faster convergence of the gradient descent, we set the momentum to 0.9. The decay weight was also controlled to avoid overfitting by changing the weight in proportion to each patch size.
In the model training, we split the dataset 80%/20% into training and testing, respectively: 818 images for training and 204 images for testing. Then, we set aside the test data set, and randomly choose 10% of the training dataset to be the validation data set for cross-validation of the model. Since multiple graffiti markings existed in a single image, the total number of the 1200 graffiti markings were considered from the 204 test images. A PC workstation with a Xenon E5-2620 CPU clocked at 3.4 GHz, 12 GB of RAM, and a 64-bit operating system were used for this process. Two GPUs, an NVIDIA Titan X and an NVIDIA Tesla k40 with a total of 24 GB of VRAM, were used in the training. The runtime for the process varied depending on the size of graffiti data set, as well as computational resources available. For our graffiti detector, with the settings listed above and 80% of the total data of 818 images, the total training runtime averaged 135 min. Figure 7 shows example results with test images on which multiple complicated graffiti markings existed within the scene image. As shown in the confusion matrix in Table 1, we finally achieved 88% accuracy of the model with 204 images in the test.

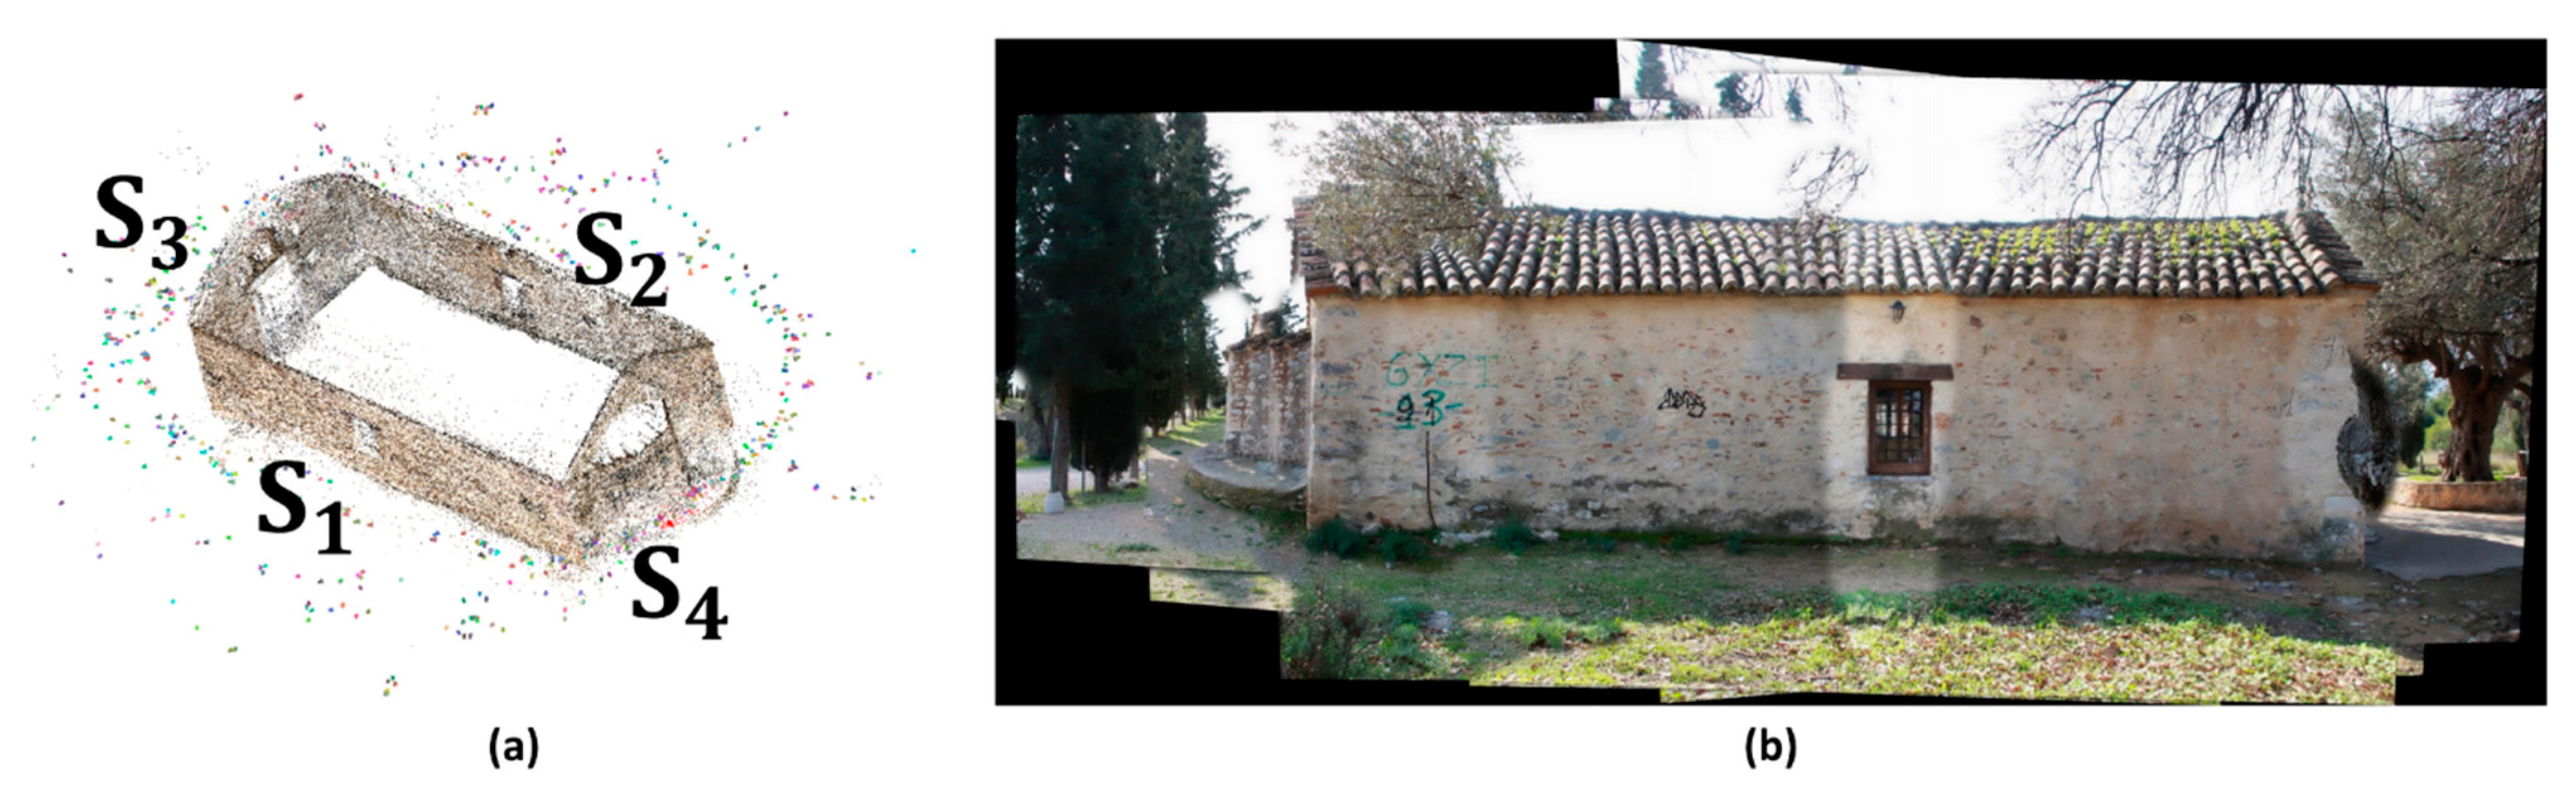
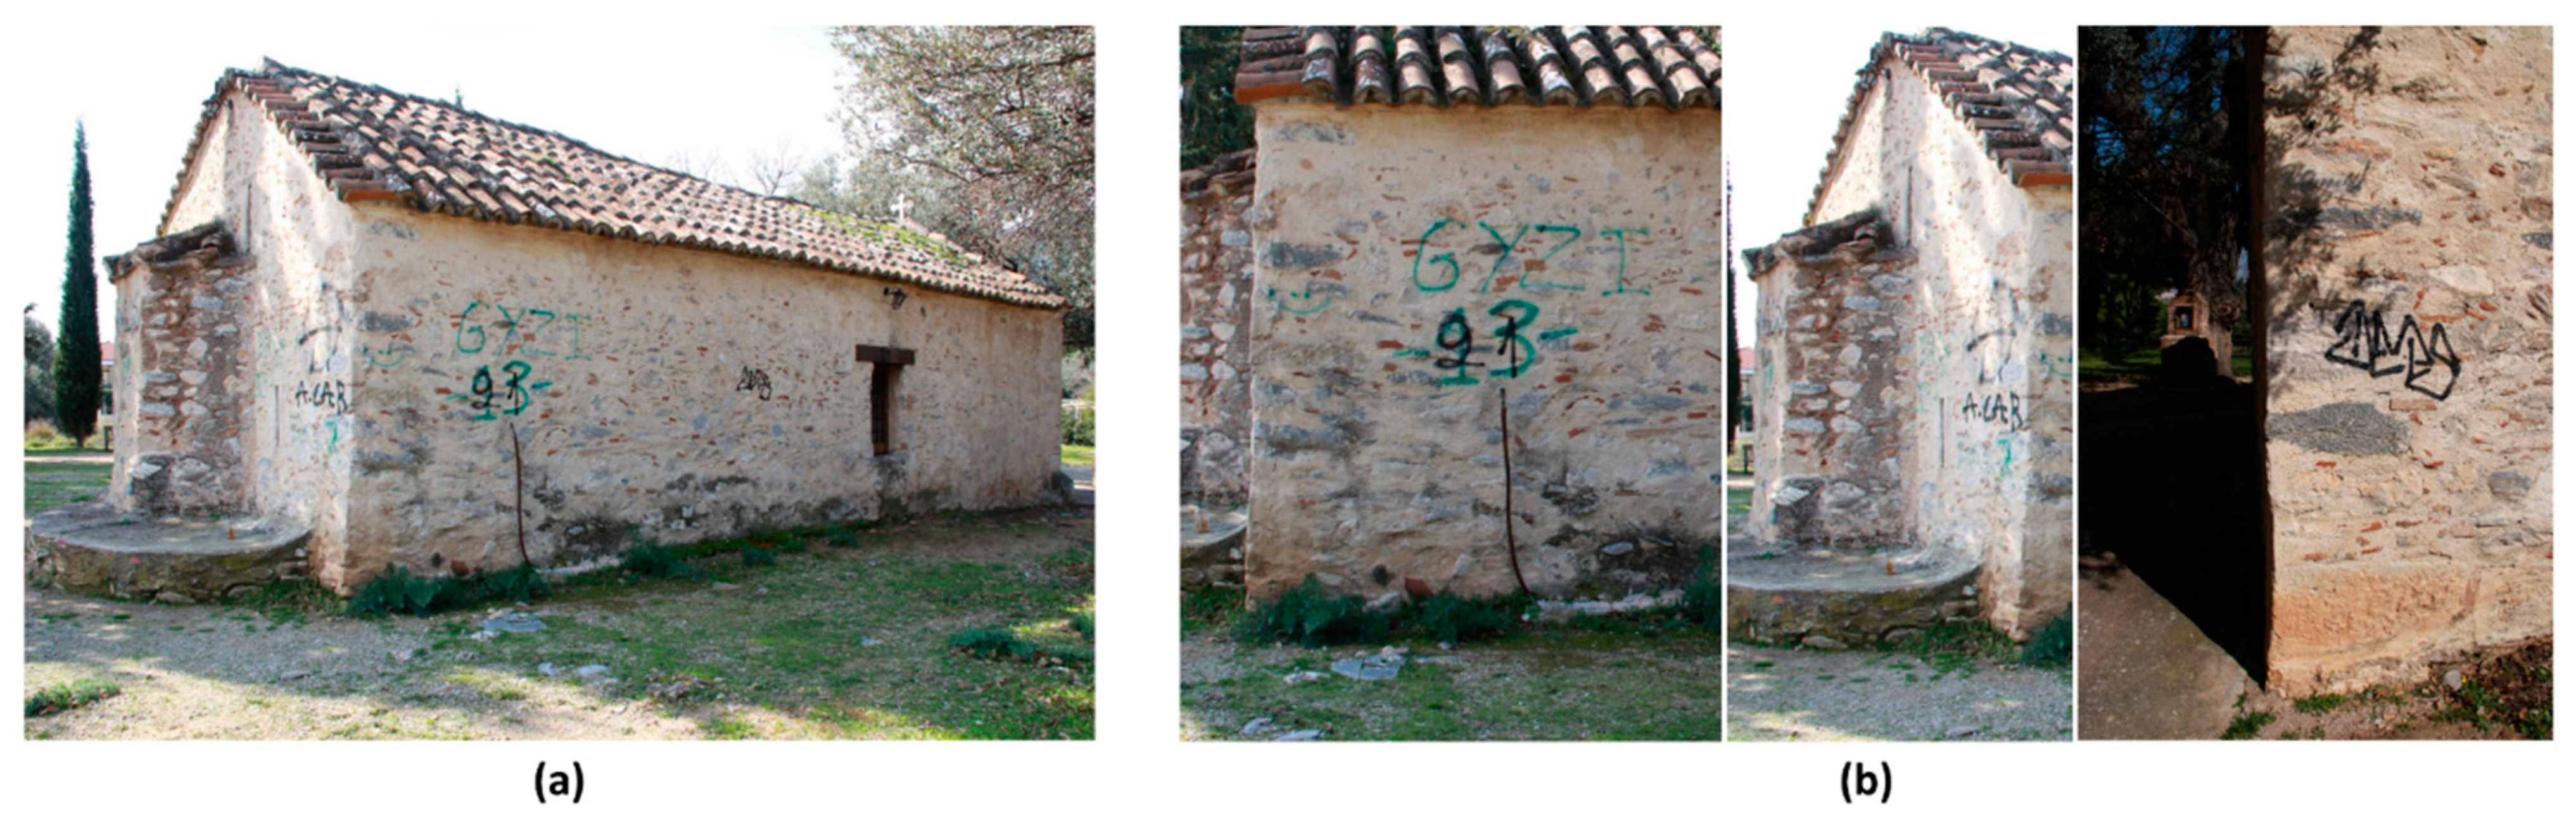
3.2. Description of the Target Object in a Community (TOC): Historical Structure in Kantza, Greece

The TOC in this case study, the Church of Agios Nikolaos (Figure 8a) is a cultural heritage building and historical structure, and its exterior condition is of concern for city maintenance. This 400-year-old building is 5 m × 12 m and is currently in use in Kantza-Pallini, Greece. It was originally built in 1592 AD, and was restored in 1872. As a regional landmark structure, together with a colossal lion sculpture made of Penteli mountain marble located at the NW of the temple, they offer various crowdsourcing opportunities that could involve both citizens and online resources. As shown in Figure 8b, black and green-colored graffiti markings were present on all four of its walls, where its light-colored surfaces made the graffiti even more obtrusive and ugly.
Exploring appropriate and stable crowdsourcing resources was important in this method. In this work, we focused on the technical implementation procedures and assumed proper crowdsourcing resources were already retained. Here, we assumed that a large volume of visual data was collected as a part of a series of tasks in a scavenger-hunt-like game application that users were asked to complete [49], and there were a sufficient quantity and variability to satisfy the minimum image overlap criterion in order to perform the SfM procedure described in Section 2 [43]. The game application was developed in the scope of the STORM project [50]. Thus, the community data collection step here was done by our team members, not random individuals. Furthermore, to demonstrate the potential for enabling a lifecycle assessment perspective, we collected data twice within an eight-month interval, including 268 images in May 2018 and 337 images in January 2019.

3.3. Façade Image (Orthophoto) Generation

To estimate the projection matrix for each of the collected images, we used VisualSfM [51]. VisualSfM is an open-source SfM software that provides a user-friendly graphical user interface (GUI) to monitor the intermediate steps of the SfM process, such as keypoint feature matching and camera pose estimation. VisualSfM highly improved the speed of the SfM computations by implementing the SiftGPU Library and parallel processing using graphics processing units (GPUs) [44,45,46,47,48,49,50,51]. Finally, VisualSfM yielded two outputs that were important in this work; namely, the projection matrix of each collected image and the point cloud of the Church of Agios Nikolaos. The MLESAC algorithm for façade plane estimation from the point cloud and orthophoto generation was implemented in MATLAB [52,53]. The average processing time for generating a total of four complete orthophotos from the 182 images was 1.5 h using the PC workstation mentioned earlier.
Since the Church of Agios Nikolaos has four major obvious façades, we did not need to manually assign the parameter j . If a TOC has a complicated shape of façades, the value of j can be set manually. The algorithm here was able to successfully estimate the four façade planes, and then the four orthophotos were generated. Figure 9 depicts the point cloud and one orthophoto generated in May 2018. We set Θ < 15° and δ < 5 m to reduce the number of projection images for each orthophoto. These threshold values are subject to different cases, but for applications involving buildings in a community, they are likely a good choice. A total of 98 images were automatically chosen for reconstructing all four façades. A representative result showing an orthophoto of a façade plane is provided in Figure 9b. Some distortions and discontinued scenes were observed at the edges, but these were outside of façade area, roof, and ground. Thus, they did not disrupt the graffiti detection process because those distortions were outside of the façade.

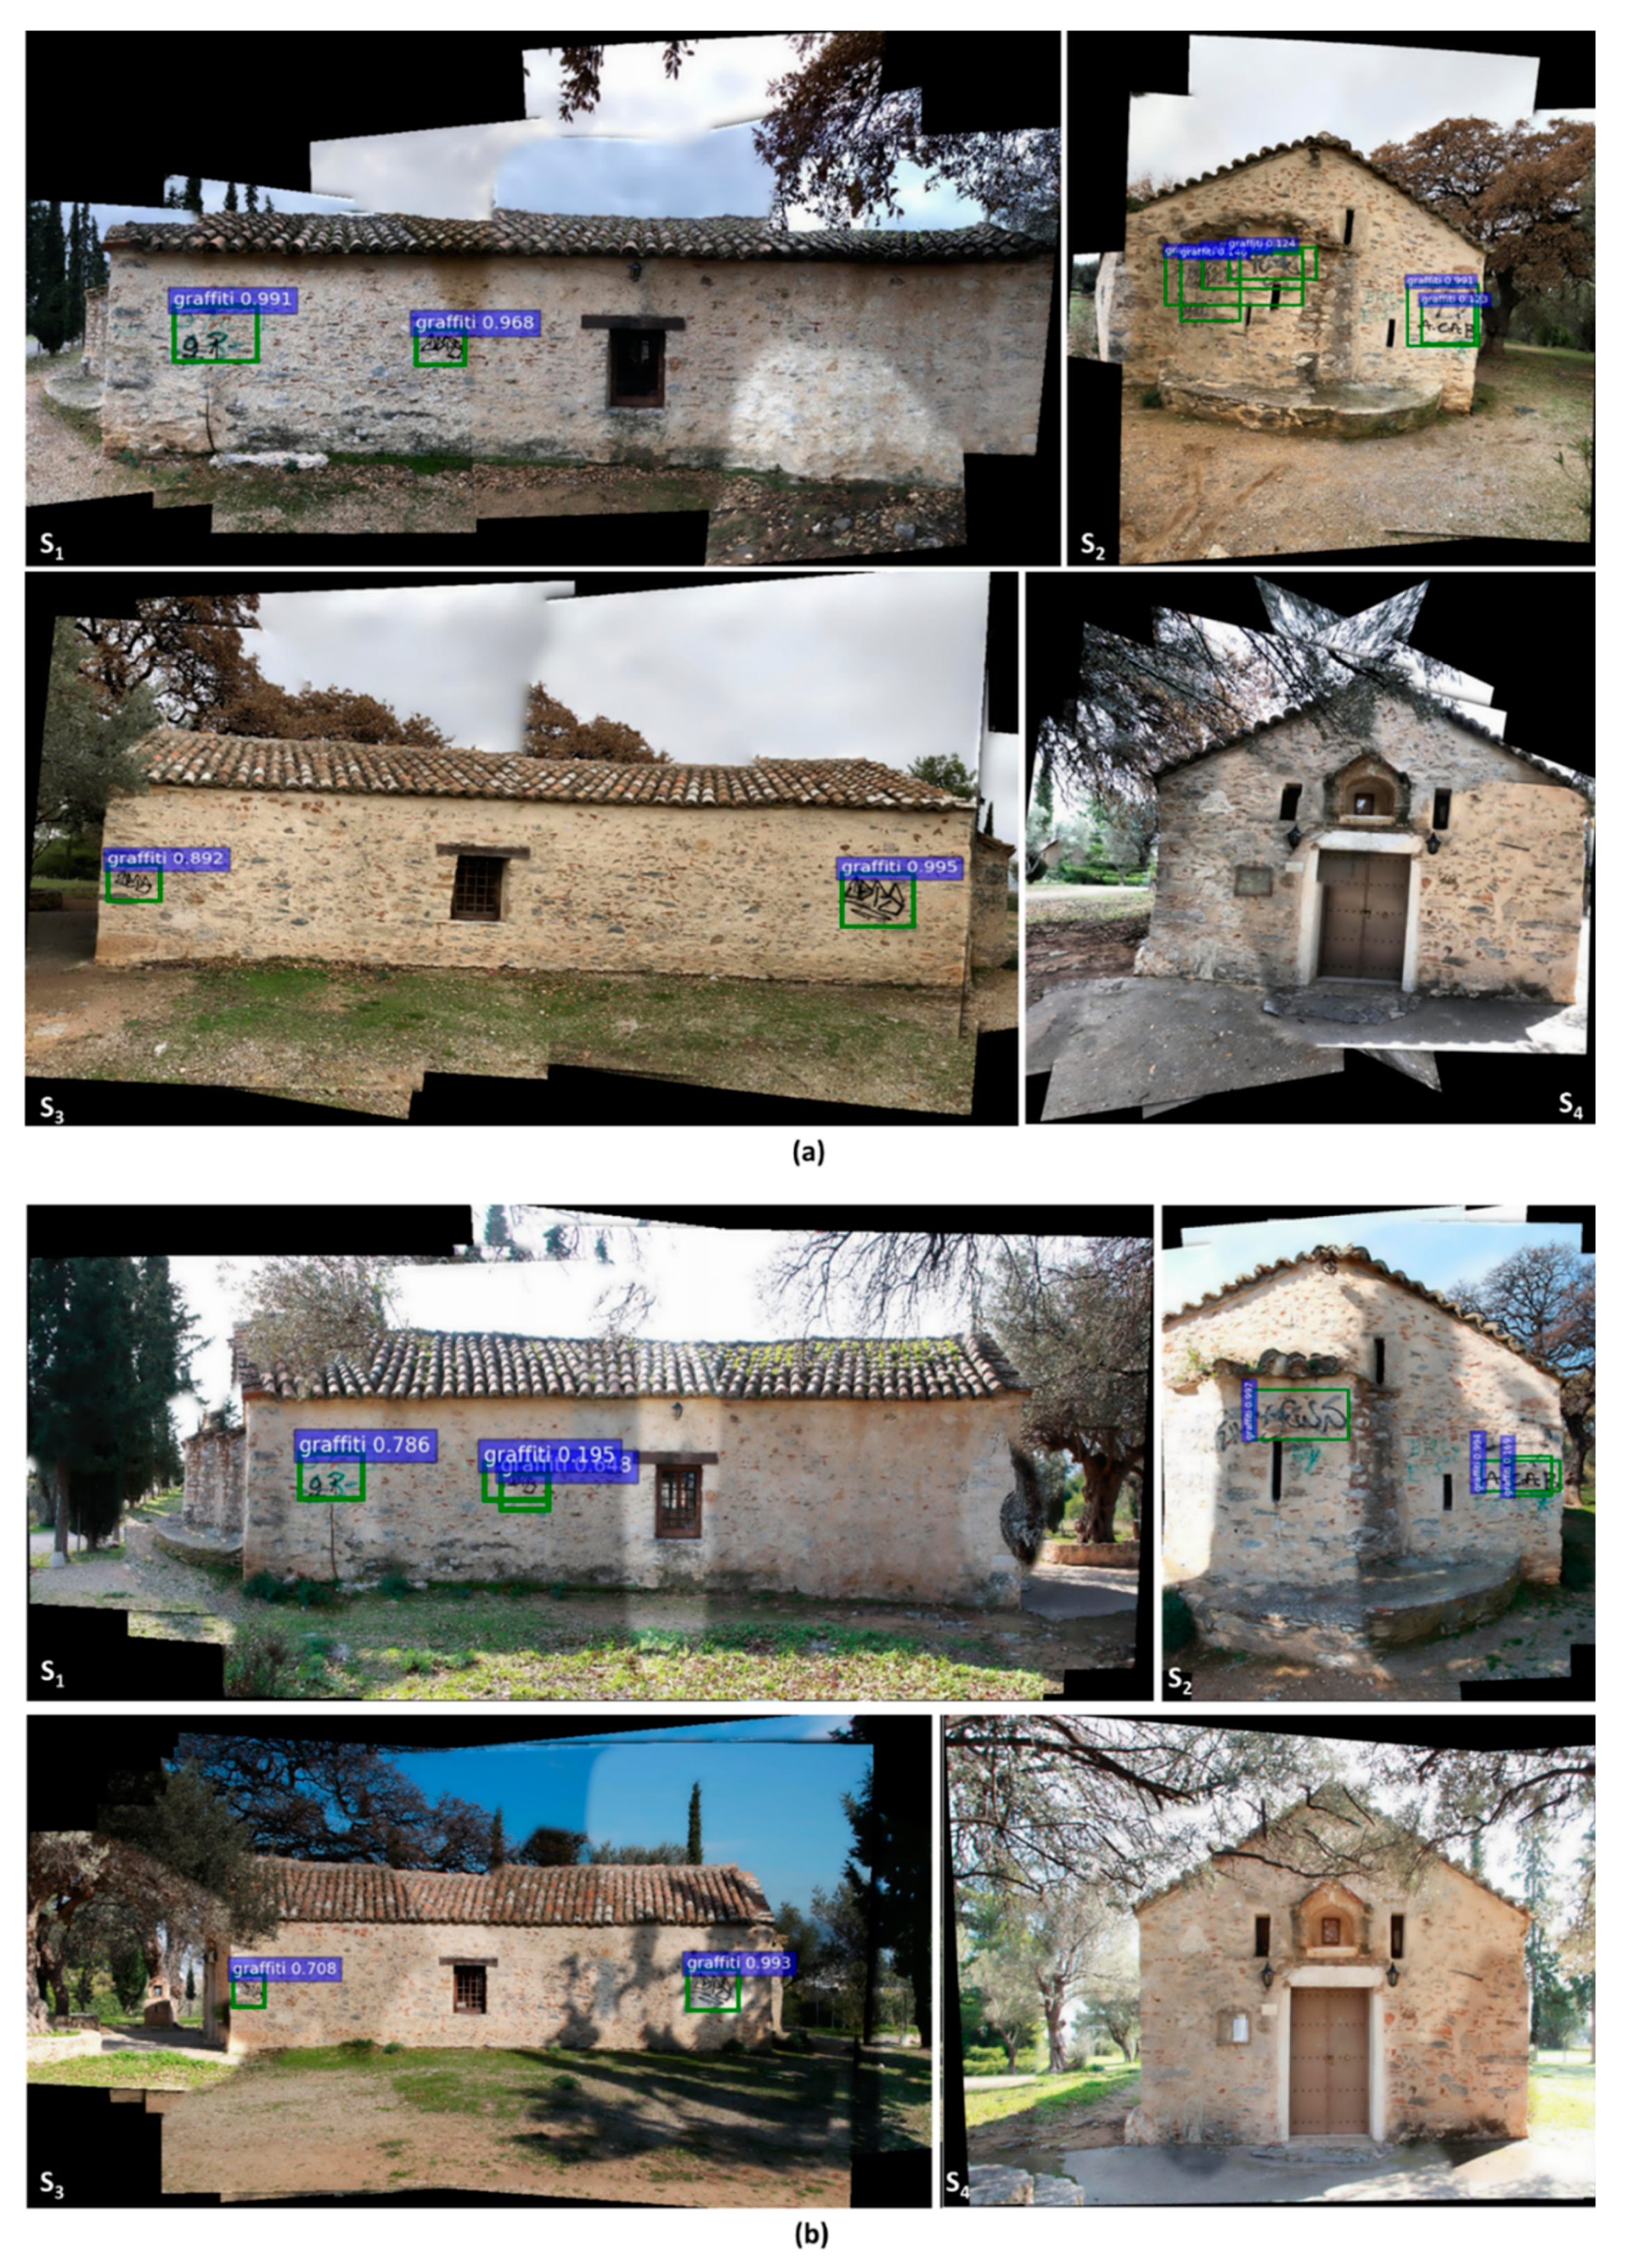
3.4. Graffiti Detection on Orthophotos

After generating orthophotos from all four façade planes of the TOC, the graffiti detector we trained in Section 3.1 was then applied to each orthophoto. The results of the graffiti-detection process on each façade plane on the Church of Agios Nikolaos are shown in Figure 10. The detected graffiti are marked with green rectangular bounding boxes. All graffiti presented on the façades were successfully identified. Since the individual images were collected at various locations and viewpoints, causing significant brightness or exposure discrepancies, the lighting differences over the region of the orthophoto were not fully compensated. In addition, the overall quality of the orthophotos was inconsistent because they were highly dependent on the quality of the input images. Nevertheless, graffiti markings were still observed and identified by the graffiti detector. We conducted data collection in two different time windows. We noticed that all graffiti markings were successfully detected on each of orthophotos, and readily knew that there was no addition or removal. This demonstrated that the trained detector was robust enough, and was insensitive to the environmental variation in the background scene. The graffiti distribution was shown in a single view, which will also assist in assessing the overall exterior condition and directing maintenance teams to the proper location. The processing for this step took an average of 1.4 min for each of the four orthophotos.

4. Conclusions

This work successfully demonstrated an automated graffiti-detection technique for cultural heritage buildings. Data from public sources was combined and used to detect, localize, and quantify graffiti on key buildings in a community. The required visual data can be collected by ordinary citizens periodically to enable more efficient lifecycle assessment of historical structures. The output of the method was the location and size of each graffiti marking, indicated by a bounding box provided on the orthophoto. As a part of this process, a robust graffiti detector was also trained here using images of graffiti collected from real-world structures, and the training data were shared publicly for other researchers to access [32]. The feasibility of the overall method was demonstrated with a historical structure in the European community: the Church of Agios Nikolaos, located in Kantza, Greece. Images were collected in two different time windows and in weather conditions to demonstrate the capability of the technique for the use of lifecycle assessment.
To the authors’ best knowledge, no vision-based graffiti detection and quantification technique exists in the literature or industry. A completely automated technique was fully demonstrated here through a real-world case study. Some practical challenges do still exist in the technique that should be mentioned. The method is not applicable to cases in which the entire façade is contaminated with graffiti, or cases in which a significant curvature exists in the outer walls of the building being assessed, which creates distorted orthophoto generation.

5. Future Work

There are improvements to be made during the orthophoto generation in order to make it more robust and add the capability to assess structures with more irregular shapes. The step of façade-plane estimation benefited from the already rectangular and smooth surfaces of the structure used during experimentation. If the structure had a significant curvature (such as a toroidal shape), restraining the number of surfaces to be estimated and identifying planes tangent to the 3D point cloud would be required.

Author Contributions

Conceptualization, J.C.; Methodology, J.C., L.T., and C.M.Y.; Software, R.O., J.C. and C.M.Y.; Validation, N.-J.J., S.J.D. and C.M.Y.; Formal Analysis, R.O., S.J.D. and C.M.Y.; Investigation, J.C.; Resources, L.T., P.K., and P.C.; Data Curation, R.O., J.C., A.L., and X.L.; Writing—Original Draft Preparation, J.C.; Writing—Review and Editing, S.J.D. and P.C.; Visualization, J.C.; Supervision, S.J.D. and P.C. All authors have read and agreed to the published version of the manuscript.

Funding

This work supported by the Civil, Mechanical and Manufacturing Innovation (CMMI) Program of the National Science Foundation (Grant No. NSF 1645047), the European Union’s Horizon 2020 research program under the STORM project (Grant No. 700191), and the National Research Foundation of Korea funded by the Korean government (MSIT) (Grant No. NRF-2021R1G1A1012298).

Institutional Review Board Statement

Not applicable.

Informed Consent Statement

Not applicable.

Acknowledgments

We would like to thank the Ephorate of Antiquities of Eastern Attica for giving us permission to use the photos of the Church of Agios Nikolaos in order to complete our study and use case, and the NVIDIA Corporation for the donation of a high-end GPU board. Finally, the authors would like to extend their appreciation to Alexandros Tzitamidis for annotating the graffiti-detection data set.

Conflicts of Interest

The authors declare no conflict of interest.

References

  1. Home. Oxford English Dictionary. Available online: https://www.oed.com/ (accessed on 25 February 2022).
  2. Holocaust Monument in Central Athens Vandalized with Graffiti. Naftemporiki.gr. 2017. Available online: https://www.naftemporiki.gr/story/1300966/holocaust-monument-in-central-athens-vandalized-with-graffiti (accessed on 25 February 2022).
  3. Armstrong, J.S. The Graffiti Problem. University Library of Munich, Germany, 0412035. 2004. Available online: https://ideas.repec.org/p/wpa/wuwpgt/0412035.html (accessed on 25 February 2022).
  4. Sanmartín, P.; Cappitelli, F.; Mitchell, R. Current methods of graffiti removal: A review. Const. Build. Mater. 2014, 30, 363–374. [Google Scholar] [CrossRef]
  5. White, R. Graffiti, Crime Prevention & Cultural Space. Curr. Issues Crim. Justice 2001, 12, 253–268. [Google Scholar] [CrossRef]
  6. Halsey, M.; Young, A. The Meanings of Graffiti and Municipal Administration. Aust. New Zeeland J. Criminol. 2002, 35, 165–186. [Google Scholar] [CrossRef]
  7. Macdonald, N. The Graffiti Subculture: Youth, Masculinity, and Identity in London and New York; Palgrave: New York, NY, USA, 2001. [Google Scholar]
  8. Ferrell, J. Crimes of Style: Urban Graffiti and the Politics of Criminality; Garland: New York, NY, USA, 1993. [Google Scholar]
  9. Ley, D.; Cybriwsky, R. Urban Graffiti as Territorial Markers. Ann. Assoc. Am. Geogr. 1974, 64, 491–505. [Google Scholar] [CrossRef]
  10. Spencer, B.F.; Hoskere, V.; Narazaki, Y. Advances in Computer Vision-Based Civil Infrastructure Inspection and Monitoring. Engineering 2019, 5, 199–222. [Google Scholar] [CrossRef]
  11. Jahanshahi, M.R.; Masri, S.F.; Padgett, C.W.; Sukhatme, G.S. An innovative methodology for detection and quantification of cracks through incorporation of depth perception. Mach. Vis. Appl. 2013, 24, 227–241. [Google Scholar] [CrossRef]
  12. Ham, Y.; Han, K.K.; Lin, J.J.; Golparvar-Fard, M. Visual monitoring of civil infrastructure systems via camera-equipped Unmanned Aerial Vehicles (UAVs): A review of related works. Vis. Eng. 2016, 4, 118–261. [Google Scholar] [CrossRef] [Green Version]
  13. Liu, X.; Dyke, S.J.; Yeum, C.M.; Bilionis, I.; Lenjani, A.; Choi, J. Automated Indoor Image Localization to Support a Post-Event Building Assessment. Sensors 2020, 20, 1610. [Google Scholar] [CrossRef] [Green Version]
  14. Narazaki, Y.; Hoskere, V.; Eick, B.A.; Smith, M.D.; Spencer, B.F. Vision-based dense displacement and strain estimation of miter gates with the performance evaluation using physics-based graphics models. Smart Struct. Syst. 2019, 24, 709–721. [Google Scholar] [CrossRef]
  15. Kong, X.; Li, J. Vision-Based Fatigue Crack Detection of Steel Structures Using Video Feature Tracking. Comput. Aided Civ. Infrastruct. Eng. 2018, 33, 783–799. [Google Scholar] [CrossRef]
  16. Gong, J.; Azambuja, M. Visualizing Construction Supply Chains with Google Cloud Computing Tools. In Proceedings of the International Conference on Sustainable Design, Engineering, and Construction, ICSDEC, Fort Worth, TX, USA, 7–9 November 2012; pp. 671–678. [Google Scholar] [CrossRef]
  17. Choi, J.; Park, J.A.; Dyke, S.J.; Yeum, C.M.; Liu, X.; Lenjani, A.; Bilionis, I. Autonomous image localization for visual inspection of civil infrastructure. Smart Mater. Struct. 2017, 26, 035051. [Google Scholar] [CrossRef]
  18. JChoi, J.; Park, J.A.; Dyke, S.J.; Yeum, C.M.; Liu, X.; Lenjani, A.; Bilionis, I. Similarity learning to enable building searches in post-event image data. Comput. Aided Civ. Inf. 2022, 37, 261–275. [Google Scholar] [CrossRef]
  19. Farrar, C.R.; Worden, K. Structural Health Monitoring: A Machine Learning Perspective; John Wiley & Sons: Hoboken, NJ, USA, 2012. [Google Scholar]
  20. Yeum, C.M.; Choi, J.; Dyke, S.J. Automated region-of-interest localization and classification for vision-based visual assessment of civil infrastructure. Struct. Health Monit. 2019, 18, 675–689. [Google Scholar] [CrossRef]
  21. Lenjani, A.; Dyke, S.J.; Bilionis, I.; Yeum, C.M.; Kamiya, K.; Choi, J.; Liu, X.; Chowdhury, A.G. Towards fully automated post-event data collection and analysis: Pre-event and post-event information fusion. Eng. Struct. 2020, 208, 109884. [Google Scholar] [CrossRef] [Green Version]
  22. Wu, R.; Singla, A.; Jahanshahi, M.R.; Bertino, E.; Ko, B.J.; Verma, D. Pruning deep convolutional neural networks for efficient edge computing in condition assessment of infrastructures. Comput. Aided Civ. Infrastruct. Eng. 2019, 34, 774–789. [Google Scholar] [CrossRef]
  23. Koch, C.; Paal, S.; Rashidi, A.; Zhu, Z.; König, M.; Brilakis, I. Achievements and challenges in machine vision-based inspection of large concrete structures. Adv. Struct. Eng. 2014, 17, 303–318. [Google Scholar] [CrossRef]
  24. Mondal, T.G.; Jahanshahi, M.R.; Wu, R.; Wu, Z.Y. Deep learning-based multi-class damage detection for autonomous post-disaster reconnaissance. Struct. Control Health Monit. 2020, 27, e2507. [Google Scholar] [CrossRef]
  25. Kraus, K. Photogrammetry: Geometry from Images and Laser Scans; Walter de Gruyter: Berlin/Heidelberg, Germany, 2011. [Google Scholar]
  26. Snavely, N.; Seitz, S.M.; Szeliski, R. Modeling the World from Internet Photo Collections. Int. J. Comput. Vis. 2008, 80, 189–210. [Google Scholar] [CrossRef] [Green Version]
  27. Hartley, R.; Zisserman, A. Multiple View Geometry in Computer Vision; Cambridge University Press: Cambridge, UK, 2003. [Google Scholar]
  28. Westoby, M.J.; Brasington, J.; Glasser, N.F.; Hambrey, M.J.; Reynolds, J.M. Structure-from-Motion’ photogrammetry: A low-cost, effective tool for geoscience applications. Geomorphology 2012, 179, 300–314. [Google Scholar] [CrossRef] [Green Version]
  29. Allene, C.; Pons, J.-P.; Keriven, R. Seamless Image-Based Texture Atlases Using Multi-Band Blending. In Proceedings of the 2008 19th International Conference on Pattern Recognition, Tampa, FL, USA, 8–11 December 2008; pp. 1–4. [Google Scholar] [CrossRef]
  30. ΒΥΖAΝΤΙΝA ΜΝHΜΕΙA AΤΤΙΚHΣ. Available online: http://byzantineattica.eie.gr/byzantineattica/ (accessed on 25 February 2022).
  31. Ren, S.; He, K.; Girshick, R.; Sun, J. Faster R-CNN: Towards Real-Time Object Detection with Region Proposal Networks. In Advances in Neural Information Processing Systems 28; Cortes, C., Lawrence, N.D., Lee, D.D., Sugiyama, M., Garnett, R., Eds.; Curran Associates, Inc.: La Jolla, CA, USA, 2015; pp. 91–99. Available online: http://papers.nips.cc/paper/5638-faster-r-cnn-towards-real-time-object-detection-with-region-proposal-networks.pdf (accessed on 25 February 2022).
  32. Patrikakis, C.; Kasnesis, P.; Toumanidis, L.; Tzitamidis, A. zenodo.org; STORM Graffiti/Tagging Detection Dataset; CERN: Meyrin, Switzerland, 2019. [Google Scholar] [CrossRef]
  33. Uijlings, J.R.R.; van de Sande, K.E.A.; Gevers, T.; Smeulders, A.W.M. Selective Search for Object Recognition. Int. J. Comput. Vis. 2013, 104, 154–171. [Google Scholar] [CrossRef] [Green Version]
  34. Girshick, R.; Donahue, J.; Darrell, T.; Malik, J. Region-Based Convolutional Networks for Accurate Object Detection and Segmentation. IEEE Trans. Pattern Anal. Mach. Intell. 2016, 38, 142–158. [Google Scholar] [CrossRef] [PubMed]
  35. Girshick, R. Fast R-CNN. 2015. Available online: http://openaccess.thecvf.com/content_iccv_2015/html/Girshick_Fast_R-CNN_ICCV_2015_paper.html (accessed on 25 February 2022).
  36. Gkioxari, G.; Johnson, J.; Malik, J. Mesh r-cnn. In Proceedings of the IEEE/CVF International Conference on Computer Vision, Seoul, Korea, 27 October–2 November 2019; pp. 9785–9795. [Google Scholar]
  37. Hinton, G.E.; Salakhutdinov, R.R. Replicated Softmax: An Undirected Topic Model. In Advances in Neural Information Processing Systems 22; Bengio, Y., Schuurmans, D., Lafferty, J.D., Williams, C.K.I., Culotta, A., Eds.; Curran Associates, Inc.: Nice, France, 2009; pp. 1607–1614. Available online: http://papers.nips.cc/paper/3856-replicated-softmax-an-undirected-topic-model.pdf (accessed on 25 February 2022).
  38. Liu, W.; Anguelov, D.; Erhan, D.; Szegedy, C.; Reed, S.; Fu, C.Y.; Berg, A.C. SSD: Single Shot MultiBox Detector. In Proceedings of the Computer Vision—ECCV 2016, Cham, Switzerland, 11–14 October 2016; pp. 21–37. [Google Scholar] [CrossRef] [Green Version]
  39. Redmon, J.; Farhadi, A. YOLO9000: Better, Faster, Stronger. 2017. Available online: http://openaccess.thecvf.com/content_cvpr_2017/html/Redmon_YOLO9000_Better_Faster_CVPR_2017_paper.html (accessed on 25 February 2022).
  40. Saxton, G.D.; Oh, O.; Kishore, R. Rules of Crowdsourcing: Models, Issues, and Systems of Control. Inf. Syst. Manag. 2013, 30, 2–20. [Google Scholar] [CrossRef]
  41. Follett, R.; Strezov, V. An Analysis of Citizen Science Based Research: Usage and Publication Patterns. PLoS ONE 2015, 10, e0143687. [Google Scholar] [CrossRef] [Green Version]
  42. Choi, J.; Dyke, S.J. CrowdLIM: Crowdsourcing to enable lifecycle infrastructure management. Comput. Ind. 2020, 115, 103185. [Google Scholar] [CrossRef]
  43. Agisoft Metashape. Available online: https://www.agisoft.com/ (accessed on 25 February 2022).
  44. Wu, C. Critical Configurations for Radial Distortion Self-Calibration. 2014, p. 25. Available online: http://openaccess.thecvf.com/content_cvpr_2014/html/Wu_Critical_Configurations_For_2014_CVPR_paper.html (accessed on 25 February 2022).
  45. Choi, J.; Yeum, C.M.; Dyke, S.J.; Jahanshahi, M.R. Computer-Aided Approach for Rapid Post-Event Visual Evaluation of a Building Façade. Sensors 2018, 18, 3017. [Google Scholar] [CrossRef] [PubMed] [Green Version]
  46. Torr, P.H.S.; Zisserman, A. MLESAC: A New Robust Estimator with Application to Estimating Image Geometry. Comput. Vis. Image Underst. 2000, 78, 138–156. [Google Scholar] [CrossRef] [Green Version]
  47. TensorFlow. Available online: https://www.tensorflow.org/?hl=ko (accessed on 25 February 2022).
  48. Chen, X.; Gupta, A. An Implementation of Faster RCNN with Study for Region Sampling. arXiv 2017, arXiv:170202138 Cs. Available online: http://arxiv.org/abs/1702.02138 (accessed on 25 February 2022).
  49. Toumanidis, L.; Bocaj, E.; Kasnesis, P.; Patrikakis, C.Z. Supporting Cultural Heritage Preservation Through Game-Based Crowdsourcing. In Strategic Innovative Marketing and Tourism; Springer: Cham, Switzerland, 2019; pp. 989–997. [Google Scholar] [CrossRef]
  50. Kasnesis, P.; Kogias, D.G.; Toumanidis, L.; Xevgenis, M.G.; Patrikakis, C.Z.; Giunta, G.; Calsi, G.L. An IoE Architecture for the Preservation of the Cultural Heritage: The STORM Use Case. Harnessing the Internet of Everything (IoE) for Accelerated Innovation Opportunities. 2019. Available online: www.igi-global.com/chapter/an-ioe-architecture-for-the-preservation-of-the-cultural-heritage/221288 (accessed on 25 February 2022).
  51. VisualSFM: A Visual Structure from Motion System. Available online: http://ccwu.me/vsfm/ (accessed on 25 February 2022).
  52. MATLAB—MathWorks—MATLAB & Simulink. Available online: https://www.mathworks.com/products/matlab.html (accessed on 25 February 2022).
  53. Kuzmin, Y.P.; Korytnik, S.A.; Long, O. Polygon-based true orthophoto generation. Int. Arch. Photogramm. Remote Sens. Spat. Inf. Sci. 2004, 35, 529–531. [Google Scholar]
Figure 1. Vandalism of the Holocaust monument in Athens, Greece, in December 2017.
Applsci 12 02983 g001
Figure 2. Overview of the technical approach. Prestep: develop a robust graffiti detector to exploit a graffiti database from STORM using Faster R-CNN; Step 1: collect images of target objects in a community (TOCs) periodically from ordinary citizens; Step 2: generate an orthophoto of each façade of a TOC by stitching and blending the collected images; Step 3: graffiti detection on orthophotos, including location and size of each graffiti.
Applsci 12 02983 g002
Figure 3. Faster R-CNN is a unified network of region proposals and key feature maps. This algorithm was used in this work to construct a robust graffiti detector.
Applsci 12 02983 g003
Figure 4. Several high-resolution façade images (orthophotos) generated for each TOC by automatically detecting major planes from a point cloud generated from collected images.
Applsci 12 02983 g004
Figure 5. The robust graffiti detector was applied to each of the orthophotos, providing an overall presence of graffiti, including the location and size of each mark.
Applsci 12 02983 g005
Figure 6. Graffiti dataset provided by the STORM project and used for training the graffiti detector: (a) sample images from the database of graffiti scenes in a community; and (b) samples of graffiti markings in our ground-truth dataset identified by three individuals on our team with cross-validation.
Applsci 12 02983 g006
Figure 7. Example results with test images on which multiple complicated graffiti markings existed within the scene image.
Applsci 12 02983 g007
Figure 8. (a) The Church of Agios Nikolaos in Kantza, Greece, the historical structure used in this case study; and (b) samples of existing graffiti markings present.
Applsci 12 02983 g008
Figure 9. Steps in the orthophoto generation process for the Church of Agios Nikolaos: (a) the point cloud generated and its four major façade planes; and (b) a representative orthophoto generated from S 1 .
Applsci 12 02983 g009
Figure 10. Graffiti-detection results from the orthophotos generated for the four façades of the Church of Agios Nikolaos based on data collected in (a) May 2018 and (b) January 2019.
Applsci 12 02983 g010
Table 1. Confusion matrix for calculating the accuracy of the trained R-CNN.
Predicted Class
PositiveNegative
Actual ClassPositive48283
Negative61574
Publisher’s Note: MDPI stays neutral with regard to jurisdictional claims in published maps and institutional affiliations.

